Article

Power Hardware-in-the-Loop Test of a Low-Cost Synthetic Inertia Controller for Battery Energy Storage System

Department of Electrical and Information Engineering, Politecnico di Bari, Via E. Orabona, 4, 70125 Bari, Italy
*
Author to whom correspondence should be addressed.
Energies 2022, 15(9), 3016; https://doi.org/10.3390/en15093016
Submission received: 31 March 2022 / Revised: 15 April 2022 / Accepted: 18 April 2022 / Published: 20 April 2022

Abstract

:
In the last years, the overall system inertia is decreasing due to the growing amount of energy resources connected to the grid by means of power inverters. As a consequence, reduced levels of inertia can affect the power system stability since slight variations of power generation or load may cause wider frequency deviations and higher rate of change of frequency (RoCoF) values. To mitigate this trouble, end-user distributed energy resources (DERs) interfaced through grid-following inverters, if opportunely controlled, can provide additional inertia. This paper investigated the possibility of improving the control law implemented by a low-cost controller on remotely controllable legacy DERs to provide synthetic inertia (SI) contributions. With this aim, power hardware-in-the-loop simulations were carried out to test the capability of the proposed controller to autonomously measure frequency and RoCoF and provide SI actions by controlling an actual battery energy storage system.

1. Introduction

The electric power system is facing new technical challenges due to the progressive integration of alternative energy sources in transmission and distribution networks. Massive efforts have been made in Europe to promote the employment of renewable energy sources (RES) and further steps will be taken to reach the energy transition targets of 2030 [1]. Nevertheless, the replacement of conventional power plants with RES is affecting the power system stability. Resources such as photovoltaics and wind turbines are interfaced with the grid by means of power converters, and are therefore not equipped with rotating masses that can release or absorb mechanical energy. As a result, high penetration levels of RES will reduce the total system inertia (TSI), and slight variations of generation or demand will cause wider frequency deviations, affecting power system security [2]. With reduced TSI, severe frequency fluctuations can result in undesired tripping of protections or load/generation units disconnection, or even instability [2,3].
Therefore, in the next years, new countermeasures must be adopted to limit the values of frequency nadir and rate of change of frequency (RoCoF) following a disturbance, in order to preserve power system safety and stability [4]. This is especially true in the case of smaller electrical systems such as isolated microgrids or non-synchronous islands, which are often interconnected to the mainland only through high-voltage direct current connections (such as, for example, in the case of Northern Europe [3]). Theoretically, as observed in [5], additional synchronous capacitors may be installed to improve the total system inertia. However, since these systems could result as expensive and complicated to be implemented, alternative solutions based on already installed power inverters, able to provide provide virtual or synthetic inertia (SI) by emulating the inertial behavior of synchronous generators, have been proposed.
Recent developments have shown that prosumers and active end-users at the distribution level are theoretically able to manage their own generation/load resources to provide ancillary services, such as congestion management, frequency restoration reserve [1,6], or inertia support to system operators. With this goal, an example of peer-to-peer cyberphysical infrastructure aimed at optimizing the inertial response of distributed energy resources (DERs) in an energy community was presented in [7]. The possibility to obtain distributed SI contributions by means of widespread distributed generation (DG) and DERs was also proposed in [8,9,10]. Even if storage systems are considered the best source to provide fast frequency control services [11,12,13,14], several studies have also demonstrated that is possible to generate SI by controlling domestic loads, such as refrigerators and boilers [15,16], or single-phase electric vehicles [17]. In this sense, the possibility to provide fast frequency regulation support by means of public LED lighting systems has been also investigated in [18].
Although the idea of using DERs for fast frequency regulation and SI support is generally accepted, few practical implementations can be found in the literature, and the actual controllability of legacy distributed resources was never addressed. In [19], the authors preliminarily investigated the possibility to develop a low-cost controller able to autonomously measure frequency and RoCoF, and implement an SI control law on the management system of remotely controllable DERs. Such a controller can enable SI response for any distributed component that possesses the ability to receive a remote control signal on a fast communication channel, without the need of reprogramming its management system or inverter.
In this paper, the studies on the low-cost SI controller have been further extended with more extensive power hardware-in-the-loop (PHIL) tests on the control of a battery energy storage system (BESS) as provider of system inertia support. The tests carried out in this paper were aimed to test the implementation of the SI controller on a single-board computer with more advanced computation capabilities than the one used in [19], which permitted to overcome some observed frequency measurement issues and improve the overall frequency response. Power hardware-in-the-loop tests allowed us to analyze the impacts that real-time fast frequency and RoCoF measurements have on the actual feasibility of SI control, and to tune control parameters such as RoCoF dead-band, frequency smoothing factor, and measurement reporting time. The performances of the real controller are compared to the PHIL simulation of an ideal controller with negligible RoCoF measurement error and reporting time. Moreover, several PHIL tests were aimed to address the issue of RoCoF error and study the impacts of a filtering stage in terms of stability and response delay. The possibility of increasing frequency measurement reporting time to reduce RoCoF error was also investigated, demonstrating how the controller has enough idle time to extend the number of controlled devices and control functions without affecting the efficacy of the control.

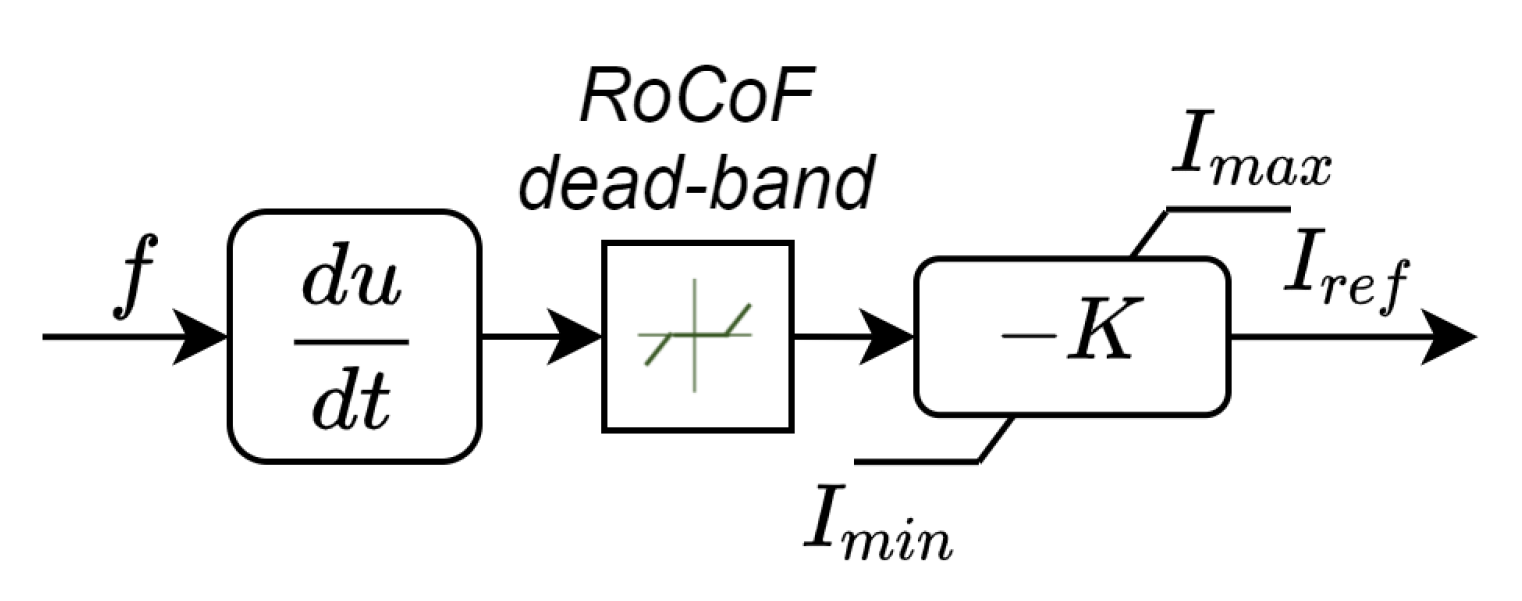
2. A Low-Cost Controller for Distributed Synthetic Inertia

In the coming years, ancillary services for power system management and stability will be also provided by distributed energy resources located at end-user level [20]. Several research projects investigated the capability of DERs such as battery energy storage systems, distributed generation, and loads to provide specific flexibility services, including synthetic inertia [11,21]. The provision of synthetic inertia, or fast frequency regulation, requires that a power device must be able to detect and respond to frequency variations very rapidly, in a few hundred milliseconds from the beginning of the transient event. As demonstrated in [11], a battery energy storage system represents one of the best candidates to provide frequency ancillary services thanks to its technical characteristics, such as long discharge time, high ramping rate, and high voltage/frequency control capability of its inverter.
The efficacy of SI control is severely affected by the quality of frequency and RoCoF measurements. The delays introduced by computation and communication processes can negatively affect the virtual inertia response, as shown in [13], even when power converter-based resources have the capability to adjust their power output within few cycles. Obtaining fast and reliable frequency and RoCoF measurements at field level represents a crucial aspect to be considered, since, unfortunately, speed and accuracy are two characteristics that tend to be mutually exclusive. In addition, the typical presence of unbalanced voltages, noise, and distortions in the distribution grid compromises the reliability of frequency measurements at end-user level. Authors in [22] even suggested that the assumption of having reliable RoCoF signals at distribution level may be unrealistic.
In this paper, the capability of a low-cost controller aimed to provide real-time synthetic inertia control of a BESS is assessed. The main characteristics of the proposed controller are that it must be autonomous (no external frequency/RoCoF signal should be needed) and based on the use of low-cost technology. More advanced frequency measurement can be provided using intelligent electronic device (IED) or phasor measurement unit (PMU) technologies, which are clearly not suitable for end-user applications due to their high costs [22,23]. The controller studied in this paper is instead based on a very low-cost architecture (below USD 100), being based on the use of an off-the-shelf single-board computer. In our implementation, a Raspberry Pi 4 Model B was used, but clearly any other similar processing unit could be adopted. This device has the following technical characteristics: 64-bit quad-core processor, 4 GB of RAM, dual-band 2.4/5.0 GHz wireless LAN, Bluetooth 5.0, Gigabit Ethernet, USB 3.0, power over Ethernet capability, and a standard 40-pin general-purpose input/output (GPIO) header.
The main purpose of this controller is to estimate RoCoF variations and generate SI control of a BESS, accordingly. SI control is obtained by changing the battery’s power output set-points with an additional control signal proportional to RoCoF variations. The SI control can happen even without having to reprogram the BMS, with particular advantages in the case of legacy devices, whose internal control schemes and logic, based on proprietary languages and codes, cannot be modified.
The proposed controller, whose scheme is shown in Figure 1, is able to acquire and process grid voltage signals, calculate both frequency and RoCoF, and communicate with other external devices through Ethernet (LAN), Bluetooth, and USB. The GPIO interface of the single-board computer is used to acquire the voltages. The GPIO works with digital signals only, and therefore a voltage transducer and an analog to digital converter (ADC) are required. The transducer used in out tests is a high-voltage differential probe, with a signal attenuation of 200×, coupled with a DC source used to add a 1.65 V offset in order to adapt the voltage waveform to the ADC-shield input voltage (i.e., 0–3.3 V). A 10-bit ADC, with a cost of about $10, equipped with serial peripheral interface (SPI) is also mounted on a prototype shield and connected to the GPIO’s pins.
The digital voltage signals are sampled by the single-board computer and are used to calculate the system frequency using the algorithm described in Section 4. This algorithm assumes that the acquired samples are equally spaced. In practical implementations on a single-board computer, this requirement is hardly satisfied without introducing idle times on samples or reducing the sampling rate. For this reason, a resampling process is performed to interpolate the acquired samples and obtain regularly-spaced input data (in the tested application the sampling time is 50 μs).
As a next step, the frequency values are employed to calculate the RoCoF and generate the corresponding SI control law. Nevertheless, as described in Section 4, due to the presence of noise and distortions on the acquired voltage signal, a filtering process is added between frequency and RoCoF calculation. This filtering stage is also recommended by ENTSO-E in a document discussing frequency and RoCoF measurement requirements [24]. As specified in this report, a wide range of different filter algorithms are available, such as Bessel, Butterworth, Chebyshev, elliptic, etc. However, these filters must be tuned in such a way to minimize the presence of noise without introducing excessive delays. An application case of frequency filtering is presented in [25], in which an appropriate feedback and feedforward filter was applied in order to remove noise as much as possible without affecting the RoCoF behavior. The algorithm is based on a combined version of “comb” filter, which acts by adding a delayed version of the signal to itself and causing constructive and destructive inference that can attenuate the specified frequency signal and its harmonics [26]. In this paper, a less sophisticated filter based on exponential moving average is employed in order to limit the necessary computational burden. This algorithm is able to reduce lags introduced from the average process by applying more weight to the recent samples than the older ones, and, therefore, results as particularly sensitive to recent signal changes [27]. According to the measured RoCoF values, the controller generates an SI control law and communicates it to the battery management system (BMS) of the BESS. In our tests, the control law is transferred to the BMS through the LAN and using Modbus TCP/IP protocol.

3. Experimental Tests of Synthetic Inertia Control by Means of a Battery Energy Storage System

In order to assess the performances of the proposed SI controller, power hardware-in-the-loop (PHIL) tests were performed by means of a microgrid facility located at LabZERO laboratory of Politecnico di Bari [28,29]. This facility permits to implement, in a real-time simulating environment, the interaction between the power system and real power devices installed in the microgrid.
The very first step of our analysis was to test the behavior of the 5 kVA LiFePO4 BESS currently installed in the LabZERO microgrid when it is controlled to provide synthetic inertia during a simulated frequency event. The controlled physical battery interacts with a power system model that reproduces, in real time, the electromechanical transient following a sudden power imbalance. This first PHIL simulation was used as a benchmark to compare, in the following tests, the SI response of the BESS when it is regulated by the proposed controller. In these additional PHIL tests, the SI control law sent to the BMS is directly generated by the Raspberry controller, which autonomously measures frequency and RoCoF, and controls the battery. These tests will also be aimed to demonstrate how, by moving the evaluation of the SI control at field level, it is possible to reduce the delays due to communication and control processes.
The power hardware-in-the-loop test bench is shown in Figure 2. The real-time simulator OPAL RT5600 (OPAL-RT Technologies, Montreal, QC, Canada) is used to simulate the electromechanical response of a generic power system, whereas the programmable power source Triphase PM15A30F60 (Triphase, Holsbeek, Belgium) is programmed to control the entire microgrid in grid-forming mode. Through synchronous communication, based on a fiber optics channel, the real-time frequency of the simulated system is sent by the real-time simulator (RTS) to the programmable source. This frequency value is imposed in real time on the actual microgrid and, therefore, on all its components. The frequency excursions following load/generation imbalances, which are controlled through the primary frequency regulation of the simulated system, are applied to the microgrid and to the BESS under study.

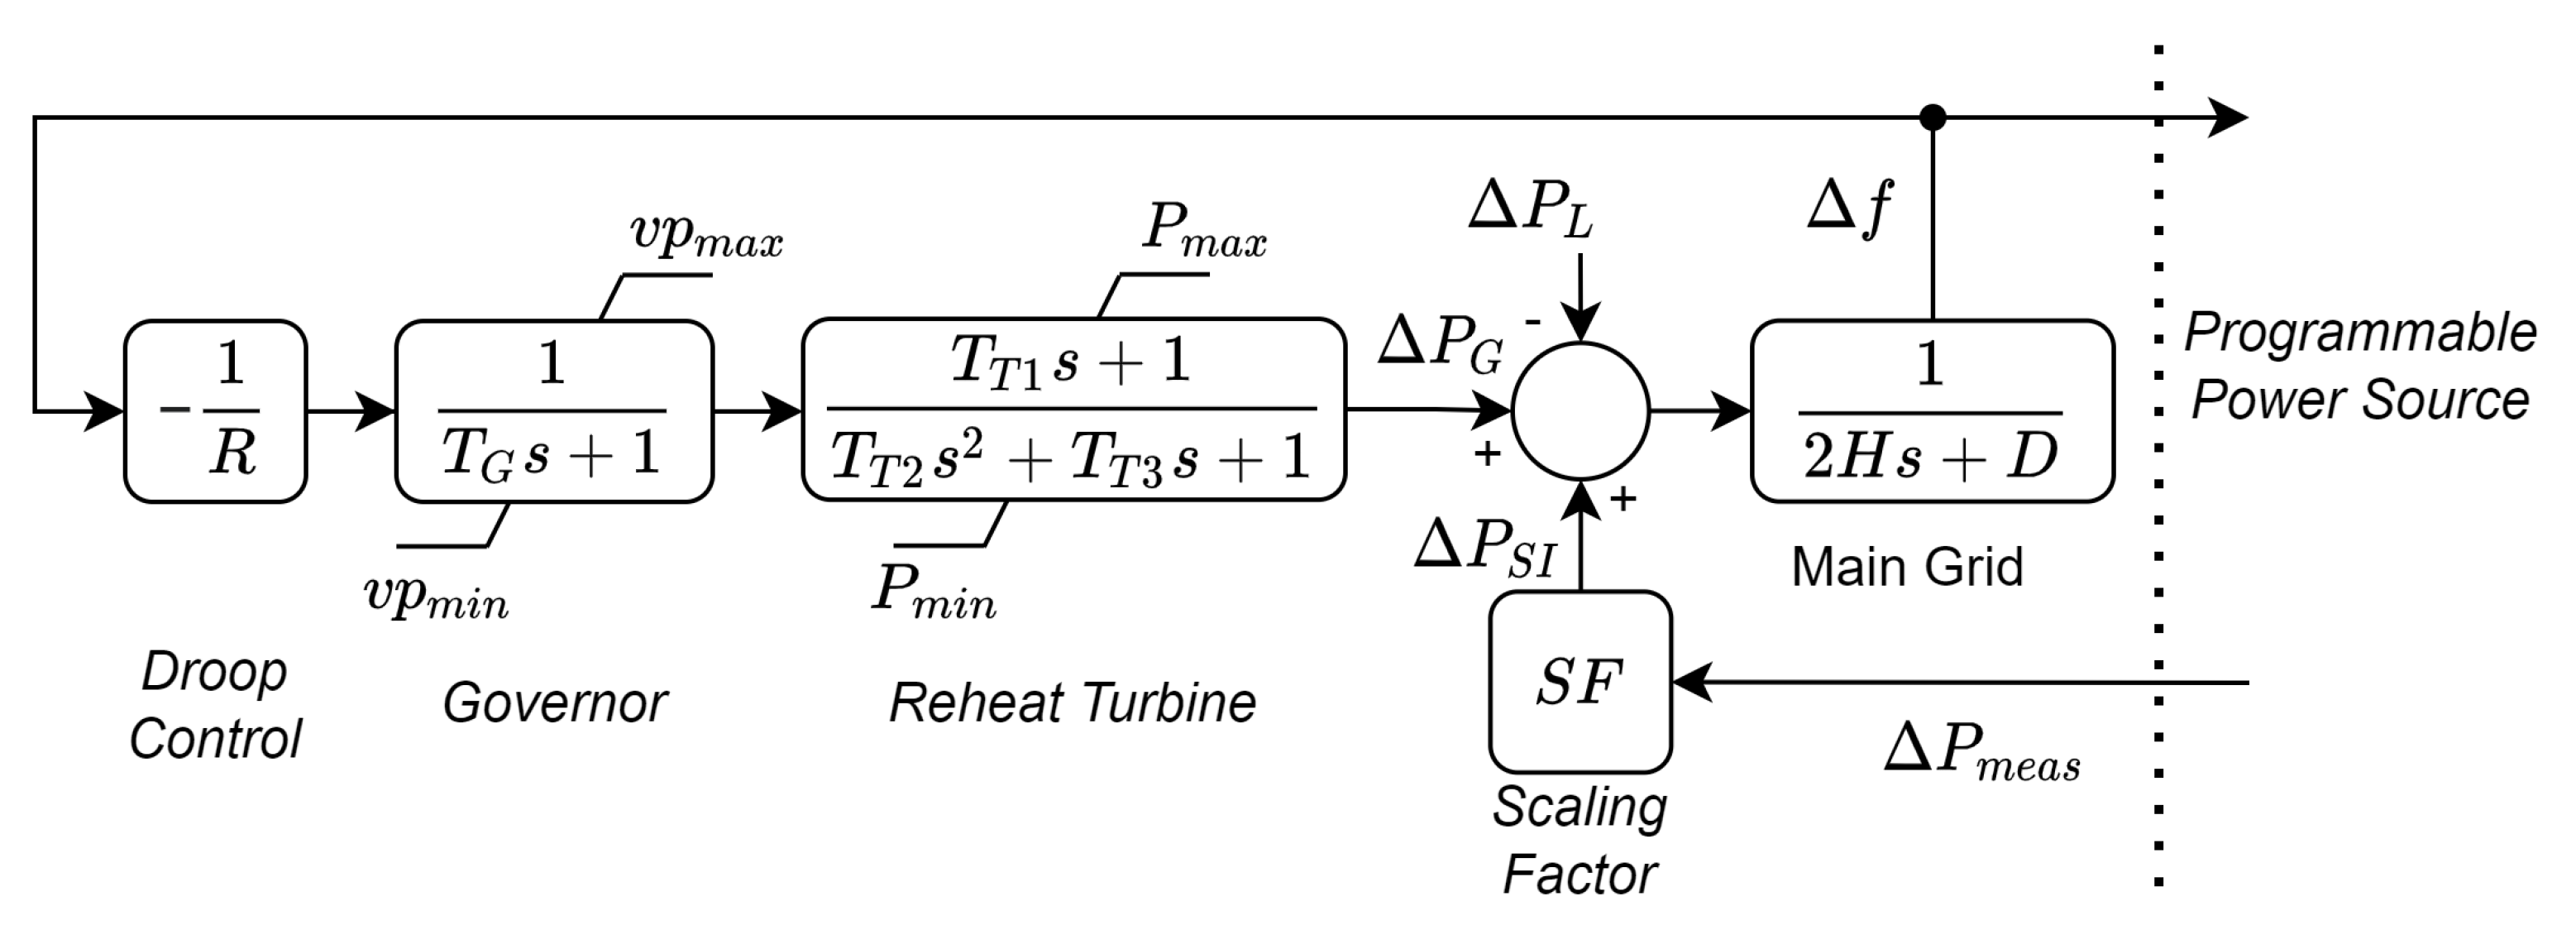
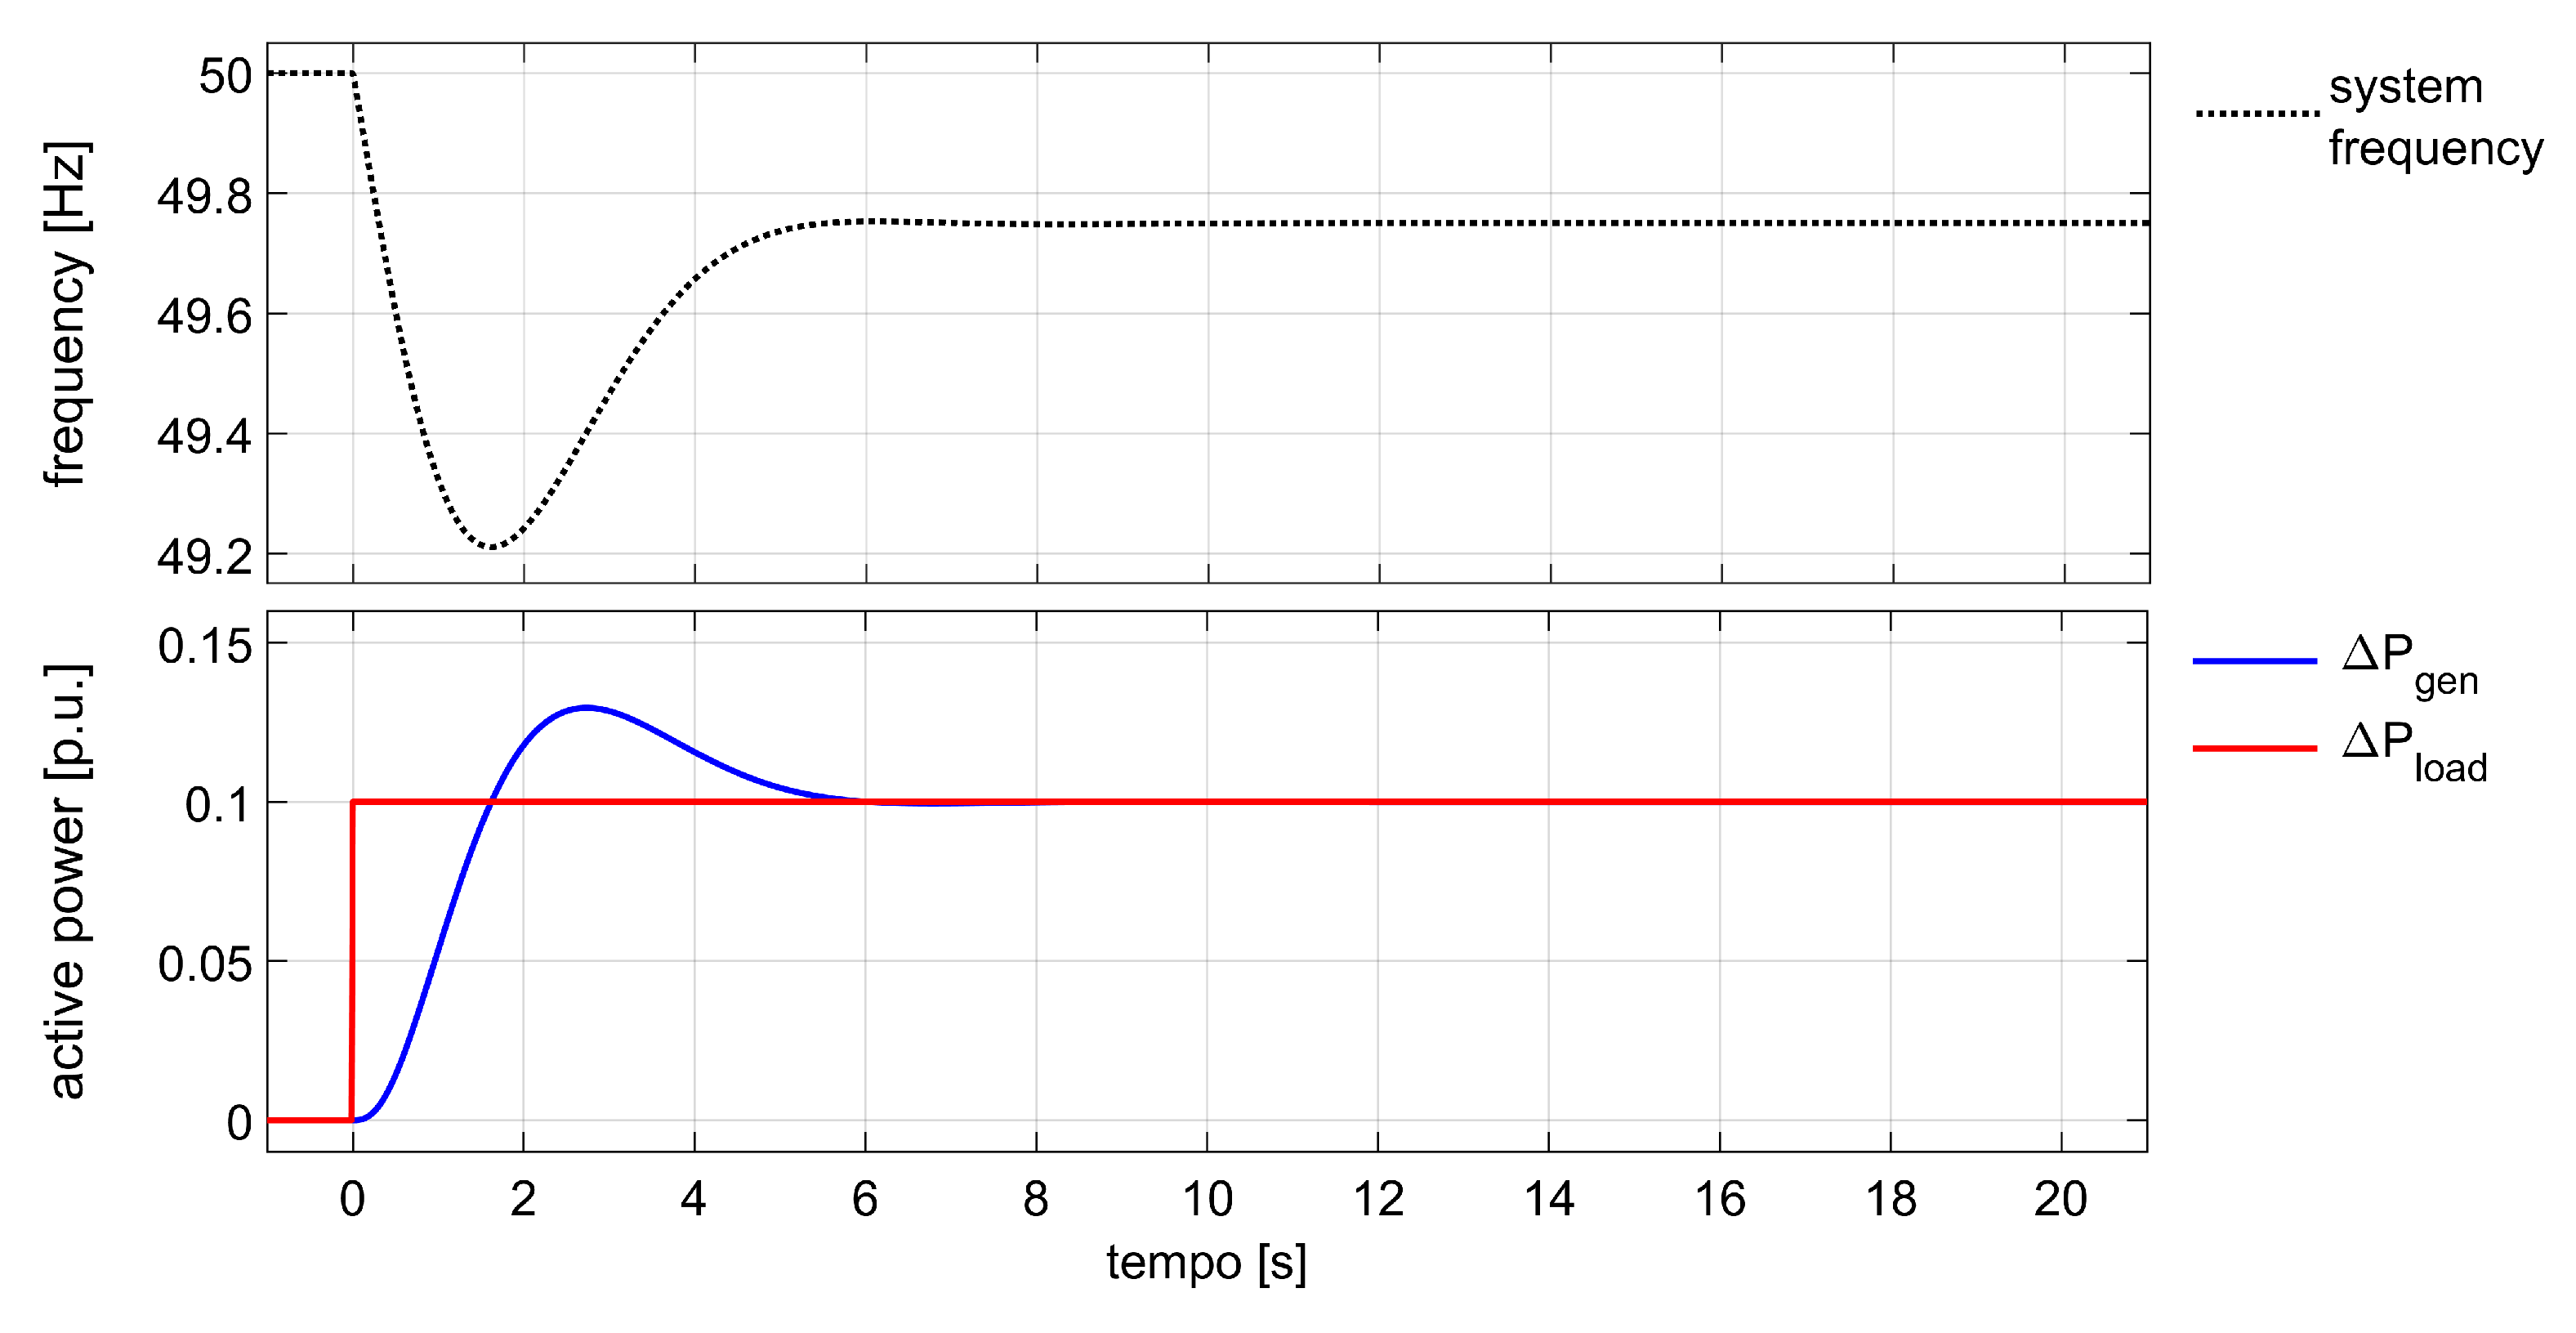
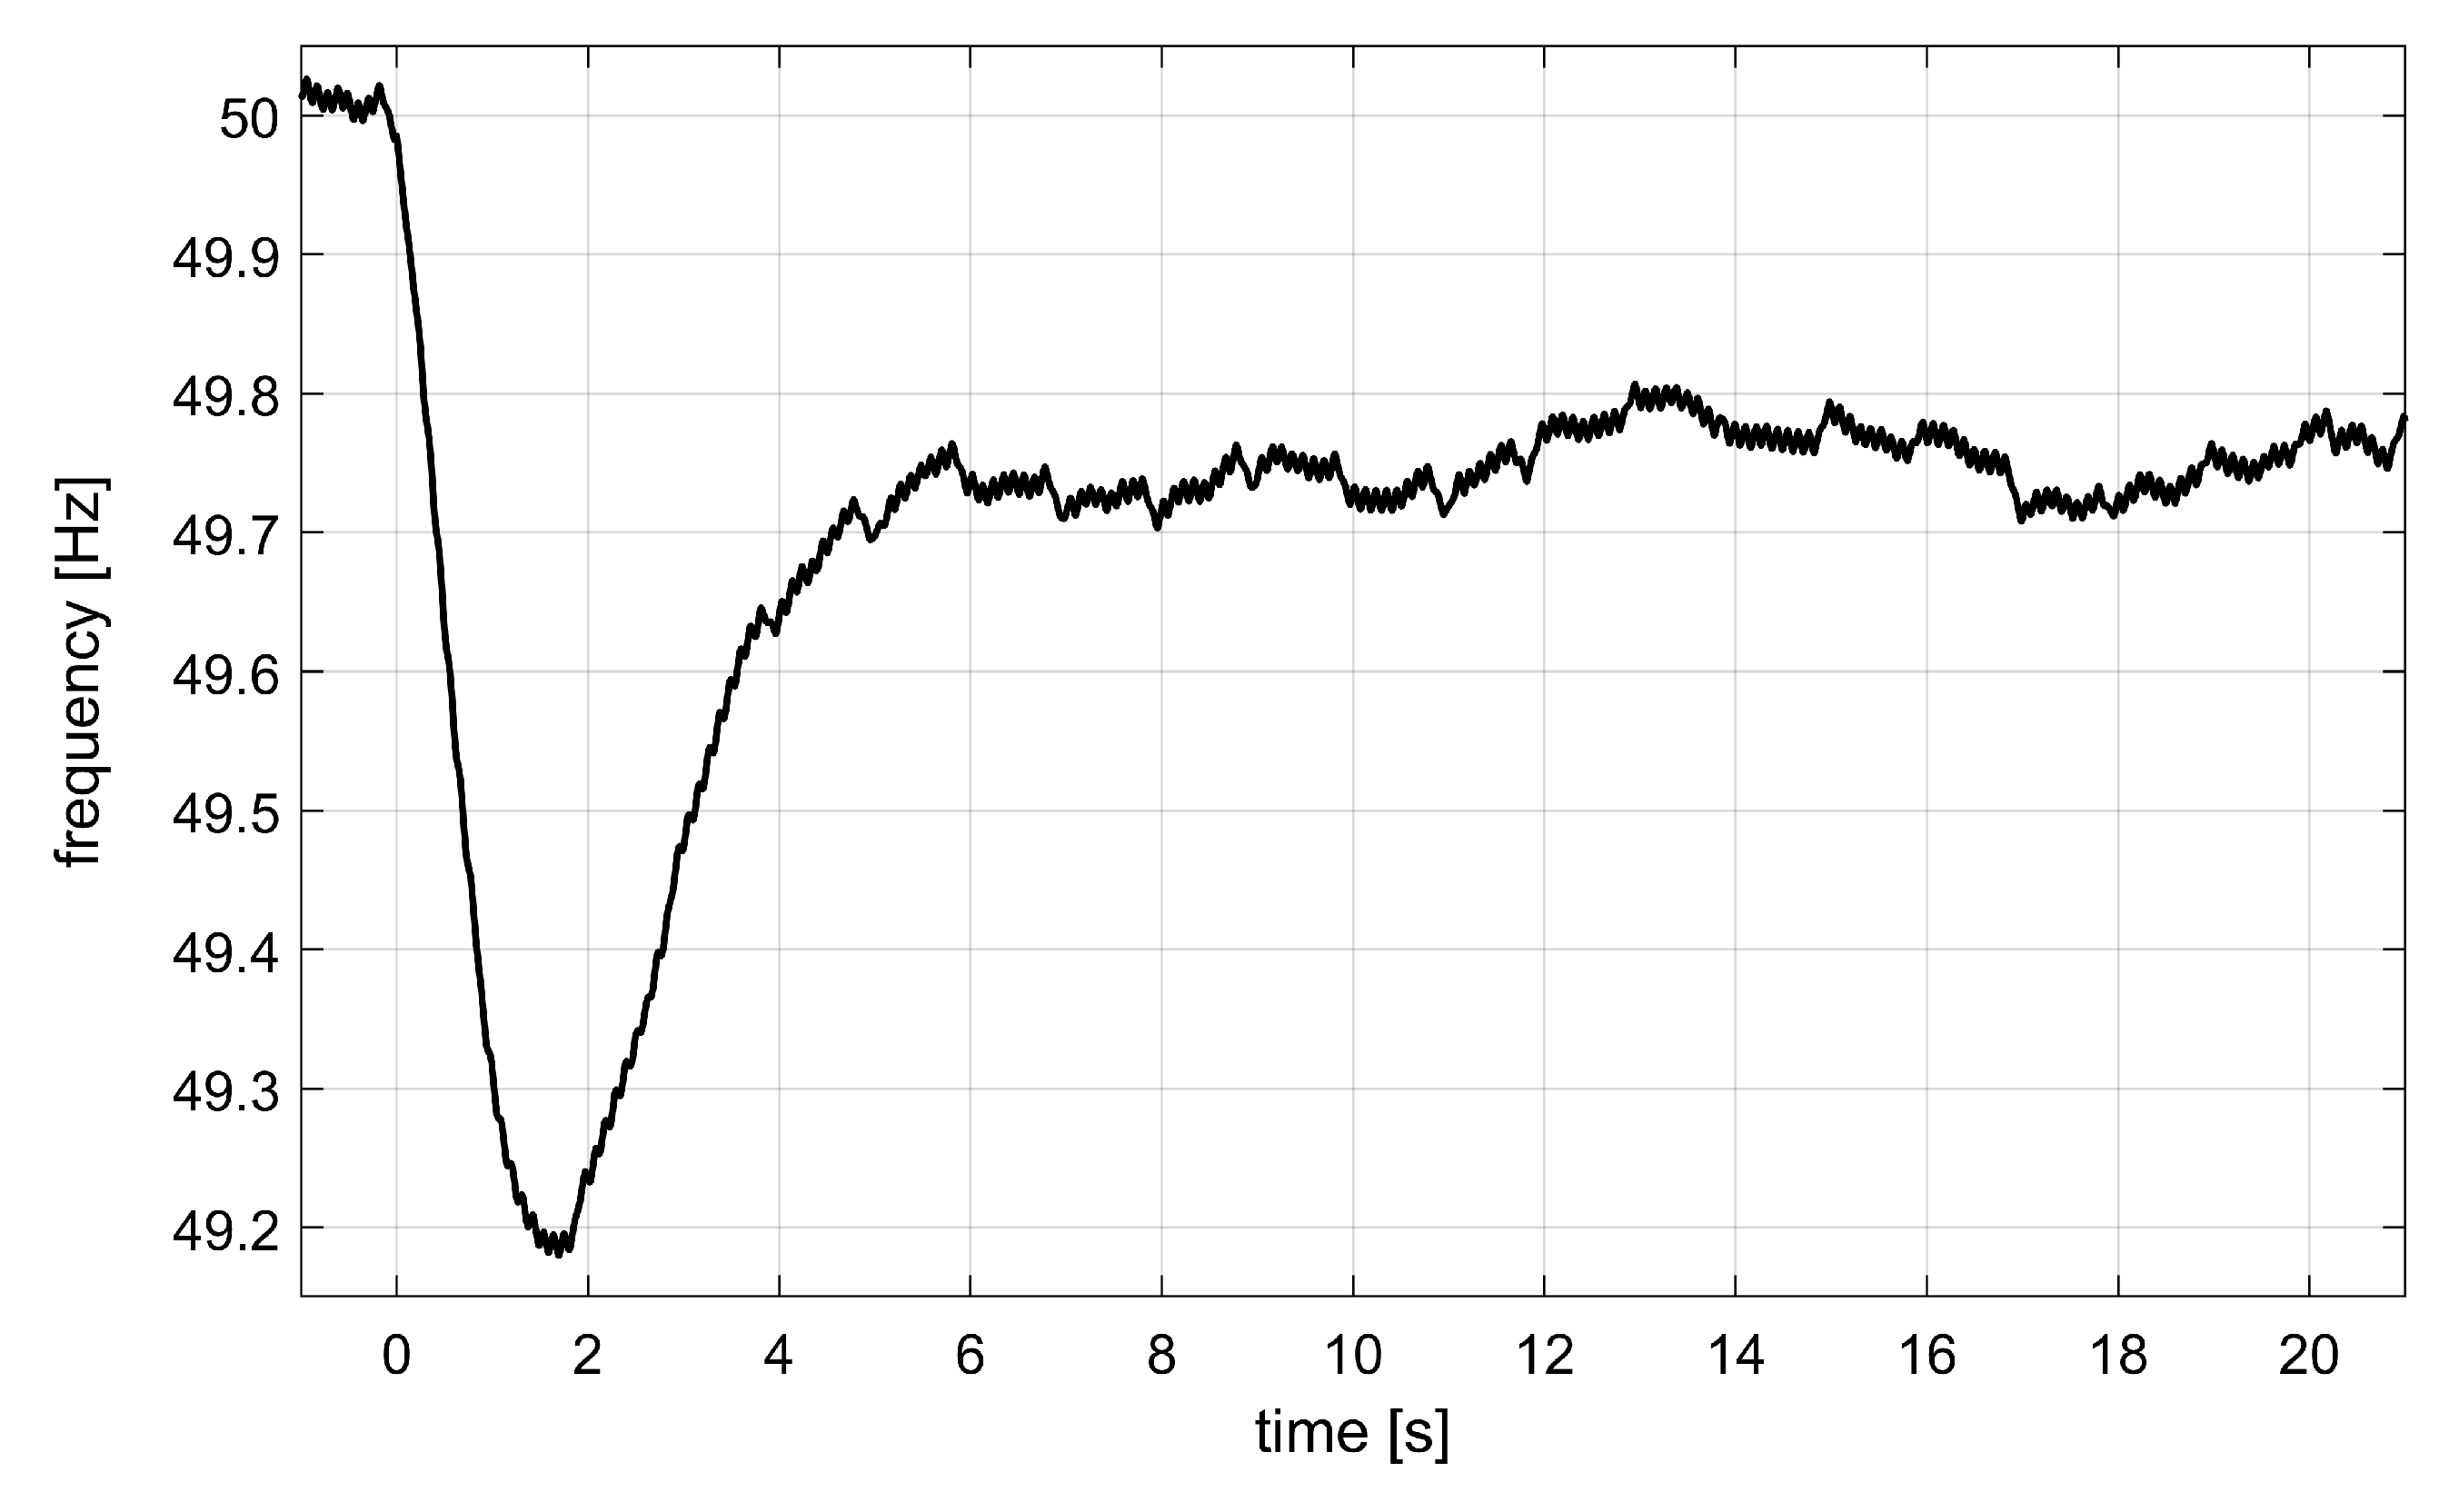
3.1. System Model and Frequency Response without Synthetic Inertia

In Figure 3, the block diagram used to build an equivalent model of the power system is shown. The term Δ P L is the active power load variation applied to generate a power imbalance, whereas Δ P S I represents the active power exchanged by BESS to provide SI, and Δ P G is the primary frequency regulation following the disturbance. Table 1 summarizes the values assigned to the droop R and to the delays T G , T T 1 , T T 2 , T T 3 of the governor and reheat turbine models. The limits set for the governor model consider the valve opening constraints, whereas limitations imposed on the turbine model take into account the active power limits. A substandard level of system inertia H (3 seconds) was assumed to simulate the arising of reduced TSI conditions due to the high penetration of inverter-based RES. This assumption was made in accordance with [30], where the authors estimated system inertia of the Italian transmission system, highlighting how a TSI even lower than 3 seconds has been experienced during specific real-time conditions.
Figure 4 shows the transient response of the simulated system to a sudden load step change, when only primary frequency regulation is considered (i.e., the term Δ P S I related to the power contribution of synthetic inertia is set to zero). Since the scope of the following tests is to test inertial control, which happens within the first 500–1000 ms of the transient, secondary frequency regulation is not modeled. At the beginning of the simulation (t < 0 s), the system was assumed to be in steady-state conditions, with the synchronous generation perfectly balancing the load. At time t = 0 s, an instantaneous upward load step change ( Δ P l o a d = + 0.1 p.u.) was applied. The primary frequency regulation of the synchronous generation regulated the power output of the quantity Δ P g e n so that a new equilibrium point was reached. The primary frequency regulation was modeled according to the transfer functions typical of a thermoelectric plant, whose parameter values are shown in Figure 3.
As shown in Figure 4, the load step variation gave rise to the frequency transient represented by a dotted black curve. After 1.62 s, the frequency trajectory reached its minimum, or nadir, at 49.21 Hz. Then, thanks to primary regulation, system frequency is brought back close to its nominal value, settling to about 49.75 Hz. Without synthetic inertia support, frequency control was only provided by the synchronous generators that, by means of the primary frequency regulation, adjusted active power generation according to the simulated response of the turbines’ governor. After about 6 seconds from the contingency, the power response Δ P g e n , depicted in Figure 4 with a continuous blue curve, reached the same value of the applied load variation Δ P l o a d . A power overshoot of about 0.030 p.u. was reached during regulation.

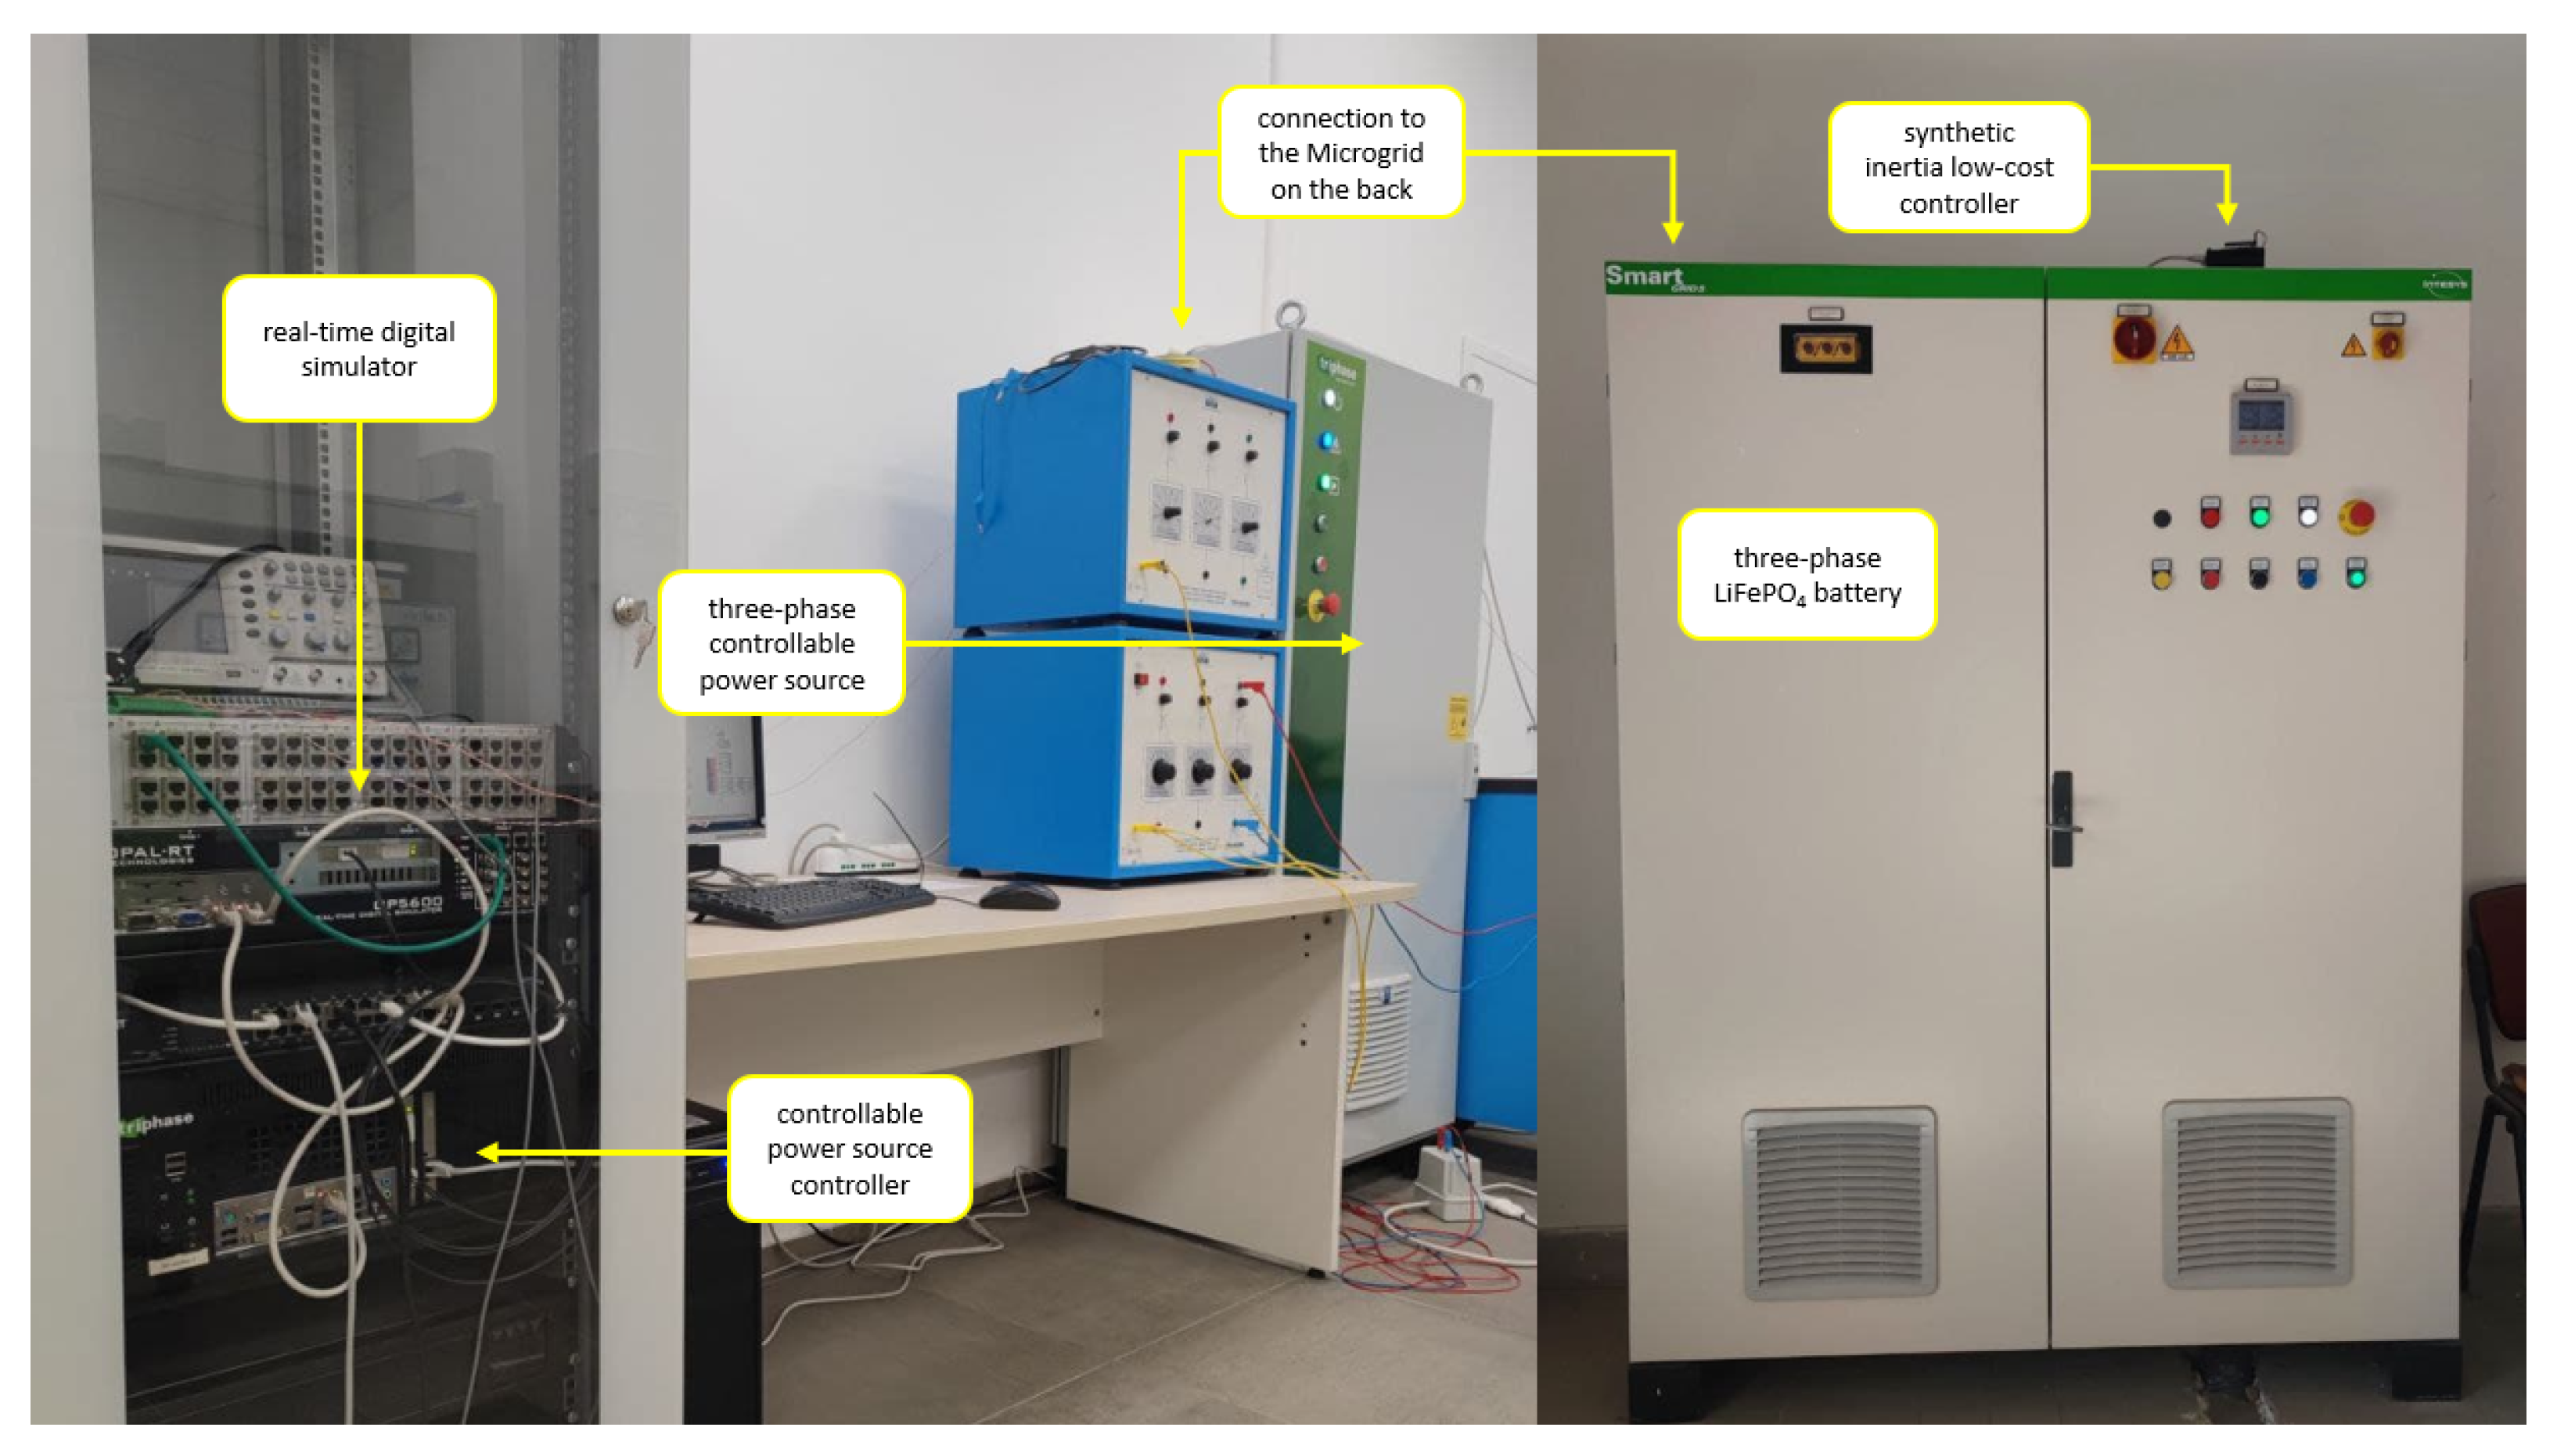
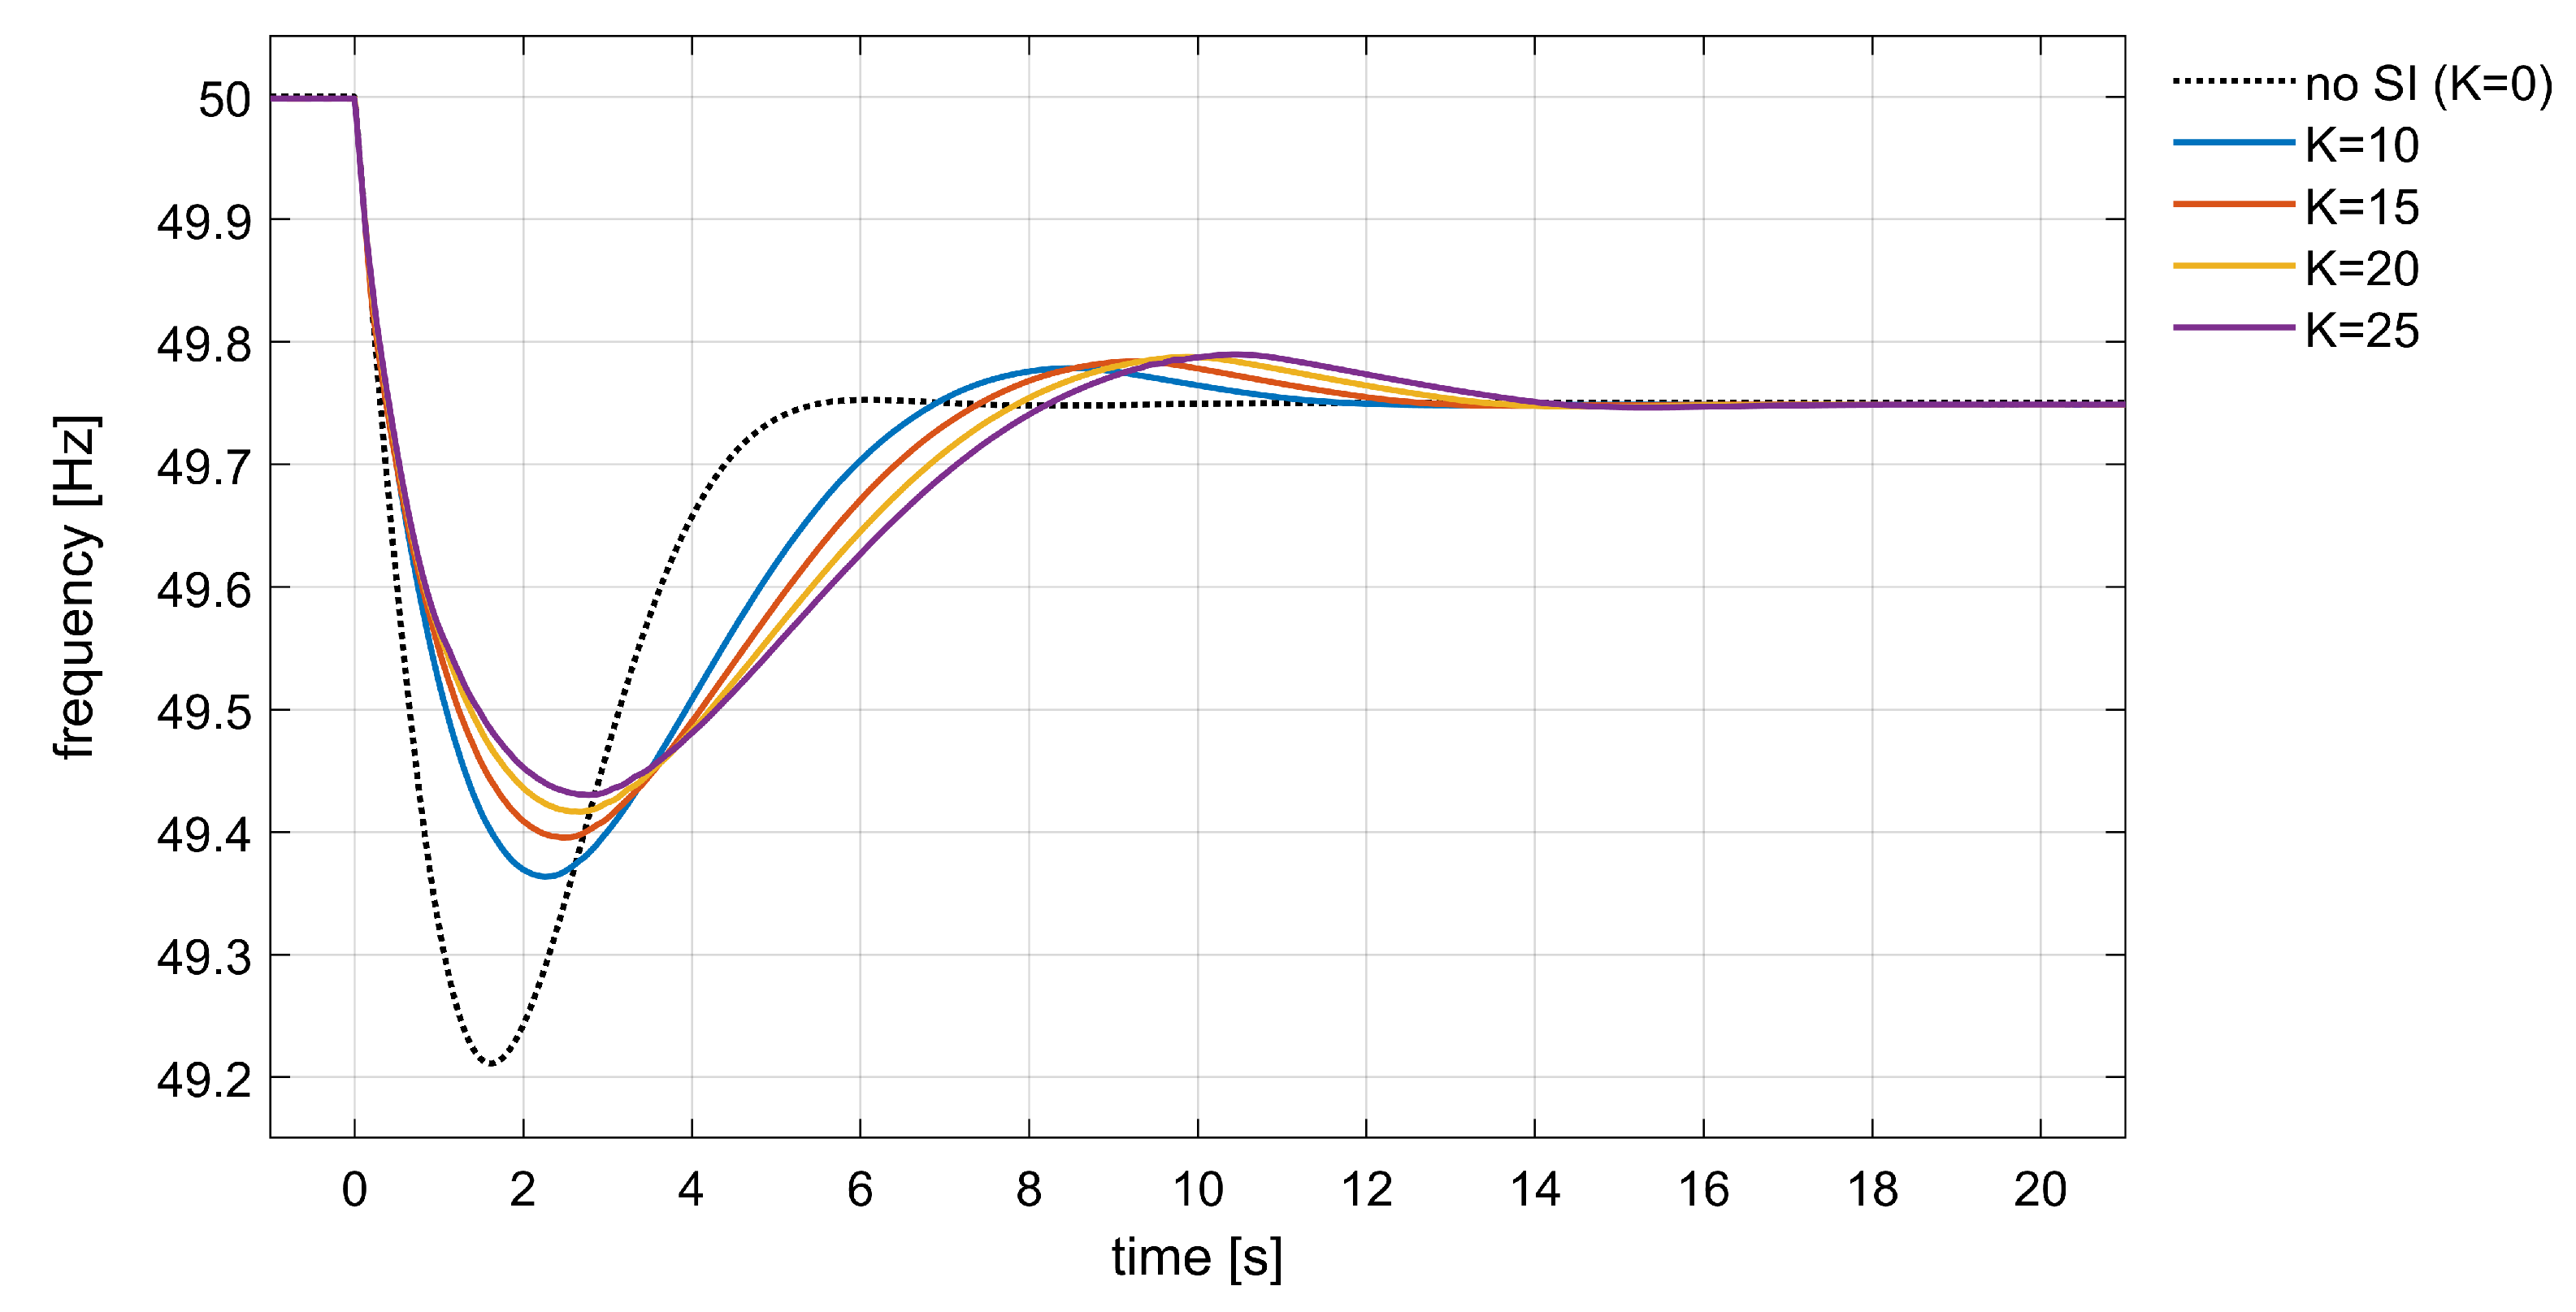
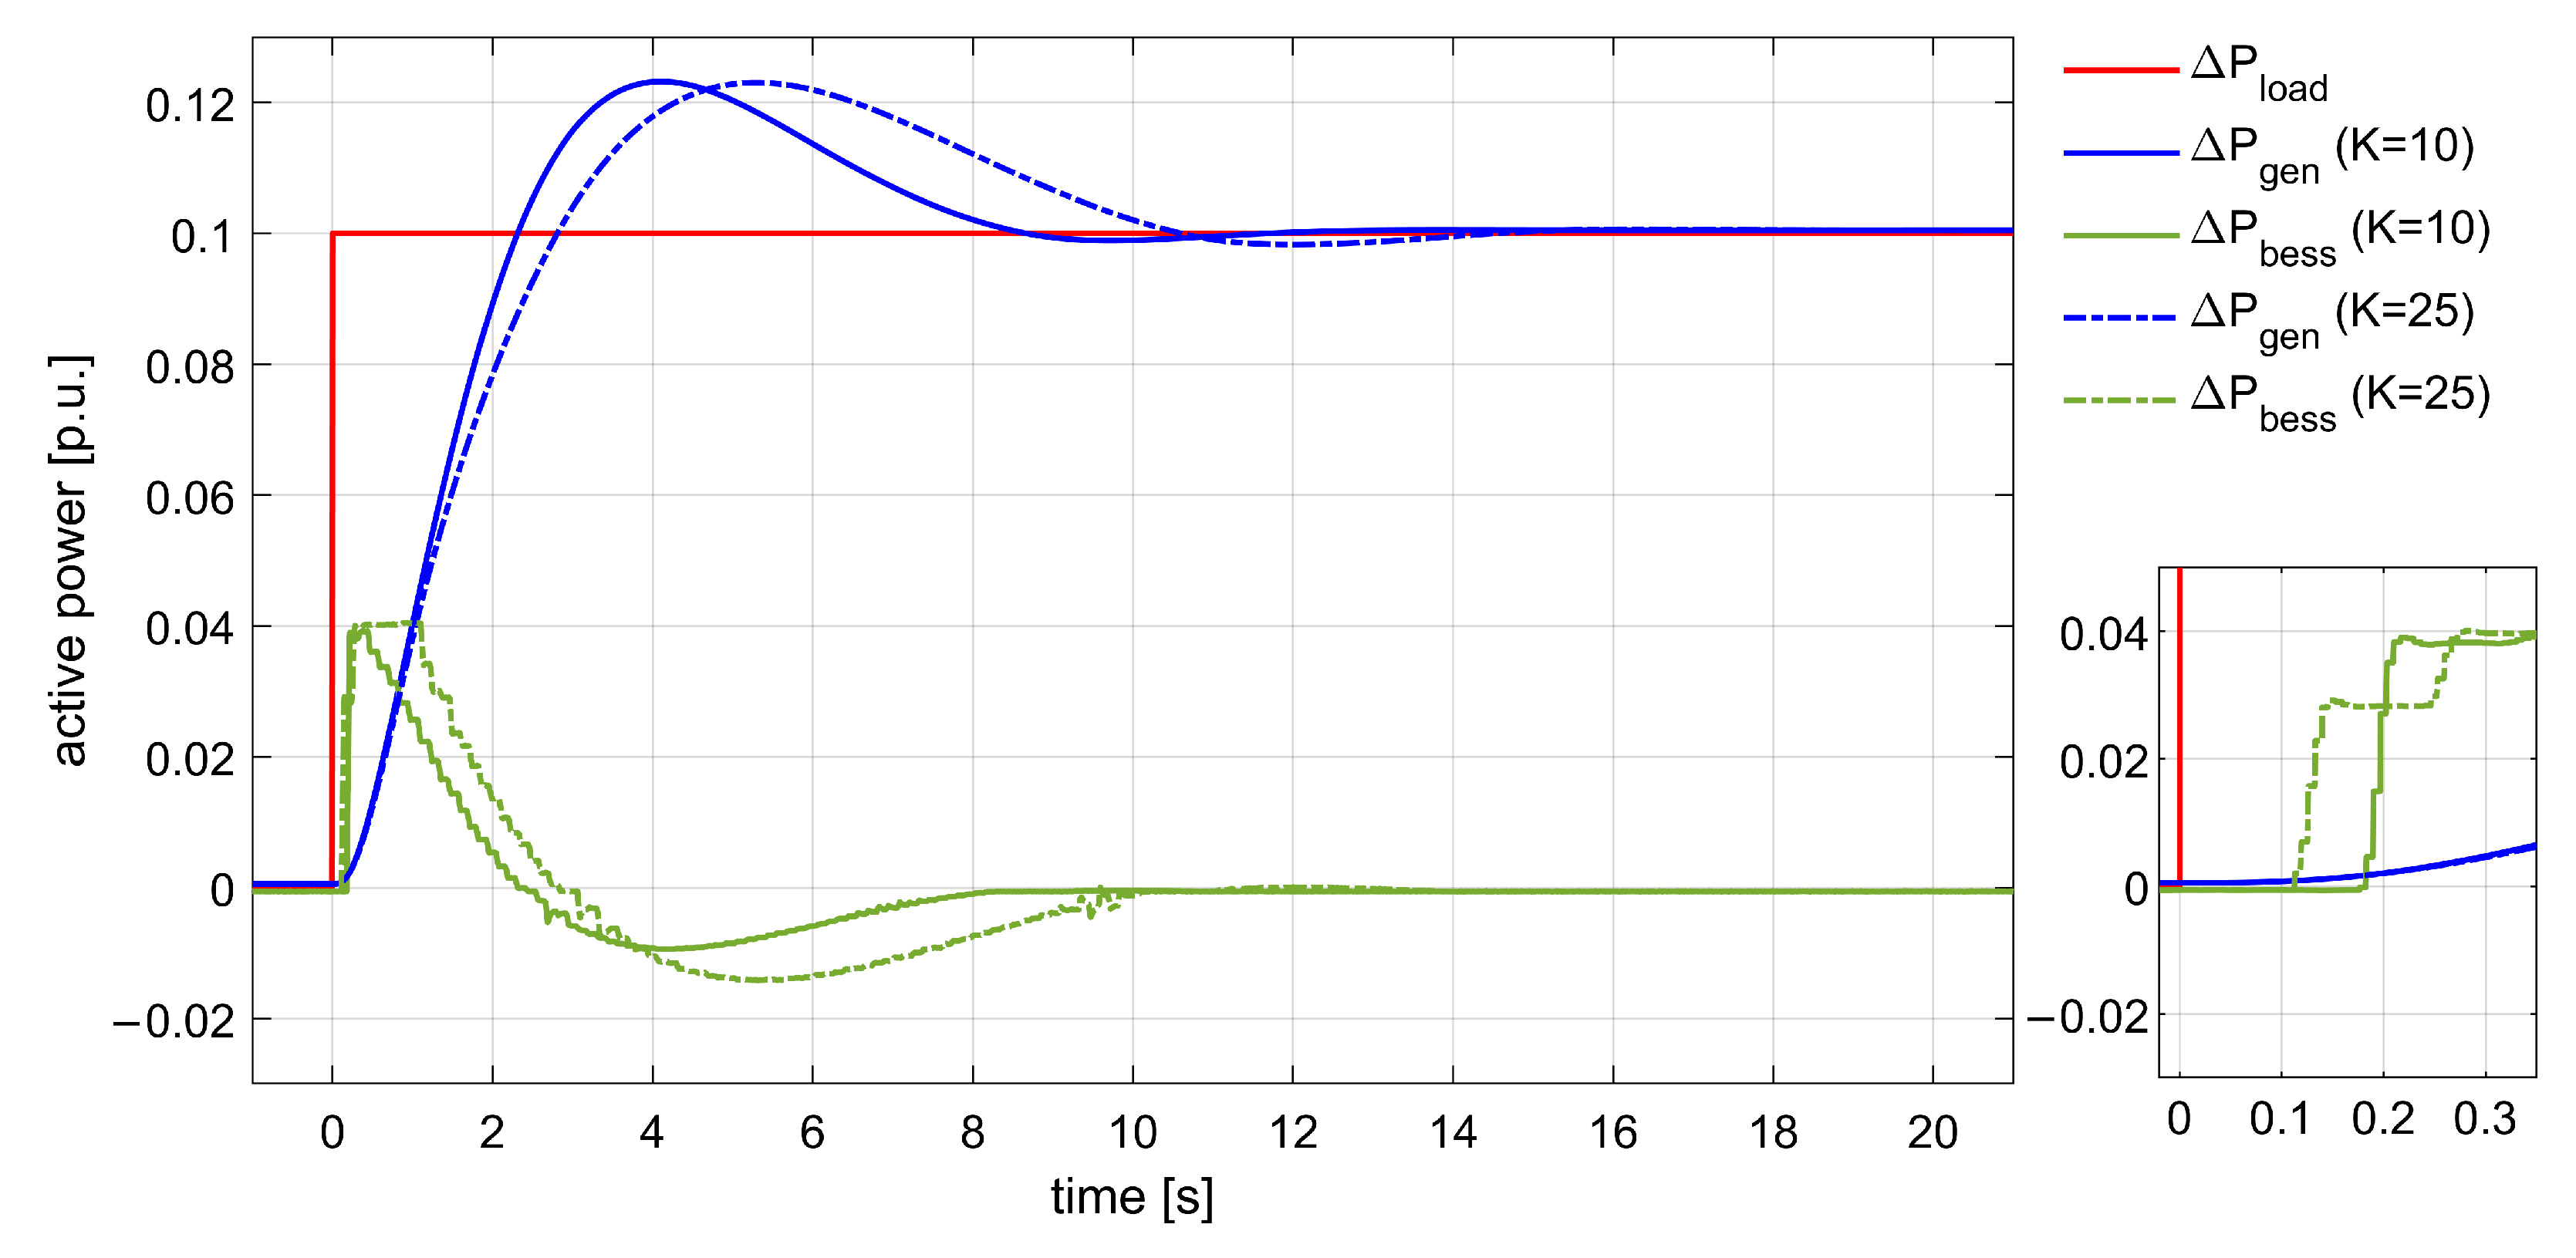
3.2. PHIL Tests of Synthetic Inertia by Means of BESS

In this second subsection, the capability of a BESS to modulate its power output and provide frequency support was investigated. The presence of an additional non-null active power contribution Δ P S I in the scheme of Figure 3 was therefore considered. This additional term takes into account the SI contribution provided by BESS in terms of active power balance. The BESS power output was remotely managed, applying a current reference set-point I r e f to the BMS. This set-point was calculated by a simulated SI controller on the basis of the RoCoF signal, and then sent via Modbus TCP/IP communication. In these tests, the proposed SI controller is only emulated through the RTS. Frequency and RoCoF measurements are ideal signals obtained by the RTS during the transient simulation.
The active power response of the BESS was measured by the controllable power source and fed back to the RTS in order to close the loop of the PHIL simulation. Since the SI active power control should reproduce the response of a larger number of storage units, Δ P S I was scaled by a factor S F (shown in Figure 3). By means of this scaling factor, the real BESS, whose maximum inertial contribution was set to about 3.5 kW, represents in the real-time simulation a BESS with nominal power equal to 4 % of the reference power. The synthetic inertia control adopted in this test case and simulated through the RTS is represented in Figure 5.
With the aim to avoid an excessive control activity of BESS around the frequency equilibrium point and endanger the lifespan of the battery, a 10 mHz/s RoCoF dead-band was assumed. Moreover, the saturation block limited the direct current reference I r e f to [−5,+5] A, thus about 3.5 kW in charge/discharge mode.
As previously mentioned, in these tests, an ideal SI controller is just emulated in the RTS. The SI control law is obtained according to the scheme Figure 5. The RoCoF signal is calculated during the simulation by deriving the continuous frequency signal. RoCoF is therefore a continuous quantity, known instantaneously at each simulation time step (i.e., 0.125 ms). Due to the absence of delays and measurement errors in the RoCoF signal, as shown in Figure 5, no filters were adopted in the control chain.
In tests, increasing values of gain K in the interval 10–25 A/(Hz/s) were used in order to study the dependence of the system frequency response with respect to the amount of active power provided by the inertial control. Figure 6 shows the frequency response of the simulated system after the introduction of the SI support with various values of gain K. The black dashed line represents the system frequency response without any SI support, which was previously calculated and assumed as base case. Differently, all other curves are the frequency trajectories obtained in the presence of BESS synthetic inertia control. The observed response is coherent with the typical effects of fast SI control actions [13]. In comparison with the base case (no SI control action), higher frequency nadir points were reached, even though the settling time was increased.
In general, it can be observed that an increase of gain K allowed to reduce the frequency derivative in the very first instant and reach a higher nadir. However, higher magnitude of inertial control corresponds also to larger second overshoot and longer settling time. From Figure 7, it is possible to observe how control gain affects system response. A lower gain reduces the BESS participation in frequency control, letting the synchronous machine more rapidly take care of the power imbalance. The synchronous generator overshoot decreases with SI contribution. In the PHIL tests, this overshoot was reduced from 0.0295 p.u. of the base case to 0.0232 and 0.0230 p.u. for the case with K = 10 and K = 25 , respectively. Having reached the nadir, the SI control action changes its sign: for this reason, higher gains cause an increase of the second frequency overshoot and an increase of the time necessary to reach steady state.
Table 2 permits to better compare the results obtained using different gains after the same load-step variation. The settling time was calculated considering a 2 % tolerance around the steady state value. The fall time is the time necessary for the frequency to drop from 10 % to 90 % of the settling value. This fall time was used to average the RoCoF value in the initial characteristic of the frequency transient (see Table 2). To assess the impact of SI on RoCoF, the average RoCoF value is more suitable than the maximum value, since the latter is always experienced in the very first instant after t = 0 s, when no actual regulating response of the BESS is possible (in other words, the maximum instantaneous RoCoF is the same in all simulations). The obtained results demonstrated that fall time and average initial RoCoF improve with SI gain increase. However, it can be noticed how these improvements soon saturate with SI gain increase, whereas settling time continues to increase. This is due to the fact that, in the initial moments when RoCoF reaches its maximum, high gains will cause SI control to hit the maximum active power limits of the battery, and therefore no further frequency response improvement can be obtained.
This is a known problem of SI control, and, in general, two possible solutions can be adopted. The first solution is to adopt a nonlinear SI control with a gain that is a function of RoCoF. This kind of control allows to exploit all fast frequency regulation resources in the first fall, whereas the SI control action will more rapidly damp out while frequency approaches the nadir or the settling value. The disadvantage of this control is that SI response will always be very moderate in frequency events that are not characterized by high-frequency derivatives. Another possible solution is to adapt gain to the specific operating conditions. Gain can be set so that active power control will reach maximum capacity during a credible worst-case event (the one characterized by the highest frequency derivative). In an isolated network, this event might correspond to the sudden loss of the highest load feeder or generating station. Clearly, this kind of approach requires the presence of a control center (a microgrid controller in the case of a small isolated distribution network), plus a communication channel must be established between this control center and the SI controllers installed on the field. Gain K can be easily updated knowing the current battery capability and the expected maximum RoCoF excursion. In both cases, the use of an additional fast frequency control proportional to the frequency deviation (and not to the RoCoF) can help to control transients characterized by small derivatives, but large frequency deviations. Investigations on these control schemes are, however, out of the scope of this paper, since our main aim is to test the fast control capability of the proposed controller. Any kind of SI control rule can be easily programmed in the controller.
Figure 7 allows to assess the speed of the BESS active power response. The first variation in power exchange was measured by the programmable power source after about 80–100 ms from the load step change. Despite this initial delay, the BESS was able to reach its active power peak within 200 ms. The SI controller was just simulated and therefore there were no delays due to frequency and RoCoF measurements. However, some delays were introduced by the Modbus TCP/IP communication and the use of a master node to control the BMS. In our network, these delays are usually in the 50–80 ms range.
Some final PHIL tests were carried out using the simulated ideal controller. These tests, whose results are also synthetically reported in Table 2, were aimed to assess the impact of the frequency reporting rate. This is a relevant issue, since the simulations with a real controller, which will be shown in the next sub-section, are characterized by actual measurement delays. So far, frequency and RoCoF measurements were assumed to be continuous variables, known instantaneously at each time step of the simulation. Figure 8 shows what happens when the reporting rate of frequency (and RoCoF) assumes values closer to the actual time resolution achievable with hardware instrumentation. These tests were performed using gain K = 10 .
If the response of the controlled equipment is slowed by measurement reports, the frequency falls faster. However, up to about 100 ms, the reporting time barely affected the frequency transient. In Figure 9, it is possible to notice how with a 150 ms reporting time, the battery was operated close to its maximum capacity for a longer period, even leading to the highest nadir. However, this response is more similar to the one obtained by fast frequency regulation schemes that operate with control laws proportional to the frequency deviation; the response is improved in terms of nadir, but the initial RoCoF is barely influenced by the BESS control. In this test case, characterized by low inertia and a very fast frequency transient, reporting times equal to or higher than 150 ms cannot produce any improvement in terms of RoCoF reduction. Table 2 allows us to numerically compare the results of the simulations in terms of RoCoF, nadir, and settling times. These simulations will also be used as benchmark for the PHIL tests with the actual controller.

4. Power Hardware-in-the-Loop Tests with the Single-Board SI Controller

This final test results section has been aimed to assess the capability of the proposed SI controller to provide frequency support by means of BESS. This controller is able to measure the grid frequency directly from the voltage signal of the BESS busbar, calculate RoCoF, and implement an SI control law on the BMS. In these tests, the RTS is only employed to simulate the power system electromechanical response and provide the frequency reference to the programmable source.

4.1. Algorithm for Fast Frequency Measurement

The physical SI controller under test is designed to be able to provide frequency support autonomously, without external inputs or measurements. Frequency is measured locally by the same controller using the algorithm discussed in [19]. This algorithm permits to perform fast frequency estimation through the calculation of an autocorrelation integral A ( τ ) of a generic waveform with period τ ˜ . Based on a discretized version described below, the algorithm proposed in [19] is aimed at finding the period τ ˜ which maximizes the autocorrelation function A ( τ ) . Please note that, in the following, the square brackets are used to represent discrete functions and values. The method is based on associating a value [ A ] to a candidate solution [ τ ] . Each candidate period [ τ ] is a discrete value that corresponds to a multiple of the sampling period. Therefore, a continuous value of period (and frequency) can be obtained only by adopting an interpolation rule on consecutive values of [ A ] and [ τ ] . In this case, a second-order polynomial approximation is used. The algorithm is organized with the following structure:
(1)
An initial guess τ 1 is made (for example, the frequency period measured at the previous acquisition).
(2)
Having considered [ τ 1 ] τ 1 , two more values in its neighborhood are selected, [ τ 0 ] = [ τ 1 ] Δ τ and [ τ 2 ] = [ τ 1 ] + Δ τ .
(3)
[ A 0 ] , [ A 1 ] , and [ A 2 ] are evaluated in correspondence of values [ τ 0 ] , [ τ 1 ] , and [ τ 2 ] , respectively.
(4)
A new value τ 1 is calculated as the abscissa of the vertex of the parabola passing through the three points ( [ τ 0 ] , [ A 0 ] ) , ( [ τ 1 ] , [ A 1 ] ) , and ( [ τ 2 ] , [ A 2 ] ) .
(5)
A narrow neighborhood of [ τ 1 ] τ 1 is analyzed assuming a Δ τ equal to the sampling period and repeating steps 2–4.
(6)
The measured frequency is f ˜ = 1 τ ˜ , with τ ˜ = τ 1 .

4.2. Influence of Measurement Errors

Differently from that discussed in the previous subsections, in these tests, the BESS response is affected by both RoCoF sampling period and measurement errors. Due to the methodology used for fast frequency measurement, the reporting time of frequency (and RoCoF) is about 50–60 ms. This time is needed to sample the two entire cycles necessary to evaluate the weighted autocorrelation integral and process the samples to obtain the frequency measurement. Measurement errors are introduced by several factors, including the accuracy of the proposed real-time frequency measurement methodology, the adopted transducer, the ADC sample rate, and voltage quantization. Moreover, the effects of harmonics and other disturbances in the real power circuits must be added. Disturbances and errors sum up, providing an estimated RoCoF signal that can be extremely noisy.
Figure 10 shows the frequency response obtained using the proposed SI controller without applying any filter to the RoCoF signal. Even though a very wide RoCoF dead-band ( ± 0.100 Hz/s) and a small gain (i.e., K = 10 ) were adopted, the presence of noise on RoCoF introduced excessive errors on BESS control. No improvement was brought to the frequency response in terms of nadir. Moreover, measurements errors introduced by the controller resulted in a continuous activation and deactivation of the BESS response, causing unbearable frequency fluctuations around its theoretical steady-state value.

4.3. Tests with Filtered RoCoF Measurements

Since low-cost applications, such as the one proposed with this single-board controller, cannot make use of high-accuracy transducers and signal processing instrumentation, measurement errors must be filtered. In the following tests, a low-pass filter based on exponential smoothing was applied to frequency measurements. The SI control scheme programmed on the single-board SI controller is shown in Figure 11. The filtering action can be modulated by varying the smoothing factor α in the range [ 0 , 1 ] . The maximum filtering action is obtained with α = 0 , whereas the filter is completely deactivated with α = 1 . Samples f f i l t ( k ) and f ( k ) are, respectively, the k - th samples of the filtered and not filtered frequency at the time instant t. The RoCoF signal R o C o F f i l t ( k ) is calculated from the filtered frequency measurements using a discrete derivative function. Smoothing is needed not only to filter measurements but also to reduce the stress on the controlled component and avoid too many sudden power variations that can impact the cells’ lifetime.
In Figure 12, the frequency response of the simulated power system during a generic frequency event is compared with the filtered and unfiltered frequency values measured by the controller at the microgrid switchboard where the BESS is installed. Figure 13 shows the corresponding values of RoCoF. The filtered signals were obtained with a smoothing factor α equal to 0.1. It can be observed that the filtered signals were slightly delayed, but the beneficial effects of the filter during a frequency measurement disturbance, arising around t = 7.5 s, are clearly visible. The RoCoF error is drastically reduced, also allowing to keep a small dead-band on RoCoF (i.e., ± 0.025 Hz/s in all simulations with the real controller).
Figure 14 shows the system response obtained using the real SI controller, and adopting different values of gain K. The characteristics of the frequency response are also reported in Table 3. The smoothing factor was set to 0.1 in all tests. With respect to Figure 6, the results obtained with the real controller are slightly worse in terms of initial RoCoF and settling time, but slightly better with regard to nadir and second overshoot. It can be observed that higher gains ( K = 20 and K = 25 ) resulted in bumpier frequency trajectory, due to the amplification of RoCoF errors. Moreover, around the nadir point, higher gains created some small oscillations when the RoCoF trajectory entered and exited the dead-band. These small oscillations also introduced some errors in the detection of the nadir time and frequency, as in Table 3 for the case K = 25 .
Figure 15 compares the BESS response in the two extreme cases ( K = 10 and K = 25 ), showing how a lower gain permitted obtaining a smoother response, with limited stress on the controlled component. According to these tests, higher gain levels produced only marginal improvements, which did not compensate the other drawbacks.

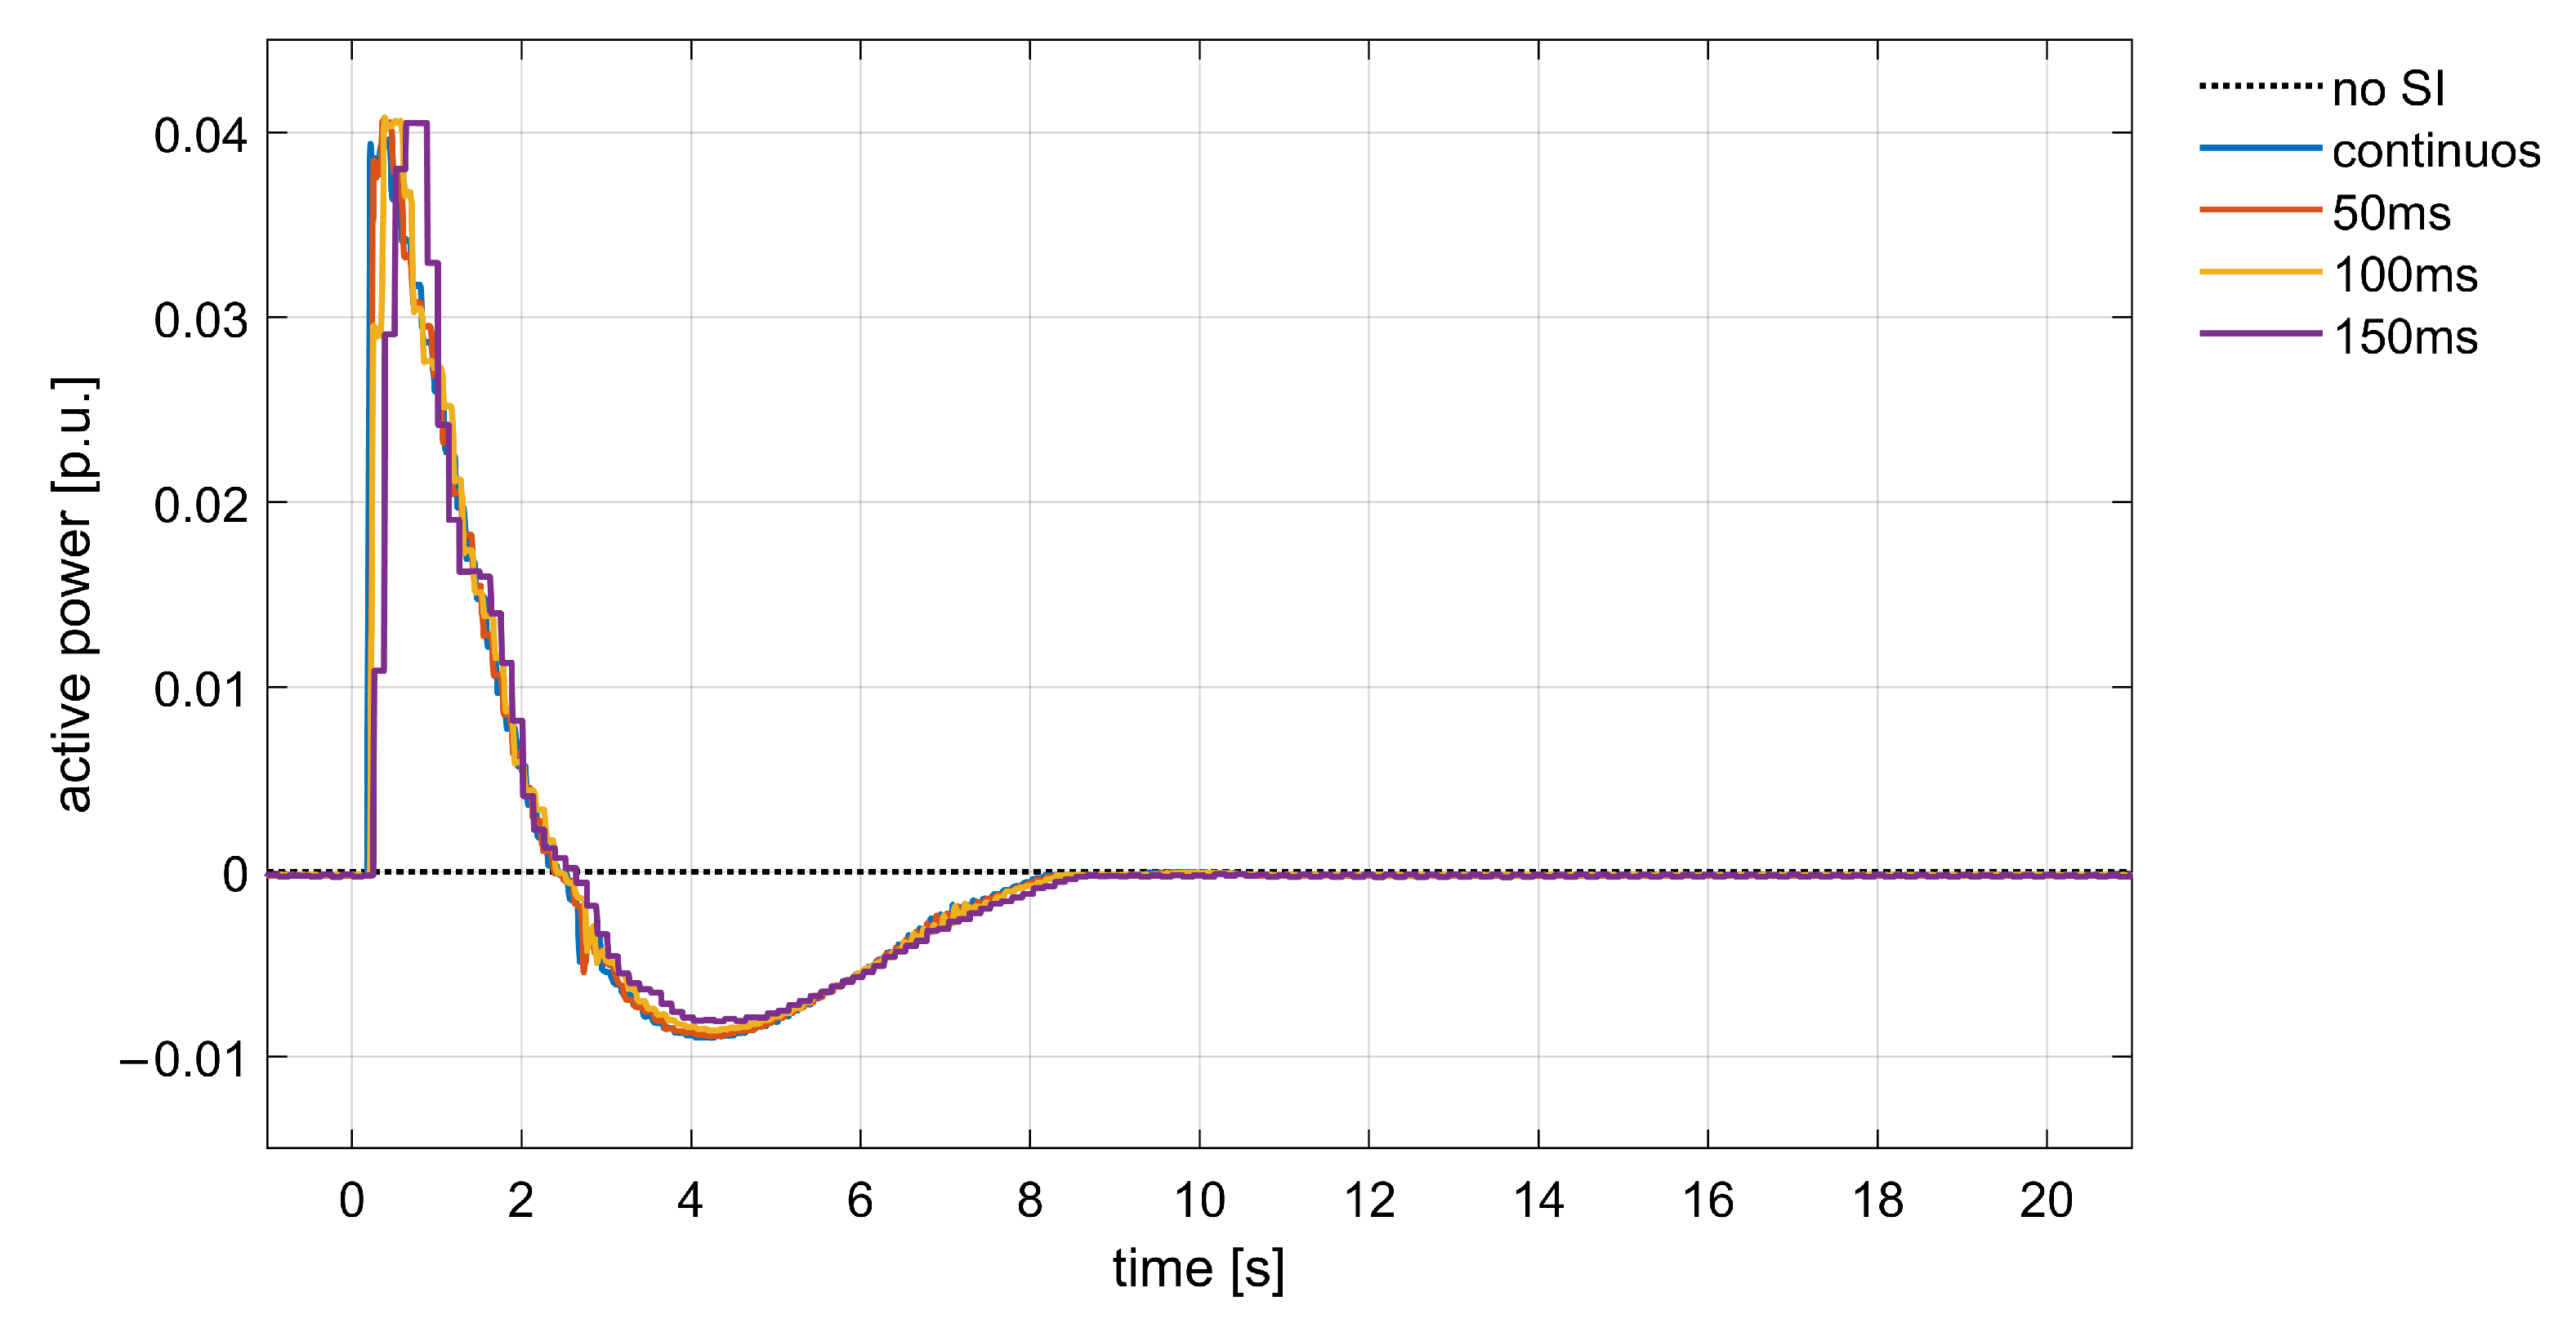
4.4. Frequency Measurement Reporting Time

Further tests were carried out to investigate the influence of the measurement reporting time with the smoothing factor α . As shown in Figure 16 and Table 4, a higher smoothing factor ( α = 0.25 ) allowed reduction of the initial RoCoF, but the frequency response was still characterized by a lower nadir and permanent fluctuations due to the effects of RoCoF error. However, since RoCoF estimation is derived from two subsequent frequency measurements, the RoCoF error can be reduced with a slower frequency reporting rate. As observed in [24], since frequency measurement is based on the evaluation of power system voltage, frequency computation can typically be updated every few cycles, 90–120 ms. Since a trade-off between fast enough and accurate frequency measurements is needed, according to ENTSO-E, accurate RoCoF calculations should be based on sliding windows which average results over few consecutive measurements. Robust results can be obtained, for example, in about 0.5 s if a 100 ms time resolution is used. For this reason, some further tests were carried out introducing a small delay in the frequency reporting of the controller, so that more accurate RoCoF estimations can be used by the controller. The effect of increasing the reporting time up to 100 ms is shown in both Figure 16 and Table 4.
Increasing the reporting time to 100 ms allowed obtaining of more stable frequency responses, but it did not prove useful when a stronger filter was applied ( α = 0.10). A 100 ms reporting time worked well with a higher α ( α = 0.25), as in the green dotted line in Figure 16, obtaining comparable results to the ones obtained with faster reporting rate and α = 0.10 (blue line). These results are comparable with the ones obtained with ideal delayed control (see Figure 8 and Table 2).
This result is significant for several reasons. If a slower reporting rate is employed, the controller has a consistent amount of idle time (in this case more than 40 ms) that can be used either in the implementation of more efficient data processing and filters or in the control of more devices. This means that there is enough time to send more control signals and to deal with different protocols and communication media, extending the range of action of the controller from just one BESS to more coordinated DERs. In a microgrid, where different DERs might provide asymmetric frequency control resources (for example, loads vs. RES generation), this is a key improvement since it would allow increasing the extent of the frequency control capacity using just a single controller.

4.5. Discussion and Future Developments

The results obtained by previous PHIL tests validated the capability of the proposed controller to manage BESS, or other distributed flexible resources, in order to provide frequency support to power systems. The data shown in Table 3 and Table 4 demonstrated that the inertial response can be sensibly improved in terms of frequency nadir. A limitation of the proposed approach is that initial RoCoF can only be minimally reduced by SI control. This is due to the unavoidable delays introduced by the measurement, filtering, and communication processes. An effective SI contribution can be reached only after few hundreds of milliseconds (see Figure 14 and Figure 16). Clearly, the obtained performances cannot be compared with other approaches to virtual inertia, such as, for example, the ones based on virtual synchronous machines, which are able to generate much faster responses. However, one should be reminded that the scope of this paper is to prove the feasibility of enabling, through low-cost technologies, synthetic inertia control of legacy and distributed devices which cannot be programmed to emulate the behavior of a synchronous generator. These devices could be storage systems, such as in our tests, but also other flexible resources which could also have asymmetric active power control capacity (for example, demand response systems, photovoltaics, etc.). Nevertheless, achieved performances are comparable with typical activation times required for wind power or BESS in providing frequency support proportional to the frequency derivative (<0.5 s) [31].
The PHIL tests permitted testing of the response of the proposed control scheme in a realistic scenario, making use of real voltage trajectories affected by noise and including the actual computation and communication delays that can affect the control. Due to the presence of disturbances and uncertainties, such as time delays, and the presence of several blocks that introduce discontinuities (dead-band, saturations, etc.), we have preferred to check the stability of the controller through an extensive set of time-domain simulations and power hardware-in-the-loop tests. These tests were conducted, adopting wide ranges of variation of main parameters such as delays, gains, dead-bands, etc. For the sake of brevity, only the results of few tests have been reported in the paper. However, the system proved to be stable even in the presence of highly distorted measurements, as also demonstrated in Figure 12 and Figure 13. The main aim of this work was to check that the performances obtained with an autonomous controller, able to both measure frequency from voltages and produce a control signal, comply with the time requirements needed for inertial support. Future developments will be aimed to investigate further on the design of the measurement filter, with a more analytic stability analysis.

5. Conclusions

In this work, the capability of a single-board, low-cost controller to be employed at end-user level to provide synthetic inertia with legacy BESS was investigated. The controller presented in this paper is programmed to perform fast frequency measurements using an autocorrelation algorithm to reduce the influence of voltage disturbances that can affect many frequency measurement methodologies. The controller cost is estimated at about USD 100 and is proved to be able to obtain real-time frequency and RoCoF measurements from local voltage samples, even in the case of single-phase systems, and to generate the SI control law to be sent to the remotely controlled BESS within 50–60 ms.
The controller was tested in a power hardware-in-the-loop simulation environment, on a physical LiFePO4 battery, proving to be accurate and fast enough to ensure a stable response and reduce frequency excursions during transients. The controller, however, can be applied to any other component, an inverter, PLC, or actuator, able to receive a set-point via common automation protocols. Therefore, the controllertested with the BESS can be ideally applied to any flexible resource such as switchable and curtailable loads, RES generators, or charging stations. The controller can interact with legacy components whose management system cannot be easily reprogrammed to include SI control schemes.
The PHIL tests shed light on the main issues deriving from the use of fast frequency monitoring and SI control systems. The presence of noise on grid voltage signals is required to filter the acquired frequency. However, delays introduced from these filtering processes barely affected the SI control effectiveness. In addition, test results showed that the frequency reporting time of this controller can be slowed down to 100 ms so that the controller itself has an idle time. This outcome demonstrated how the provision of SI control actions can be intentionally delayed to allocate the remaining time to control additional processes and making possible, at the same time, the implementation of different controls and coordination of multiple resources, without significantly penalizing the effectiveness of the SI support.

Author Contributions

Conceptualization, S.B. and M.L.S.; methodology, S.B.; software, C.I. and C.R.; validation, G.G., C.I. and C.R.; formal analysis, S.B.; investigation, C.I.; resources, C.R.; data curation, G.G.; writing—original draft preparation, S.B., C.I. and C.R.; writing—review and editing, G.G. and M.L.S.; visualization, G.G.; supervision, M.L.S.; project administration, G.G.; funding acquisition, S.B. and M.L.S. All authors have read and agreed to the published version of the manuscript.

Funding

This work was partially financed by Regione Puglia through the Grant NGFKLZ2, within the framework of the Programme Innolabs, FESR-FSE 2014–2020. The work of Dr. Bruno was supported by Regione Puglia through the Grant A1C03120 within the framework of the Programme REFIN—Research for Innovation, FESR-FSE 2014–2020.

Institutional Review Board Statement

Not applicable.

Informed Consent Statement

Not applicable.

Conflicts of Interest

The authors declare no conflict of interest.

References

  1. Morch, A.Z.; Siface, D.; Gerard, H.; Kockar, I. Market architecture for TSO-DSO interaction in the context of European regulation. In Proceedings of the 16th International Conference on the European Energy Market (EEM), Ljubljana, Slovenia, 18–20 September 2019; pp. 1–5. [Google Scholar] [CrossRef] [Green Version]
  2. ENTSO-E. Rate of Change of Frequency (RoCoF) Withstand Capability; Technical Report; ENTSO-E: Brussels, Belgium, 2018. [Google Scholar]
  3. Winter, W.; Elkington, K.; Bareux, G.; Kostevc, J. Pushing the limits: Europe’s new grid: Innovative tools to combat transmission bottlenecks and reduced inertia. IEEE Power Energy Mag. 2015, 13, 60–74. [Google Scholar] [CrossRef]
  4. ENTSO-E. Need for Synthetic Inertia (SI) for Frequency Regulation; Technical Report; ENTSO-E: Brussels, Belgium, 2017. [Google Scholar]
  5. Fang, J.; Zhang, R.; Tang, Y.; Hongchang, L. Inertia Enhancement by Grid-Connected Power Converters with Frequency-Locked-Loops for Frequency Derivative Estimation. In Proceedings of the 2018 IEEE Power Energy Society General Meeting (PESGM), Portland, OR, USA, 5–10 August 2018; pp. 1–5. [Google Scholar] [CrossRef]
  6. Bruno, S.; Giannoccaro, G.; La Scala, M. A Demand Response Implementation in Tertiary Buildings Through Model Predictive Control. IEEE Trans. Ind. Appl. 2019, 55, 7052–7061. [Google Scholar] [CrossRef]
  7. Subramanian, L.; Debusschere, V.; Gooi, H.B.; Hadjsaid, N. A Distributed Model Predictive Control Framework for Grid-Friendly Distributed Energy Resources. IEEE Trans. Sustain. Energy 2021, 12, 727–738. [Google Scholar] [CrossRef]
  8. Fang, J.; Li, X.; Tang, Y. Grid-Connected power converters with distributed virtual power system inertia. In Proceedings of the 2017 IEEE Energy Conversion Congress and Exposition, ECCE 2017, Cincinnati, OH, USA, 1–5 October 2017. [Google Scholar] [CrossRef]
  9. Chamorro, H.R.; Sanchez, A.C.; Øverjordet, A.; Jimenez, F.; Gonzalez-Longatt, F.; Sood, V.K. Distributed synthetic inertia control in power systems. In Proceedings of the 2017 International Conference on ENERGY and ENVIRONMENT (CIEM), Bucharest, Romania, 19–20 October 2017; pp. 74–78. [Google Scholar] [CrossRef] [Green Version]
  10. Martínez-Sanz, I.; Chaudhuri, B.; Junyent-Ferré, A.; Trovato, V.; Strbac, G. Distributed vs. concentrated rapid frequency response provision in future great britain system. In Proceedings of the 2016 IEEE Power and Energy Society General Meeting (PESGM), Boston, MA, USA, 17–21 July 2016; pp. 1–5. [Google Scholar] [CrossRef]
  11. The SmartNet Consortium. Deliverable 1.2—Characterization of Flexibility Resources and Distribution Networks; Technical Report; The SmartNet Consortium: Torino, Italy, 2017. [Google Scholar]
  12. Bruno, S.; De Carne, G.; Iurlaro, C.; Rodio, C.; Specchio, M. A SOC-feedback Control Scheme for Fast Frequency Support with Hybrid Battery/Supercapacitor Storage System. In Proceedings of the 2021 6th IEEE Workshop on the Electronic Grid (eGRID), New Orleans, LA, USA, 8–10 November 2021; pp. 1–8. [Google Scholar] [CrossRef]
  13. Kuga, R.; Esguerra, M.; Chabot, B.; Avendano Cecena, A. EPIC 2.05: Inertia Response Emulation for DG Impact Improvement. Technical Report. 2019. Available online: https://www.pge.com/pge_global/common/pdfs/about-pge/environment/what-we-are-doing/electric-program-investment-charge/PGE-EPIC-Project-2.05.pdf (accessed on 30 March 2022).
  14. Fang, J.; Tang, Y.; Li, H.; Li, X. A Battery/Ultracapacitor Hybrid Energy Storage System for Implementing the Power Management of Virtual Synchronous Generators. IEEE Trans. Power Electron. 2018, 33, 2820–2824. [Google Scholar] [CrossRef]
  15. Conte, F.; Di Vergagni, M.C.; Massucco, S.; Silvestro, F.; Ciapessoni, E.; Cirio, D. Synthetic Inertia and Primary Frequency Regulation Services by Domestic Thermal Loads. In Proceedings of the 2019 IEEE EEEIC/I and CPS Europe 2019, Genova, Italy, 11–14 June 2019. [Google Scholar] [CrossRef]
  16. Trovato, V.; Sanz, I.M.; Chaudhuri, B.; Strbac, G. Advanced Control of Thermostatic Loads for Rapid Frequency Response in Great Britain. IEEE Trans. Power Syst. 2017. [Google Scholar] [CrossRef] [Green Version]
  17. Rezkalla, M.; Zecchino, A.; Pertl, M.; Marinelli, M. Grid frequency support by single-phase electric vehicles employing an innovative virtual inertia controller. In Proceedings of the 2016 51st International Universities Power Engineering Conference (UPEC), Coimbra, Portugal, 6–9 September 2016; pp. 1–6. [Google Scholar] [CrossRef] [Green Version]
  18. Bruno, S.; Giannoccaro, G.; Iurlaro, C.; Scala, M.L.; Rodio, C.; Sbrizzai, R. Fast Frequency Regulation Support by LED Street Lighting Control. In Proceedings of the 2021 IEEE International Conference on Environment and Electrical Engineering and 2021 IEEE Industrial and Commercial Power Systems Europe (EEEIC/I CPS Europe), Bari, Italy, 7–10 September 2021; pp. 1–6. [Google Scholar] [CrossRef]
  19. Bruno, S.; Giannoccaro, G.; Iurlaro, C.; Scala, M.L.; Rodio, C. A Low-cost Controller to Enable Synthetic Inertia Response of Distributed Energy Resources. In Proceedings of the 2020 IEEE International Conference on Environment and Electrical Engineering and 2020 IEEE Industrial and Commercial Power Systems Europe (EEEIC/I&CPS Europe), Madrid, Spain, 9–12 June 2020; pp. 1–6. [Google Scholar] [CrossRef]
  20. Rodio, C.; Giannoccaro, G.; Bruno, S.; Bronzini, M.; La Scala, M. Optimal Dispatch of Distributed Resources in a TSO-DSO Coordination Framework. In Proceedings of the 12th AEIT International Annual Conference, AEIT 2020, Catania, Italy, 23–25 September 2020; pp. 1–6. [Google Scholar] [CrossRef]
  21. Orrù, L.; Petrocchi, L.; Siviero, A.; Silletti, F.; Lisciandrello, G.; Albimonti, G.; Ronzio, D.; Losa, I.; Lazzaro, M. H2020 OSMOSE Project: The Italian demonstrator. Testing flexibilities resources in a coordinated approach. In Proceedings of the 2021 IEEE PES Innovative Smart Grid Technologies Europe (ISGT Europe), Espoo, Finland, 18–21 October 2021; pp. 1–5. [Google Scholar] [CrossRef]
  22. Daly, P.; Qazi, H.W.; Flynn, D. RoCoF-Constrained Scheduling Incorporating Non-Synchronous Residential Demand Response. IEEE Trans. Power Syst. 2019, 34, 3372–3383. [Google Scholar] [CrossRef]
  23. Tosato, P.; Macii, D.; Brunelli, D. Implementation of phasor measurement units on low-cost embedded platforms: A feasibility study. In Proceedings of the 2017 IEEE International Instrumentation and Measurement Technology Conference, Turin, Italy, 22–25 May 2017. [Google Scholar] [CrossRef]
  24. ENTSO-E. Frequency Measurement Requirements and Usage; Technical Report Version 7; ENTSO-E: Brussels, Belgium, 2018. [Google Scholar]
  25. Romano, P.; Paolone, M. Enhanced Interpolated-DFT for Synchrophasor Estimation in FPGAs: Theory, Implementation, and Validation of a PMU Prototype. IEEE Trans. Instrum. Meas. 2014, 63, 2824–2836. [Google Scholar] [CrossRef]
  26. Zhang, Z.; Fu, P.; Gao, G.; Jiang, L.; Wang, L. A Rogowski Digital Integrator with Comb Filter Signal Processing System. IEEE Trans. Plasma Sci. 2018, 46, 1338–1343. [Google Scholar] [CrossRef]
  27. Haque, M.E.; Sakib Khan, M.N.; Islam Sheikh, M.R. Smoothing control of wind farm output fluctuations by proposed Low Pass Filter, and Moving Averages. In Proceedings of the 2015 International Conference on Electrical Electronic Engineering (ICEEE), Rajshahi, Bangladesh, 4–6 November 2015; pp. 121–124. [Google Scholar] [CrossRef]
  28. Bruno, S.; Giannoccaro, G.; Scala, M.L.; Lopopolo, G. First activities and power-hardware-in-the-loop tests at the public research laboratory LabZERO. In Proceedings of the 2018 110th AEIT International Annual Conference, AEIT 2018, Bari, Italy, 3–5 October 2018; pp. 1–6. [Google Scholar] [CrossRef]
  29. De Carne, G.; Bruno, S.; Liserre, M.; La Scala, M. Distributed Online Load Sensitivity Identification by Smart Transformer and Industrial Metering. IEEE Trans. Ind. Appl. 2019, 55, 7328–7337. [Google Scholar] [CrossRef]
  30. Donnini, G.; Carlini, E.; Giannuzzi, G.; Zaottini, R.; Pisani, C.; Chiodo, E.; Lauria, D.; Mottola, F. On the Estimation of Power System Inertia accounting for Renewable Generation Penetration. In Proceedings of the 2020 AEIT International Annual Conference (AEIT), Catania, Italy, 23–25 September 2020; pp. 1–6. [Google Scholar] [CrossRef]
  31. ENTSO-E. Future System Inertia 2; Technical Report; ENTSO-E: Brussels, Belgium, 2020. [Google Scholar]
Figure 1. Scheme of the investigated SI controller.
Energies 15 03016 g001
Figure 2. Power hardware-in-the-loop test equipment.
Energies 15 03016 g002
Figure 3. Power system model with synthetic inertia contribution.
Energies 15 03016 g003
Figure 4. Frequency and active power trajectories without SI control.
Energies 15 03016 g004
Figure 5. Block diagram of the SI controller simulated with the RTDS.
Energies 15 03016 g005
Figure 6. Ideal SI controller: frequency response with different gain K.
Energies 15 03016 g006
Figure 7. Ideal controller: BESS active power response with different gain K.
Energies 15 03016 g007
Figure 8. Ideal controller: frequency response with different RoCoF reporting time and K = 10.
Energies 15 03016 g008
Figure 9. Ideal controller: BESS active power response with different RoCoF reporting time and K = 10.
Energies 15 03016 g009
Figure 10. Real controller: frequency response without filters on frequency measurements (K = 10).
Energies 15 03016 g010
Figure 11. Block diagram of the actual SI controller.
Energies 15 03016 g011
Figure 12. Frequency measured by the controller vs. ideal simulated frequency.
Energies 15 03016 g012
Figure 13. RoCoF measured by the controller vs. ideal simulated RoCoF.
Energies 15 03016 g013
Figure 14. Real controller: frequency response with different gain K.
Energies 15 03016 g014
Figure 15. Real controller: BESS active power response with different gain K.
Energies 15 03016 g015
Figure 16. Real controller: frequency response with different reporting time and smoothing factor (K = 10).
Energies 15 03016 g016
Table 1. Power system model coefficients.
R T G T T 1 T T 2 T T 3 HD SF
[p.u.][s][s][s][s][s] [p.u./kW]
0.0500.202.12.17.33.00.0200.0116
Table 2. Ideal synthetic inertia controller: characteristics of the frequency step response.
Gain K
[A/(Hz/s)]
Frequency Reporting Time
[s]
Fall Time
[s]
Average RoCoF
[Hz/s]
Time nadir [s]Frequency nadir [Hz]Overshoot [%]Settling Time [s]
0-0.2420.8241.61649.2110.0505.063
10inst.0.3070.6502.28549.3640.05710.764
15inst.0.3100.6452.48349.3960.06811.896
20inst.0.3120.6402.67249.4170.07612.800
25inst.0.3210.6232.77049.4300.08013.547
100.0500.2780.7202.25449.3670.05610.795
100.1000.2600.7692.20949.3710.05310.842
100.1500.2430.8242.18149.3800.04910.949
Table 3. Real synthetic inertia controller: characteristics of the frequency step response.
Gain K
[A/(Hz/s)]
Frequency Reporting Time
[s]
Alpha α Fall Time
[s]
Average RoCoF
[Hz/s]
Time nadir [s]Frequency nadir [Hz]Overshoot [%]Settling Time [s]
0--0.2420.8241.61649.2110.0505.063
10∼0.0500.100.2460.8121.94849.4160.04711.792
15∼0.0500.100.2490.8012.30049.4570.05113.049
20∼0.0500.100.2490.8012.64149.4650.05513.825
25∼0.0500.100.2500.7992.41949.4750.05415.155
Table 4. Real synthetic inertia controller: comparison of frequency step response with different reporting time.
Gain K
[A/(Hz/s)]
Frequency Reporting Time
[s]
Alpha α Fall Time
[s]
Average RoCoF
[Hz/s]
Time nadir [s]Frequency nadir [Hz]Overshoot [%]Settling Time [s]
0--0.2420.8241.61649.2110.0505.063
10∼0.0500.100.2460.8121.94849.4160.04711.792
10∼0.0500.250.2510.7972.28549.3860.05413.526
100.1000.100.2440.8171.49649.3930.04711.785
100.1000.250.2460.8122.10049.4100.04711.663
Publisher’s Note: MDPI stays neutral with regard to jurisdictional claims in published maps and institutional affiliations.

