Article

Home Energy Management Considering Renewable Resources, Energy Storage, and an Electric Vehicle as a Backup

ISEN Yncréa Ouest Brest, LABISEN, 20, Rue Cuirassé Bretagne, 29200 Brest, France
*
Author to whom correspondence should be addressed.
Energies 2022, 15(8), 2830; https://doi.org/10.3390/en15082830
Submission received: 14 February 2022 / Revised: 2 April 2022 / Accepted: 4 April 2022 / Published: 13 April 2022

Abstract

:
The vehicle-to-grid concept emerged very quickly after the integration of renewable energy resources because of their intermittency and to support the grid during on-peak periods, consequently preventing congestion and any subsequent grid instability. Renewable energies offer a large source of clean energy, but they are not controllable, as they depend on weather conditions. This problem is solved by adding energy storage elements, implementing a demand response through shiftable loads, and the vehicle-to-grid/vehicle-to-home technologies. Indeed, an electric vehicle is equipped with a high-capacity battery, which can be used to store a certain amount of energy and give it back again later when required to fulfill the electricity demand and prevent an energy shortage when the main-grid power is limited for security reasons. In this context, this paper presents a comparative study between two home microgrids, in one of which the concept of vehicle-to-home is integrated to provide a case study to demonstrate the interest of this technology at the home level. The considered microgrid is composed of renewable energy resources, battery energy storage, and is connected to the main grid. As the vehicle is not available all day, in order to have consistent results, its intervention is considered in the evening, night, and early morning hours. Two case studies are carried out. In the first one, the vehicle-to-home concept is not taken into account. In this case, the system depends only on renewable resources and the energy storage system. Subsequently, the electric vehicle is considered as an additional energy storage device over a few hours. Electric vehicle integration brings an economic contribution by reducing the cost, supporting the other MG components, and relieving the main grid. Simulation results using real weather data for two cities in France, namely Brest and Toulon, show the effectiveness of the vehicle-to-home concept in terms of cost, energy self-sufficiency, and continuity of electrical service.

1. Introduction

Vehicle-to-grid ( V 2 G ) could be considered as the biggest technological advancement since renewable energy resources (RER) became commercially viable [1]. With more than 3 million EVs worldwide [2], these EVs are used only about 5 % of the time; the rest of the time they are parked when the owners are working or at home [3]. EVs can be used for a secondary role during the 95 % of available time. Indeed, electric vehicles (EV) with a large battery can recover energy produced by RER, which would otherwise be lost. In this case, the EV functions as a secondary storage system. In the opposite case, where production is low, the storage systems and the main grid intervene by sending the missing energy, to achieve the production consumption balance. This demand for energy can overload the grid and cause blackouts or voltage and frequency drops. To relieve the grid, the energy it supplies can be limited to a certain amount, the rest being supplied by the EV as it discharges. In some cases, for same precedents reasons, it can be possible to sell the energy stored in the EV to the grid. In this case, the EV functions as a secondary energy source; hence, the concept of V 2 G [4,5].
The microgrid (MG) concept has emerged for the optimal integration of renewable energy resources, energy storage systems (ESS), and shedding loads, which may include EVs. The integration of EVs must not change the roles of the MG elements, both in grid-connected or islanded modes, i.e., to supply a given load at a given time. RER must be exploited to the maximum, by implementing maximum power point tracking (MPPT) and excess energy is stored in ESS. In the V 2 G concept, EVs represent a secondary production and storage system in the MG. One of the advantages of bi-directional energy in the V 2 G concept is the exchange of energy between EVs [6]. However, it is mandatory to consider the degradation of the EVs batteries while implementing V 2 G technology. Optimal MG sizing is one of the studies to be conducted for V 2 G concept integration. It involves many aspects that need to be addressed, including the appropriate RER technologies with the optimal siting and the environment considered. Moreover, other considerations should be taken into account, such as improving conversion efficiency at charging stations, transmission efficiency and loss minimization, optimal control of operation, the need for adequate loads that better match the generation elements, and, finally, the type, capacity, and number of EVs needed for safe and reliable operation [7]. As a result, interest in EV technologies has increased considerably in recent years, resulting in several scientific publications on the subject [8,9]. Moreover, the market share of EVs is expected to grow exponentially. Most of the research deals with very important topics such as energy efficiency [10], EV charger topologies and the impact of charging on the network [11], communication architecture [12], degradation of the vehicle battery [13], frequency regulation [14], and the support provided to the integration of RERs [15], mode of payment [16], etc.
Several technical aspects have been investigated in the literature. Indeed, an EV can be considered as a storage medium for RERs depending on the availability and states of charge of the EVs. In [17], Hasan and Elyas aim to optimise the operation of EVs in order to mitigate the intermittency of RERs and to reduce energy costs by minimising the charge/discharge cycles of vehicle batteries to avoid their degradation. In [18], Abdul et al. proposed a new formulation for the design and management of grid-connected EV charging stations with integrated solar panels. In [19], Mehdi et al. examined the value of the V 2 H concept at the building level, and whether it can operate in an islanded mode by introducing PV as an energy source to relieve the grid. One of the cited advantages of V 2 H is the support it provides to the grid. In fact, an EV parked at home during peak hours can power appliances. In [20], Philipp et al. assessed the ability of the expanded German transmission network to cope with the additional demand due to the integration of electric vehicles using a transmission problem formulation. In [21], authors presented an EMS of an energy system composed of main grid, load, and a fleet of EVs. The scheduling of EV charging/discharging can be done 24 h in advance, which allows for voltage and frequency regulation in the grid. The EV can sometimes be used as a back-up when the house is disconnected from the grid or when a blackout has occurred. Critical loads will be connected directly to the vehicle, to ensure the continuity of supply for the user’s comfort. In [22], Vítor et al. designed a V 2 H , such that the EV intervenes during power outages. In [23], Hasan presented a model that significantly improves the energy resilience of a building based on PV, a battery for storage, and an EV for V 2 H operating in connected and islanded mode over a few hours. The coordination of the EV and the battery allows one to respond to the load after failures in the grid and PV. Furthermore, an EV can be added to increase battery lifetime. Since the vehicle’s storage capacity is greater than the battery’s, the vehicle will experience fewer charge/discharge cycles, and, therefore, reduce the charge/discharge cycles of the battery without degrading its battery too much [24]. Finally, an EV can allow for an efficient management of load shedding [25].
The economic perspective has been investigated in some studies. In [26], Sangyoon and Dae-Hyun presented a hierarchical deep reinforcement learning method for energy management of household appliances considering RER, ESS, and EVs. They consider four study cases: two during the week with different weather data, and two during the weekend, with different vehicle states of charge. They find that the energy cost decreases significantly in the cases where the RERs are productive. The presence of the vehicle at home during the weekend is very cost effective due to its high storage capacity. In [27], Harun and Seddik developed seven optimal strategies studied on 1000 use cases and with four different daily energy price profiles in order to reduce the vehicle charging cost. A V 2 G algorithm named Optimal Logic Control based on series of logic commands has been developed. The results show the advantage of this algorithm over the traditional optimal charging strategies available in the literature. The algorithm is mainly made to be very efficient when the selling price/purchase ratio is greater than one, allowing the user to earn money. In [28], Sausen et al. proposed a model for coupling an EV to a smart home containing PV and batteries, having the objective of achieving cost minimization that was conditional on maximizing vehicle efficiency. Four scenarios are considered: in the first one, uncontrolled EV charging was adopted; in the second one, economic charging was applied; in the third one, economic EV charging was adopted, including distributed generation; and in the fourth one, economic EV charging was considered, with distributed generation and V 2 H operation. The results show that the peak consumption has been reduced thanks to the intervention of the EV and the bill has been decreased. In [29], Xuan et al. proposed a strategy to extend the lifetime of the batteries, such that the batteries operate when there is a surplus of RER production and when electricity prices increase during peak hours. The results show the effectiveness of this strategy, as when the battery discharge cost is higher than the market energy price, no power is supplied by the batteries, and conversely, when the discharge cost is lower than the market energy price, the power demanded is first supplied by the batteries, then, if the load is very high, the grid is allowed to supply the remaining load.
There is a lot of literature on V 2 G , but the V 2 H concept is not thoroughly addressed, as most research studies focus on the interaction of electric vehicles with the electric grid. Additional research is needed to address the cost of implementing the V 2 H concept and its profitability. In this context, this paper presents a sizing and optimization study of a MG operating in a grid-connected mode at the home level. The MG is composed of PVs and WT as RER, a battery as ESS, and a domestic load. The EV is used as a secondary energy storage device, which allows for the enhancement of the overall MG performance. This study concerns two aspects that are related to MG optimal sizing and smart day-ahead energy management. Two case studies are considered in this paper: a first grid-connected MG with only RERS and ESS is investigated; next, a second grid-connected MG with the integration of RERs, ESS, and an EV is implemented and the results are compared. An economic study is performed to investigate the advantages offered by the use of the EV and the interest of V 2 H technology in terms of energy supply reliability, cost reduction, and grid support during congestion periods. Simulation results are presented using actual weather data from two cities, which are Brest (cold climate) and Toulon (hot climate) in France. Generally speaking, the contributions targeted in this work are threefold:
  • Optimal sizing of a home MG considering actual weather data, energy price, EV batteries as a secondary ESS and limiting the grid power for enhancing the energy self-consumption;
  • Energy management system taking into account the availability of the EV;
  • Investigate the economic profitability of V 2 H for the users by considering the electric vehicle as backup in order to mitigate the grid congestion.
This article is organised as follows: Section 2 presents the proposed MG architecture, presenting the used renewable energy resources and energy storage devices. Section 3 describes the MG optimal sizing and energy management considering two aspects, which are optimal energy dispatching and economic viability. Section 4 discusses the simulation results for the two considered case studies for two different cities in France. Finally, Section 5 concludes this paper and gives some perspectives for future work.

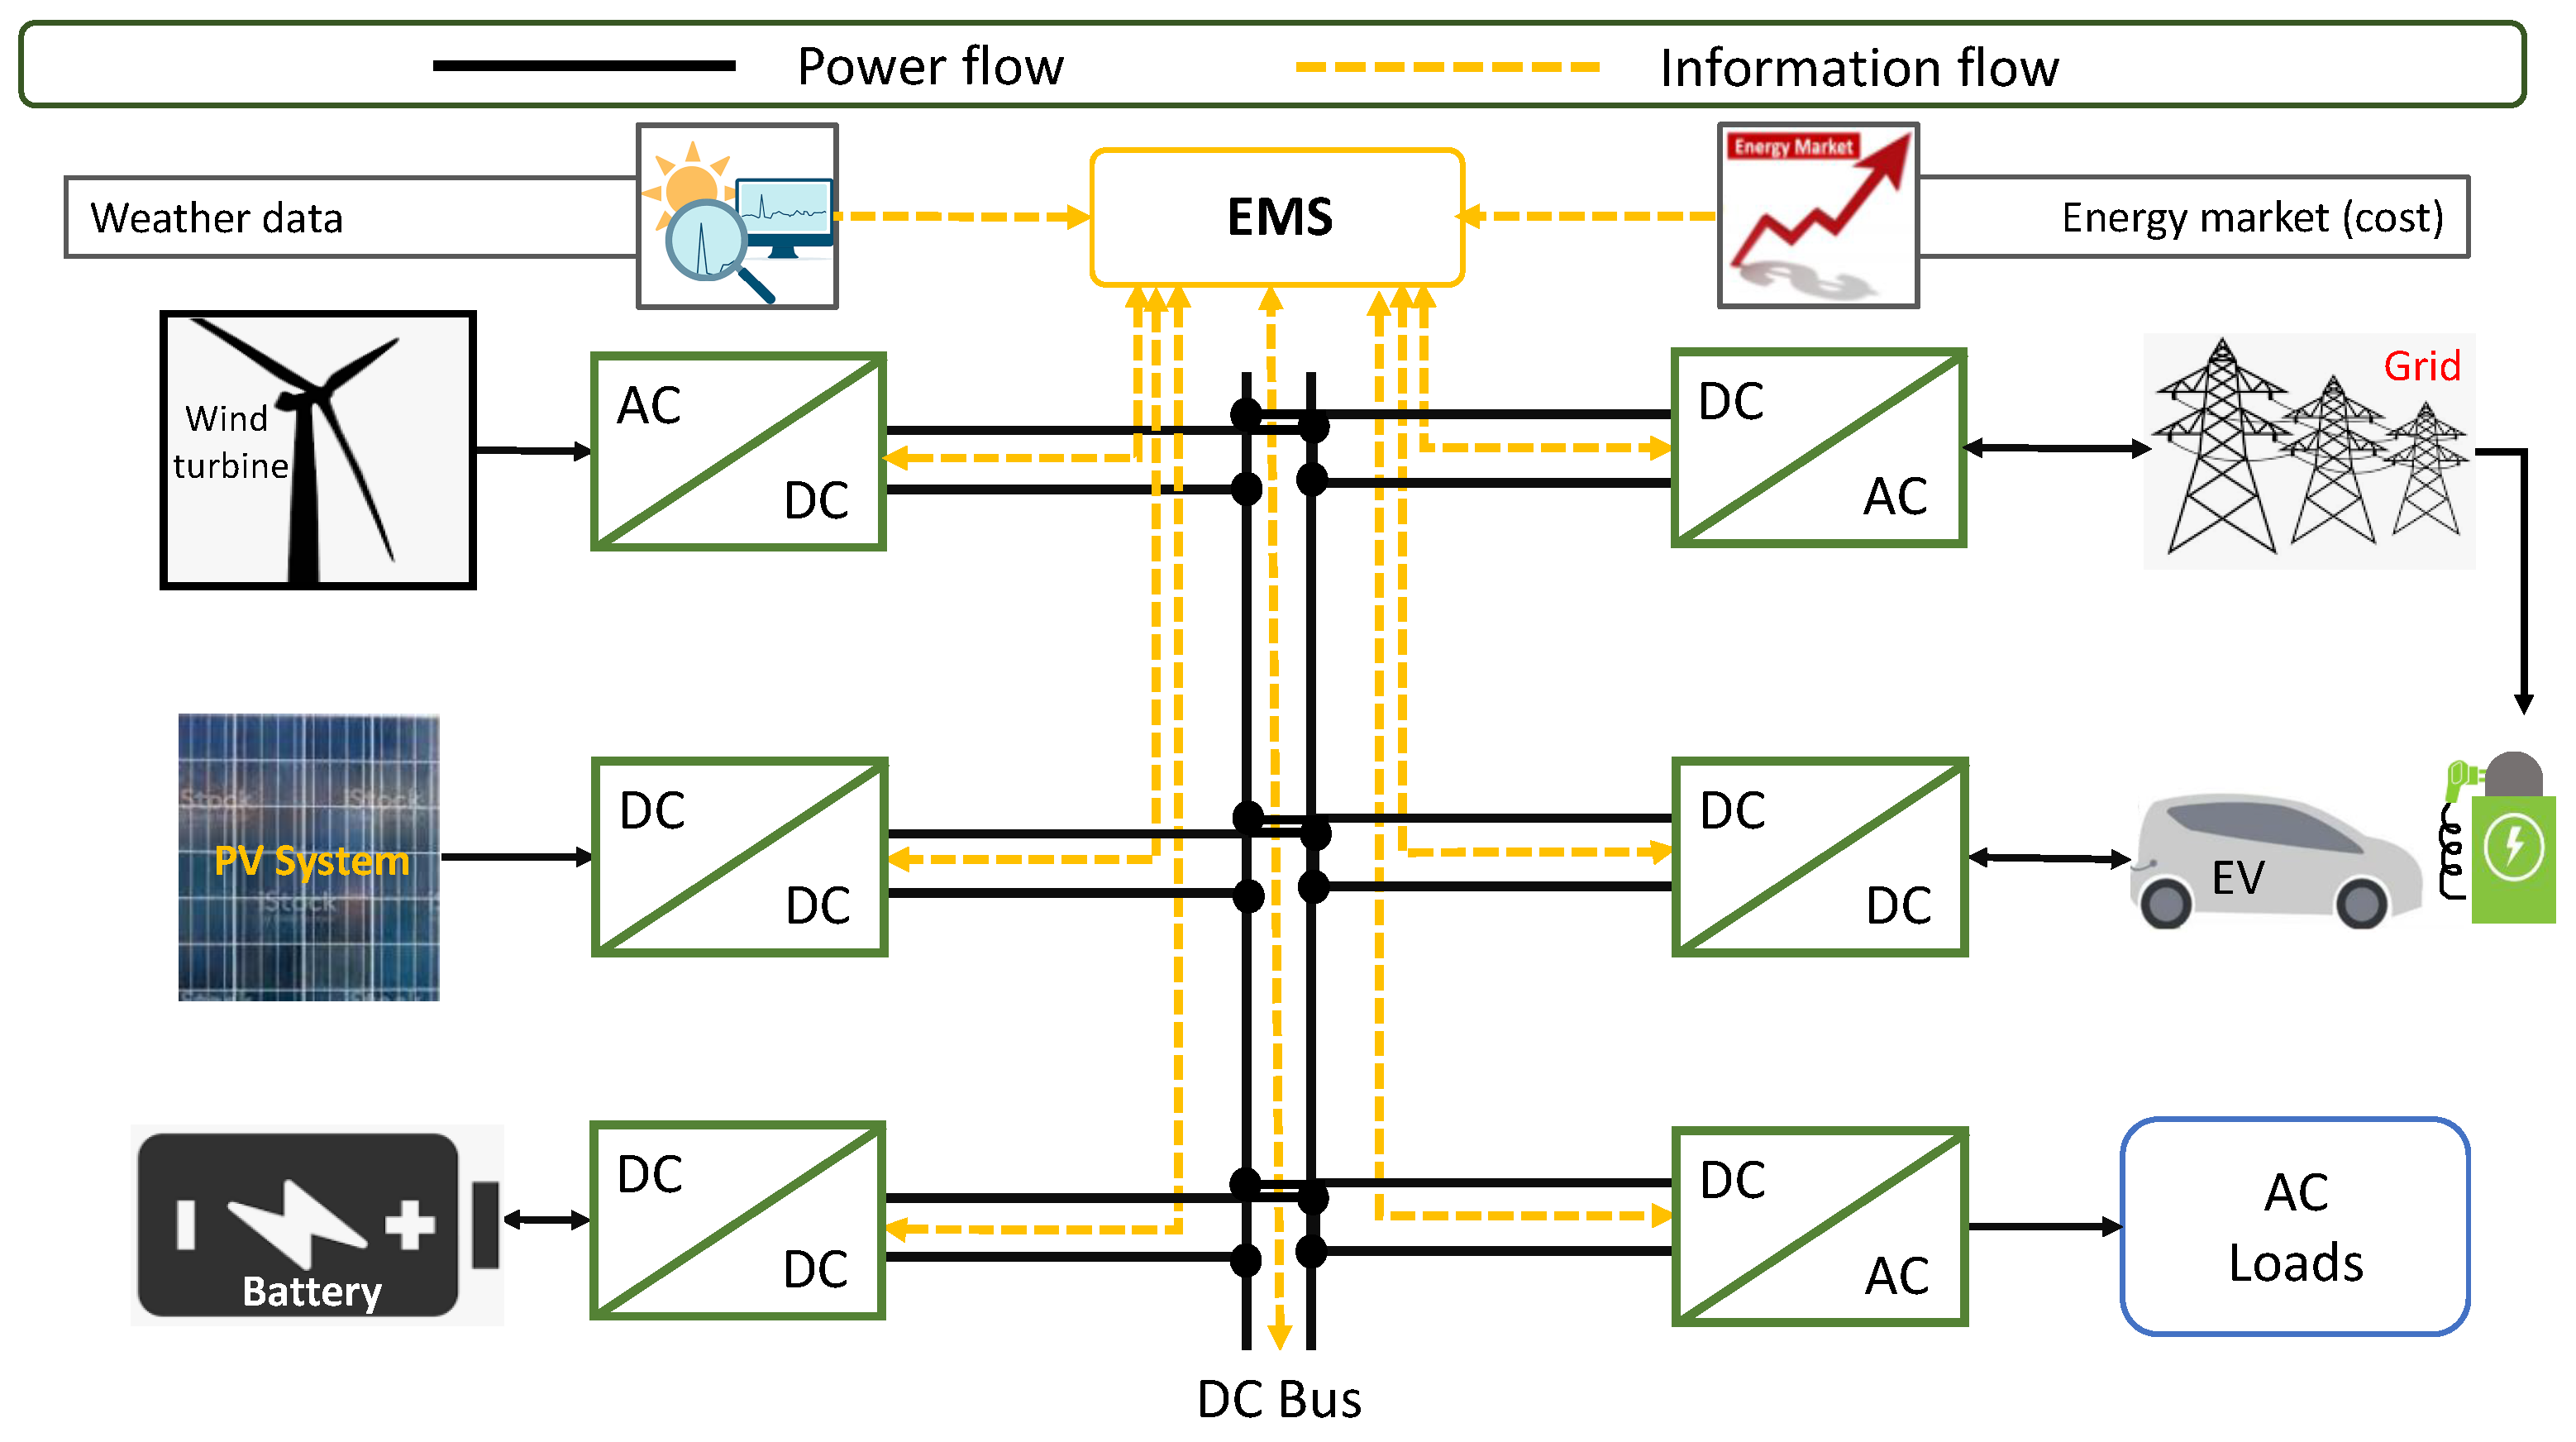
2. Microgrid Architecture

A home microgrid, which implements the V 2 H concept, is designed for the relief of main grid constraints. The MG is operated in grid-connected mode and consists of PV, WT, battery energy storage, and an EV. The architecture of the MG is presented in Figure 1. All components are linked to the DC bus through D C / D C converters (PV, batteries, and EV) or A C / D C converters (WT and grid). The PV and WT produce a quantity of energy depending on weather conditions, which does not always match the load demand. There are two possible scenarios: energy production is insufficient or, conversely, there is surplus energy generation. Energy storage and the main grid allow for the buffering of insufficient or excess power generation. Indeed, the battery and grid can restore the production/consumption balance by supplying the lack of energy or, conversely, by absorbing excess energy. Since the energy absorbed/fed by the battery is limited by its SOC and its maximum power, and since grid power can also limited, an EV can be used as an additional backup energy storage. Indeed, an EV can be charged through public charging stations or when parked at home. In order to support the grid and ensure the continuity of electricity supply, it can have a bidirectional energy exchange with the home MG.

2.1. Home MG Components

The choice of MG components is based on the maturity of the distributed energy resources (DER) and the efficiency of the ESS. Currently, the most mature RER is PV, which is the most mastered and used by researchers in projects aiming to achieve autonomous systems, relieve the grid, or produce clean energy. The PV used in this project is monocrystalline panels, which are suitable for cold climates, while polycrystalline panels are more suitable for warm climates [30]. A domestic wind turbine is the second mature renewable technology, known as an individual wind turbine [30]. WT is mainly installed at small-scale residential customers. It can also be used to power larger loads, such as small businesses and agricultural fields. The interest of this installation is to satisfy a part of the load, reducing the dependence on the power grid. Two classes of these wind turbines can be distinguished: vertical-axis wind turbines and horizontal-axis wind turbines. In the considered MG, the installed wind turbine is a horizontal-axis configuration with three blades, a drive train consisting of a gearbox and a generator, and a tower to support the rotor.
The considered battery in this study is a lithium-ion battery. It is lighter than a lead-acid battery (five times lighter), has a long lifespan (1500 cycles), and is more resistant to deep discharges. New trends in the use of batteries for energy systems focus on integration with multiple RERs (PV, WT, etc.) and also on the integration with other energy storage systems that complement them [31]. This trend fits perfectly with the proposed MG, which includes PV and WT as well as an EV as an additional energy storage device.
The installed PV and WT maximum power and battery capacity are unknown and are computed by the optimisation program based on the load data, weather data, grid energy cost, renewables and battery investment cost, battery power limits, grid power limits, and battery capacity of the EV. Subsequently, an optimal energy dispatching is computed, which determines the power flows between all components within the battery power and capacity limits, grid limits, RER availability, and EV displacement, considering the economic aspects.

2.2. Modeling of the Renewable Resources and Energy Storage Devices

PV panels and wind turbines are considered as energy resources in this study. The following subsections describe these renewable resources modeling for optimal sizing and smart energy management.

2.2.1. PV Panels

The power generated by the PV panels depends on the installed maximum power and weather conditions. The PV output power depends on the irradiance, the efficiency of the generation, the area of the panels and the optimal orientation depending on the location. The chosen PV technology has an efficiency η p v = 15 % . The power produced by PV over a day is given as follows:
P P V ( t ) = η P V · S P V · P I r r ( t ) ;         1 < t < 24   h
where:
  • S P V is the PV panels area in m 2 ;
  • P I r r ( t ) corresponds to the irradiance in the considered location W/m 2 ;
  • η P V stand for the chosen PV technology efficiency.

2.2.2. Wind Turbine

A wind turbine has an output power that mainly depends on its radius and the wind speed in the considered area. The other variables are constants, such as air density ( ρ = 1.225 kg/m 3 ), or can be considered as constants by setting them to a value given by the control algorithm by implementing maximum power point algorithm (MPPT), such as the power coefficient ( C p = 0.4 ). The electrical power extracted by a wind turbine is as follows:
P W T ( t ) = 1 2 · ρ · C p · π · R W T 2 · V W i n d ( t ) 3 ;         1 < t < 24   h
where:
  • R W T is the wind turbine radius in m;
  • V W i n d corresponds to wind velocity, in m/s.

2.2.3. Energy Storage Devices: Battery and EV

The energy supplied by the battery and the EV depend on their capacity and their state of charge (SOC). Moreover, the output power is limited to enhance the lifespan of energy storage devices. The SOC represents the ratio between the energy contained in the battery (respectively, EV battery) and its maximum capacity (respectively, EV battery capacity). The SOC of the battery (respectively, EV battery) depends on the power supplied or recovered by the battery (respectively, EV battery), the time of application of this power ( δ t = 1 h), and its maximum capacity (respectively, EV battery capacity). The SOC varies from one hour to another and can increase during charging and decrease during discharging. The SOC for both the battery and the EV battery is given by the following formula:
S O C b a t ( t ) = S O C b a t ( t 1 ) P b a t ( t ) · d t E b a t m a x ;         1 < t < 24   h
S O C E V ( t ) = S O C E V ( t 1 ) P E V ( t ) · d t E E V m a x ;         1 < t < 24   h
where:
  • S O C b a t ( t ) and S O C E V ( t ) correspond to battery and EV battery state of charge at time t;
  • P b a t ( t ) and P E V ( t ) stand for power of battery and EV battery. This power can be either positive or negative depending on the operation conditions;
  • E b a t m a x and E E V m a x are the maximum battery and EV energy capacity.

3. Optimal Sizing and Planning of a Home MG with V 2 H Technology

A domestic MG with V 2 H concept optimization is carried out in two steps, which are the optimal sizing and the energy management system (EMS), as shown in Figure 2. MG sizing is performed based on the weather data, the market energy cost, and the investment cost, all while fulfilling the technical constraints. Next, an optimal energy management algorithm is proposed considering that the home MG is optimally designed. In this section, the objective of the proposed energy management system is presented, which is mainly related to the sizing and the minimisation of the energy cost over 20 years of operation of the MG while integrating the V 2 H technology.

3.1. Energy Management Strategy

The objective in this work is to achieve a V 2 H system with maximum autonomy and minimum energy cost. Figure 3 shows the scheme of the proposed energy management algorithm. Five different layers can be distinguished in this energy management strategy. Indeed, in order to ensure maximum autonomy and favour the use of renewable energy, the load has to be fed by RERs at any time. On-maximum power point tracking (On-MPPT) mode is prioritized. Depending on the value of net power P n e t = P L o a d ( P P V + P W T ) , there are three possible scenarios as follows:
  • P n e t = 0 : Renewables fully satisfy the load and there is no need for energy from battery, power grid, and EV;
  • P n e t > 0 : In this case, the battery, the grid, and the EV are required the complement renewables underproduction. The use of each of these resources depends on batteries state of charge, power limitations, and EV availability;
  • P n e t < 0 : Battery free capacity is used to store the overproduction. If the battery is fully charged or the required power is higher than the maximum power, the excess power is supplied to the grid. However, if the EV is available or the grid power is not within its power limitations, the EV battery is used as a backup energy supply.
In the renewables underproduction situation, the first element that will intervene is the battery. This step is shown in purple on the algorithm diagram. On one hand, if the battery is sufficiently charged and the power demand does not exceed the maximum discharge power specified by the manufacturer, the battery provides the power required to ensure the generation/consumption power balance. On the other hand, if the discharge power exceeds the maximum acceptable battery discharge power, battery provides its maximum power while the remaining power is provided by the grid, as shown by the yellow stage in the EMS scheme. Even though the grid can be considered as a large energy resource, its power can be limited for security and reliability reasons (to prevent overload, for example). If the power demand does not exceed grid power limitations, the load is supplied by the grid. Otherwise, the EV is used as a backup to ensure the electricity continuity of service, as shown in the pink section of the algorithm. A final situation can occur for which the EV maximum power is exceeded or the EV state of charge does not allow the use of the EV battery. In this case, a load shedding is required as depicted by the grey part of the EMS scheme.
Conversely, in an overproduction situation, the battery is first used to store the excess energy generation, as shown by the purple section of the algorithm. If the battery is fully charged or the required power exceeds the maximum charge power given by the manufacturer, the main grid intervenes to guarantee the generation/consumption balance (yellow part of the diagram). As previously specified, the grid power is limited to enhance the system reliability and improve autonomy, which is the reason why the EV is used to store a part of the produced energy if the grid maximum power is achieved, as described in the pink part of the energy management strategy. Finally, if the EV is not available or the EV battery is fully charged, renewables are operated in off-MPPT mode in order to reduce energy production (grey part).

3.2. Objective Function

The objective of this work is to design an optimal home MG, which minimizes the investment and energy costs while ensuring the integration of V 2 H technology. This is done by maximizing home autonomy and reducing the energy issued from the grid. The optimization is performed over 20 years, taking into account weather data, grid energy price, and investment costs. The investment cost includes all equipment, namely PV panels, a wind turbine, batteries, power electronics, and cables, purchase and installation, and the operating and maintenances costs. The energy cost, however, mainly consists of the energy bills from the grid operator. The objective function is to ensure the optimal operation of the microgrid by minimizing its operating cost. Indeed, the area of the PV panels and the wind turbine power should be minimized to satisfy the load while minimizing the energy cost. Moreover, battery installed capacity should be optimized by taking into consideration its degradation cost. Consequently, the cost function to be optimized can be expressed as follows:
C o s t = C i n v + C e n e
where:
  • C i n v corresponds to the investment cost, which is given by:
    C i n v = C P V · P P V i n s + C W T · P W T i n s + C B a t · E b a t m a x
    with:
    C P V , C W T , and C B a t are PV panels cost in (€/W), WT cost in (€/W) and battery cost in (€/J), respectively;
    P P V i n s , P W T i n s , and E b a t m a x are the installed PV power, wind power, and battery capacity, respectively.
  • C e n e stand for the energy cost of the power provided by the main grid. It can be expressed as follows:
    C e n e = C g · i = 1 20   years ( t = 1 24   h ( P g i ( t ) ) )
    with:
    C g corresponds to the grid energy cost, which is variable during the day: On peak periods have higher price than off-peak periods;
    P g i ( t ) is the power fed or supplied by the power grid, which is minimized in this study.

3.3. System Constraints

3.3.1. Generation/Consumption Balance and Power Limitations

Minimizing the previously presented cost function is performed while respecting constraints related to each component of the home MG. The production/consumption balance is the main constraint of the system. To ensure a continuous and reliable power supply, the energy supplied by the RERs, the batteries, the grid, and the EV must be equal to the power required by the load at any time. This constraint is provided in Equation (8). Energy conversion efficiency is considered to account for the losses that occur when charging or discharging batteries or the EV battery. To express these losses in the power balance, the charging power is divided by the charging energy conversion efficiency ( η b a t c h a = η E V c h a = 0.9 ) and the discharging power is multiplied by the discharging energy conversion efficiency ( η b a t d i s c h = η E V d i s c h = 0.9 ). Equation (9) represents the new power balance constraint. Where P b a t + ( t ) , P g + ( t ) , and P E V + ( t ) correspond to power supplied to the load and P b a t ( t ) , P g ( t ) , and P E V ( t ) stand for power fed to battery, power grid, and EV, respectively. Equations (10)–(12) describe the fact that these energy resources cannot charge and discharge at the same time. Moreover, to ensure that the battery, main grid, and EV do not exchange energy with each other, the constraint in Equation (13) is added. This is mainly set to minimize losses introduced by the energy conversion between these elements.
Equations (14) and (15) are set to ensure that the battery and EV battery recover its initial state of charge at the end of each day. To ensure this, the battery and EV provide a quantity of energy during underproduction periods, which is recovered during overproduction periods. Since the EV is not available all the day, it can be used only for a certain period of the day as specified by Equation (16). Finally, the power supplied (absorbed) by the battery is limited because of the characteristics of the conductors and switches, as shown by Equation (17). In addition of that, grid power should be limited to increase autonomy and avoid overloading. Its power is limited between minimum and maximum values as depicted by Equation (18).
P L o a d ( t ) = P P V ( t ) + P W T ( t ) + P b a t ( t ) + P g ( t ) + P E V ( t )   ;         1 < t < 24   h
P L o a d ( t ) = P P V ( t ) + P W T ( t ) + η b a t d i s c h · P b a t + ( t ) 1 η b a t c h a · P b a t ( t ) + P g + ( t ) P g ( t ) + η E V d i s c h · P E V + ( t ) 1 η E V c h a · P E V ( t )   ;         1 < t < 24   h
P b a t + ( t ) · P b a t ( t ) = 0   ;         1 < t < 24   h
P g + ( t ) · P g ( t ) = 0   ;         1 < t < 24   h
P E V + ( t ) · P E V ( t ) = 0   ;         1 < t < 24   h
| P E V ( t ) | + | P b a t ( t ) | + | P g ( t ) | = | P E V ( t ) + P b a t ( t ) + P g ( t ) |     ;     1 < t < 24   h
t = 1 24   h P b a t ( t ) = 0
t = 1 24   h P E V ( t ) = 0
P E V + ( t ) = P E V ( t ) = 0     ;         8 < t < 18   h
P b a t m i n   < P b a t ( t ) < P b a t m a x     ;         1 < t < 24   h
P g m i n   < P g ( t ) < P g m a x     ;         1 < t < 24   h

3.3.2. Renewable Resources and ESS Constraints

The installed PV power is determined by the optimisation algorithm. This power depends on the peak irradiation and is limited by the available area on the roof of the house. Equation (19) ensures that the area is within the tolerated limits. The installed wind power depends on the peak value of the wind speed. The radius of the turbine is also limited by a maximum value. This maximum value should not exceed the value tolerated for domestic installations in urban areas and it cannot be negative, which is expressed by the constraint in Equation (20).
0 < S P V < S l i m i t
0 < R W T < R l i m i t
To ensure maximum lifespan (maximum cycles) for the battery and the EV battery, minimum SOC should be limited. On one hand, to ensure a safe operation of batteries (respectively EV battery), the SOC is limited by an upper limit, equal to 1. On the other hand, batteries (respectively, EV battery) usually have a maximum DOD set by the designer, indicating that by respecting this DOD the battery (respectively, EV battery) will be able to be operated at the maximum of charge/discharge cycles. SOCs for both the battery ESS and EV battery are then limited by a lower limit equal to the DOD for the whole day. These constraints are presented in Equations (21) and (22). Maximum battery capacity to be installed is optimized and is consequently limited to a reasonable capacity, denoted C b a t m a x , as expressed by Equation (23).
D O D b a t   <   S O C b a t ( t )   <   1 ;         1 < t < 24   h
D O D E V   <   S O C E V ( t )   <   1 ;         1 < t < 24   h
0   <   E b a t m a x   < C b a t m a x
with:
  • S O C b a t ( t ) and S O C E V ( t ) are state of charge of battery ESS and EV battery;
  • E b a t m a x is the installed battery capacity that need to be optimized, which is limited by a maximum capacity C b a t m a x ;
  • D O D b a t and D O D E V are depth of discharge of battery ESS anf EV battery.

4. Simulation Results

Numerical studies have been carried out to investigate the benefits of integrating EVs in terms of financial benefits, optimal sizing, and guaranteed energy autonomy by limiting power issued from main grid. From Equations (6) and (9), it is possible to distinguish decision variables, which must have the optimal values to minimize the total cost while respecting constraints; mainly the power balance constraint. The decision variables are:
  • Grid power: P g + ( t ) and P g ( t ) ;
  • Charging and discharging power of the battery: P b a t + ( t ) and P b a t ( t ) ;
  • Battery capacity: E b a t m a x ;
  • PV and WT dimensions: S P V and R W T ;
  • The evolution of renewable powers during a day: P P V ( t ) and P W T ( t ) ;
  • Vehicle charging and discharging powers: P E V + ( t ) and P E V ( t ) .
The dealt with problem is a constrained non-linear optimization problem, which is described by Figure 4. The model is characterised by non-linear equality constraints and non-linear inequality constraints. In addition to these constraints, it is mandatory to define a set of lower and upper bounds on the design variables so that the solution is always in the specified range, such as the limits of the PV area and the radius of the wind turbine.
The sizing and energy management system is formulated as an optimization problem and is solved using the following method based on the Interior-point algorithm [32] using MATLAB software:
min x f ( x ) , s . t . : C ( x ) 0 C e q ( x ) = 0 A × x b A e q × x = b e q l b x u b
With:
  • x: Decision variables;
  • A × x b : Linear inequality constraints;
  • A e q × x = b e q : Linear equality constraints;
  • C ( x ) : Non-linear inequality constraints;
  • C e q ( x ) : Non-linear equality constraints.
This method fits the problem as it minimises a multivariate function; some variables are scalars and some are vectors. It allows one to compute the minimum of the objective function under non-linear equality and non-linear inequality constraints, with upper and lower bounds of the decision variables.
In the following, two case studies are presented and the results are discussed as follows:
  • Case study 1: Numerical studies for a grid-connected renewables-based MG without EV integration for Brest and Toulon;
  • Case study 2: Numerical studies for a grid-connected renewables-based MG with EV integration for Brest and Toulon.

4.1. Optimization Input Data

The investment, maintenance, and operating costs of PV, WT, battery, and grid energy costs are taken from [33], considering a lifetime of 20 years for PV and wind turbine, and 5 years for batteries. These data are provided in Table 1. Variable energy consumption for 24 h is considered in this study. Indeed, the used load profile is equivalent to the energy consumption of a small house with variable consumed power. Figure 5b shows the hourly load pattern of 24 h. Three load peaks can be noticed in the provided load profile: in the morning, at noon, and in the evening. The same consumer profile is considered for the two case studies and for the two cities for a fair and reliable comparison.
The weather data used for home MG optimal sizing and energy management system design are actual weather data issued from [34,35]. Numerical studies have been performed for two different cities in France considering a cold and hot climate for the sake of comparison and to prove the effectiveness of the proposed approaches for different climates and weather conditions. First, a cold city, namely Brest, is considered, which is characterised by high speed wind during a significant period of the year and low sunshine with high solar irradiance variability during the year. Second, Toulon, which is a city in the south of France, is considered. Toulon is characterised by higher constant irradiance compared to Brest, but it has less wind due to its geographical location. Weather conditions of these two cities are different, which is of great interest to show differences in terms of MG sizing, autonomy of the installation, and the economical benefits. Since the designed MG is connected to the main grid, the worst case is not presented hereafter. Indeed, yearly mean values are considered for both PV panels and wind turbine optimal sizing. The irradiance and wind curves for the considered cities are shown in Figure 5b and Figure 5c, respectively.
In the simulations carried out, all parameters to be optimized are bounded in order to get more realistic installation corresponding to urban usage. All decision variables’ boundaries are provided in Table 2, as described in the optimization problem constraints.

4.2. Simulation Results for Home MG without EV Integration

Simulations have been performed first for a home MG without considering EV usage. Hot and cold weather climate regions in France are selected to assess the renewable resources-based MG optimal design and, consequently, to study the output power and the economic benefits. The design results give the optimal sizing of the energy generation system and is given in Table 3.
These results are coherent since the solar energy potential in Toulon is higher than in Brest and wind power generation is more available in Brest. On one hand, the area of PV panels is larger in Toulon than in Brest, which is due to Toulon’s high solar energy potential compared to Brest. The installed power in Toulon is 3.84   kW , whereas in Brest it is equal to 2.58   kW . On the other hand, due to high wind speed in Brest, the installed wind power is higher than in Toulon. Indeed, wind power reaches 2.46   kW against 0.89   kW in Toulon. Battery capacity in Toulon is much higher than in Brest. This is mainly due to the fact that the net power, which represents the difference between energy consumption and the actual PV and WT energy generation is higher in Toulon. Indeed, the battery is the first component to intervene in the energy management algorithm in order to maintain the consumption/generation balance.
Once the optimal sizing is performed, a one-day simulation is performed in order to show the behaviour of the MG components. Hence, PV and WT energy generation in Brest and Toulon are provided in Figure 6. Figure 7 shows the total RER energy production and net power (difference between RER production and load consumption). Net power can be provided using battery ESS if the SOC and the required power are within the specified limits or using the main grid, as shown by Figure 8. The sum of the battery and grid powers is equal to net power at any time, which shows that the main constraint related to power balance is achieved. The constraint related to the prohibited exchange of power between the battery and the grid (in both directions) is also fulfilled during the day.
The variation of battery SOC is provided in Figure 8b. It can be noticed that the battery charges and discharges during the day while respecting the the specified DOD. The battery is safely operated, its SOC varies between the limits indicated in the constraints, which makes it possible to consider a lifetime of 5 years. It is also shown that the battery SOC at the end of the day is equal to the initial value.
The total energy from the grid before the integration of the RERs was 377.24 MWh during 20 years. This energy consumption issued from the grid is reduced to 92.2 MWh in Brest and 126.95 MWh in Toulon after the integration of the RERs, allowing an autonomy of 75.56 % in Brest and 66.35 % in Toulon. These results show the profitability of the system after 20 years of operation. Indeed, the total energy cost before the integration of the RER was 70,703 €. This energy cost is reduced to 40,449 € in Brest and 46,105 € in Toulon. The investment cost, the grid energy cost, and the autonomy in the considered cities are given in Table 4.

4.3. Simulation Results for a Home MG with EV Integration

A second case study has been investigated to assess the interest of integrating the V 2 H concept in a home MG in terms of energy self-sufficiency and total cost comprising the investment, operating and maintenance costs of the MG, and the energy bill from the main grid. Two operating conditions may arise during operation, which are the vehicle is parked at home and can be used as an additional ESS or the vehicle is in normal every-day use. In the last operating situation, the home MG is operated as in case study 1 operating conditions. Numerical studies have been conducted for the same domestic MG, taking into account the use of EV batteries and limiting the available main grid power. Indeed, another constraint is considered in this second case study in order to relieve the grid by limiting the power exchange with the main grid to ±1000 W. The same cities are considered for the sake of comparison. This allows for the studying of the power outputs of renewable resources, battery ESS, EV, and grid, as well as the economic benefits of the integration of EVs at domestic MGs.
Domestic MG optimal sizing results with the integration of the EV are provided in Table 5 for Brest and Toulon. The same conclusions can be drawn from these results as the results discussed in case study 1. Indeed, the solar energy potential of Toulon remains higher than that of Brest and vice versa for the wind energy generation. The battery ESS to be installed has increased as the grid power is severely limited to enhance the use of renewables and EV batteries, and, consequently, to limit the stress on the grid, especially during on-peak periods.
Renewable resources generated powers for 24 h are shown in Figure 9. It can be noticed that the integration of the EV as an additional ESS does not significantly change the sizing and the installed power of the RERs. It can be considered that renewable energy production mainly depends on meteorological data and these results allow for the extraction of the maximum energy from the RERs. The imbalance between renewable energy production and load consumption is shown in Figure 10. This imbalance is compensated for using battery-based ESS, the main grid, and the EV when the EV is parked at home. Otherwise, during EV daily use, only the battery-based ESS and the grid intervene to guarantee the production/consumption balance. System constraints are respected and power balance is achieved all the time. Moreover, there is no energy exchange between the battery, the grid, and the EV, as can be seen from Figure 11. Finally, the EV power exchange with a domestic MG and state of charge of the EV batteries are given by Figure 12. It can be seen that the EV is mainly used during periods where renewables energy generation is lower and load consumption is higher. This usage relieves the grid and decreases the energy bill.
EV usage in a home MG, even if limited to few hours, is still profitable because the home MG self-sufficiency is considerably increased in Toulon, which raises to 84.61 % , and slightly increases in Brest, being raised to 76.87 % , reducing the high electric network utilisation. The total cost for 20 years operation is 35,063 € in Brest and 38,827 € in Toulon. This allows financial savings of 5000 € and 8000 € in both cities, respectively compared to case study 1. The investment cost, battery energy, main grid energy, total energy cost, and achieved energy self-efficiency in the two considered cities are given in Table 6. It can be seen that the total cost is divided by almost 2 for the two cities. Moreover, the grid is relieved due to the use of the V 2 H concept and the energy bill is significantly decreased while achieving a very good autonomy.

4.4. Discussion

Numerical studies have proved that the integration of an EV in home microgrids has brought several benefits, starting with the economic gains, which is of interest for householders. Such financial savings encourage customers to switch to the V 2 H concept, given the reduction in the electricity bill and in the capacity of the installed battery ESS. The major disadvantage is the investment cost, which is still a bit expensive, but considering the duration of the project, this cost is quickly paid back in few years.
The second advantage to mention is the reduction of the energy provided by the main grid. Simulation results showed that the integration of an EV reduces the grid power and, consequently, lowers the stress on the grid, especially during congestion periods. The energy decreases from 92.2 MWh to 87.238 MWh in Brest, and it decreases by almost 50 % in Toulon as the energy issued from the main grid decreases from 126.95 MWh to 58.073 MWh. The EV battery provides a certain amount of energy when it is connected to the home MG, and, therefore, allows grid power limitation. If the V 2 H and V 2 G concept is further expanded, there will be a decrease in grid power and therefore fewer outages, fewer voltage and frequency regulation problems, and also fewer CO 2 emissions thanks to the massive use of local renewable resources.
In a home MG, battery power decreases after the integration of an EV as an additional ESS. This leads to the reduction of the number of cycles, and, therefore, the lifetime of the battery increases. The increase in lifetime induces financial savings as the operating and maintenance costs will straightforwardly decrease. Moreover, the installed battery capacity decreases, which allows for a decrease in the initial investment cost. Indeed, a part of the required energy storage system to handle the intermittency of RER is ensured by using EV batteries.
Despite the large amount of energy supplied by the EV, its SOC does not significantly vary, which can be explained by the large storage capacity of the EV to ensure certain autonomy. Indeed, the EV will have enough energy to support the home MG while limiting main grid power. In this work, the EV SOC is limited to a DOD of 85 % to avoid its battery being significantly discharged, but in reality, the EV can be discharged even more. Indeed, the Lithium-ion batteries used in EVs can be discharged even more than 50 % of their maximum capacity to support the home MG.
Table 7 summarizes the two conducted case studies. It is clear from this table and the previously discussed results that the integration of the EV brings great benefits to a home MG. Indeed, the energy self-sufficiency has increased in both cities, with a large improvement for Toulon (hot climate with huge PV potential). In terms of financial benefits, it is obvious from the given results that the use of renewable resources and the EV energy storage capacity lowers the energy bill for 20 years of operation, even if the investment cost is quite high, mainly due the price of battery energy storage devices.
The use of the electric vehicle as a RER energy storage device leads to the degradation of its battery over time [13], as the lifespan of the battery depends on the number of charge/discharge cycles. It would be more interesting to integrate an EV battery degradation cost in future work. Moreover, more aspects related to home MG EMS can be investigated, such as demand response and energy trading in the community integrating an EV fleet for enhancing the overall operation of the community MG [36].

5. Conclusions and Perspectives

This paper has presented an optimal sizing algorithm and energy management scheme for a home MG integrating the V 2 H technology for both hot and cold climates. The presented case studies show the advantage of the V 2 H concept, especially with the high integration of renewable energy resources. The electric vehicle presents a support for renewable energies by offering a larger storage capacity, thus efficiently increasing renewable energy generation by increasing on-MPPT mode usage. This increase in renewable production reduces the dependence on the grid, as shown in the simulation results. Therefore, the energy bill is reduced and the use of clean energy is empowered for sustainable development. It is mainly demonstrated that the use of V 2 H presents a financial interest for homeowners, supports the integration of RER for sustainable development, and relieves the main grid during on-peak periods.
The economic advantage of V 2 H and its cost-effectiveness may encourage homeowners to switch from thermal to electric vehicles, thus reducing the pollution rate, knowing that the total amount of CO 2 emitted by the design of the electric vehicle is half that emitted by the manufacturing and operation of the combustion vehicle. This greatly reduces the level of CO 2 emissions over a period of 20 years. Moreover, in a house MG, the electric vehicle reduces the size of the storage system and avoids its degradation by storing surplus production, which lowers the total investment cost and reduces the rate of manufacturing and changing of storage systems, in this case the battery ESS.
In the near future, it is interesting to scale up to a district, using a fleet of electric vehicles, to show the benefits of the V 2 G concept. It is foreseeable that the integration of electric vehicles will significantly reduce the pollution rate. However, the economic profitability needs to be demonstrated through further investigations. The move towards a larger scale will lead to more constraints, as vehicles will not have the same displacement and availability over a day, and this constraint will further complicate the optimisation of the objective function. It is not certain that, by increasing the number of electric vehicles, the network will be relieved, it may happen the other way round, where the charging stations require a huge amount of energy, and if the number of stations increases, the energy required increases accordingly. One solution to this problem is to power the charging stations with renewable energy.
Other aspects linked to artificial intelligence must be used to forecast weather data for optimal energy production and also to predict the displacement and consumption of vehicles, as well as their availability. Other parameters need to be considered in the modelling of the battery degradation cost, solar panels, and wind turbines to achieve more accuracy, such as the temperature, the change of the energy cost in the energy market, and load shedding.

Author Contributions

Conceptualization, O.O. and E.E.; methodology, O.O. and E.E.; validation, E.E.; formal analysis, O.O., E.E.; investigation, O.O. and E.E.; resources, O.O. and E.E.; writing—original draft preparation, O.O.; writing—review and editing, E.E., Y.A., F.L.G. and E.S.G.; visualization, O.O.; supervision, E.E.; project administration, E.E.; funding acquisition, E.E. and Y.A. All authors have read and agreed to the published version of the manuscript.

Funding

This research was funded by Brest Métropole and ISEN Yncréa Ouest, France.

Conflicts of Interest

The authors declare no conflict of interest. The funders had no role in the design of the study; in the collection, analyses, or interpretation of data; in the writing of the manuscript, or in the decision to publish the results.

Nomenclature

The following variables are used in this manuscript:
P I r r           Irradiance of the day W/m 2
P P V i n s Installed PV power (computed considering maximum irradiance)
P P V ( t ) Power produced by PV at time t
P W T i n s Installed wind power (computed considering maximum wind speed)
P W T ( t ) Power produced by WT at time t
P b a t + ( t ) Battery discharge power at time t
P b a t ( t ) Battery charging power at time t
P g + ( t ) Power supplied by the grid at time t
P g ( t ) Power sent to the grid at time t
P g i ( t ) Grid power at time t at for the ith year
P E V + ( t ) Electric Vehicle discharge power at time t
P E V ( t ) Electric Vehicle charging power at time t
P b a t m a x Maximum discharge power of the battery
P b a t m i n Maximum charging power of the battery
P g m a x Maximum power supplied by the grid
P g m i n Maximum power sent to the grid
E b a t m a x Capacity of the installed battery (J)
E E V m a x Capacity of the electric vehicle (J)
S O C b a t ( t ) Battery state of charge at time t
S O C E V ( t ) Electric Vehicle state of charge at time t
D O D b a t Battery depth of discharge
D O D E V Electric vehicle depth of discharge
S P V PV surface m 2
S l i m i t Surface limit of the PV
R W T Radius of the wind turbine
R l i m i t Radius limit of the WT
η b a t c h a Battery charging efficiency
η b a t d i s c h Battery discharging efficiency
η E V c h a Electric vehicle charging efficiency
η E V d i s c h Electric vehicle discharging efficiency
η P V PV efficiency
ρ Air density
C p Power coefficient
V W i n d Wind velocity (m/s)
d t Power application time (1 h)
C P V Total PV investment, maintenance, and operating costs in €/kW
C W T Total wind turbine investment, maintenance, and operating costs in €/kW
C b a t Total batteries investment, maintenance, and operating costs in in €/kWh
C g Cost of energy purchased from the grid in €/kWh
ESSEnergy storage system
MGMicrogrid
PVPhotovoltaic
WTWInd turbine
V 2 H Vehicle to home
V 2 G Vehicle to grid
RERRenewable energy resources
SOCState of charge
DODDepth of charge

References

  1. Tan, K.M.; Ramachandaramurthy, V.K.; Yong, J.Y. Integration of electric vehicles in smart grid: A review on vehicle to grid technologies and optimization techniques. Renew. Sustain. Energy Rev. 2016, 53, 720–732. [Google Scholar] [CrossRef]
  2. Zeng, X.; Li, M.; Abd El-Hady, D.; Alshitari, W.; Al-Bogami, A.S.; Lu, J.; Amine, K. Commercialization of lithium battery technologies for electric vehicles. Adv. Energy Mater. 2019, 9, 1900161. [Google Scholar] [CrossRef]
  3. Sharma, A.; Sharma, S. Review of power electronics in vehicle-to-grid systems. J. Energy Storage 2019, 21, 337–361. [Google Scholar] [CrossRef]
  4. Ouramdane, O.; Elbouchikhi, E.; Amirat, Y.; Gooya, E.S. Optimal Sizing and Energy Management of Microgrids with Vehicle-to-Grid Technology: A Critical Review and Future Trends. Energies 2021, 14, 4166. [Google Scholar] [CrossRef]
  5. Corchero, C.; Cruz-Zambrano, M.; Heredia, F.J. Optimal energy management for a residential microgrid including a vehicle-to-grid system. IEEE Trans. Smart Grid 2014, 5, 2163–2172. [Google Scholar]
  6. Borge-Diez, D.; Icaza, D.; Açıkkalp, E.; Amaris, H. Combined vehicle to building (V2B) and vehicle to home (V2H) strategy to increase electric vehicle market share. Energy 2021, 237, 121608. [Google Scholar] [CrossRef]
  7. Kataoka, R.; Shichi, A.; Yamada, H.; Iwafune, Y.; Ogimoto, K. Comparison of the economic and environmental performance of V2H and residential stationary battery: Development of a multi-objective optimization method for homes of EV owners. World Electr. Veh. J. 2019, 10, 78. [Google Scholar] [CrossRef] [Green Version]
  8. Khaligh, A.; Li, Z. Battery, ultracapacitor, fuel cell, and hybrid energy storage systems for electric, hybrid electric, fuel cell, and plug-in hybrid electric vehicles: State of the art. IEEE Trans. Veh. Technol. 2010, 59, 2806–2814. [Google Scholar] [CrossRef]
  9. Chan, C.C.; Bouscayrol, A.; Chen, K. Electric, hybrid, and fuel-cell vehicles: Architectures and modeling. IEEE Trans. Veh. Technol. 2009, 59, 589–598. [Google Scholar] [CrossRef]
  10. Mwasilu, F.; Justo, J.J.; Kim, E.K.; Do, T.D.; Jung, J.W. Electric vehicles and smart grid interaction: A review on vehicle to grid and renewable energy sources integration. Renew. Sustain. Energy Rev. 2014, 34, 501–516. [Google Scholar] [CrossRef]
  11. Yilmaz, M.; Krein, P.T. Review of the impact of vehicle-to-grid technologies on distribution systems and utility interfaces. IEEE Trans. Power Electron. 2012, 28, 5673–5689. [Google Scholar] [CrossRef]
  12. Gope, P.; Sikdar, B. An efficient privacy-preserving authentication scheme for energy internet-based vehicle-to-grid communication. IEEE Trans. Smart Grid 2019, 10, 6607–6618. [Google Scholar] [CrossRef]
  13. Farzin, H.; Fotuhi-Firuzabad, M.; Moeini-Aghtaie, M. A practical scheme to involve degradation cost of lithium-ion batteries in vehicle-to-grid applications. IEEE Trans. Sustain. Energy 2016, 7, 1730–1738. [Google Scholar] [CrossRef]
  14. Liu, H.; Huang, K.; Yang, Y.; Wei, H.; Ma, S. Real-time vehicle-to-grid control for frequency regulation with high frequency regulating signal. Prot. Control Mod. Power Syst. 2018, 3, 13. [Google Scholar] [CrossRef]
  15. Colmenar-Santos, A.; Muñoz-Gómez, A.M.; Rosales-Asensio, E.; López-Rey, Á. Electric vehicle charging strategy to support renewable energy sources in Europe 2050 low-carbon scenario. Energy 2019, 183, 61–74. [Google Scholar] [CrossRef]
  16. Gao, F.; Zhu, L.; Shen, M.; Sharif, K.; Wan, Z.; Ren, K. A blockchain-based privacy-preserving payment mechanism for vehicle-to-grid networks. IEEE Netw. 2018, 32, 184–192. [Google Scholar] [CrossRef]
  17. Mehrjerdi, H.; Rakhshani, E. Vehicle-to-grid technology for cost reduction and uncertainty management integrated with solar power. J. Clean. Prod. 2019, 229, 463–469. [Google Scholar] [CrossRef]
  18. Quddus, M.A.; Kabli, M.; Marufuzzaman, M. Modeling electric vehicle charging station expansion with an integration of renewable energy and Vehicle-to-Grid sources. Transp. Res. Part E Logist. Transp. Rev. 2019, 128, 251–279. [Google Scholar] [CrossRef]
  19. Alirezaei, M.; Noori, M.; Tatari, O. Getting to net zero energy building: Investigating the role of vehicle to home technology. Energy Build. 2016, 130, 465–476. [Google Scholar] [CrossRef]
  20. Staudt, P.; Schmidt, M.; Gärttner, J.; Weinhardt, C. A decentralized approach towards resolving transmission grid congestion in Germany using vehicle-to-grid technology. Appl. Energy 2018, 230, 1435–1446. [Google Scholar] [CrossRef]
  21. Amamra, S.A.; Marco, J. Vehicle-to-grid aggregator to support power grid and reduce electric vehicle charging cost. IEEE Access 2019, 7, 178528–178538. [Google Scholar] [CrossRef]
  22. Monteiro, V.; Exposto, B.; Ferreira, J.C.; Afonso, J.L. Improved vehicle-to-home (iV2H) operation mode: Experimental analysis of the electric vehicle as off-line UPS. IEEE Trans. Smart Grid 2016, 8, 2702–2711. [Google Scholar] [CrossRef]
  23. Mehrjerdi, H. Resilience oriented vehicle-to-home operation based on battery swapping mechanism. Energy 2021, 218, 119528. [Google Scholar] [CrossRef]
  24. Zeynali, S.; Rostami, N.; Ahmadian, A.; Elkamel, A. Two-stage stochastic home energy management strategy considering electric vehicle and battery energy storage system: An ANN-based scenario generation methodology. Sustain. Energy Technol. Assess. 2020, 39, 100722. [Google Scholar] [CrossRef]
  25. von Bonin, M.; Dörre, E.; Al-Khzouz, H.; Braun, M.; Zhou, X. Impact of Dynamic Electricity Tariff and Home PV System Incentives on Electric Vehicle Charging Behavior: Study on Potential Grid Implications and Economic Effects for Households. Energies 2022, 15, 1079. [Google Scholar] [CrossRef]
  26. Lee, S.; Choi, D.H. Energy management of smart home with home appliances, energy storage system and electric vehicle: A hierarchical deep reinforcement learning approach. Sensors 2020, 20, 2157. [Google Scholar] [CrossRef] [Green Version]
  27. Turker, H.; Bacha, S. Optimal minimization of plug-in electric vehicle charging cost with vehicle-to-home and vehicle-to-grid concepts. IEEE Trans. Veh. Technol. 2018, 67, 10281–10292. [Google Scholar] [CrossRef]
  28. Sausen, J.P.; Binelo, M.d.F.B.; Campos, M.; Sausen, A.Z.R.; Sausen, P.S. Economic feasibility study of using an electric vehicle and photovoltaic microgeneration in a smart home. IEEE Lat. Am. Trans. 2018, 16, 1907–1913. [Google Scholar] [CrossRef]
  29. Hou, X.; Wang, J.; Huang, T.; Wang, T.; Wang, P. Smart home energy management optimization method considering energy storage and electric vehicle. IEEE Access 2019, 7, 144010–144020. [Google Scholar] [CrossRef]
  30. Bull, S.R. Renewable energy today and tomorrow. Proc. IEEE 2001, 89, 1216–1226. [Google Scholar] [CrossRef]
  31. Ota, Y.; Taniguchi, H.; Nakajima, T.; Liyanage, K.M.; Baba, J.; Yokoyama, A. Autonomous distributed V2G (vehicle-to-grid) satisfying scheduled charging. IEEE Trans. Smart Grid 2011, 3, 559–564. [Google Scholar] [CrossRef]
  32. Roos, C.; Terlaky, T.; Vial, J.P. Interior Point Methods for Linear Optimization; Springer: Berlin/Heidelberg, Germany, 2005. [Google Scholar]
  33. Hazem Mohammed, O.; Amirat, Y.; Benbouzid, M. Economical evaluation and optimal energy management of a stand-alone hybrid energy system handling in genetic algorithm strategies. Electronics 2018, 7, 233. [Google Scholar] [CrossRef] [Green Version]
  34. European Commission. Photovoltaic Geographical Information System. Available online: https://re.jrc.ec.europa.eu/pvg_tools/en/tools.html#PVP (accessed on 4 April 2022).
  35. EDF. Open Data Wind Measurements—île de Sein. Available online: https://opendata-iles-ponant.edf.fr/explore/dataset/mesures-de-vent-ile-de-sein/information/?sort=date_heure (accessed on 4 April 2022).
  36. Liu, H.; Wang, B.; Wang, N.; Wu, Q.; Yang, Y.; Wei, H.; Li, C. Enabling strategies of electric vehicles for under frequency load shedding. Appl. Energy 2018, 228, 843–851. [Google Scholar] [CrossRef]
Figure 1. Structure of the home MG considering an EV as backup energy storage.
Energies 15 02830 g001
Figure 2. Scheme describing the proposed MG sizing and energy management system.
Energies 15 02830 g002
Figure 3. Energy management strategy ( P n e t is the net power, P r e s stands for residual power, and P b a c k corresponds to backup power).
Energies 15 02830 g003
Figure 4. Scheme of the optimization problem.
Energies 15 02830 g004
Figure 5. Load power and weather data for typical day in Brest and Toulon.
Energies 15 02830 g005
Figure 6. Case study 1: Renewable energy resources energy generation in Brest and Toulon.
Energies 15 02830 g006
Figure 7. Case study 1: Net power and battery power for Brest and Toulon. (a) Net power highlighting production/consumption unbalance during the day. (b) Battery power for 24 h.
Energies 15 02830 g007
Figure 8. Case study 1: Grid power and state of charge of the battery for Brest and Toulon.
Energies 15 02830 g008
Figure 9. Case study 2: Renewable energy resources generation for Brest and Toulon.
Energies 15 02830 g009
Figure 10. Case study 2: Net power representing the difference between renewables energy generation and load consumption and batteries power for Brest and Toulon.
Energies 15 02830 g010
Figure 11. Case study 2: Grid power and batteries state of charge for Brest and Toulon.
Energies 15 02830 g011
Figure 12. Case study 2: EV batteries power and state of charge for Brest and Toulon.
Energies 15 02830 g012
Table 1. Investment, maintenance, and lifetime costs of the used energy resources, with a lifetime of 20 years for PV and wind turbine, and 5 years for batteries.
Solar Panels
(€/kW)
Battery ESS
(€/kWh)
Wind Turbine
(€/kW)
Grid Energy Price
(€/kWh)
Investment cost 2835.00 148.00 5832.00 On-peak periods: 0.216
Maintenance and operating costs 56.7 2.96 38.08 Off-peak periods: 0.108
Table 2. Decision variables boundaries.
Variables C bat max (MJ) P bat max   ( M ) P bat min   ( M ) P g max   ( M ) P g min   ( M ) S limit  (m 2 ) R limit   ( m ) DOD bat DOD EV
Bounds1002500 2500 1000 1000 302 0.4 0.85
Table 3. Case study 1: PV, wind turbine, and battery optimal sizing.
PV Power (kW)PV Surface (m 2 )Wind Turbine Power (kW)Wind Turbine Radius (m)Battery Energy (kWh)
Brest 2.58 26.66 2.46 1.88 5.59
Toulon 3.84 27.26 0.89 1.86 16.51
Table 4. Case study 1: Energy cost and autonomy achieved without EV.
Total Energy Consumption (MWh)Cost without RER (€)Local Generation (MWh)Investment Cost (€)Grid Energy (MWh)Grid Energy Cost (€)Battery Energy (MWh)Total Cost (€)Achieved Autonomy (%)
Brest377.2470,703322.8928,15292.212,29650.77140,44975.56
Toulon377.2470,703272.1927,424126.9518,68098.98446,10566.35
Table 5. Case study 2: PV, battery, and wind turbine sizing results.
PV Power (kW)PV Surface
(m 2 )
Wind Turbine Power (kW)Wind Turbine Radius (m)Battery Energy (kWh)
Brest 3.2 29.78 1.11 1.26 8.74
Toulon 4.1 29 0.967 1.9 17.8
Table 6. Case study 2: Energy cost and achieved autonomy with EV.
Total Energy Consumption (MWh)Cost without RER (€)Local Generation (MWh)Investment Cost (€)Grid Energy (MWh)Grid Energy Cost (€)Battery Energy (MWh)EV Energy (MWh)Total Cost (€)Achieved Autonomy (%)
Brest 377.24 70,703 257.520 21,880 87.238 13,18257.642 47.289 35,063 76.87
Toulon 377.24 70,703 291.170 29,476 58.073 935095.126 53.494 38,827 84.61
Table 7. Summary of the achieved benefits for 20 years of operation of the home MG in Brest and Toulon.
MG without EVMG with EV
Brest
  • Total Cost = 40,449 (€)
  • Financial savings = 30,254 (€)
  • Achieved autonomy = 75.56 %
  • Total Cost = 35,063 (€)
  • Financial savings = 35,640 (€)
  • Achieved autonomy = 76.87%
Toulon
  • Total Cost = 46,105 (€)
  • Financial savings = 24,598 (€)
  • Achieved autonomy = 66.35 %
  • Total Cost = 38,827 (€)
  • Financial savings = 31,876 (€)
  • Achieved autonomy = 84.61 %
Publisher’s Note: MDPI stays neutral with regard to jurisdictional claims in published maps and institutional affiliations.

