
Various Facets of Sustainable Smart City Management: Selected Examples from Polish Metropolitan Areas


Abstract
:1. Introduction
2. A Review of the Literature on the Network Management of a City
3. A Review of the Literature on Smart Buildings and Smart Mobility
- A lack of motivation to improve economic and environmental efficiency on the property;
- The users’ limited awareness reflected in preferences for this type of solutions;
- High costs of the assembly of installations which limited the demand;
- Little involvement of users of the technology in the process of the design and development of this technologies.
- The solutions need to meet increasingly sophisticated and higher than standard expectations of the users of the property;
- In the scope of their operation, these solutions need to offer ease of use, affordability, functionality, reliability and easy maintenance;
- Upgradability of the system to include new functionalities, flexibility, adaptability and ease of installation of equipment;
- Sustainable consumption of the energy needed;
- Cheap and reliable equipment with a limited amount of wiring.
- Components responsible for data collection—sensors;
- Actuators (servos);
- The user interface enabling control via an Internet-based search engine;
- A wired or wireless IT network;
- The control unit—a computer.
4. A Review of the Literature on the Factors Affecting the Energy Transition in Municipalities
5. The Smart Heat Control System for a Smart City Selected for the Study
6. Material and Methods
6.1. Assumptions on the Administrative Boundaries of the GZM, Poznań, and Warsaw Metropolises
6.2. Methodology for Calculating Heat Savings
6.3. Comparison of the District Heating Systems
6.4. Air Quality Surveys
7. Results
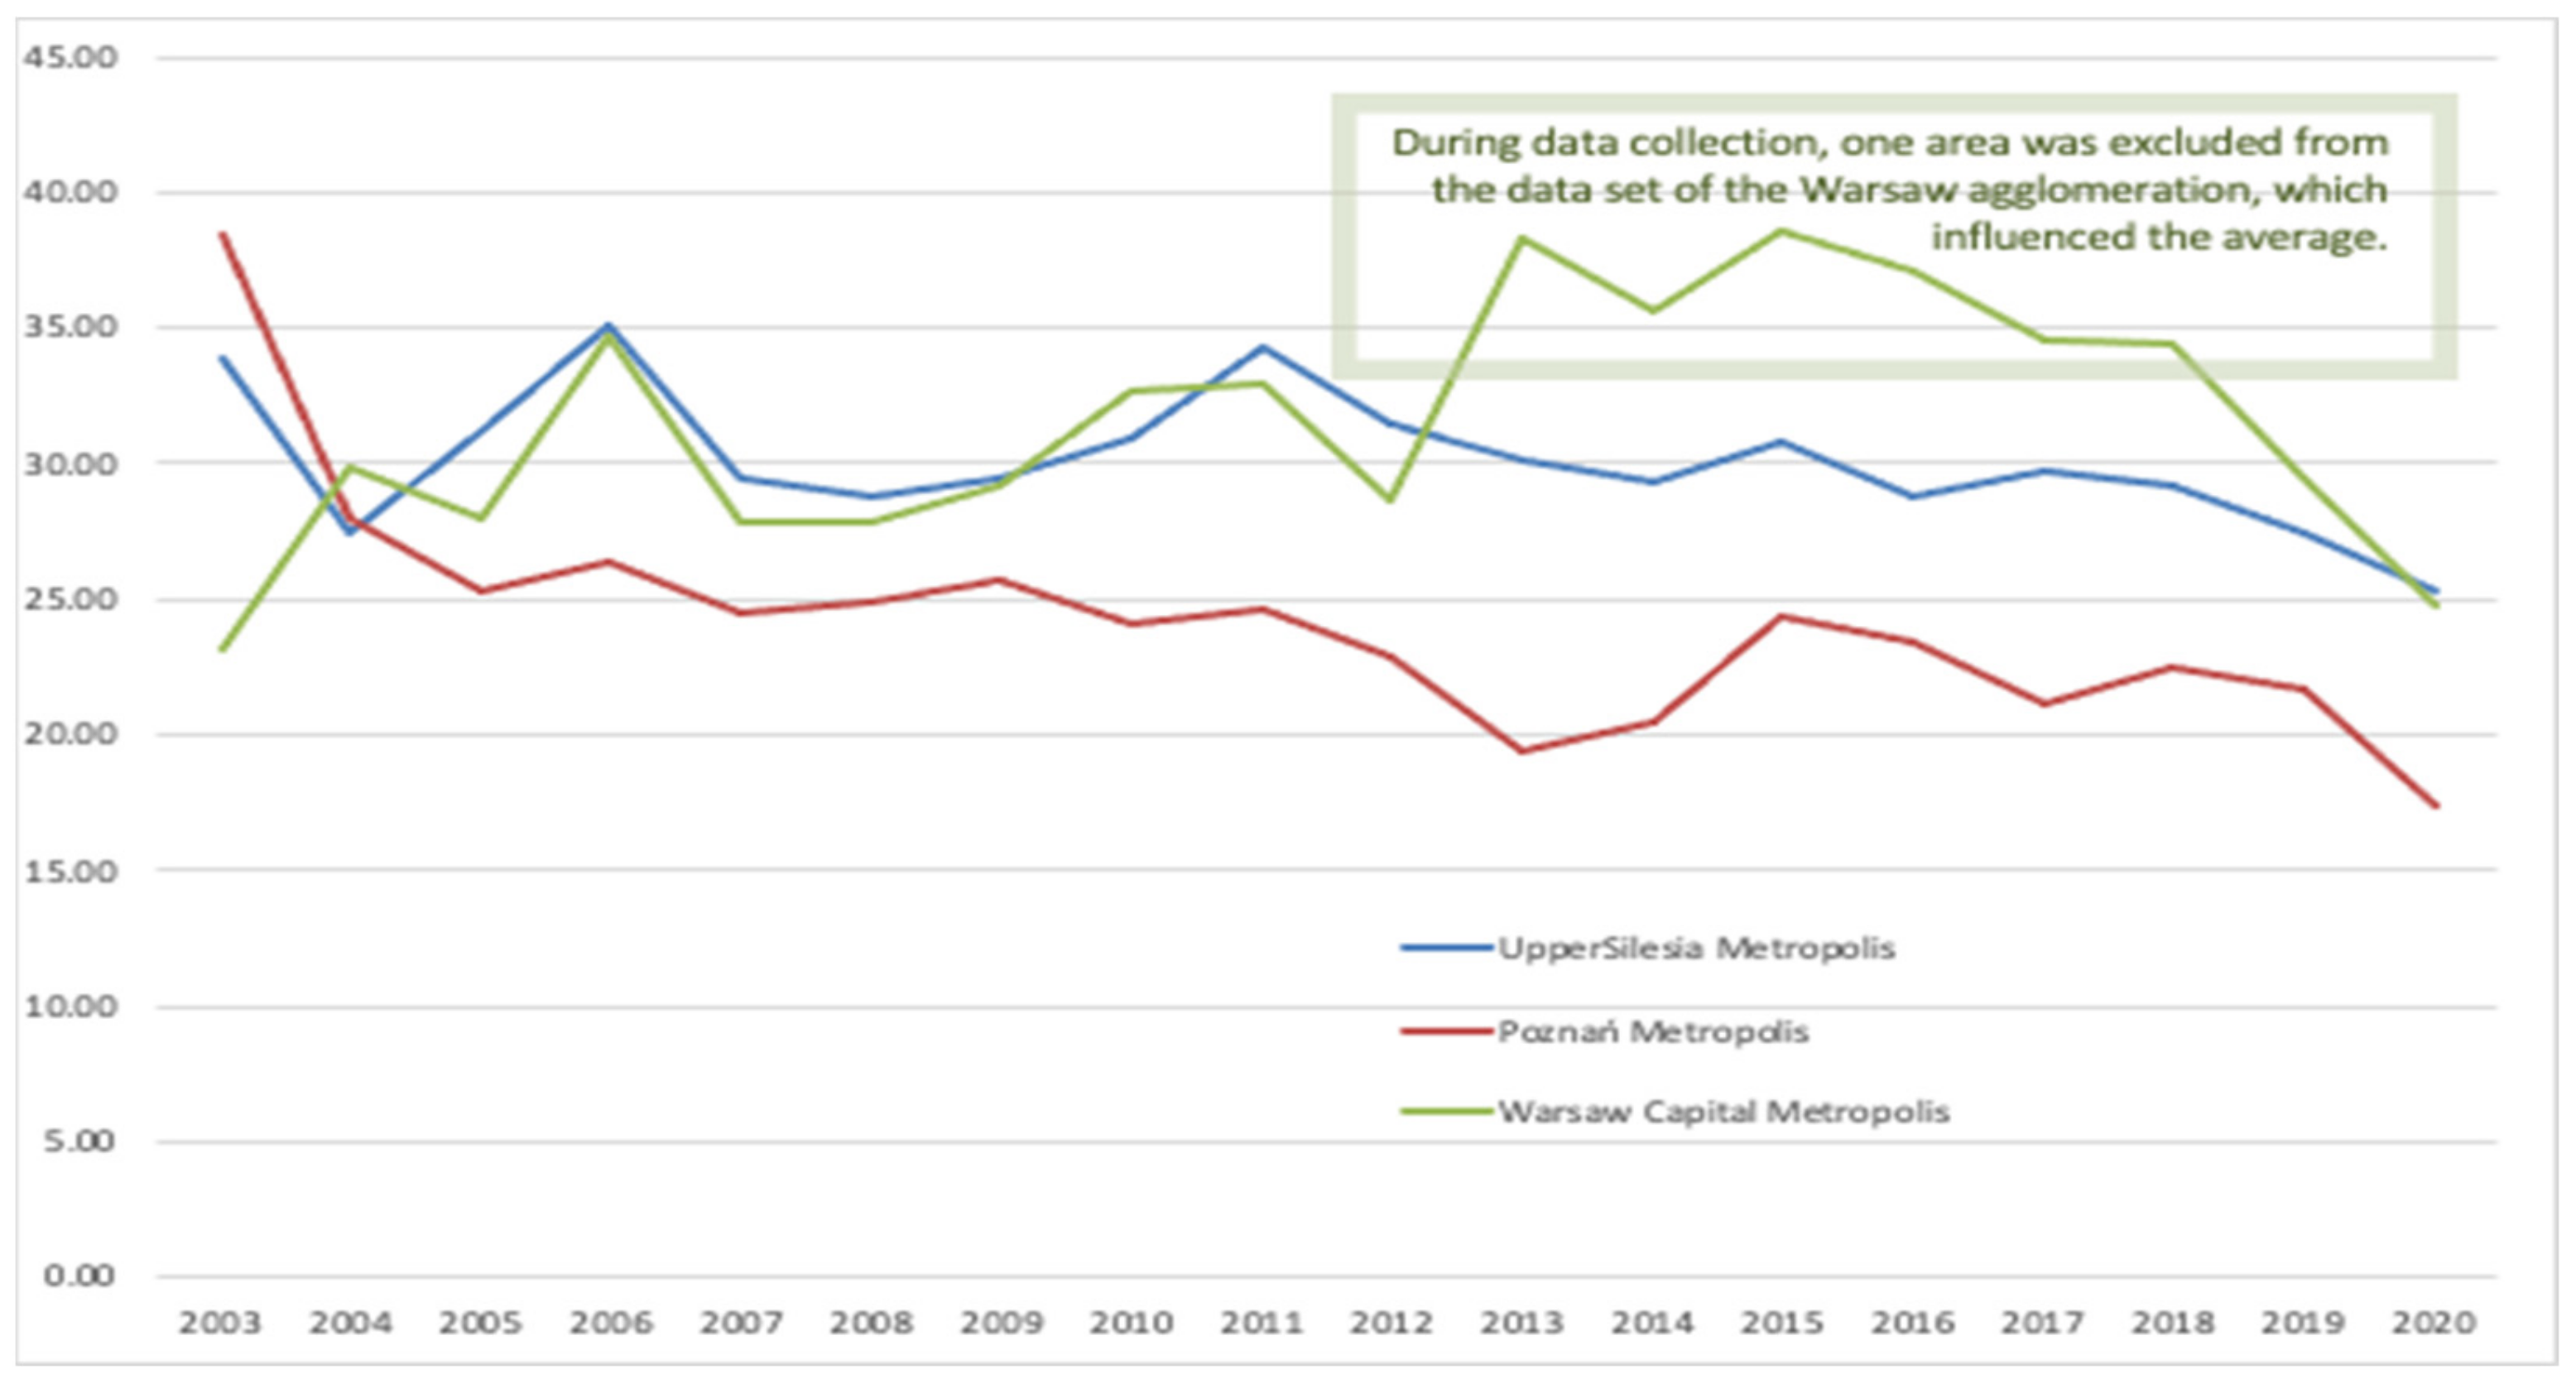
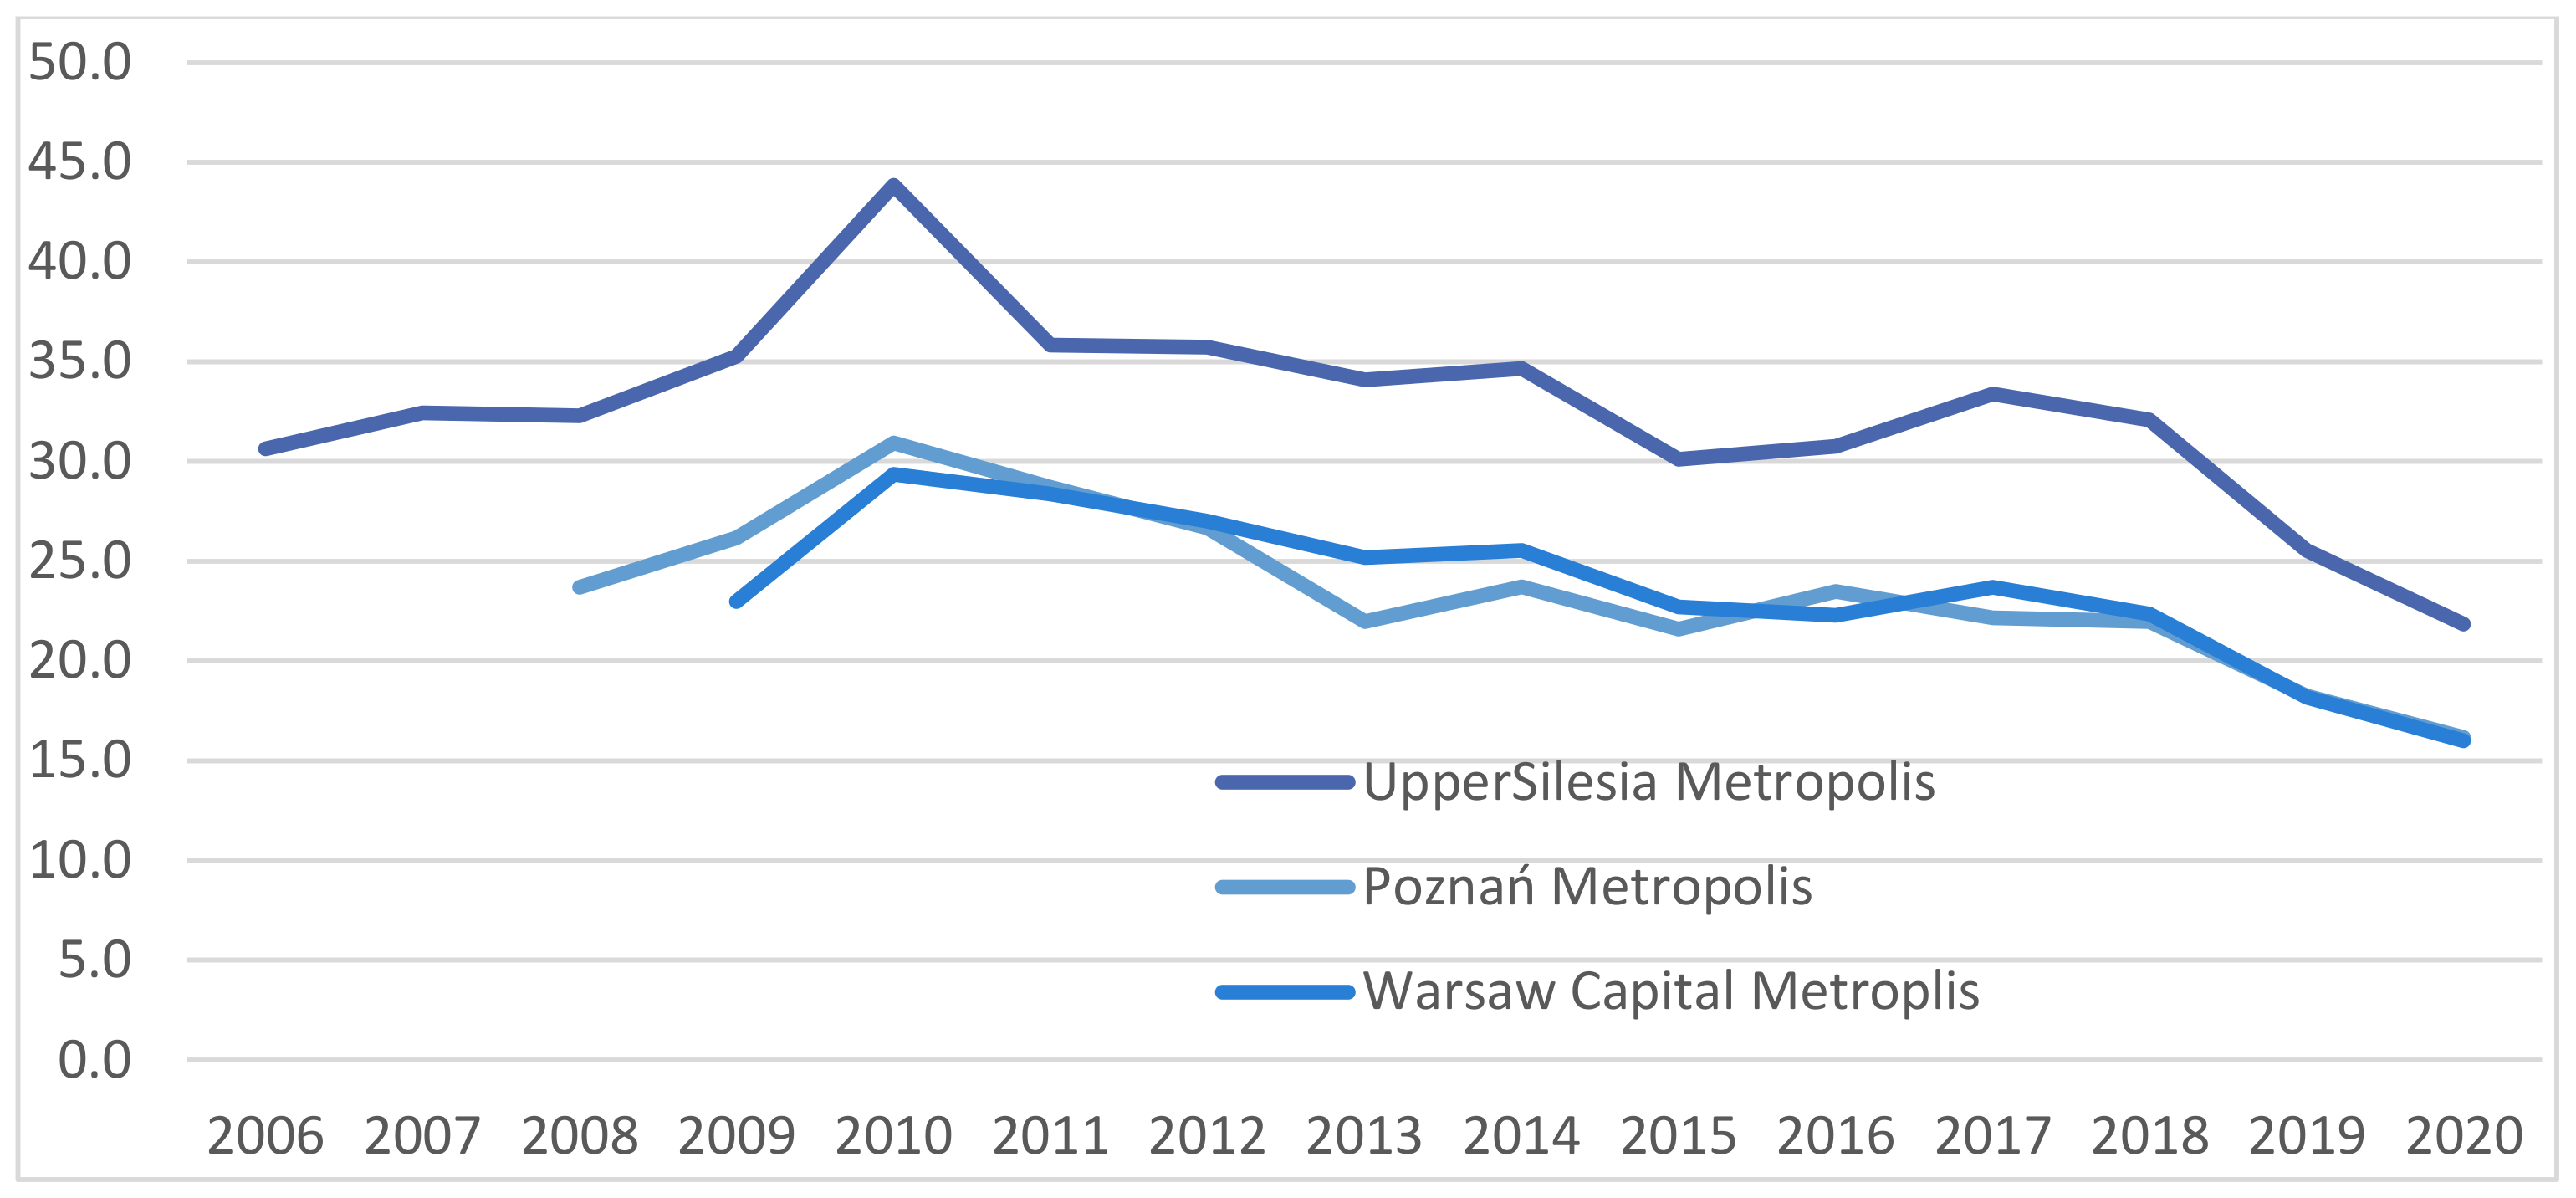
7.1. Assumptions for Measurements of Heat Savings in the Metropolises
7.2. Comparison of the Local Energy Generating Sources for the Purposes of Estimating the Levels of Harmful Emissions
7.3. The Results of Air Quality Surveys
8. Conclusions
Author Contributions
Funding
Institutional Review Board Statement
Informed Consent Statement
Data Availability Statement
Acknowledgments
Conflicts of Interest
Abbreviations
| Abbreviation | Meaning |
| BES | Building Energy Services |
| DHCS | District heating and cooling system |
| DHN | District heating network |
| MSC | municipal heating system |
| EU | European Union |
| GZM | Upper Silesian and Zagłębie Metropolis |
| H2020 | Horizon 2020: A framework programme for research and innovation for 2014–2020 funded by the European Union |
| HDD | Heating degree days: the number of days when the average outdoor temperature does not exceed 14 °C |
| IDS | Intelligent decision system |
| IED Directive | Directive 2010/75/EU of the European Parliament and of the Council of 24 November 2010 on industrial emissions |
| IoT | Internet of Things |
| KPI | Heat consumption index |
| LCP Directive | Directive 2001/80/EC of the European Parliament and of the Council of 23 October 2001 on the limitation of emissions of certain pollutants into the air from large combustion plants |
| MCP Directive | Directive (EU) 2015/2193 of the European Parliament and of the Council of 25 November 2015 on the limitation of emissions of certain pollutants into the air from medium combustion plants |
| PN | Physical thermal network |
| RES | Renewable energy sources |
| SAB | Smart Active Box, a predictive maintenance system designed by the company Arne Jensen AB |
| STORM | Smart Freight Transport and Logistics Research Methodologies, a project funded by the European Union |
| TSP | Total suspended particles |
Appendix A

| Recommendation | |
|---|---|
| 1 | The concept of “smart home”, defined as a site which efficiently manages in an integrated manner the resources, services and their mutual linkages in order to satisfy the changing needs of tits users, while, at the same time, minimising the costs and continuously respecting the natural environment, can be scaled up from the micro level (of a single room or apartment) to the macro level (a city or a metropolitan area). Such a fractal approach to the issue makes it possible to identify the possible savings of investment outlays and operating costs or energy efficiency improvements because of simplification of organisational processes. |
| 2 | The carbon dioxide reduction targets cannot be achieved by using one technology or when it is applied only in one area. It is necessary to apply a multi-aspect approach using different technologies affecting all the areas of life in a city, including, among others, the generation, transfer and use of energy carriers, construction, spatial economy or mobility. To effectively manage such a complex system, it is necessary to use (implement or develop) Smart City solutions and, at the same time, to adapt management tools in local administration units. |
| 3 | Although local governments enjoy substantial autonomy in shaping their own transport policy and use it in preparing their strategic documents, such as SUMPs, these documents are often not implemented and/or organisational or investment decisions are in contradiction to the assumptions of strategic documents. The Authors discern the reason for this situation in the growing complexity of the urban mobility ecosystem and the silo character of organisational structure and recommend correspondingly the introduction of network management tools and a revision of the organisational architecture in a manner raising the creative capital level among the staff of local governments. |
| 4 | Sustainable development also entails the development of social capital and intersectoral cooperation, specified as multidimensional support for actions to strengthen or sometimes to restore the quality of the natural environment. In this case, communication and an exchange of information will be important. The intersectoral cooperation can be developed using such tools as e.g., urban labs, multifunctional dialogue platforms, formal and informal meetings leading to the creation of partner projects. |
| 5 | Low Carbon will be better known and understood as a policy when systemic education on Smart City will be launched and a consistent brand of a metropolis will be built and strengthened both in external relations at national and international levels and inside the metropolis. This systemic education on Smart City should be developed as one addressed, in particular, to local government officials, as well as to children, youth and senior citizens, in combination with an increase in the importance of the educational potential of the metropolis, including the university level-based one. |
| 6 | The emission reduction levels in the areas of transport/mobility will depend on the mix of selected tools. The most effective solutions—active mobility, collective transport and modern forms of shared mobility—require far-reaching changes in the inhabitants’ awareness and cooperation among the participants in the mobility ecosystem in order to prepare an attractive proposal as an alternative to the use of private cars. Therefore, an indispensable step is to understand the structure and relations among the participants in the mobility network. |
| 7 | It is possible to improve air quality, particularly, in the heating season, essentially by reducing low emissions. By applying the network approach to the management of district heating systems, it is possible to reduce total emissions and also raise the attractiveness of district heat with respect to its clearly more emission-intensive alternatives by improving technological efficiency and cost-effectiveness using Smart City solutions. Given its unique position, GZM can assume the orchestrator’s role and bring about a partial or full technological integration of district heating systems operated in its area, delivering an added value for its inhabitants and district heating companies. |
References
- Gorynia, M.; Matysek-Jedrych, A.; Mińska-Struzik, E. Poland on the Path of Competitiveness Growth. In Competitiveness and Economic Development in Europe: Prospects and Challenges; Routledge: New York, NY, USA, 2021. [Google Scholar]
- Makieła, Z.; Stuss, M.M.; Borowiecki, R. Sustainability, Technology and Innovation 4.0; Routledge: New York, NY, USA, 2021. [Google Scholar]
- Jayashree, S.; Hassan Reza, M.N.; Malarvizhi, C.A.N.; Maheswari, H.; Hosseini, Z.; Kasim, A. Article the Impact of Technological Innovation on Industry 4.0 Implementation and Sustainability: An Empirical Study on Malaysian Small and Medium Sized Enterprises. Sustainability 2021, 13, 10115. [Google Scholar] [CrossRef]
- Dyduch, W.; Chudziński, P.; Cyfert, S.; Zastempowski, M. Dynamic Capabilities, Value Creation and Value Capture: Evidence from SMEs under Covid-19 Lockdown in Poland. PLoS ONE 2021, 16, e0252423. [Google Scholar] [CrossRef] [PubMed]
- Gorynia, M. Will COVID-19 Kill Globalization. In COVID-19 and International Business; Routledge: New York, NY, USA, 2020. [Google Scholar]
- Siksnelyte-Butkiene, I. Impact of the COVID-19 Pandemic to the Sustainability of the Energy Sector. Sustainability 2021, 13, 12973. [Google Scholar] [CrossRef]
- Sołtysik, M.; Kozakiewicz, M.; Jasiński, J. Profitability of Prosumers According to Various Business Models—an Analysis in the Light of the COVID-19 Effect. Energies 2021, 14, 8488. [Google Scholar] [CrossRef]
- Jedynak, M.; Czakon, W.; Kuźniarska, A.; Mania, K. Digital Transformation of Organizations: What Do We Know and Where to Go Next? J. Organ. Chang. Manag. 2021, 34. [Google Scholar] [CrossRef]
- Wójcik-Jurkiewicz, M.; Czarnecka, M.; Kinelski, G.; Sadowska, B.; Bilińska-Reformat, K. Determinants of Decarbonisation in the Transformation of the Energy Sector: The Case of Poland. Energies 2021, 14, 1217. [Google Scholar] [CrossRef]
- Malec, M.; Kinelski, G.; Czarnecka, M. The Impact of Covid-19 on Electricity Demand Profiles: A Case Study of Selected Business Clients in Poland. Energies 2021, 14, 5332. [Google Scholar] [CrossRef]
- Makieła, Z.J.; Kinelski, G.; Stechły, J.; Raczek, M.; Wrana, K.; Michałek, J. Tools for Network Smart City Management—The Case Study of Potential Possibility of Managing Energy and Associated Emissions in Metropolitan Areas. Energies 2022, 15, 2316. [Google Scholar] [CrossRef]
- Makieła, Z.J.; Stuss, M.M.; Mucha-Kuś, K.; Kinelski, G.; Budziński, M.; Michałek, J. Smart City 4.0: Sustainable Urban Development in the Metropolis GZM. Sustainability 2022, 14, 3516. [Google Scholar] [CrossRef]
- Dzieńdziora, J.; Smolarek, M. Perception Ethical Norms and Values on the Example of Professional Lobbyists. Mark. I Zarządzanie 2018, 51, 51–61. [Google Scholar] [CrossRef]
- Bolesnikov, M.; Stijačić, M.P.; Radišić, M.; Takači, A.; Borocki, J.; Bolesnikov, D.; Bajdor, P.; Dzieńdziora, J. Development of a Business Model by Introducing Sustainable and Tailor-Made Value Proposition for SME Clients. Sustainability 2019, 11, 1157. [Google Scholar] [CrossRef] [Green Version]
- Makieła, Z. Entrepreneurship and Innovation as a Factor in the Competitiveness of Local Authority Units. In Development, Innovation and Business Potential in View of Economic Changes; Foundation of the Cracow University of Economics: Kraków, Poland, 2015; pp. 47–55. [Google Scholar]
- Stuss, M.M.; Szczepańska-Woszczyna, K.; Makieła, Z.J. Competences of Graduates of Higher Education Business Studies in Labor Market I (Results of Pilot Cross-Border Research Project in Poland and Slovakia). Sustainability 2019, 11, 4988. [Google Scholar] [CrossRef] [Green Version]
- Czarnecka, M.; Kinelski, G.; Stefańska, M.; Grzesiak, M.; Budka, B. Social Media Engagement in Shaping Green Energy Business Models. Energies 2022, 15, 1727. [Google Scholar] [CrossRef]
- Drożdż, W.; Kinelski, G.; Czarnecka, M.; Wójcik-Jurkiewicz, M.; Maroušková, A.; Zych, G. Determinants of Decarbonization—How to Realize Sustainable and Low Carbon Cities? Energies 2021, 14, 2640. [Google Scholar] [CrossRef]
- Kinelski, G.; Stęchły, J.; Sienicki, A.; Czornik, K.; Borkowski, P. Application of Smart Technologies in Metropolis GZM to Reduce Harmful Emissions in District Heating Systems. Energies 2021, 14, 7665. [Google Scholar] [CrossRef]
- Kinelski, G.; Zamasz, K.; Lis, M. Recommendation for the Efficient Implementation of Project Management Systemie the Metropolitan Office and Other Self-Govermental Administration Institution. In Project Management in Public Administration the Case of Metropolis GZM; Adam Marszałek: Toruń, Poland, 2019; Volume 1, pp. 151–164. [Google Scholar]
- Caragliu, A.; Del Bo, C.; Nijkamp, A. Smart Cities in Europe. University Amsterdam, Faculty of Economics, Business Administration and Econometrics; University Amsterdam, Faculty of Economics, Business Administration and Econometrics: Amsterdam, The Netherlands, 2006. [Google Scholar]
- Katz, B.; Bradley, J. The Metropolitan Revolution: How Cities and Metros Are Fixing Our Broken Politics and Fragile Economy; Brooking Institution Press: Washington, DC, USA, 2013. [Google Scholar]
- Toppeta, D. The Smart City Vision: How Innovation and ICT Can Build Smart,“Livable”, Sustainable Cities, Report of the Innovation Knowledge Foundation (2010); The Innovation Knowledge Foundation: Lombardy, Italy, 2014. [Google Scholar]
- Komninos, N. Smart Cities and Connected Intelligence Platforms, Ecosystems and Network Effects; Routledge Taylor Francis Group: London, UK, 2020. [Google Scholar]
- Morawski, M. Gospodarka 4.0 Na Przykładzie Przedsiębiorstw w Polsce; Oficyna Wydawnicza Politechniki Warszawskie: Warszawa, Poland, 2021. [Google Scholar]
- Hussain, H.I.; Haseeb, M.; Kamarudin, F.; Dacko-Pikiewicz, Z.; Szczepańska-Woszczyna, K. The Role of Globalization, Economic Growth and Natural Resources on the Ecological Footprint in Thailand: Evidence from Nonlinear Causal Estimations. Processes 2021, 9, 1103. [Google Scholar] [CrossRef]
- Al-Gasawneh, J.A.; Annuar, M.M.; Dacko-Pikiewicz, Z.; Saputra, J. The Impact of Customer Relationship Management Dimensions on Service Quality. Pol. J. Manag. Stud. 2021, 23, 24–41. [Google Scholar] [CrossRef]
- Korneluk, K.; Bielawska, M.; Zygadło, S.; Dominiak, B.; Kruczek, A. Human Smart City Przewodnik Dla Samorządów; ThinkIt Consulting Sp. z o.o, Ministerstwo Inwestycji i Rozwoju: Warszawa, Poland, 2019; pp. 8–9.
- Kuzior, A.; Kwilinski, A.; Tkachenko, V. Sustainable Development of Organizations Based on the Combinatorial Model of Artificial Intelligence. Entrep. Sustain. Issues 2019, 7, 1353–1376. [Google Scholar] [CrossRef]
- Dalevska, N.; Khobta, V.; Kwilinski, A.; Kravchenko, S. Entrepreneurship and Sustainability Issues a Model for Estimating Social and Economic Indicators of Sustainable Development. Entrep. Sustain. Issues 2019, 6, 1839–1860. [Google Scholar]
- Zych, G.; Budka, B.; Czarnecka, M.; Kinelski, G.; Wojcik-Jurkiewicz, M. Concept, Developments, and Consequences of Greenwashing. Eur. Res. Stud. J. 2021, 24, 914–922. [Google Scholar] [CrossRef]
- Muangmee, C.; Dacko-Pikiewicz, Z.; Meekaewkunchorn, N.; Kassakorn, N.; Khalid, B. Green Entrepreneurial Orientation and Green Innovation in Small and Medium-Sized Enterprises (Smes). Soc. Sci. 2021, 10, 136. [Google Scholar] [CrossRef]
- Piontek, F.; Piontek, B. The Paradigm of Social Consensus for Shaping the Structural Order in Development Management. Probl. Ekorozw. 2018, 13, 199–209. [Google Scholar]
- The European Green Deal. Available online: https://ec.europa.eu/info/strategy/priorities-2019-2024/european-green-deal_en (accessed on 13 November 2021).
- Ossewaarde, M.; Ossewaarde-Lowtoo, R. The Eu’s Green Deal: A Third Alternative to Green Growth and Degrowth? Sustainability 2020, 12, 9825. [Google Scholar] [CrossRef]
- Leonard, M.; Pisani-Ferry, J.; Shapiro, J.; Tagliapietra, S.; Wolf, G. The Geopolitics of the European Green Deal. Int. Organ. Res. J. 2021, 16, 204–235. [Google Scholar] [CrossRef]
- Michalski, D.; Hawranek, P. Financing the Green Revolution through Power Purchase Agreements (PPAs). Internetowy Kwart. Antymonop. I Regul. 2021, 2, 8–23. [Google Scholar]
- Michał, B.; Michał, B.-K.; Marcin, B.; Łukasz, G.; Paweł, H.; Łukasz, J.; Michał, K.; Grzegorz, K.; Eryk, K.; Juliusz, K.; et al. Prawo Energetyczne. Ustawa o Odnawialnych Źródłach Energii. Ustawa o Rynku Mocy. Ustawa o Inwestycjach w Zakresie Elektrowni Wiatrowych: Komentarz; C.H. Beck: Warszawa, Poland, 2020. [Google Scholar]
- Wierzbowski, M.; Filipiak, I.; Lyzwa, W. Polish Energy Policy 2050—An Instrument to Develop a Diversified and Sustainable Electricity Generation Mix in Coal-Based Energy System. Renew. Sustain. Energy Rev. 2017, 74, 51–70. [Google Scholar] [CrossRef] [Green Version]
- Wojcik-Jurkiewicz, M.; Lubicz-Posochowska, A.; Czarnecka, M.; Kinelski, G.; Sadowska, B. Legal Aspects of Sharing Economy: The Case of Games’ Platforms. Eur. Res. Stud. J. 2021, XXIV, 1196–1210. [Google Scholar] [CrossRef]
- Wróblewski, Ł. Łukasz Wróblewski—Aranżowanie Nie-Miejsc. Od Ekspozycji Afektu Do Medium Zmiany. Przegląd Humanist. 2017, 61, 211–222. [Google Scholar] [CrossRef]
- Wróblewski, Ł.; Gaio, A.; Rosewall, E. Sustainable Cultural Management in the 21st Century. Sustainability 2019, 11, 4665. [Google Scholar] [CrossRef] [Green Version]
- Saługa, P.W.; Zamasz, K.; Dacko-Pikiewicz, Z.; Szczepańska-Woszczyna, K.; Malec, M. Risk-Adjusted Discount Rate and Its Components for Onshore Wind Farms at the Feasibility Stage. Energies 2021, 14, 6840. [Google Scholar] [CrossRef]
- Kaszyński, P.; Komorowska, A.; Zamasz, K.; Kinelski, G.; Kamiński, J. Capacity Market and (the Lack of) New Investments: Evidence from Poland. Energies 2021, 14, 7843. [Google Scholar] [CrossRef]
- Dzwigol, H.; Dzwigol-Barosz, M.; Miśkiewicz, R.; Kwilinski, A. Manager competency assessment model in the conditions of industry 4.0. Entrep. Sustain. Issues 2020, 7, 2630. [Google Scholar] [CrossRef]
- Zamasz, K.; Mucha-Kuś, K.; Sorychta-Wojsczyk, B.; Musioł-Urbańczyk, A.; Tchórzewski, S.; Kinelski, G.; Lis, M. Project Management in Public Administration: The Case of Metropolis GZM; Zamasz, K., Ed.; Adam Marszałek: Toruń, Poland, 2020; ISBN 978-83-8180-323-6. [Google Scholar]
- Grzegórska, A.; Rybarczyk, P.; Lukoševičius, V.; Sobczak, J.; Rogala, A. Smart Asset Management for District Heating Systems in the Baltic Sea Region. Energies 2021, 14, 314. [Google Scholar] [CrossRef]
- Li, H.; Nord, N. Transition to the 4th Generation District Heating—Possibilities, Bottlenecks, and Challenges. Energy Procedia 2018, 149, 483–498. [Google Scholar] [CrossRef]
- Kinelski, G. Competitive Market and Sources of Its Advantages in the Electric Energy Subsector. Prog. Econ. Sci. 2017, 347–360. [Google Scholar] [CrossRef]
- Gorynia, M. Competition and Globalisation in Economic Sciences. Selected Aspects. Econ. Bus. Rev. 2019, 5, 118–133. [Google Scholar] [CrossRef]
- Gorynia, M. Teoretyczne Aspekty Konkurencyjności. In Kompedium Wiedzy o Konkurencyjności; Wydawnictwo Naukowe PW: Warszawa, Poland, 2002; pp. 48–89. [Google Scholar]
- Kurowska-Pysz, J.; Szczepańska-Woszczyna, K. The Analysis of the Determinants of Sustainable Cross-Border Cooperation and Recommendations on Its Harmonization. Sustainability 2017, 9, 2226. [Google Scholar] [CrossRef] [Green Version]
- Szczepańska-Woszczyna, K.; Zamasz, K.; Kinelski, G. Innovation in Organisational Management: Under Conditions of Sustainable Development; WSB University: Toruń, Poland, 2020. [Google Scholar]
- Filip, A.J. Miasto Jako Struktura Sieci Współzależnych. Studia Ekon. Uniw. Ekon. W Katowicach Zarządzanie 2015, 217, 114. [Google Scholar]
- Alexander, C. A City Is Not a Tree. In The Urban Design Reader; Routledge: London, UK, 2020. [Google Scholar]
- Emmi, P.C. Urban Complexity and Spatial Strategies: Towards a Relational Planning for Our Times. J. Am. Plan. Assoc. 2008, 74, 137. [Google Scholar] [CrossRef]
- Przygrodzka, R.; Kożuch, B. Współpraca Sieciowa w Zarządzaniu Organizacjami Publicznymi. In Studia i Prace Kolegium Zarządzania i Finansów; Szkoły Głównej Handlowej w Warszawie: Warsaw, Poland, 2012; pp. 25–35. [Google Scholar]
- Kulpa, J.; Olczak, P.; Surma, T.; Matuszewska, D. Comparison of Support Programs for the Development of Photovoltaics in Poland: My Electricity Program and the RES Auction System. Energies 2022, 15, 121. [Google Scholar] [CrossRef]
- Czakon, W. Paradygmat Sieciowy w Naukach o Zarządzaniu. Przegląd Organ. 2011, 11, 3–6. [Google Scholar] [CrossRef]
- Betlej, A. Wyzwania Zrównoważonego Rozwoju w Społeczeństwie Sieci. In Zeszyty Naukowe; Organizacja i Zarządzanie/Politechnika Śląska: Gliwice, Poland, 2017. [Google Scholar]
- Dechnik, M. Smart House—Inteligentny Budynek—Idea Przyszłości. Przegląd Elektrotechniczny 2017, 1, 3–12. [Google Scholar] [CrossRef]
- Harper, R. Inside the Smart Home: Ideas, Possibilities and Methods. In Inside the Smart Home; Springer: London, UK, 2006. [Google Scholar]
- Hayes, A. What Is a Smart Home. In Smart Home Magazin; Nation Publishing: Staten Island, NY, USA, 2015. [Google Scholar]
- Meadows-Klue, D. Inside the Smart Home. Interact. Mark. 2004, 5, 307–308. [Google Scholar] [CrossRef] [Green Version]
- Szołtysek, J. Uwarunkowania Pomysłu Smart City. In Gospodarka Materiałowa. Logistyka; Springer: Berlin/Heidelberg, Germany, 2005; Volume 2. [Google Scholar]
- Holuk, M. Budynek Inteligentny—Możliwość Sterowania Domem w XXI w. Sci. Bull. Chełm Sect. Tech. Sci. 2008, 1, 61–71. [Google Scholar]
- Makonin, S.; Bartram, L.; Popowich, F. A Smarter Smart Home. Pervasive Comput. 2013, 12, 58–66. [Google Scholar] [CrossRef]
- Augusto, J.C.; Nugent, C.D. Smart Homes Can Be Smarter. In Designing Smart Homes; Lecture Notes in Computer Science (including subseries Lecture Notes in Artificial Intelligence and Lecture Notes in Bioinformatics); Springer: Berlin/Heidelberg, Germany, 2006; Volume 4008, pp. 1–15. [Google Scholar] [CrossRef]
- Z-Wave Safer. Smarter Homes Start with Z-Wave; Zigbee: Davis, CA, USA, 2021. [Google Scholar]
- Bellini, P.; Nesi, P.; Pantaleo, G. IoT-Enabled Smart Cities: A Review of Concepts, Frameworks and Key Technologies. Appl. Sci. 2022, 12, 1607. [Google Scholar] [CrossRef]
- Khan, M.A.; Abbas, S.; Rehman, A.; Saeed, Y.; Zeb, A.; Uddin, M.I.; Nasser, N.; Ali, A. A Machine Learning Approach for Blockchain-Based Smart Home Networks Security. IEEE Netw. 2021, 35, 223–229. [Google Scholar] [CrossRef]
- Ammi, M.; Alarabi, S.; Benkhelifa, E. Customized Blockchain-Based Architecture for Secure Smart Home for Lightweight IoT. Inf. Process. Manag. 2021, 58, 102482. [Google Scholar] [CrossRef]
- Lee, Y.; Rathore, S.; Park, J.H.; Park, J.H. A Blockchain-Based Smart Home Gateway Architecture for Preventing Data Forgery. Hum.-Cent. Comput. Inf. Sci. 2020, 10, 1–14. [Google Scholar] [CrossRef]
- Barlow, J.; Gann, D. A Changing Sense of Place: Are Integrated IT Systems Reshaping the Home. In Electronic Working Papers Series; University of Sussex: Brighton, UK, 1998; Volume 18. [Google Scholar]
- Gann, D.; Barlow, J.; Venables, T. Digital Futures: Making Homes Smarter; Chartered Institute of Housing: York, UK, 1999. [Google Scholar]
- Arif, S.; Khan, M.A.; Rehman, S.U.; Kabir, M.A.; Imran, M. Investigating Smart Home Security: Is Blockchain the Answer? IEEE Access 2020, 8, 117802–117816. [Google Scholar] [CrossRef]
- Ren, Y.; Leng, Y.; Qi, J.; Sharma, P.K.; Wang, J.; Almakhadmeh, Z.; Tolba, A. Multiple Cloud Storage Mechanism Based on Blockchain in Smart Homes. Future Gener. Comput. Syst. 2021, 115, 304–313. [Google Scholar] [CrossRef]
- Atlam, H.F.; Azad, M.A.; Alzahrani, A.G.; Wills, G. A Review of Blockchain in Internet of Things and Ai. Big Data Cogn. Comput. 2020, 4, 28. [Google Scholar] [CrossRef]
- She, W.; Gu, Z.H.; Lyu, X.K.; Liu, Q.; Tian, Z.; Liu, W. Homomorphic Consortium Blockchain for Smart Home System Sensitive Data Privacy Preserving. IEEE Access 2019, 7, 62058–62070. [Google Scholar] [CrossRef]
- Moniruzzaman, M.; Khezr, S.; Yassine, A.; Benlamri, R. Blockchain for Smart Homes: Review of Current Trends and Research Challenges. Comput. Electr. Eng. 2020, 83, 106585. [Google Scholar] [CrossRef]
- Shahbazi, Z.; Byun, Y.C.; Kwak, H.Y. Smart Home Gateway Based on Integration of Deep Reinforcement Learning and Blockchain Framework. Processes 2021, 9, 1593. [Google Scholar] [CrossRef]
- Mohammad, Z.N.; Farha, F.; Abuassba, A.O.M.; Yang, S.; Zhou, F. Access Control and Authorization in Smart Homes: A Survey. Tsinghua Sci. Technol. 2021, 26, 906–917. [Google Scholar] [CrossRef]
- Schaffner, D.; Ohnmacht, T.; Weibel, C.; Mahrer, M. Moving into Energy-Efficient Homes: A Dynamic Approach to Understanding Residents’ Decision-Making. Build. Environ. 2017, 123, 211–222. [Google Scholar] [CrossRef]
- Firląg, S.; Chmielewski, A. Defining the Polish Nearly Zero Energy Building (NZEB) Renovation Standard. In Proceedings of the IOP Conference Series: Materials Science and Engineering, Suzhou, China, 22–24 June 2018; Volume 415. [Google Scholar]
- Toppeta, D. How Innovation and ICT The Smart City Vision: How Innovation and ICT Can Build Smart, Liveable, Sustainable Cities. Think Rep. 2010, 5, 1–9. [Google Scholar]
- Kazerani, M.; Tehrani, K. Grid of Hybrid AC/DC Microgrids: A New Paradigm for Smart City of Tomorrow. In Proceedings of the SOSE 2020—IEEE 15th International Conference of System of Systems Engineering, Budapest, Hungary, 2–4 June 2020. [Google Scholar]
- Guinard, D.D.; Trifa, V.M. Internet Rzeczy. Budowa Sieci z Wykorzystaniem Technologii Webowych i Raspberry Pi; Helion: Gliwice, Poland, 2017. [Google Scholar]
- Risteska Stojkoska, B.L.; Trivodaliev, K.V. A Review of Internet of Things for Smart Home: Challenges and Solutions. J. Clean. Prod. 2017, 140, 1454–1464. [Google Scholar] [CrossRef]
- Ng, I.C.L.; Wakenshaw, S.Y.L. The Internet-of-Things: Review and Research Directions. Int. J. Res. Mark. 2017, 34, 3–21. [Google Scholar] [CrossRef] [Green Version]
- Adepoju, O. Internet of Things (IoT). In Springer Tracts in Civil Engineering; Springer: Cham, Switzerlands, 2022. [Google Scholar]
- Zanella, A.; Bui, N.; Castellani, A.; Vangelista, L.; Zorzi, M. Internet of Things for Smart Cities. IEEE Internet Things J. 2014, 1, 22–32. [Google Scholar] [CrossRef]
- Lee, I.; Lee, K. Applications, Investments, and Challenges for Enterprises, Business Horizons. Bus. Horiz. 2015, 58, 431–440. [Google Scholar] [CrossRef]
- Li, X.; Xu, D.L. A Review of Internet of Things—Resource Allocation. IEEE Internet Things J. 2021, 8, 11. [Google Scholar] [CrossRef]
- Maskeliunas, R.; Damaševicius, R.; Segal, S. A Review of Internet of Things Technologies for Ambient Assisted Living Environments. Future Internet 2019, 11, 259. [Google Scholar] [CrossRef] [Green Version]
- Dyduch, W.; Bratnicka, K. Twórczość Strategiczna Jako Podstawa Budowania Kapitału Intelektualnego Organizacji. Pr. Nauk. Uniw. Ekon. We Wrocławiu 2014, 340, 637–650. [Google Scholar] [CrossRef] [Green Version]
- Dyduch, W. Corporate Entrepreneurship Measurement for Improving Organizational Performance. J. Econ. Manag. 2008, 4, 15–40. [Google Scholar]
- Fresner, J.; Krenn, C.; Morea, F.; Mercatelli, L.; Alessandrini, S.; Tomasi, F. Harmonisation of Energy and Sustainable Urban Mobility Planning; European Commission: Brussels, Belgium, 2019. [Google Scholar]
- Agouridas, V.; Biermann, F.; Czaya, A.; Richter, D.; Stemmler, J.; Stęchły, J.; Witkowska-Konieczna, A.; Kumar, R.; Patatouka, E. Urban Air Mobility and Sustainable Urban Mobility Planning—Practitioner Briefing. Eltis. 2021. Available online: https://www.eltis.org/sites/default/files/practitioner_briefing_urban_air_mobility_and_sump.pdf (accessed on 12 January 2022).
- Komunikat Komisji Do Parlamentu Europejskiego, Rady Europejskiej, Rady, Komitetu Ekonomiczno—Społecznego i Komitetu Regionów. Europejski Zielony Ład; European Commission: Bruksela, Belgium, 2019; pp. 12–13.
- Maciej, M. Zrównoważona Mobilność Miejska—Nowa Koncepcja w Planowaniu Systemów Transportu. Logistyka 2014, 3, 4338–4344. [Google Scholar]
- Kos-Łabędowicz, J. Promotional Activities Related to the Concept of Sustainable Urban Mobility. Mark. I Zarządzanie 2017, 47, 131–142. [Google Scholar] [CrossRef] [Green Version]
- Kinelski, G. The Main Factors of Successful Project Management in the Aspect of Energy Enterprises—Efficiency in the Digital Economy Environment|Główne Czynniki Skutecznego Zarządzania Projektami w Aspekcie Efektywności Przedsiębiorstw Energetycznych w Środowisku g. Polityka Energetyczna 2020, 23, 5–20. [Google Scholar] [CrossRef]
- Gerbaulet, C.; von Hirschhausen, C.; Kemfert, C.; Lorenz, C.; Oei, P.Y. European Electricity Sector Decarbonization under Different Levels of Foresight. Renew. Energy 2019, 141, 973–987. [Google Scholar] [CrossRef]
- Abokersh, M.H.; Saikia, K.; Cabeza, L.F.; Boer, D.; Vallès, M. Flexible Heat Pump Integration to Improve Sustainable Transition toward 4th Generation District Heating. Energy Convers. Manag. 2020, 225, 113379. [Google Scholar] [CrossRef]
- Lund, H.; Østergaard, P.A.; Chang, M.; Werner, S.; Svendsen, S.; Sorknæs, P.; Thorsen, J.E.; Hvelplund, F.; Mortensen, B.O.G.; Mathiesen, B.V.; et al. The Status of 4th Generation District Heating: Research and Results. Energy 2018, 164, 147–159. [Google Scholar] [CrossRef]
- Krog, L.; Sperling, K.; Svangren, M.K.; Hvelplund, F. Consumer Involvement in the Transition to 4th Generation District Heating. Int. J. Sustain. Energy Plan. Manag. 2020, 29, 141–152. [Google Scholar] [CrossRef]
- Edtmayer, H.; Nageler, P.; Heimrath, R.; Mach, T.; Hochenauer, C. Investigation on Sector Coupling Potentials of a 5th Generation District Heating and Cooling Network. Energy 2021, 230, 120836. [Google Scholar] [CrossRef]
- Gudmundsson, O.; Dyrelund, A.; Thorsen, J.E. Comparison of 4th and 5th Generation District Heating Systems. In Proceedings of the E3S Web of Conferences, Changsha, China, 5–8 November 2021; Volume 246. [Google Scholar]
- Buffa, S.; Cozzini, M.; D’Antoni, M.; Baratieri, M.; Fedrizzi, R. 5th Generation District Heating and Cooling Systems: A Review of Existing Cases in Europe. Renew. Sustain. Energy Rev. 2019, 104, 504–522. [Google Scholar] [CrossRef]
- Boesten, S.; Ivens, W.; Dekker, S.C.; Eijdems, H. 5th Generation District Heating and Cooling Systems as a Solution for Renewable Urban Thermal Energy Supply. Adv. Geosci. 2019, 49, 129–136. [Google Scholar] [CrossRef] [Green Version]
- Wirtz, M.; Kivilip, L.; Remmen, P.; Müller, D. 5th Generation District Heating: A Novel Design Approach Based on Mathematical Optimization. Appl. Energy 2020, 260, 114158. [Google Scholar] [CrossRef]
- BES—Hubgrade (Building Energy Services—Hubgrade). Available online: https://energiadlawarszawy.pl/zarzadzanie-energia-cieplna-w-budynku/ (accessed on 13 June 2021).
- Report The Structure of Primary Fuels Used to Generate Heat in 2020 for the Needs of the Warsaw District Heating System. Available online: https://energiadlawarszawy.pl/wp-content/uploads/sites/4/2021/04/struktura-paliw-2020.pdf (accessed on 13 June 2021).
- NODA Smart Heat Grid SolutionsTM & NODA Smart Heat Building SolutionsTM. Available online: http://noda-polska.pl/ (accessed on 13 June 2021).
- SAB—Smart Active Box. Available online: https://www.smartactivebox.com/sab/ (accessed on 13 June 2021).
- ISENSE. Available online: https://www.vexve.com/en/isense/ (accessed on 13 June 2021).
- Departament Monitoringu i Informacji o Środowisku Głównego Inspektoratu Ochrony Środowiska. Program Państwowego Monitoringu Środowiska; Chief Inspectorate of Environmental Protection: Warszawa, Poland, 2015.
- GIOŚ. Wyniki Pomiarów Jakości Powietrza w Polsce; GIOŚ: Warszawa, Poland, 2020.
- Kaginalkar, A.; Kumar, S.; Gargava, P.; Niyogi, D. Review of Urban Computing in Air Quality Management as Smart City Service: An Integrated IoT, AI, and Cloud Technology Perspective. Urban Clim. 2021, 39, 100972. [Google Scholar] [CrossRef]
- Wrana, K.; Klasik, A. Attractiveness and Competitiveness as the Pillars of Sustainable Urban. KPZK 2019, 273, 97–121. [Google Scholar]
- Poszytek, P. The Landscape of Scientific Discussions on the Competencies 4.0 Concept in the Context of the 4th Industrial Revolution—A Bibliometric Review. Sustainability 2021, 13, 6709. [Google Scholar] [CrossRef]
- Lisiński, M.; Šaruckij, M. Principles of the Application of Strategic Planning Methods. J. Bus. Econ. Manag. 2006, 7, 37–43. [Google Scholar] [CrossRef] [Green Version]
- Lisiński, M.; Sroka, W.; Brzeziński, P.; Jabłoński, A.; Stuglik, J. Application of Modern Management Concepts by Polish Companies—Analysis of Research Results. Organizacija 2012, 45, 41–49. [Google Scholar] [CrossRef]
- Kmieć, T.; Wrana, K.; Raczek, M.; Kmieć, B. Koncepcja Kształtowania i Rozwoju Miejskich Obszarów Funkcjonalnych Na Przykładzie Woj. Śląskiego/Strategic Concept of Shaping and Development of Urban Functional Areas in Silesian; University of Economics in Katowice: Katowice, Poland, 2015; p. 164. [Google Scholar]
- Zamasz, K.; Stęchły, J.; Komorowska, A.; Kaszyński, P. The Impact of Fleet Electrification on Carbon Emissions: A Case Study from Poland. Energies 2021, 14, 6595. [Google Scholar] [CrossRef]


| Name of Unit | Length of Heating Network | Cubic Space of Heated Buildings | Volume of Sold Heat |
|---|---|---|---|
| Warsaw district heating system | 1847 km (2019) | 341,270 dam3 (2018) | 26,443 TJ (2019) |
| GZM district heating systems (total) | 2168 km (2019) | 213,340 dam3 (2018) | 19,731 TJ (2019) |
| Poznań Metropolis | 703 km (2019) | 90,783 dam3 (2018) | 7209 TJ (2019) |
| Index | Statistical Code/Field | Description |
|---|---|---|
| All | Averaging period | The basic data averaging period at a measurement site. The results of measurements are averaged in the form of annual series in accordance with that period. |
| All | Average | The average annual concentration. |
| SO2 | L > 350 (S1) | The number of hours in a calendar year when the average 1-h concentration exceeded 350 µg/m3 (rounded to an integer). |
| SO2 | L > 125 (S24) | The number of hours in a calendar year when the average 24-h concentration exceeded 125 µg/m3 (rounded to an integer). |
| NO2 | L > 200 (S1) | The number of hours in a calendar year when the average 24-h concentration exceeded 200 µg/m3 (rounded to an integer). |
| NO2 | 19th max. (S1) | The 19th maximum value in an annual series of results—1-h averages, in [µg/m3]. |
| PM10 | L > 50 (S24) | The number of hours in a calendar year when the average 24-h concentration exceeded 50 µg/m3 (rounded to an integer). |
| PM10 | Max. (S24) | The maximum average 24-h concentration in a year. |
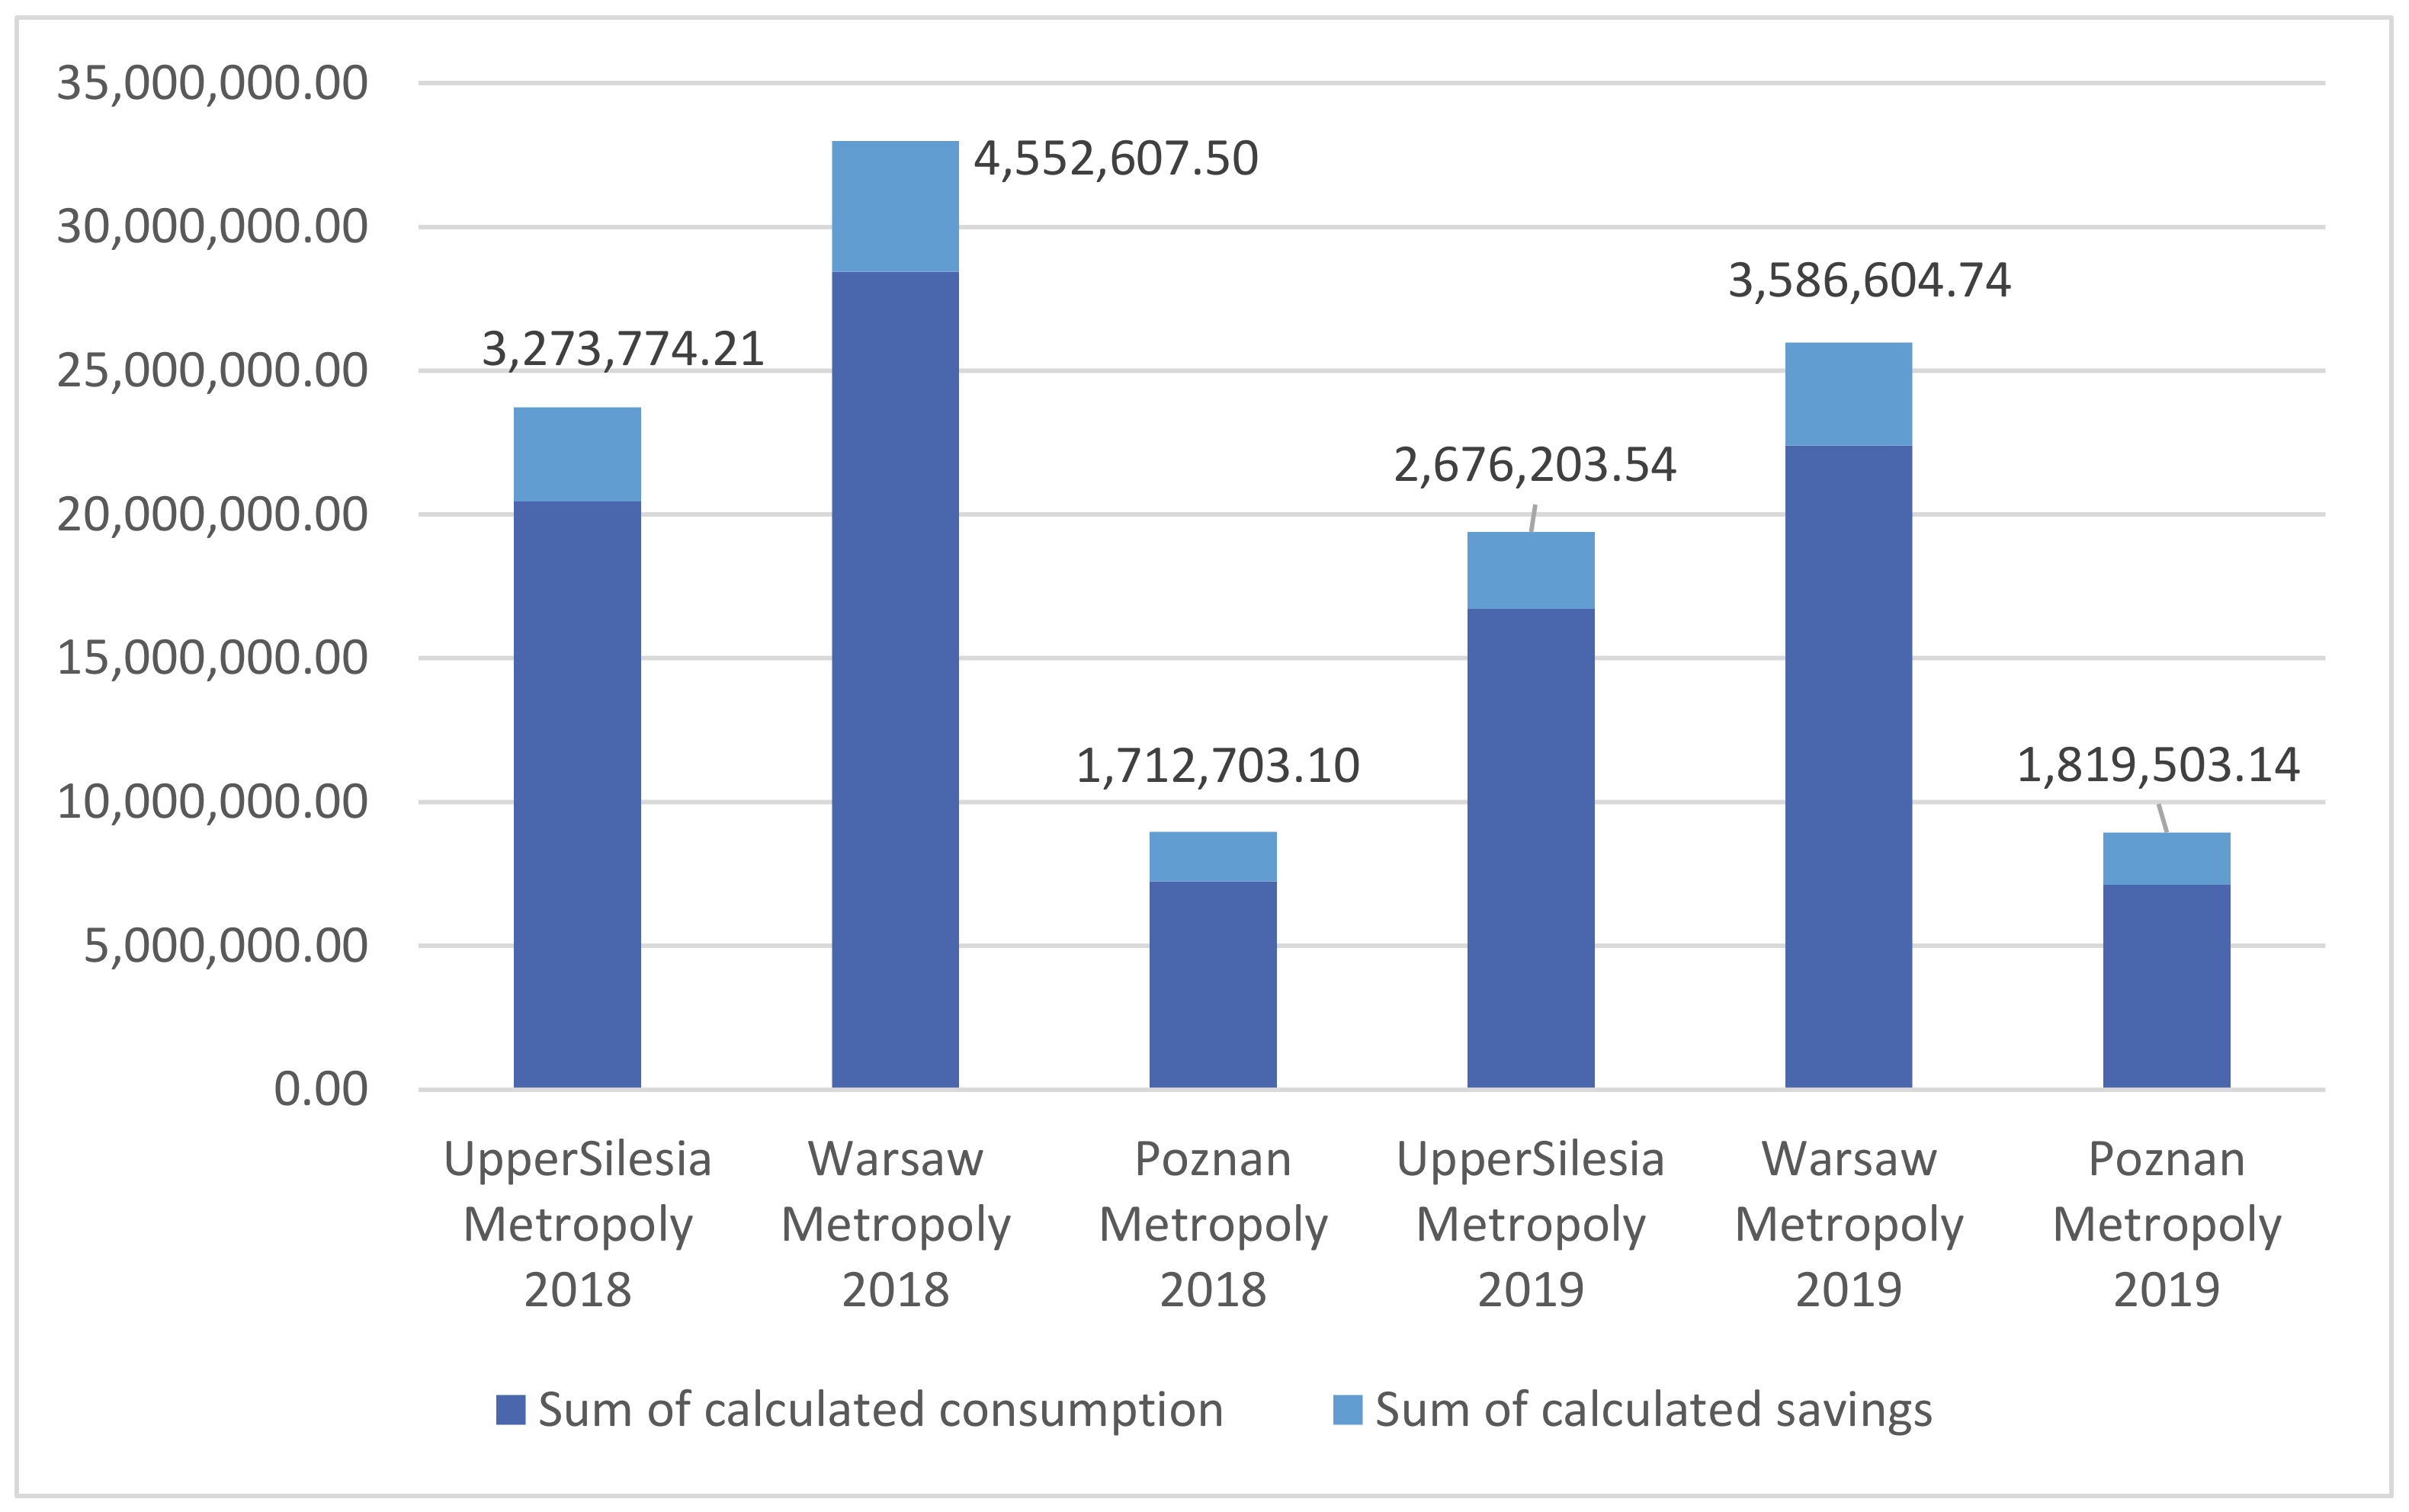
| Substance Emitted | Unitary Emissions | Energy Savings in 2019 | Emission Reductions |
|---|---|---|---|
| CO2 | 84.13 Mg/TJ | 3273.8 TJ | 275,424.8 Mg |
| SO2 | 0.11 Mg/TJ | 360.1 Mg | |
| NOx | 0.07 Mg/TJ | 229.2 Mg | |
| TSP | 0.01 Mg/TJ | 32.7 Mg |
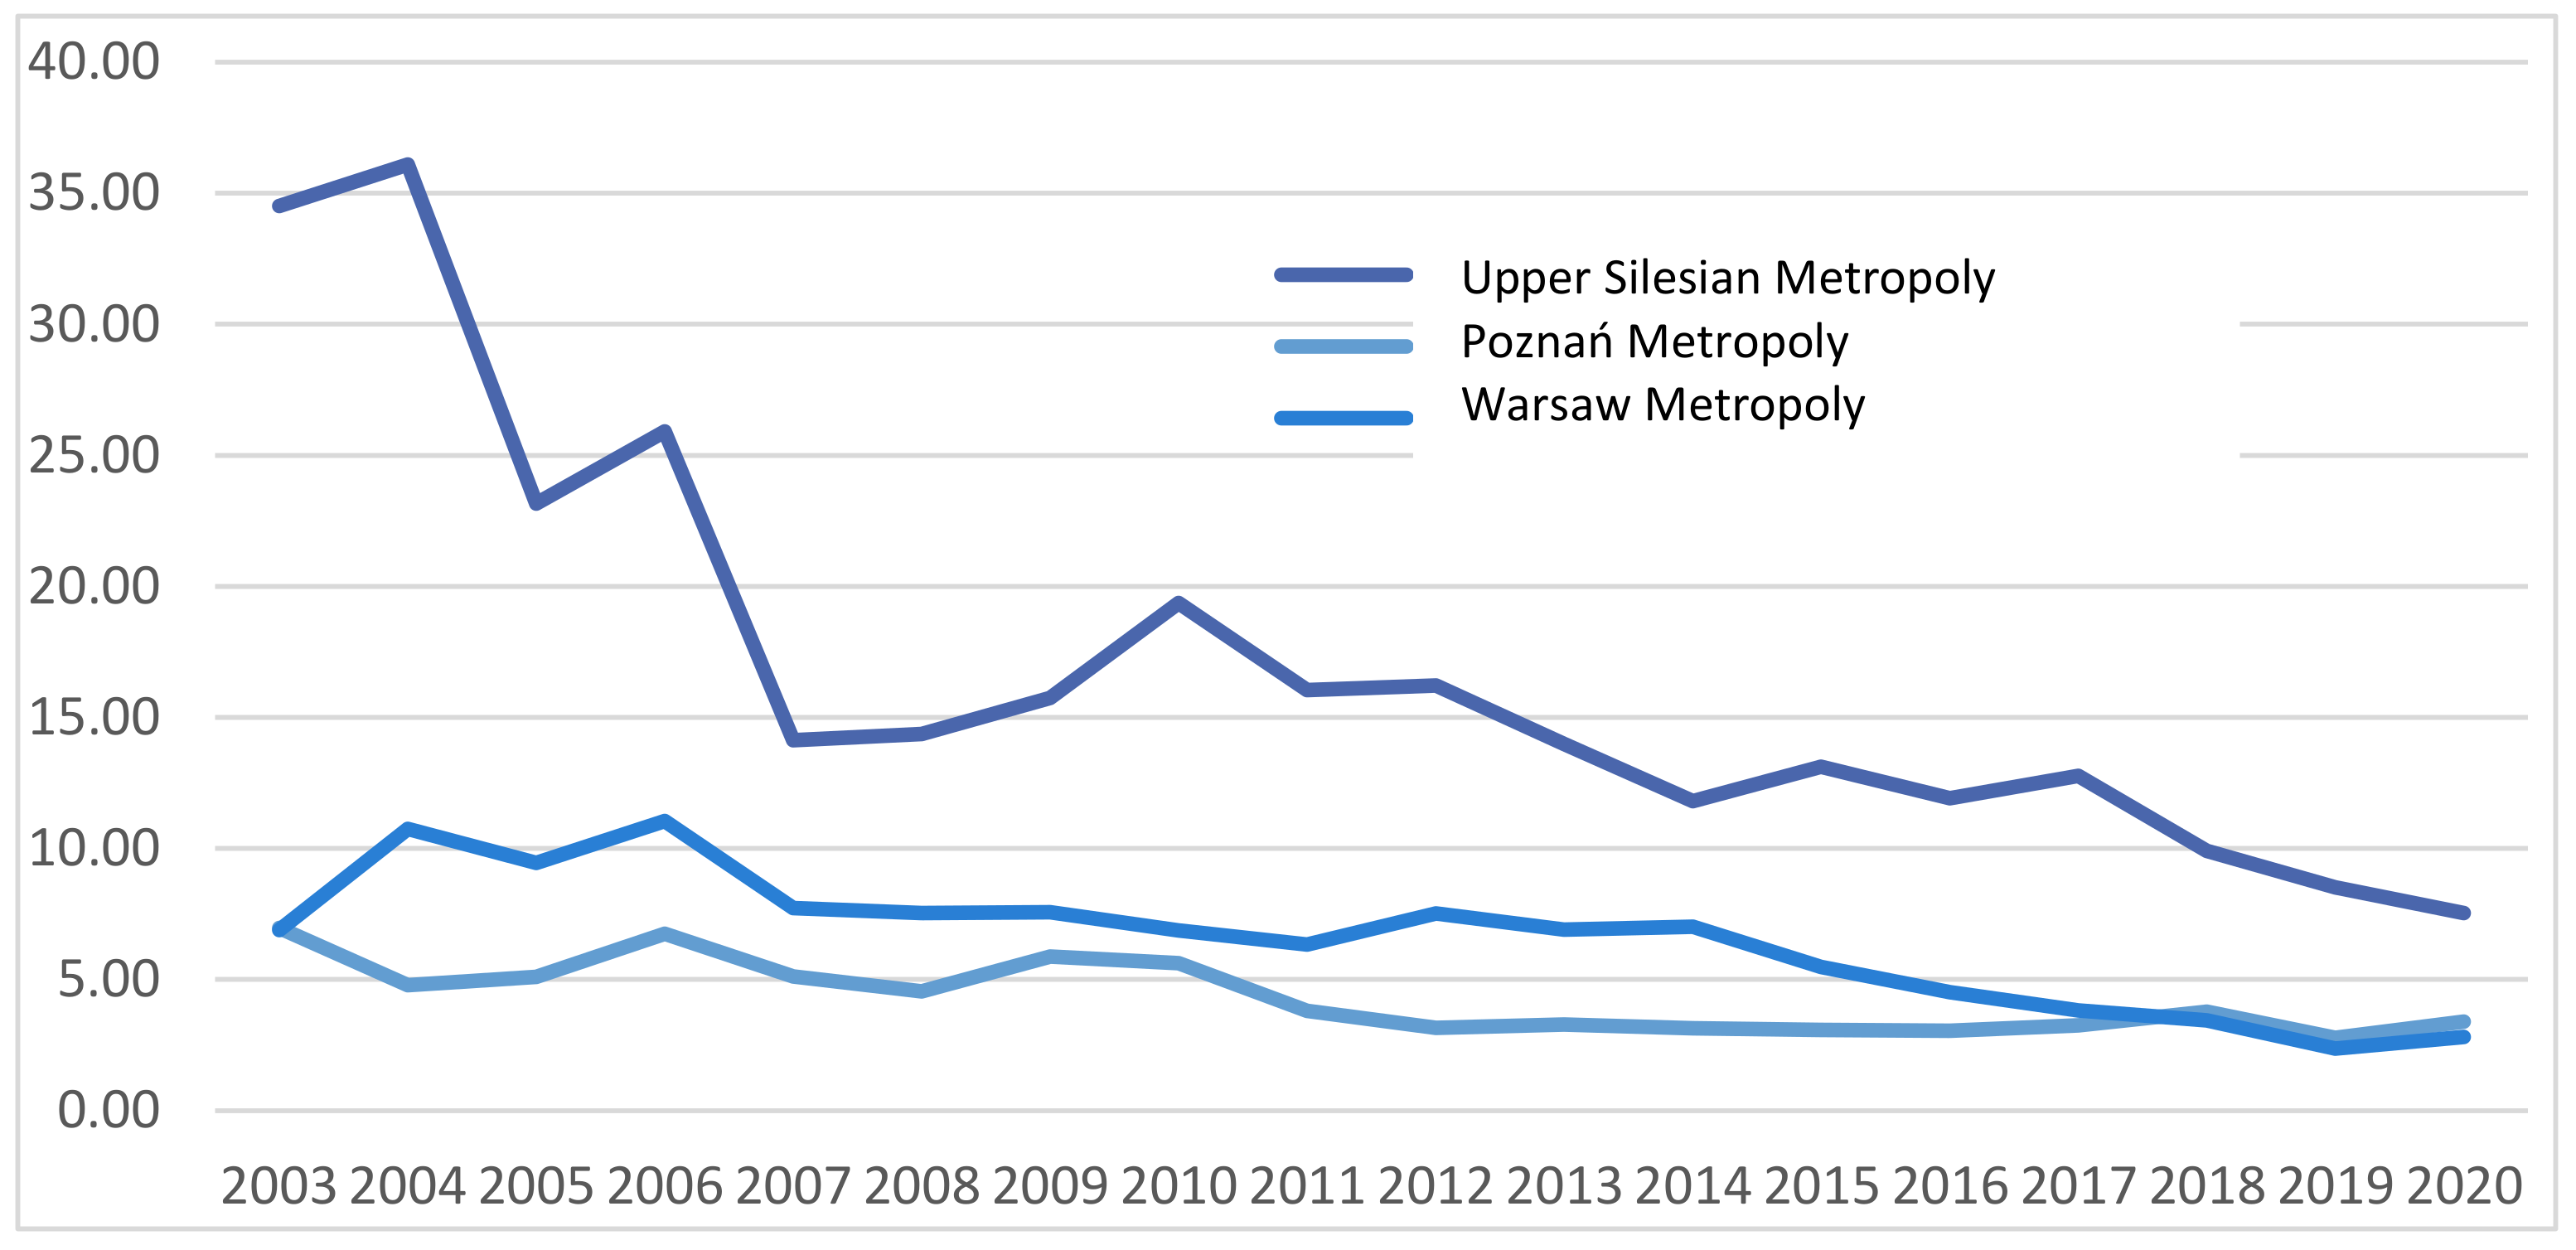
| Year | GZM Metropolis | Poznan Metropolis | Warsaw Capital Metropolis | Cumulative Averages |
|---|---|---|---|---|
| 2003 | 34.52 | 6.98 | 6.89 | 14.64 |
| 2004 | 36.09 | 4.79 | 10.75 | 16.57 |
| 2005 | 23.16 | 5.11 | 9.46 | 13.20 |
| 2006 | 25.91 | 6.75 | 11.06 | 14.70 |
| 2007 | 14.14 | 5.12 | 7.72 | 9.81 |
| 2008 | 14.38 | 4.54 | 7.54 | 10.00 |
| 2009 | 15.75 | 5.89 | 7.59 | 11.17 |
| 2010 | 19.35 | 5.63 | 6.88 | 13.37 |
| 2011 | 16.04 | 3.81 | 6.35 | 10.83 |
| 2012 | 16.22 | 3.16 | 7.51 | 11.24 |
| 2013 | 13.98 | 3.30 | 6.91 | 10.75 |
| 2014 | 11.80 | 3.14 | 7.02 | 9.36 |
| 2015 | 13.12 | 3.09 | 5.48 | 9.91 |
| 2016 | 11.92 | 3.06 | 4.52 | 8.97 |
| 2017 | 12.77 | 3.25 | 3.83 | 9.42 |
| 2018 | 9.92 | 3.77 | 3.44 | 7.62 |
| 2019 | 8.52 | 2.79 | 2.37 | 6.36 |
| 2020 | 7.54 | 3.39 | 2.81 | 6.43 |
| Cumulative averages | 16.66 | 4.56 | 7.84 | 11.45 |
Publisher’s Note: MDPI stays neutral with regard to jurisdictional claims in published maps and institutional affiliations. |
© 2022 by the authors. Licensee MDPI, Basel, Switzerland. This article is an open access article distributed under the terms and conditions of the Creative Commons Attribution (CC BY) license (https://creativecommons.org/licenses/by/4.0/).
Share and Cite
Kinelski, G.; Stęchły, J.; Bartkowiak, P. Various Facets of Sustainable Smart City Management: Selected Examples from Polish Metropolitan Areas. Energies 2022, 15, 2980. https://doi.org/10.3390/en15092980
Kinelski G, Stęchły J, Bartkowiak P. Various Facets of Sustainable Smart City Management: Selected Examples from Polish Metropolitan Areas. Energies. 2022; 15(9):2980. https://doi.org/10.3390/en15092980
Chicago/Turabian StyleKinelski, Grzegorz, Jakub Stęchły, and Piotr Bartkowiak. 2022. "Various Facets of Sustainable Smart City Management: Selected Examples from Polish Metropolitan Areas" Energies 15, no. 9: 2980. https://doi.org/10.3390/en15092980
APA StyleKinelski, G., Stęchły, J., & Bartkowiak, P. (2022). Various Facets of Sustainable Smart City Management: Selected Examples from Polish Metropolitan Areas. Energies, 15(9), 2980. https://doi.org/10.3390/en15092980