Article

Experimental Research on the Dynamic Characteristics and Voltage Uniformity of a PEMFC Stack under Subzero Temperatures

School of Automotive Studies, Tongji University, Shanghai 201804, China
*
Author to whom correspondence should be addressed.
Energies 2022, 15(9), 3062; https://doi.org/10.3390/en15093062
Submission received: 20 March 2022 / Revised: 19 April 2022 / Accepted: 20 April 2022 / Published: 22 April 2022

Abstract

:
The working life of a stack is basically determined by the behavior of its weakest monomer; therefore, during a dynamic loading process, high-voltage uniformity plays a key role in stack durability. This work experimentally investigated dynamic responses and voltage uniformity with different loading strategies from an initial state (open-circuit state) to a target current at subzero temperatures. The results presented that the maximum voltage coefficient variation Cv values, representing the relative standard deviation of the monomer voltage, increased from 19.75 to 35.65 and the voltage uniformity sharply decreased with the increase in loading sizes at the stack temperature of −4 °C. It was possible that this could result in the instability of the single cell voltage output and a voltage uniformity fluctuation with a high step loading amplitude. The voltage uniformity became worse as the stack temperature decreased from −2 °C to −8 °C, the voltage uniformity between single cells of the stack continued to deteriorate under a step current density of 0.15 A/cm2 at a relatively low temperature of −8 °C. By comparing several constant loading rate strategies, it could be ascertained that reducing the loading rate was conducive to voltage uniformity in the whole investigated process. A comparison of the different loading rates indicated that the square increasing loading rate strategy is the best strategy among them and a Cv threshold of 5.5 can be obtained during the whole load process at a temperature of −4 °C, which might be a guideline and provide a reference in actual engineering applications for PEMFC dynamic loading responses.

1. Introduction

With increasingly serious environmental pollution as well as the energy crisis and sustainability issues, hydrogen and fuel cell technologies are regarded as being potential solutions to these problems [1,2]. Basically, proton exchange membrane fuel cells (PEMFCs) can be classified into low temperature (below 100 °C) PEMFCs (LT-PEMFCs) and high temperature (higher than 120 °C) PEMFCs (HT-PEMFCs) based on different working temperatures. With many outstanding characteristics such as high efficiency, a compact construction, sustained operations, the potential for a low cost and volume, high durability, and a fast start-up ability, LT-PEMFCs have been regarded as one of the most promising power generation devices and have become popular in commercial applications around the world [2]. Nevertheless, the freezing start ability of LT-PEMFCs is extremely critical for its comprehensive application and requires further development [3]. The quality of a cold start for a stack affects its durability and then increases the costs of the fuel cell in turn [4]. Generally, a stack is formed by several dozens or hundreds of monomers and its worst single cell determines the stack lifetime; therefore, improving single cell voltage uniformity during the cold start process is of great significance for enhancing stack durability [5,6].
Considering the effect of a freezing start on PEMFC stack durability, most of the literature has mainly investigated the degradation phenomenon and mechanism caused by subfreezing temperatures [5,7,8] as well as influencing factors [4,9,10] and mitigation strategies [11,12,13,14,15,16,17,18]. Output performance degradation always occurs after repeated cold start cycles. Mishler et al. [7] showed that the electrocatalyst surface area and output performance decreased after conducting several cold start cycling tests. Zhong et al. [8] concluded that inconsistent degradation existed in the output characteristics among the monomers and the single cell near the reactant inlet had a maximum performance reduction. The quality of the cold start and subfreezing temperatures have a great influence on the degradation of the fuel cell [4,10]. Lin et al. [10] established that almost no obvious degradation existed after achieving a successful cold start. However, the output voltage significantly degraded when suffering a failed freezing start by testing the polarization curves of a fuel cell. Therefore, several mitigation strategies have been put forward to promote the ability and durability of a freezing start, including purges [4,11,12,13], supplying an antifreeze agent after shutdown [14,15], and optimizing a cold start strategy [16,17,18]. Wang et al. [11] pointed out that the initial membrane water content determined whether a successful cold start could be realized and suggested that a shutdown purge was necessary for a successful cold start. Song et al. [12] experimentally found that freezing damage could be highly effectively mitigated by purging the gas after a shutdown. The degradation in the anode catalyst layer did not occur when using air to purge the anode compartment. Gavello et al. [13] simulated a method for preventing the fuel cell from performance degradation by supplying different dry purge gases after a shutdown. The comparison showed that purging the cathode side with dry air and the anode side with dry H2 obtained the best results and only a 7.6% power density loss occurred after 20 repeated freezing start cycles. In the investigations of Cho et al. [14] and Knorr et al. [15], methanol antifreeze was used to reduce performance degradation. Knorr et al. [15] concluded that performance degradation was fully eliminated at current densities below 1.4 A/cm2. Nevertheless, the residual methanol could reduce the fuel cell performance because of the mixed cathode potentials at Tstack > 0 °C. A comparison of cold start strategies elucidated in the research of Amamou [16] and Luo [17] indicated that a controlling voltage mode was better than a loading current mode. In addition, a novel adaptive strategy was proposed by Amamou [18] for maximizing the heat formation and power, which showed a striking superior performance in comparison with the potentiostatic and galvanostatic modes.
Commonly, the voltage coefficient variation (Cv) expresses the voltage uniformity of a stack in the dynamic loading process, which is an efficient index to evaluate its lifetime. In the literature, there are generally two loading ways exerted on a stack during a dynamic loading process: step loading [19,20,21,22,23] and continuous loading [24,25,26]. Regarding step loading, the influence of the step size [19,20,23] and the load frequency [21,22,23] have received much attention in many investigations. Li et al. [19] observed that the larger the step size loaded, the greater the fluctuation of the monomer voltage; a longer time is needed to recover stability. Liu et al. [20] found that the maximum Cv values increased from 2.15% to 11.12% and a longer time was needed for the voltage to realize stabilization when varying the loading amplitude from 20 A to 110 A. Li [21] showed that increasing the step loading frequency affected the voltage uniformity negatively. Nevertheless, the results given in [22] pointed out that a high loading frequency could ensure the responses of the loading rate. A more effective loading method was developed by Li et al. [23] by considering the step amplitude and by concurrently varying the frequency, which was conducive to the overshoot and stability of the stack output voltage. Considering the continuous loading methods, many investigations have focused on the impacts of a constant loading rate on the Cv values. Migliardini et al. [24] determined the worst Cv value of 2.8% in an acceleration of about + 370 W/s. Corbo et al. [25] demonstrated very good dynamic voltage uniformity results with Cv values lower than 2.5% in two power acceleration slopes. In addition, a Cv value lower than 3% was monitored at 50 A/s by imposing different stoichiometric ratio values in their other study [26].
The loading strategy from an initial state (open-circuit state) to the target current and the corresponding dynamic characteristics is extremely important in subfreezing temperatures, especially for a successful cold start. In recent investigations, most loading methods have been step loading [27,28] and linear loading strategies [29,30]. Nevertheless, these studies paid little attention to voltage uniformity. In addition, step loading methods may result in a poor transient response and voltage non-uniformity, which leads to the reduction of the stack lifetime [21]. In this work, the effects of step loading size and stack temperature on the dynamic characteristics and voltage uniformity were investigated at subzero temperatures. Several current loading strategies were then evaluated and compared. Finally, an optimized loading strategy was put forward for improving voltage uniformity and heat generation.

2. Experimental Procedure

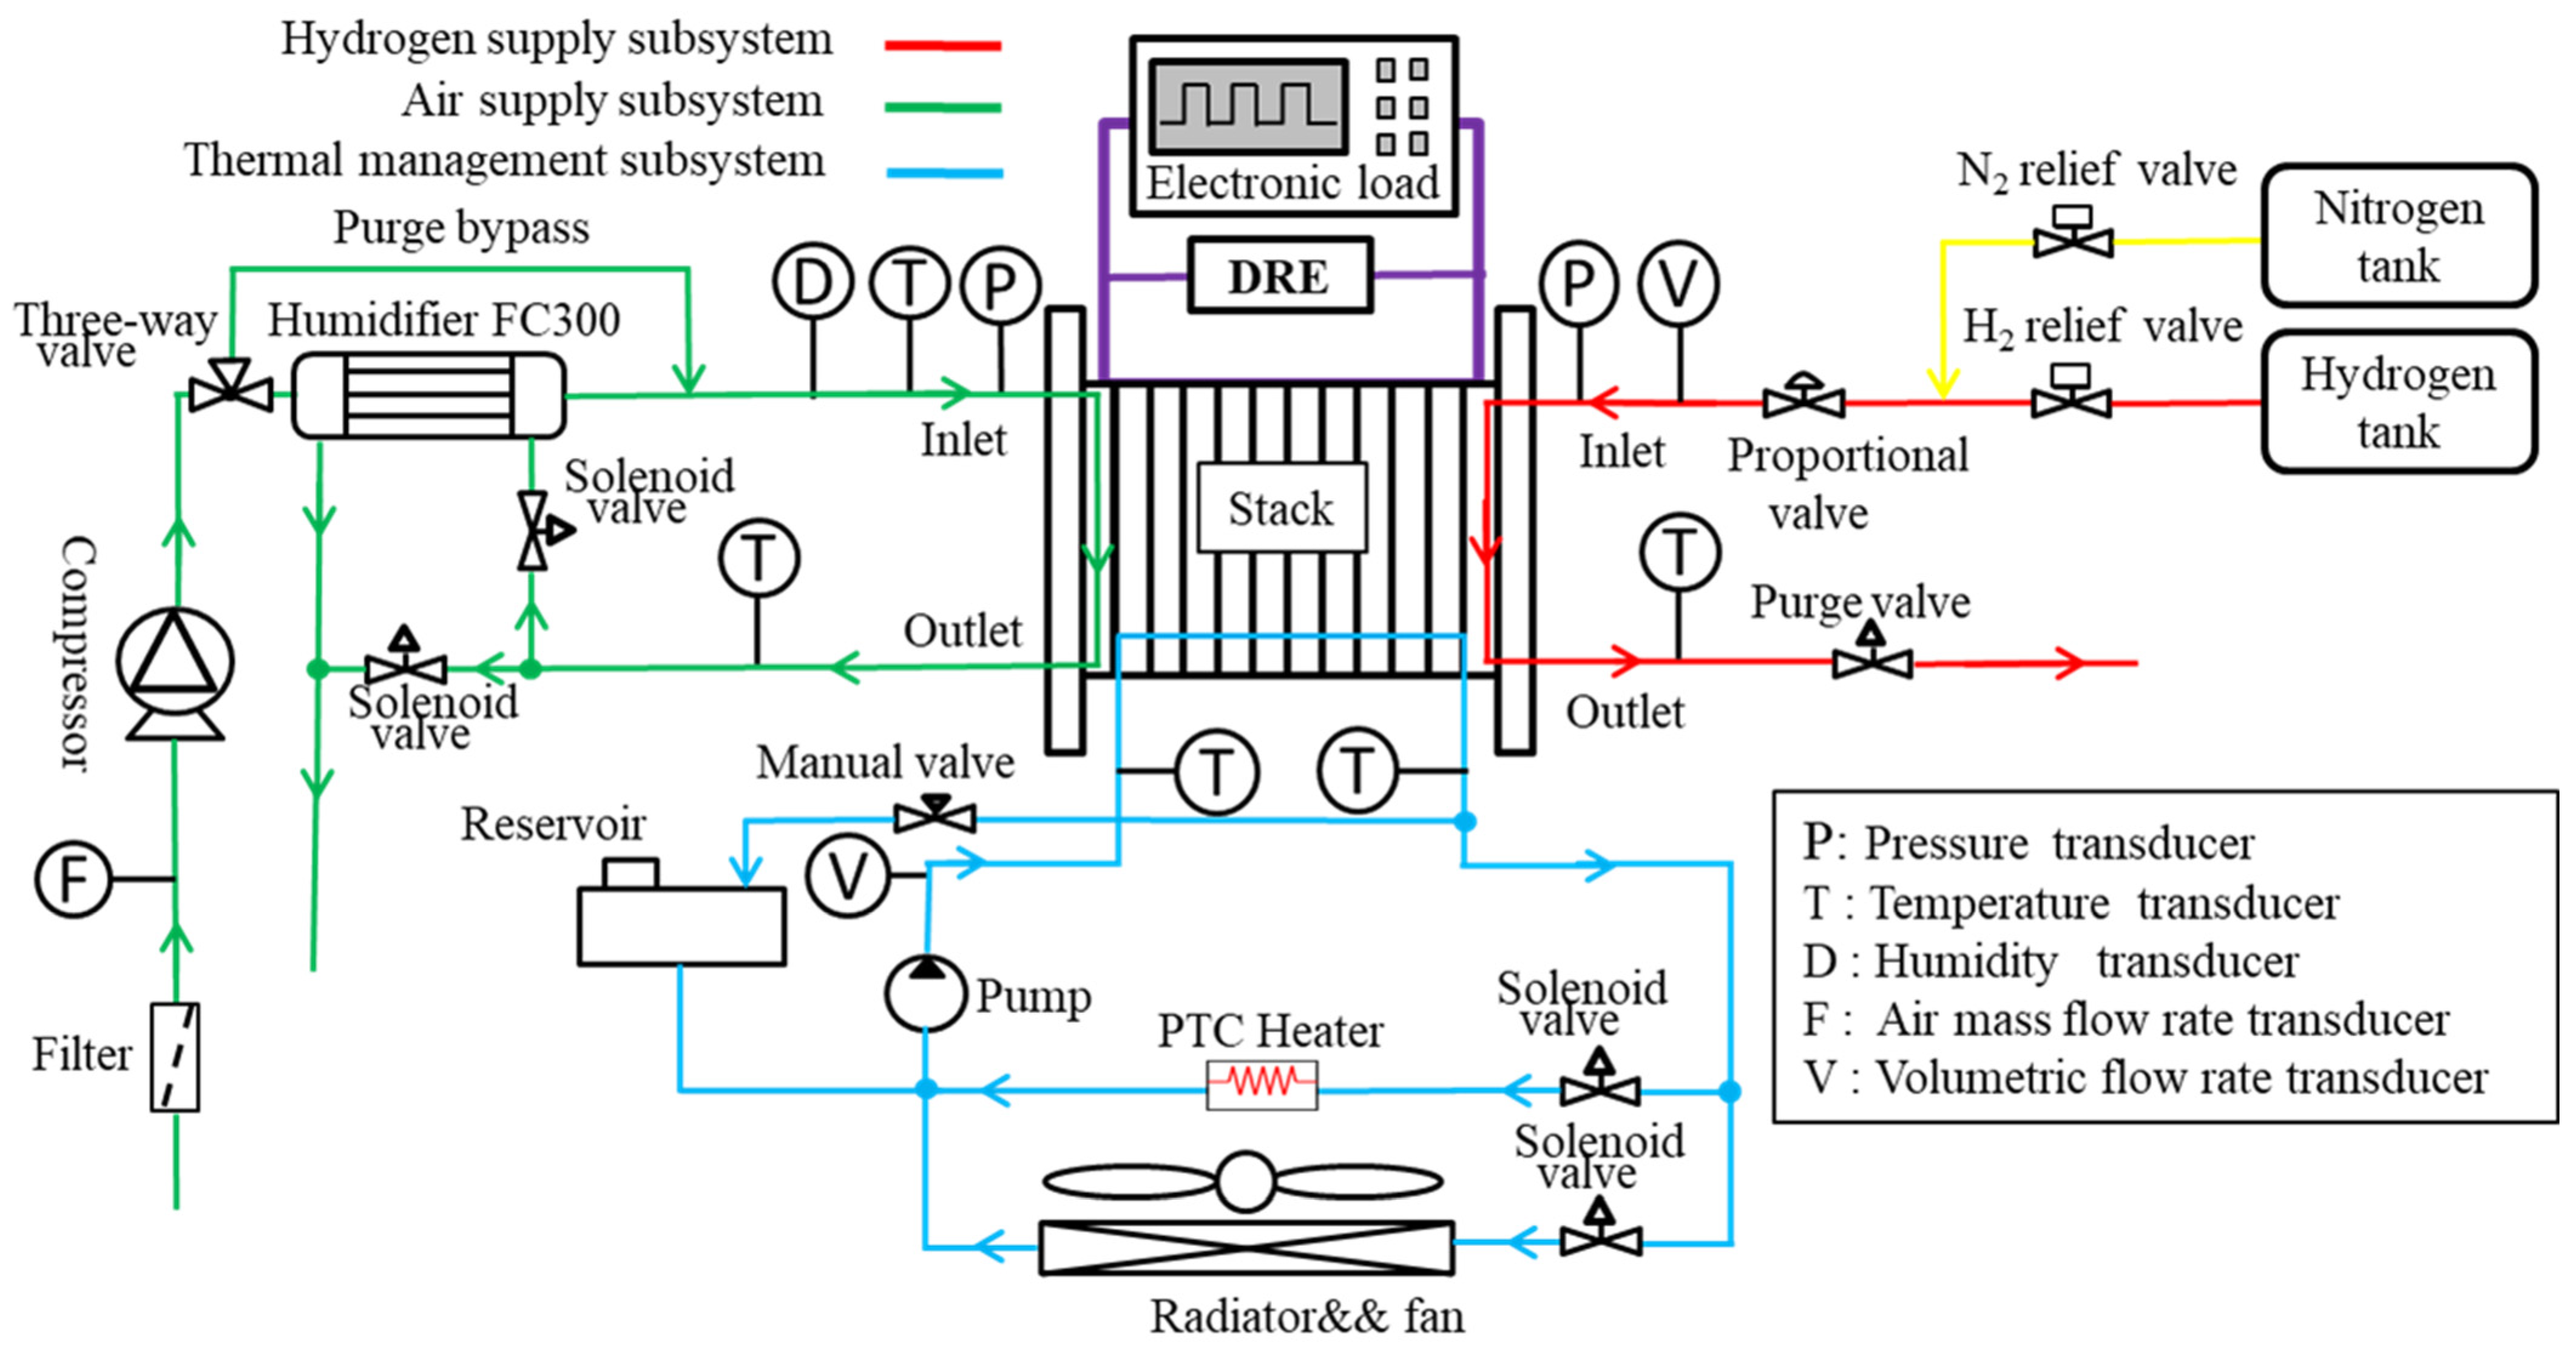
2.1. Experimental Setup

An integrated low pressure (<1.5 bar) PEMFC system was arranged and used in our test system. Figure 1 presents the complete schematic diagram of this experimental structure. The PEMFC stack was composed of 30 single cells with a composite graphite bipolar plate and a 312 cm2 effective active area. The membrane electrode assembly (MEA) consisted of a Nafion 211 membrane with a Pt loading of 0.7 mg/cm2. In terms of the hydrogen-supplying subsystem, there were two high-pressure tanks (15 Mpa) on the anode side, including a high-purity hydrogen source (>99.99%) and a nitrogen source. After being decompressed, these two gases were delivered to the anode through a relief valve and a proportional valve in the normal operating mode and the shutdown purge mode, respectively. In addition, a 3 m long cooling pipe was set up in the environmental chamber to ensure the inlet reaction gas temperature was almost the same as the environmental chamber. An anode normally works in a dead-end mode; thus, a purge valve periodically opens for discharging the residual gas and excessive water, which benefits the output performance recovery and improvement. As for the air-supplying system, a Domel 792 compressor was provided to offer oxygen for the stack cathode after flowing through a filter. To promote and ensure the output performance in the working mode, the inlet gas humidification before entering the stack was realized by installing a Perma Pure Humidifier FC300. The wet vapor or water was reused from the stack cathode outlet and two solenoid valves were set in this subsystem to ensure the cathode inlet humidity. However, the humidifier was excluded by using a purge bypass during the purge process at the shutdown for improving the purge efficiency. The thermal management subsystem, composed of two loops, aimed to make the stack work normally at a target temperature and avoid local hot spots in the MEA. A mixture of deionized pure water and ethylene glycol with a freezing point of −40 °C was utilized in this cooling circuit. The thermal masses of the smaller and larger loop were about 13.75 and 27.65 kJ/K, respectively; therefore, the stack temperature was almost stable during the initial loading process when simultaneously opening the whole two loops. In addition, the controlling and monitoring subsystem was the same as the test equipment introduced in detail in our previous research [20,31].

2.2. Experimental Procedure

The experiments were performed and conducted in an environmental chamber with a varying temperature range ability of −70 °C to 80 °C and a changing rate of 2 °C/min at a decreasing temperature. The target of this work mainly focused on the influence and comparison of different current-varying strategies affecting the performance output and voltage uniformity behavior at subzero temperatures. The stack voltage uniformity, based on the references [21,22,23], could be displayed as:
C v = 100 × [ i = 1 N ( V i V ¯ V ¯ ) 2 ] / N
where V i is the monomer voltage, V ¯ is the average voltage of a single cell, and N is the number of monomers in the stack. In addition, the maximum voltage difference Δ V cell ( V max V min ) was also utilized in this work to present the voltage uniformity.
The stack was activated before conducting the subfreezing experiment with operating conditions of the stack temperature of 60 °C, anode pressure of 1.2 bar, and cathode mass flow of 7.5 g/s. The single cell output average voltage was controlled at 0.65 V for 1 h. The stack was then purged with 10 g/s of air at the cathode side and 50 SLPM of N2 at the anode side to extract excessive liquid water from the stack. Next, the environmental temperature was set to the target temperature with a freezing time of at least 4 h after placing the fuel cell system into the environmental chamber. During the repeated dynamic experimental process, the cathode supplying the air inlet mass flow was kept at 11 g/s and the anode-supplying pressure was set at 1.3 bar. After performing these testing processes, the stack was warmed by opening the PTC and activated again for the next experiments.

3. Results

3.1. Effect of Different Step Sizes

The loading current is a general aspect of the freezing start of a fuel cell system. A lower current density generates a lesser amount of water, which can be easily absorbed by the ionomer of the membrane, this reduces the possibility of ice formation on the three-phase interface network in the catalyst layer, but operating at a relatively high current density is basically favorable to a cold start due to the increased reaction heat [32]. Therefore, the influence of the step sizes with different load current densities under a low temperature of −4 °C was investigated and the output performances, including the dynamic output characteristics and single cell voltage uniformity, were obtained accordingly.
Figure 2 shows the evaluation of different step current variations and the corresponding stack voltage outputs. The stack voltage decreased sharply from an open-circuit voltage (about 28.6 V) after the load was connected for 10 s under the stack temperature of −4 °C. The low temperature reduced the activity of the Pt catalyst as well as the conductivity of the proton exchange membrane, resulting in a higher activation loss and an ohmic loss of the investigated stack. Therefore, the performance output of the stack at a low temperature was poorer than that at a room or normal operating temperature. In addition, the corresponding output voltage of this testing stack decreased from 19.4 V to 14.6 V due to a larger ohmic loss and activation loss when increasing the loading current density from 0.1 A/cm2 to 0.25 A/cm2. At a current density of 0.25 A/cm2, the average single cell voltage was lower than 0.5 V and this average monomer voltage, within 0.3–0.5 V, was conducive to a freezing start [33].
The dynamic response performance process of this experimental fuel cell stack was relatively stable and there was no obvious increase over a short time. A slight undershoot could be observed for the whole step loading current. In terms of the dynamic characteristics at a normal fuel cell stack temperature, e.g., 70 °C, the voltage response presented two different time delays until a new stable state was reached, indicating an undershoot behavior when the load varied to a relatively high current [34,35]. The first-time delay referred to the time when the output voltage continued to drop until it reached the minimum value. The gas convection and diffusion process in the through-plane direction was related to this behavior. The two-phase movement of the liquid phase and gas phase resulted in a slow diffusion rate of the oxygen, an uneven distribution of oxygen concentration, and insufficient water removal. Therefore, the mass transfer limit was the key factor of the dynamic performance loss as the fuel cell worked at a higher current density [34]. The time delay of the second stage referred to the time before the voltage reached a new steady-state level due to the recovery of the membrane water content. When the load significantly changed, the membrane dehydrated and its resistance increased accordingly, resulting in a voltage loss. Due to the supply of humidifying gas and the internal hydrating balance between the electro-osmotic drag and back diffusion, the membrane became hydrated and the output voltage recovered. As the effective supply of humidified air increased the stoichiometric ratio of the cathode, a more stable and faster transient operation took place under the condition of a sufficient air stoichiometric ratio [34]. In this work, extra water at the shutdown was blown out of the stack and led to a level of dryness in the membrane. Under the condition of a climate temperature below 0 °C, the generated water might be absorbed by the ionomer of the catalytic layer and the membrane in a short time; thus, the phenomenon of liquid water freezing might not immediately occur in a CL [32]. Even if the stack was loaded a relatively high current, the absorbed water of the membrane could offset the tendency of becoming more dehydrated. There was also almost no water in the diffusion layer after purging at the shutdown, which positively influenced the gas convection and diffusion process. The supply of reaction gas in the stack was sufficient, which reduced the possibility of the voltage decreasing. Consequently, a stable transient dynamic response could almost be obtained and a slight undershoot was visible. In another investigation, a similar result was found from Jia [36]; a relatively steady status could be achieved when loading a current from an initial open-circuit state at a subzero temperature of −3 °C with a two single cell stack after conducting a dry N2 purge at the shutdown.
Figure 3 presents the voltage uniformity evolution of this testing stack during the whole process. A voltage uniformity with a low Cv value could be obtained under the condition of an open-circuit state at the low temperature of −4 °C. Apart from the stack temperature, the open-circuit voltage was mainly affected by hydrogen permeability in the membrane, which is also called the osmotic current or internal current [37]. A few influencing parameters such as water content, degradation, and the temperature of the membrane also affect hydrogen permeability. The size of the ion clusters and the amorphous region increased with an increase in the membrane water content and temperature, which caused a relatively higher diffusion coefficient of the gas crossover and the internal current across the membrane [38,39]. Therefore, the osmotic current was small and balanced in the single cell under both a relatively low stack temperature and the water content in the membrane. Considering the same manufacturing process and structural design between the different single cells for this new assembled stack, it could be inferred that each single cell output voltage became uniform and an excellent single cell voltage uniformity could be obtained in the investigated experiments.
As the loading current changed, a few cells showed an output voltage corresponding with the exerting current; however, others responded to an open-circuit state attributed to the differences of the catalytic layers among cells. There was a huge inconsistency between the single cell voltages of the stack [31]. The maximum Cv values increased from 19.75 to 35.65 and the voltage uniformity sharply decreased as the step current rose. As a result of a poor output performance at a low temperature, the step loading processes caused a greater voltage inconsistency. Therefore, this situation should be avoided as far as possible to enhance stack durability.
Clearly, the electrochemical reaction consumption increased as the loading current became larger. Combined with the reason that the gas concentration in the flow field between the individual fuel cells was different because of the intake manifold structure of the stack, this resulted in a greater gas concentration difference among the single cells [21,40]. The single cell voltage uniformity, with Cv values varying from 2.74 to 6.22, became worse when increasing the current density from 0.1 A/cm2 to 0.25 A/cm2. When the current density was less than or equal to 0.2 A/cm2, the voltage uniformity of this stack appeared to be relatively stable. However, under a high current density of 0.25 A/cm2, more water was produced and this was more likely to affect the electrochemical surface area, leading to the relative instability of the single cell voltage output and a voltage uniformity fluctuation.

3.2. Effect of Different Stack Temperatures

Temperature is another parameter affecting the low temperature characteristics of a PEMFC stack. Obviously, it is more difficult to successfully start as the temperature decreases. This section investigated the dynamic response performance and voltage uniformity of the stack under different temperatures (−2~−8 °C). Figure 4 shows the output characteristics of the stack voltage with different temperatures at 0.15 A/cm2. It could be seen from the results that the open-circuit voltage of the stack had almost no difference and fluctuated at about 28.6 V with various low temperature because of the low membrane permeability at subzero temperatures. When the load was connected at 10 s, the stack voltage sharply decreased and then presented a relatively stable output state. The output performance of the stack also decreased from 18.74 V to 14.3 V with the decrease in the stack temperature. As the reaction rate of the reactant molecules on the Pt catalyst and the transmission rate of H+ in the membrane were reduced, the activation loss and ohmic loss increased as the temperature decreased, which resulted in a worse output performance of the stack.
Figure 5 shows the evolution of voltage uniformity with different temperatures at 0.15 A/cm2 during the whole process. As discussed above, the fuel cell stack had a relatively low Cv value of about 0.948 at low temperatures due to a low osmotic current difference and there was little difference between the Cv values at various temperatures. Once the load was connected with a current density of 0.15 A/cm2, the single cell uniformity sharply deteriorated and the maximum Cv changed from 21.98 to 34.74. This was attributed to the increase in the changing amplitude in the stack voltage with a decrease in temperature, leading to larger non-uniformity between the single cells. With the exception of the dynamic output at −8 °C, the output characteristics almost achieved a stable output state within 1 s in most cases. Even if the same current density was loaded, the voltage uniformity became worse as the temperature decreased.
Under the condition of −8 °C, the voltage uniformity between the single cells of the stack continued to deteriorate. Figure 6 shows the evolution of Vmax, Vmin, Vaverage, and Δ V cell during the whole process. It could be seen that, during the whole open-circuit state, the maximum voltage and minimum voltage output of the single cells were stable and Δ V cell was nearly 35 mV. The corresponding voltage output then decreased with the change of the current step. Simultaneously, Δ V cell instantly increased with a maximum value of 0.66 V, which corresponded with the process of a sharp variation in the stack voltage uniformity Cv. Although the average single cell voltage maintained a stable output of 0.47 V, the minimum single cell voltage output continued to drop and finally decreased close to 0.2 V at a threshold of an emergency shutdown. This led to a continuous increase of Δ V cell , which indicated that the single cell voltage uniformity became worse, as shown in Figure 5. The produced water was more likely to be freezing at a lower temperature, which influenced the electrochemical reaction in the catalytic layer and the transmission of the reaction gas from the gas channel; thus, the voltage output difference between the single cells became significant. It could be inferred that Vmin could be reduced to 0 V or even a reverse voltage, which could cause irreversible degradation to the stack. In addition, this could reduce the durability of the stack according to the bucket effect. Therefore, a step load variation should be avoided as much as possible during the actual freezing start process, especially at an extremely low temperature.

3.3. Comparisons of Different Loading Strategies

It can be seen above that step loading at a low temperature resulted in a sharp reduction of the voltage uniformity, the instability of the dynamic output, and a continuous deterioration in the single cell performance output, which may lead to an emergency shutdown or reverse voltage and reduce the durability of the PEMFC stack. Nevertheless, it is of significance to load a relatively high target current for further heat generation to raise the fuel cell temperature. A constant loading rate strategy is popular and has been applied in the literature and in reports [29,31]. A few constant loading rate strategies were investigated by loading the current density from 0 to the target current density of 0.25 A/cm2 at different loading times of 5 s, 10 s, and 15 s under a stack temperature of −4 °C. The corresponding dynamic output performance and single cell uniformity Cv values were obtained and compared with the step loading strategy, respectively.
Figure 7a–f displays the comparison between the different constant loading rate strategies and the step loading strategy. The open-circuit voltage of the stack was almost the same with 28.6 V in the open-circuit for all investigated cases. The corresponding output voltage of the stack decreased with the increase in the continuous loading current. When the load current density reached 0.25 A/cm2 (78 A), the corresponding output was almost the same as that corresponding with the step loading, reaching 14.8 V. When the load current occurred, the voltage uniformity decreased due to the different sensitivity of the single cells to the current. Nevertheless, the voltage uniformity improved due to a smaller influence of the internal current after loading a small current (e.g., 20 A) [31]. The voltage uniformity of the single cells then decreased due to the difference between the gas distribution with the increase in the load current. The Cv value was almost the same at 5.5 as the load current maintained stability at 78 A. During the whole process of continuous loading, although there was a rapid increase, the variation of Cv was relatively slight and the maximum value of Cv was much smaller than that of step loading. Consequently, a continuous loading change was more conducive to increasing voltage uniformity than step loading under the whole loading process.
Figure 7g,h presents a comparison of these constant loading rate strategies. In the loading process, a higher loading rate resulted in a larger current output, but a smaller corresponding voltage output. Nevertheless, almost the same state could be reached once the current reached stabilization. For the output of voltage uniformity Cv values in the loading process, the changing trend of the Cv value was similar; the maximum Cv value decreased from 9.12 to 4.97 and then dropped to 4.57 in the initial stage of the loading current with a decrease in the loading rate. In addition, the Cv values were higher due to a higher current output in the whole varying process. Although the reducing loading rate was conducive to voltage uniformity in the whole investigated process, a high current was more conducive to heat generation and improved the low temperature starting ability of the fuel cells [32]. Therefore, a better loading strategy should be developed to enhance the dynamic output as much as possible for ensuring stack voltage uniformity and improving the durability of the stack.

3.4. Comparisons of Two Increasing Loading Rate Strategies

Considering the heat generation rate at low temperatures and voltage uniformity, two strategies—namely, the square and cure increasing loading rate—were investigated and compared with the other strategies (step loading and the constant loading rate) to obtain a better loading strategy at a stack temperature of −4 °C. As shown in the following equation, K0, K1 and K2 were the corresponding coefficients and t was the loading time of 10 s. The corresponding results were compared with other the strategies and the results are shown in Figure 8a–f.
  • I2 = I1 + K0 × t Constant loading rate strategy (I);
  • I2 = I1 + K1 × t2 Square increasing loading rate strategy (II);
  • I2 = I1 + K2 × t3 Cure increasing loading rate strategy (III).
Figure 8a–d compares the square or cure increasing loading rate strategy with the other two loading strategies, respectively. We found that, although the output current of the increasing exerting rate strategy during the loading process was lower than that of the other two strategies, the corresponding output voltage was the highest. In addition, the Cv values during the testing process displayed the lowest fluctuation state and the maximum Cv decreased under an initial small loading current status. Even if the Cv values increased as the output current became higher, they almost reached the same state at the initial open-circuit state and the corresponding loading current of 78 A, respectively.
Figure 8e,f shows the comparison of the performance output and voltage uniformity between the two increasing loading rate strategies. It could be seen from the results that the output current corresponding with the square increasing exerting rate strategy was higher than that corresponding with the cure increasing exerting rate strategy, but the output voltage was lower. There was little difference between the Cv values and the voltage uniformity also presented a similar varying trend during the whole loading process. However, obvious non-uniformity between the single cell voltages took place in the cure increasing loading rate strategy due to the faster current-varying rate. For example, at the end state of the loading current (almost 78 A), the maximum Cv value under the cure increasing loading rate strategy fluctuated to 6.22. However, the voltage uniformity Cv value of the square increasing loading rate strategy process remained within 5.5 in the whole exerting process. Therefore, the square increasing loading rate strategy was better than the cure increasing loading rate strategy and the Cv threshold could be regarded as 5.5 at a temperature of −4 °C in the exerting current process, which effectively improved the voltage uniformity and heat generation rate of the PEMFC. The proposed strategy could not only improve the durability of the fuel cell, but also may have a practical engineering significance for the actual dynamic loading process of a fuel cell.

4. Conclusions

This work investigated the dynamic responses and voltage uniformity under different loading strategies at subzero temperatures. A few conclusions can be summarized from the research above. The maximum Cv values increased from 19.75 to 35.65 and the voltage uniformity decreased sharply with the increase in the loading current in the step loading, which could result in the instability of the single cell voltage output and voltage uniformity fluctuation under a high step size. The voltage uniformity became worse as the temperature decreased from −2 °C to −8 °C. The voltage uniformity between the single cells of the stack continued to deteriorate at a current density of 0.15 A/cm2 at the relatively low temperature of −8 °C. In terms of the constant loading strategies, reducing the loading rate was conducive to voltage uniformity in the whole investigated process. The comparison of the different loading rate strategies indicated that the square increasing loading rate strategy was the best strategy and a Cv threshold of 5.5 could be obtained in the loading process at a temperature of −4 °C, which may be meaningful in engineering applications for actual PEMFC cell dynamic loading processes.

Author Contributions

Conceptualization, P.L. and S.X.; methodology, P.L.; formal analysis, P.L.; investigation, P.L. and S.X.; data curation, P.L.; writing—original draft preparation, P.L. and S.X.; writing—review and editing, P.L. and S.X.; visualization, S.X.; supervision, S.X.; project administration, S.X.; funding acquisition, S.X. All authors have read and agreed to the published version of the manuscript.

Funding

This research received no external funding.

Institutional Review Board Statement

Not applicable.

Informed Consent Statement

Not applicable.

Data Availability Statement

Not applicable.

Conflicts of Interest

The authors declare no conflict of interest.

References

  1. Kim, A.R.; Vinothkannan, M.; Yoo, D.J. Sulfonated fluorinated multi-block copolymer hybrid containing sulfonated(poly ether ether ketone) and graphene oxide: A ternary hybrid membrane architecture for electrolyte applications in proton exchange membrane fuel cells. J. Energy Chem. 2018, 27, 1247–1260. [Google Scholar] [CrossRef]
  2. Ryu, S.K.; Vinothkannan, M.; Kim, A.R.; Yoo, D.J. Effect of type and stoichiometry of fuels on performance of polybenzimidazole-based proton exchange membrane fuel cells operating at the temperature range of 120–160 °C. Energy 2021, 238, 121791. [Google Scholar] [CrossRef]
  3. Luo, Y.; Jiao, K. Cold start of proton exchange membrane fuel cell. Prog. Energy Combust. Sci. 2018, 64, 29–61. [Google Scholar] [CrossRef]
  4. Lin, R.; Jiang, Z.H.; Ren, Y.S.; Shi, W. Performance degradation and strategy optimization of PEMFCs under subfreezing temperature. J. Tongji Univ. (Nat. Sci.) 2018, 46, 658–666. [Google Scholar]
  5. Lin, R.; Zhu, Y.; Ni, M.; Jiang, Z.; Lou, D.; Han, L.; Zhong, D. Consistency analysis of polymer electrolyte membrane fuel cell stack during cold start. Appl. Energy 2019, 241, 420–432. [Google Scholar] [CrossRef]
  6. Dai, C.H.; Shi, Q.; Chen, W.Q.; Li, Y.; Li, Q. A Review of the Single Cell Voltage Uniformity in Proton Exchange Membrane Fuel Cells. Proc. CSEE 2016, 36, 1289–1302. [Google Scholar]
  7. Mishler, J.; Wang, Y.; Mukherjee, P.P.; Mukundan, R.; Borup, R.L. Subfreezing operation of polymer electrolyte fuel cells: Ice formation and cell performance loss. Electrochim. Acta 2012, 65, 127–133. [Google Scholar] [CrossRef] [Green Version]
  8. Zhong, D.; Lin, R.; Jiang, Z.; Zhu, Y.; Liu, D.; Cai, X.; Chen, L. Low temperature durability and consistency analysis of proton exchange membrane fuel cell stack based on comprehensive characterizations. Appl. Energy 2020, 264, 114626. [Google Scholar] [CrossRef]
  9. Huang, Y. Research on Proton Exchange Membrane Fuel Cell Start-Up at Subzero Temperature. Master’s Thesis, Wuhan University of Technology, Wuhan, China, 2015. [Google Scholar]
  10. Lin, R.; Lin, X.; Weng, Y.; Ren, Y. Evolution of thermal drifting during and after cold start of proton exchange membrane fuel cell by segmented cell technology. Int. J. Hydrog. Energy 2015, 40, 7370–7381. [Google Scholar] [CrossRef]
  11. Wang, X.; Tajiri, K.; Ahluwalia, R. Water transport during startup and shutdown of polymer electrolyte fuel cell stacks. J. Power Sources 2010, 195, 6680–6687. [Google Scholar] [CrossRef]
  12. Song, K.-Y.; Kim, H.-T. Effect of air purging and dry operation on durability of PEMFC under freeze/thaw cycles. Int. J. Hydrogen Energy 2011, 36, 12417–12426. [Google Scholar] [CrossRef]
  13. Gavello, G.; Zeng, J.; Francia, C.; Icardi, U.; Graizzaro, A.; Specchia, S. Experimental studies on Nafion® 112 single PEM-FCs exposed to freezing conditions. Int. J. Hydrog. Energy 2011, 36, 8070–8081. [Google Scholar] [CrossRef]
  14. Cho, E.A.; Ko, J.J.; Ha, H.Y.; Hong, S.A.; Lee, K.Y.; Lim, T.W.; Oh, I.H. Effects of Water Removal on the Performance Deg-radation of PEMFCs Repetitively Brought to <0 °C. J. Electrochem. Soc. 2004, 151, A661–A665. [Google Scholar] [CrossRef]
  15. Knorr, F.; Sanchez, D.G.; Schirmer, J.; Gazdzicki, P.; Friedrich, K.A. Methanol as antifreeze agent for cold start of automotive polymer electrolyte membrane fuel cells. Appl. Energy 2019, 238, 1–10. [Google Scholar] [CrossRef]
  16. Amamou, A.; Boulon, L.; Kelouwani, S. Comparison of self cold start strategies of automotive Proton Exchange Membrane Fuel Cell. In Proceedings of the 2018 IEEE International Conference on Industrial Technology (ICIT), Lyon, France, 19–22 February 2018; pp. 904–908. [Google Scholar] [CrossRef]
  17. Luo, Y.; Jiao, K.; Jia, B. Elucidating the constant power, current and voltage cold start modes of proton exchange membrane fuel cell. Int. J. Heat Mass Transf. 2014, 77, 489–500. [Google Scholar] [CrossRef]
  18. Amamou, A.; Kandidayeni, M.; Boulon, L.; Kelouwani, S. Real time adaptive efficient cold start strategy for proton exchange membrane fuel cells. Appl. Energy 2018, 216, 21–30. [Google Scholar] [CrossRef] [Green Version]
  19. Li, M.; Dai, C.; Guo, A.; Chen, W. Experimental study on dynamic voltage uniformity of a 2-kW air-cooled PEMFC. Electr. Eng. 2018, 100, 2725–2735. [Google Scholar] [CrossRef]
  20. Liu, P.C.; Zhang, B.T.; Xu, S.C. Experimental Research on Voltage Uniformity of a PEMFC Stack under Dynamic Step Loading. In Proceedings of the SAE WCX Digital Summit, Detroit, MI, USA, 13–15 April 2021. [Google Scholar]
  21. Li, Y.K. Research on Voltage Uniformity and Control Strategy of Proton Exchange Membrane Fuel Cell Stack. Ph.D. Thesis, Southwest Jiao Tong University, Wuhan, China, 2015. [Google Scholar]
  22. Zhao, Y.Q. Research on Dynamic Response of Air-Cooled PEMFC Considering Uniformity. Master’s Thesis, Southwest Jiao Tong University, Wuhan, China, 2016. [Google Scholar]
  23. Li, Y.; Zhao, X.; Liu, Z.; Li, Y.; Chen, W.; Li, Q. Experimental study on the voltage uniformity for dynamic loading of a PEM fuel cell stack. Int. J. Hydrog. Energy 2015, 40, 7361–7369. [Google Scholar] [CrossRef]
  24. Migliardini, F.; Di Palma, T.; Gaele, M.; Corbo, P. Cell voltage analysis of a 6 kW polymeric electrolyte fuel cell stack designed for hybrid power systems. Mater. Today Proc. 2019, 10, 393–399. [Google Scholar] [CrossRef]
  25. Corbo, P.; Migliardini, F.; Veneri, O. Dynamic behavior of hydrogen fuel cells for automotive application. Renew. Energy 2009, 34, 1955–1961. [Google Scholar] [CrossRef]
  26. Corbo, P.; Migliardini, F.; Veneri, O. Experimental analysis of a 20 kWe PEM fuel cell system in dynamic conditions representative of automotive applications. Energy Convers. Manag. 2008, 49, 2688–2697. [Google Scholar] [CrossRef]
  27. Xu, P.; Zhang, J.; Guo, X.; Gao, Y.; Xu, S.C. An experimental investigation into gas purge after shutdown and cold start performance of proton exchange membrane fuel cell. J. Tongji Univ. (Nat. Sci.) 2017, 45, 126–131. [Google Scholar]
  28. Xu, P. Research on Thermal and Water Transport Mechanism in Subfreezing Temperature for Proton Exchange Membrane Fuel Cell. Ph.D. Thesis, Tongji University, Shanghai, China, 2019. [Google Scholar]
  29. Chen, P.; Chen, X.S. Experimental investigation on −10 °C start performance of a PEM fuel cell power system for automotive application. J. Automot. Saf. Energy 2016, 7, 427–432. [Google Scholar]
  30. Kota, M.; Yoshiaki, N.; Yasuhiro, N.; Mikio, K.; Tomoya, O. Development of Fuel Cell Hybrid Vehicle Rapid Start-up from Sub-Freezing Temperatures. In Proceedings of the SAE WCX Digital Summit, Detroit, MI, USA, 13–15 April 2021. [Google Scholar]
  31. Liu, P.; Xu, S.; Fu, J.; Liu, C. Experimental investigation on the voltage uniformity for a PEMFC stack with different dynamic loading strategies. Int. J. Hydrog. Energy 2020, 45, 26490–26500. [Google Scholar] [CrossRef]
  32. Jiao, K.; Li, X. Cold start analysis of polymer electrolyte membrane fuel cells. Int. J. Hydrogen Energy 2010, 35, 5077–5094. [Google Scholar] [CrossRef]
  33. Pinton, E.; Fourneron, Y.; Rosini, S.; Antoni, L. Experimental and theoretical investigations on a proton exchange membrane fuel cell starting up at subzero temperatures. J. Power Sources 2009, 186, 80–88. [Google Scholar] [CrossRef]
  34. Cho, J.; Kim, H.-S.; Min, K. Transient response of a unit proton-exchange membrane fuel cell under various operating conditions. J. Power Sources 2008, 185, 118–128. [Google Scholar] [CrossRef]
  35. Chen, H.C. Analysis of the Dynamic Response Affecting the Fuel Cell Lifetime and Economic Evaluation of the Fuel Cell. Ph.D. Thesis, Tsinghua University, Beijing, China, 2015. [Google Scholar]
  36. Jia, L.; Tan, Z.; Kang, M.; Zhang, Z. Experimental investigation on dynamic characteristics of proton exchange membrane fuel cells at subzero temperatures. Int. J. Hydrog. Energy 2014, 39, 11120–11127. [Google Scholar] [CrossRef]
  37. Frano, B.; Li, D.H.; Lian, X.F. PEM fuel cell: Theory and practice. In The 2nd Edition of the Original Book; China Machine Press: Beijing, China, 2016; pp. 31–32. [Google Scholar]
  38. Nguyen, T.-T.; Fushinobu, K. Effect of operating conditions and geometric structure on the gas crossover in PEM fuel cell. Sustain. Energy Technol. Assess. 2020, 37, 100584. [Google Scholar] [CrossRef]
  39. Baik, K.D.; Hong, B.K.; Kim, M.S. Effects of operating parameters on hydrogen crossover rate through Nafion® membranes in polymer electrolyte membrane fuel cells. Renew. Energy 2013, 57, 234–239. [Google Scholar] [CrossRef]
  40. Qi, J. Study on Individual Cell Voltage Uniformity of PEMFC Stack. Master’s Thesis, Wuhan University of Technology, Wuhan, China, 2011. [Google Scholar]
Figure 1. Schematic diagram of PEMFC system test platform.
Energies 15 03062 g001
Figure 2. Evolution of different step current variations and corresponding stack voltage outputs.
Energies 15 03062 g002
Figure 3. Evolution of voltage uniformity at different loading current densities.
Energies 15 03062 g003
Figure 4. Evolution of stack voltage with different temperatures at 0.15 A/cm2.
Energies 15 03062 g004
Figure 5. Evolution of voltage uniformity with different temperatures at 0.15 A/cm2.
Energies 15 03062 g005
Figure 6. Evolution of maximum, minimum, average single cell voltage, and single cell voltage range (Vmax, Vmin, Vaverage, and Δ V cell ) with the stack temperature of −8 °C.
Energies 15 03062 g006
Figure 7. Comparison of output characteristics among step loading and constant rate strategies with loading times of 5, 10, and 15 s. (a,c,e,g) present exerting current and stack voltage; (b,d,f,h) present exerting current and Cv values.
Energies 15 03062 g007aEnergies 15 03062 g007b
Figure 8. Comparison of output characteristics among step loading, constant loading rate, square increasing loading rate, and cure increasing loading rate strategy. (a,c,e) present exerting current and stack voltage; (b,d,f) present exerting current and Cv values.
Energies 15 03062 g008aEnergies 15 03062 g008b
Publisher’s Note: MDPI stays neutral with regard to jurisdictional claims in published maps and institutional affiliations.

