Abstract
Transportation carbon emission reduction has become an important driving point for China to achieve carbon peak and carbon neutrality. Based on the three-dimensional grey correlation analysis model, taking the five factors affecting transportation carbon emissions, namely, population, GDP, tertiary industry, energy structure and logistics scale, as the research object, the transportation carbon emissions of China’s low-carbon pilot and nonpilot provinces from 2010 to 2019 are calculated based on the Intergovernmental Panel on Climate Change (IPCC) carbon emission accounting method. The time series grey correlation degree and regional grey correlation degree of each influencing factor and traffic carbon emission are obtained using the provincial data, so as to provide policy suggestions for China to achieve the goal of “carbon peak and carbon neutrality” in the field of transportation. The results show that the descending order of the five influencing factors on transportation carbon emissions is: energy structure, logistics scale, population, GDP and tertiary industry. From 2010 to 2019, the time series grey correlation degree between the five influencing factors and transportation carbon emissions shows a fluctuating downward trend, but the impact of demographic factors has become more and more obvious in the past two years; According to the difference of grey correlation degree in different regions, the traffic development of various provinces in China is different, so it is necessary to formulate relevant policies individually.
1. Introduction
Climate change is one of the most pressing and important international issues in the world today. IPCC predicts that from 1990 to 2100, the global temperature will increase by 1.4 C to 5.8 C. Due to the continuous increase of carbon emissions, the problems caused by the greenhouse effect are becoming more and more serious, which has attracted great attention from the international community. General Secretary Jinping Xi announced to the world at the United Nations General Assembly in 2020 that China will uphold the concept of a community with a shared future for mankind, continue to make arduous efforts, increase its nationally determined contribution, adopt more effective policies and measures, strive to peak carbon dioxide emissions by 2030 and work towards becoming carbon neutral by 2060. This is an inevitable requirement for China to implement new development concepts and achieve high-quality development, as well as an important manifestation of the responsibility of a major country.
The eight key areas to achieve carbon neutrality include electricity, transportation, industry, new materials, construction, agriculture, negative carbon emissions and information communication and digitalization. Among them, carbon emissions generated by the transportation sector account for 10.7% of the total global carbon emissions, becoming an important factor affecting the carbon peak. It is worth noting that China has become the largest carbon dioxide emitter in the world. When the growth rate of carbon emissions in energy, industry and other sectors slows down or even declines, carbon emissions from the transportation sector still show a trend of rapid growth in the short and medium term and slow growth in the long term [1]. Therefore, TCE reduction has become a key link in helping China achieve its double carbon goal.
The transportation sector is an important source of mobile carbon dioxide emissions, and its carbon emissions are one of the important causes of air pollution in China, and may be the largest contributor to carbon dioxide emissions in the future [2]. The International Road Federation (IRF) predicts that by 2050, the energy consumption related to transportation will increase by 21 to 25% compared with 2016, and the double carbon goal will bring enormous pressure to the transportation sector. In October 2021, the Opinions of the Central Committee of the Communist Party of China and the State Council on Completely, Accurately and Comprehensively Implementing the New Development Concept and Doing a Good Job in Carbon Peaking and Carbon Neutralization was released with specific measures such as transportation structure, promotion of energy-saving and low-carbon vehicles and active guidance of low-carbon travel.
The Chinese government actively advocates the construction of ecological civilization and strives to develop a low-carbon economy, to achieve the target of carbon dioxide emission reduction. In 2010, the “Notice Regarding the Development of Low Carbon and Low-carbon City Pilot Provinces” was released [3]. Therefore, this paper takes the first batch of low-carbon pilot provinces, including Guangdong, Liaoning, Hubei, Shaanxi and Yunnan, as well as Hunan, Ningxia and Qinghai, where no pilot city has been established so far, as the research objects of TCE research. The main reasons are as follows:
(1) In terms of national low-carbon policies, low-carbon pilot cities refer to those with implementation of low-carbon economy and establishment of a virtuous and recyclable energy ecosystem. Under the supervision and management of the government, these cities aim to build a low-carbon society, and some of them expected to achieve carbon peak have gained certain results. On the other hand, non-pilot cities have not received corresponding policy guidance; therefore, two types of provinces are selected for comprehensive analysis.
(2) In terms of economic development, based on the data of the National Bureau of Statistics of China, Guangdong has always stood at the forefront of Chinese GDP ranking, with fast economic development; Hubei and Hunan’s economic development is positioned in the middle and upper level, and the GDP growth rate of the Hunan Province has been high in the past two years; Shaanxi and Yunnan are in the middle and lower gradients in the ranking; Ningxia and Qinghai are relatively backward regions in economic and social development, restricted by geographical, climate and other factors, but their growth rate is relatively fast. To a certain extent, transportation has driven the expansion of the economy, and the development of the economy has also promoted the development and improvement of the transportation industry.
(3) At the transport infrastructure level, according to the data of the China Statistical Yearbook, Guangdong ranks first in expressway density among all provinces (excluding municipalities directly under the Central Government), with Hubei and Hunan in the middle, Liaoning, Ningxia, Shaanxi and Yunnan in the middle and lower reaches, and Gansu and Qinghai in the middle and lower reaches. This paper covers different types of provinces for research.
2. Literiture Review
2.1. Influencing Factors of TCE
At present, the academic community identifies the influencing factors of TCE mainly based on factor decomposition models, economic models, etc., with the widely used Logarithmic Mean Divisia Index (LMDI). The LMDI method has the advantages of complete residual decomposition, good elasticity, good aggregation consistency and strong practicability. BWAng [4] has systematically analyzed the LMDI method as well as its application method, which lays a theoretical foundation for the subsequent research. Yu Jie et al. [5] decompose transportation modes based on the LMDI logarithmic average weight method, and quantitatively analyze the main influencing factors of carbon emission changes. Jean et al. [6] use the LMDI method to analyze the decoupling relationship between energy CO2 emissions and growth in the transportation industry in Cameroon. Wang Y. et al. [7] propose a new index decomposition framework to overcome the shortcomings of existing index decomposition methods. For the first time, they have used GDIM to analyze the driving factors of carbon emissions in China’s transportation industry from 2000 to 2015, finding that energy carbon emission intensity is the key to reducing TCE. Zeng Xiaoying et al. [8] have constructed a geographically weighted regression model to analyze the influencing factors of TCE. To sum up, there are still some deficiencies in the research on the influencing factors of TCE. Although the LMDI method and mathematical statistics together with other methods are widely used in the research on identifying the influencing factors, the LMDI method decomposes the influencing factors into product form, and the factors are interdependent, the decomposition results are not accurate enough and the mathematical statistics method often fails the standard statistical test so that the modeling result is not good. In the literature [9,10,11,12,13,14], it is found that the grey correlation degree analysis method is widely used in the analysis of factors affecting carbon emissions in industry and other fields, and that the model has no restrictions on samples and distribution laws, with a small amount of calculation and results that agree with qualitative analyses. With the increasing complexity of research, the grey correlation analysis model has been extended from the correlation analysis of two-dimensional data to that of multi-dimensional data, and the optimized three-dimensional model can better reflect the degree of correlation between research objects [15]. In view of this, this paper studies the influencing factors of TCE based on the three-dimensional grey correlation analysis model.
Many experts and scholars have analyzed the effect of a certain factor on the carbon emissions of transportation. Lim [16] analyzes the impact of urban spatial distribution on TCE. Solaymani et al. [17] analyze the influencing factors of transportation carbon emission countries, finding that the main factors are power structure and economic output effect. Shao H. et al. [18] study the negative impact on the spatial correlation network of China’s provincial transportation carbon emission efficiency in terms of provincial distance and economic development level. Meng J. [19] has established a model involving population, technology and economic factor based on the transportation carbon emission data of 30 provinces and cities in China, and found that the impact of population on TCE is significantly positive. Ou G. et al. [20] analyze the relationship between transportation technology progress and carbon dioxide emissions. Wang L. et al. [21] explore the connotation of the impact of transportation infrastructure on regional carbon emissions. Shang L. [22] studies the impact of transportation structure. Based on the above literature, this paper mainly evaluates the impact of five factors, namely, population (), gross industrial production (), tertiary industry (), energy structure () and logistics scale (), on TCE.
2.2. Emission Reduction Potential in Transportation Sector
Some scholars have studied the medium and long-term carbon emission scenarios of transportation based on the analysis of carbon emission reduction potential. Liimatainen et al. [23] create six scenarios based on seven indicators of carbon dioxide emissions from freight transport in Finland, and the results show that the average annual emission reduction in 2030 will be more than 26%. Hickman [24] evaluates different policies and uses a retrospective approach to study the feasible options for the UK transport sector to achieve a target of 60% reduction by 2030. Fan et al. [25] have applied the Long-term Energy Replacement Planning (LEAP) model to analyze the energy demand and major greenhouse gas (GHG) emissions under different scenarios from 2016 to 2030. The analysis results show that government control, public transportation and the development of new energy vehicles have significant effects on energy saving and emission reduction. Based on this, the time for carbon peaking is further studied. Li and Yu [26] predict that under the background of promoting the use of clean fuel vehicles and improving vehicle fuel efficiency, carbon dioxide emissions from the urban passenger transport sector in China may peak in 2030. Wang J. et al. [27] analyze the carbon emission reduction potential of China’s transportation, and study the three scenarios of technological progress, structural optimization and low-carbon development, each with different emission reduction potential.
2.3. Emission Reduction Measures in Transportation Sector
In addition, studies have shown that relevant emission reduction measures can contribute to reducing carbon emissions from transportation. By establishing the Asia-Pacific Integrated Transport Model (AIM), Rz A. et al. [28] have shown that decarbonization goals can be effectively achieved by implementing transportation policies such as electric vehicle deployment, speed regulation, pedestrian-friendly design and bicycle-oriented development. The findings of Dhar et al. [29] suggest that targeted supply-driven policies are essential to gain co-benefits, and that high carbon prices in a low-carbon scenario and rising carbon prices would lead to deep decarbonization of electricity, enabling EVs to significantly reduce CO2 emission. Salvucci et al. [30] analyze the role of the conversion of cars and trucks by transportation modes such as rail and non-motorization in the decarbonization of Scandinavian energy system. Changes in transportation patterns are found to be a cost-effective measure. Venturini et al. [31] take Denmark’s integrated energy and transportation system as an example to evaluate the influence and effectiveness of transportation policy measures in achieving emission reduction goals.
As the world’s second largest economy and a major carbon dioxide emitter, achieving a peak in carbon emissions is a challenge for China to face global climate change. By setting reference scenarios, carbon constraints and supply-oriented structural reform scenarios, Hong J. and others [32] dynamically simulate China’s carbon peaking path. To achieve carbon peaking as soon as possible in China, policy orientation should be strengthened to promote the mutual progress of industrial structure adjustment and energy structure optimization. Zhang G. et al. [33] take the Yellow River Basin as the research object. According to their study, under the future development trend of low population growth, high economic level growth and high technological level growth, optimizing the industrial structure, accelerating the promotion of new energy vehicles and improving the standardization of transportation will become the main path for carbon emission reduction in future transportation. Gambhir A. et al. [34] has conducted a scenario analysis of China’s impact on carbon emissions from 2010 to 2050, showing that passenger cars and heavy-duty trucks are the focus of future carbon reduction potential. Byers E.A. et al. [35] propose that in the future, personal transportation will gradually move towards electrification, and that the issue of resource efficiency will become more and more important.
2.4. Literature Summary and Innovations
Through literature review, this paper systematically summarizes the research on the influencing factors of TCE. Existing literature provides feasible research ideas for the interpretation of problems and the exploration of methods. So far, scholars have achieved certain results in the research on the influencing factors of TCE, but there are still problems such as excessive focus on macro-level factors in the process of quantifying influencing factors, and incompleteness in analysis angles. It is summarized that existing research trends and deficiencies are mainly manifested as follows:
(1) The connotation and formation mechanism of the influencing factors of TCE are insufficiently discussed. TCE derive not only from roads, railways, waterways and aviation, but also from the production of components for transportation vehicles, transportation infrastructure and the sources of electricity for transportation. Most of the existing studies focus on the carbon emissions directly generated in the process of transportation, but the analysis of the connotation of TCE and related elements is unclear, the identification of systematic elements is in a fragmented state, and the understanding of the indicators of transportation influencing factors and other economic and social elements is insufficient. Some empirical studies have explored factors such as population, economic development and energy structure play a significant role in TCE, but the interaction between factors and the formation mechanism is limited to exploratory descriptions, and there is a lack of analysis of the importance of each driving factor.
(2) The research scope is not comprehensive enough, with a lack of regional analysis. Existing studies mainly focus on the analysis of time series data of China as a whole or that of a single province, while regional comparative studies are lacking. Regional development strategy will have an impact on carbon emissions to a certain extent, and few scholars have studied its indirect impact on TCE from the perspective of population and economic development. In addition, many scholars put forward relatively broad policy suggestions after analyzing the impact of various influencing factors, without touching upon specific optimization goals based on each factor.
Therefore, on the basis of previous research, this paper analyzes the influencing factors of TCE. Based on the grey correlation model, this paper conducts three-dimensional modeling by integrating time, region and various indicators, adopts the method of comparative analysis to further study the influencing factors of TCE, and analyzes the reasons for different characteristics in three dimensions. On the basis of the analysis, corresponding strategy is put forward to reduce carbon and emission reduction in the viewpoint of regionalization and high-efficiency transportation, contributing to achieving the double carbon goal.
3. Method
3.1. Grey Correlation Analysis
Everything in the world is interconnected, so there is a certain relationship between each factor or object. There are many factors that need to be measured in common systems such as economic systems, management systems, social systems, medical systems, agricultural systems, educational systems and ecosystems. We distinguish the main and secondary factors among many influencing factors, sort them according to their importance, promote the development of positive factors and inhibit the influence of negative factors.
The grey system theory proposes the concept of grey correlation degree analysis for each subsystem, and intends to seek the numerical relationship in the system through a certain method [36]. The concept of the grey system is proposed relative to the white system and the black system. According to cybernetics conventions, colors generally represent how much information we already know about a system, with white representing sufficient information and black representing systems in which we have no idea of the structure. Grey is somewhere between, indicating that we have a partial understanding of the system. In the process of system development, if the trends of the two factors are consistent, the degree of synchronous change is high, the degree of correlation between the two is high; otherwise, it is low. Therefore, the grey correlation analysis method provides a quantitative measure for the development and change of a system, and conducts dynamic history analysis.
On the basis of comparative analysis of three common factor analysis methods, i.e., structural analysis method, econometric model and mathematical statistical analysis method, this paper chooses the grey relational analysis method. Structural analysis can interpret the reasons behind the overall data changes, and can quickly locate the point of occurrence of the problem, thereby stimulating the idea of solving the problem. However, data requirements are high, and the analysis results are only additive, making it inconvenient to analyze in practice [37]. The econometric model succinctly and effectively describes and summarizes the quantitative characteristics of a real economic system, and more profoundly reveals the quantitative change law of the system. However, economic theory is often insufficient to provide a rigorous account of the dynamic relationships between variables, and endogenous variables can appear on both the left and right sides of the equation, making estimation and inference more complex [38]. Mathematical statistical analysis methods include the cointegration method and vector autoregressive (VAR) models. Cointegration analysis starts from the actual data generation process, looking for possible long-term stable relationships [39]. The VAR model is one of the simplest models to handle the analysis and prediction of multiple related economic indicators [40].
The grey correlation analysis method, as an effective model for evaluating systems with a large amount of unknown information, is a comprehensive evaluation model combining qualitative and quantitative analysis. The impact of the evaluation results is more objective and accurate. The whole calculation process is simple, easy to understand and easy for people to grasp; data do not need to be normalized, so the original data can be used for direct calculation, with strong reliability; the evaluation index system can be increased or decreased according to a specific situation; there is no need for a large number of samples, and a small representative sample is sufficient.
The grey correlation analysis method mainly judges the degree of association by the similarity of the change trend of the data sequence, identifies the pros and cons of the object to be judged, does not reflect the absolute level and is used to deal with the data with grey scale, which is characterized by “small samples, poor information and uncertainty” [41]. The data related to TCE are greyscale data, which are suitable for gray correlation analysis. The grey correlation analysis has no clear requirements for sample size and does not require any distribution. It is suitable for problems with only a small number of observed data. Quantitative analysis results are basically consistent with qualitative analysis results. The three-dimensional grey correlation analysis method is based on the grey correlation analysis theory, and simplifies the traditional dynamic multi-index decision-making method, with both effectiveness and practicability.
3.2. Three-Dimensional Grey Correlation Analysis Model
The operation process of the grey correlation analysis method assumes that it is known that a certain index may be related to several other factors, and then to quantitatively analyze which factor is more relevant to this index. In order to clarify the driving factors of TCE in various provinces, this paper adopts a three-dimensional grey correlation analysis method, which can organically combine such factors as population, economy and resources, and systematically analyze the “contribution rate” of each factor. The calculation process is to study the degree of correlation between the mother sequence and the feature sequence, and measure the degree of correlation between data, so as to assist with the decision making. This paper constructs a grey correlation degree analysis model, and the specific process is divided into the following five steps:
(1) Determine the data matrix, including the mother matrix and the behavior matrix. The mother matrix is . Its behavior value is at point in two-dimensional space, and .Then, the behavior matrix is written as:
(2) Dimensionless processing of the data, using the initial edge zeroing method, where represents a matrix operator, , is the initial edge zeroing image of and . Its corresponding initial edge zeroed surface is:
when ,
when ,
(3) is denoted as the distance matrix between factor k and the reference factor, and the maximum and minimum values in each reference matrix of each factor are selected, respectively:
(4) Calculate the distance matrix according to the formula , and then substitute it into the formula to calculate the grey correlation degree.
In Equation (5), is the resolution coefficient, generally taking .
(5) Calculate the three-dimensional grey correlation degree of the distance matrix of each factor, and calculate the grey correlation degree corresponding to different years and different provinces, respectively, and carry out statistical analysis.
3.3. Model Summary
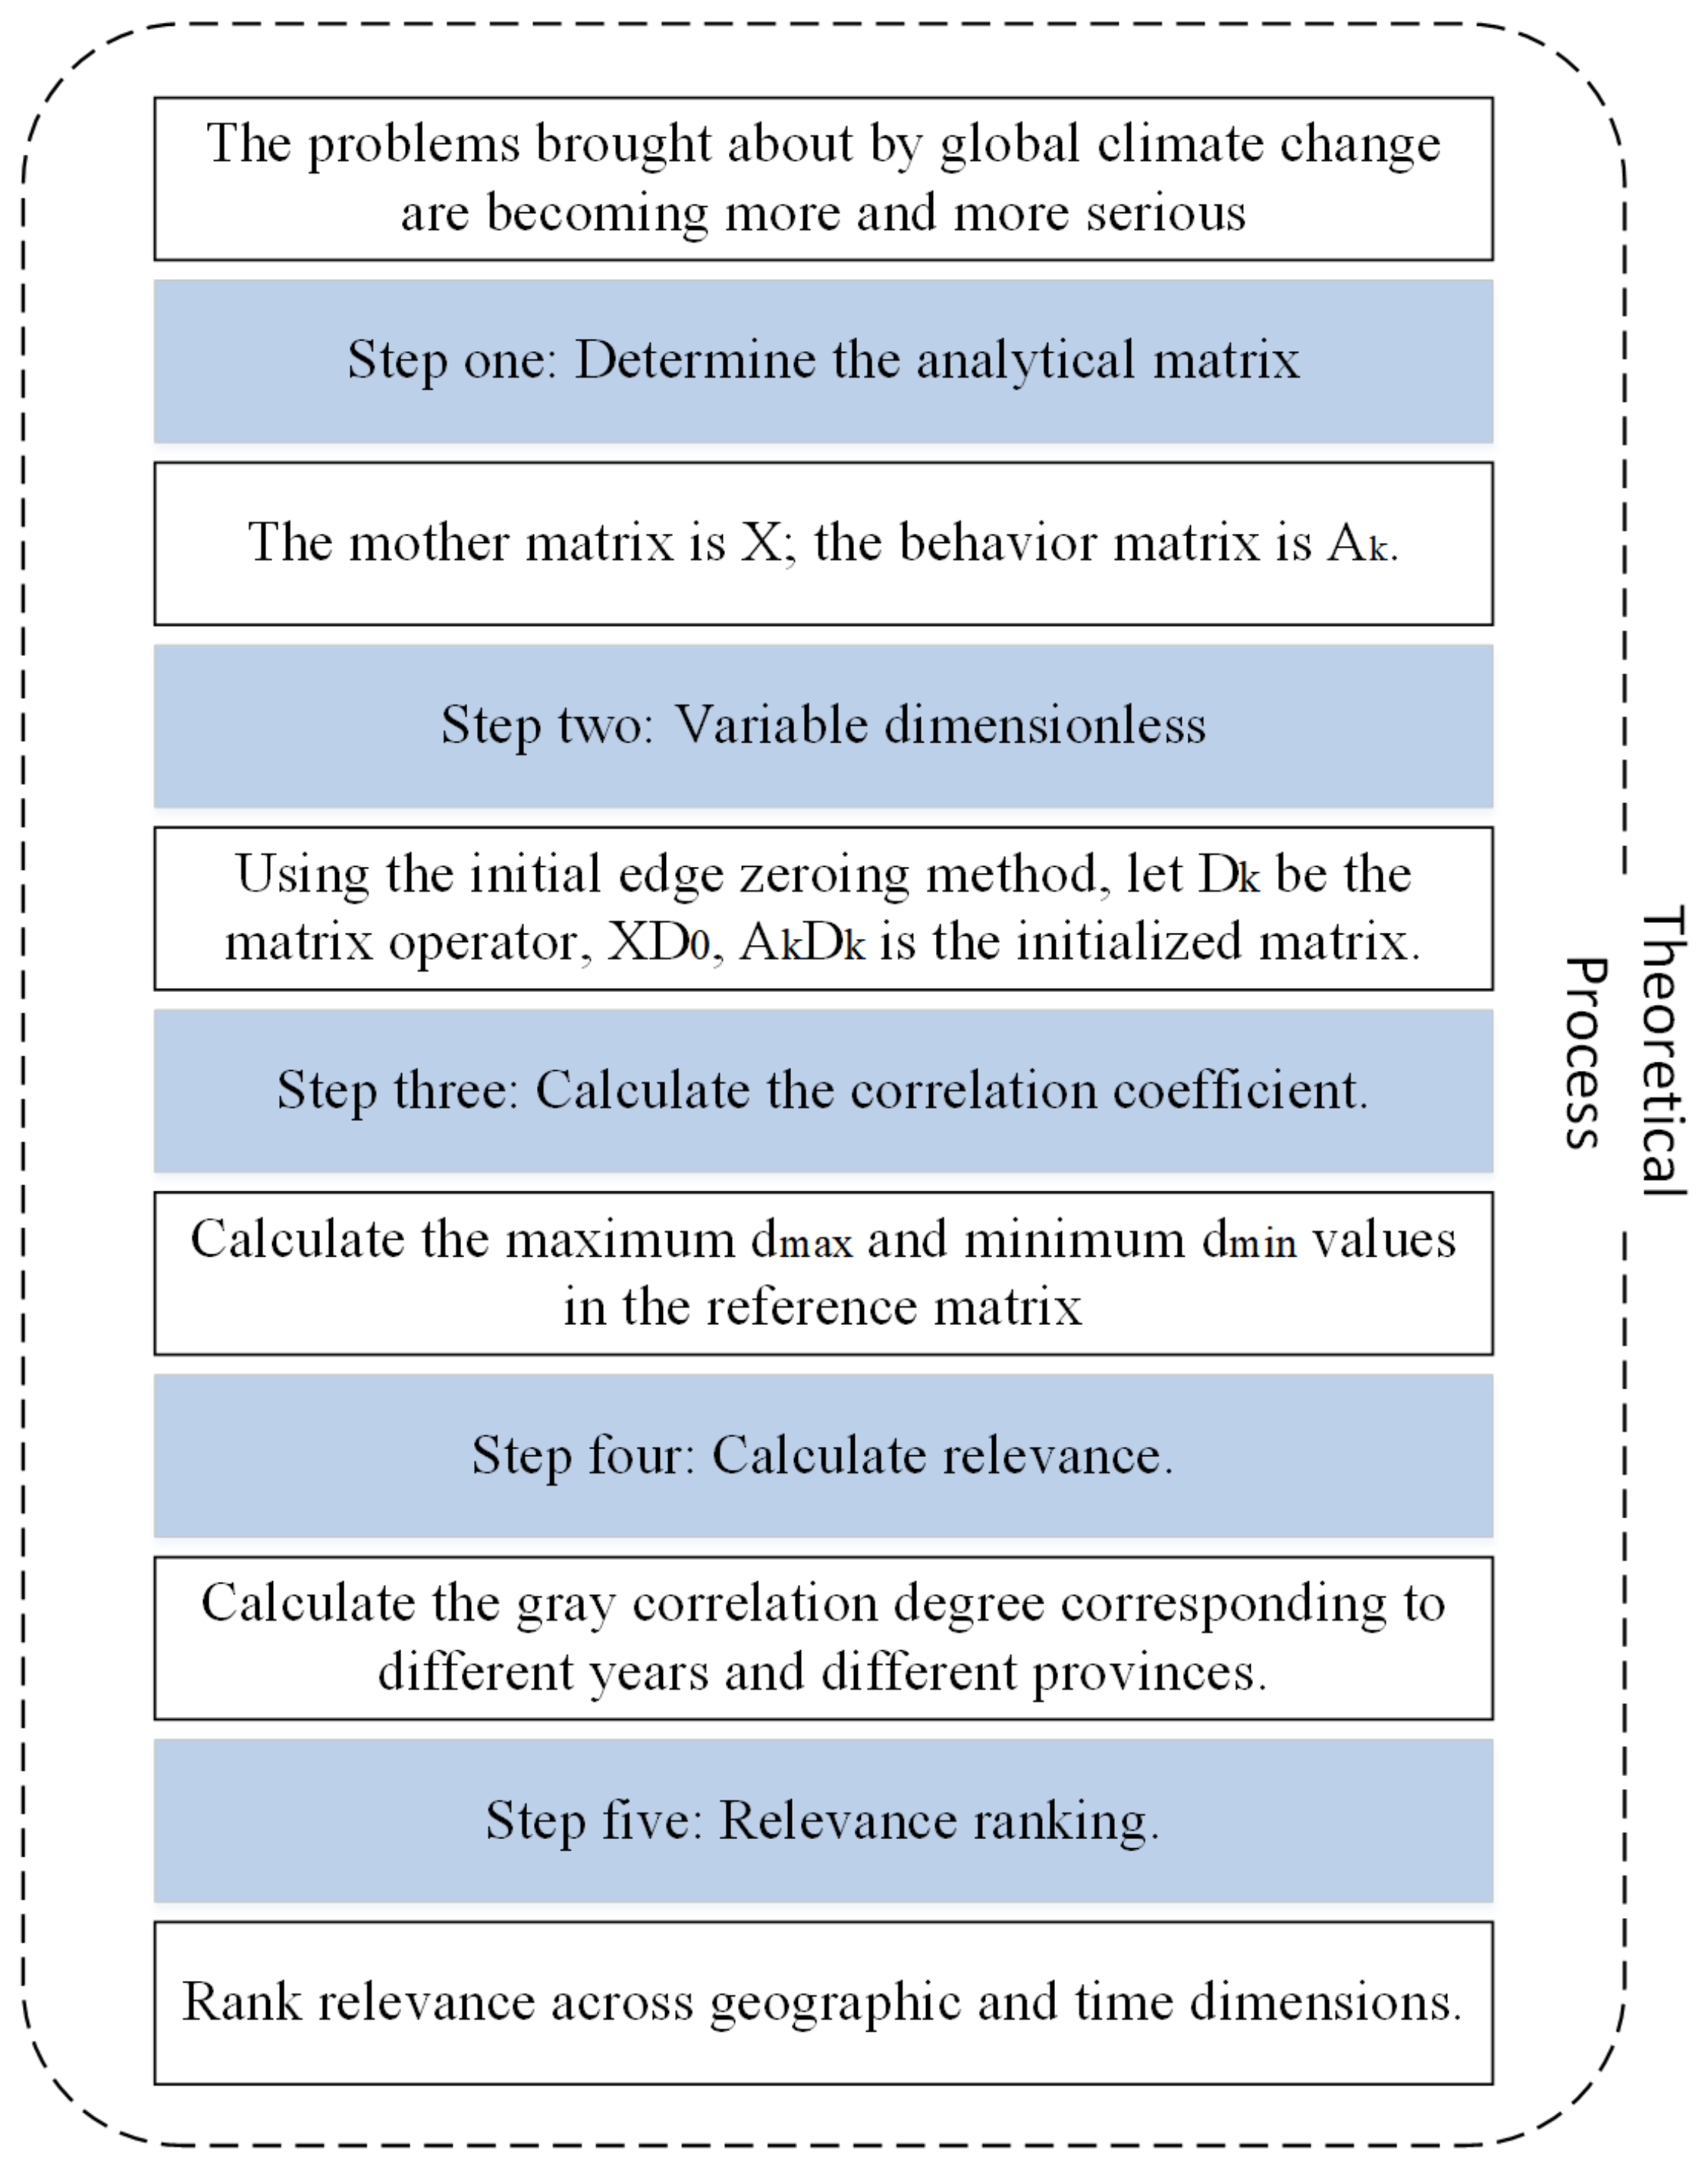
Figure 1 intuitively shows the specific research methods and implementation steps of 3D grey correlation analysis.
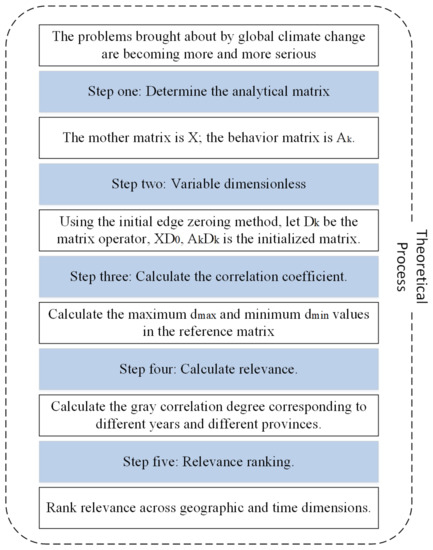
Figure 1.
Theoretical steps of 3D grey correlation analysis.
4. Empirical Analysis
Authors should discuss the results and how they can be interpreted from the perspective of previous studies and of the working hypotheses. The findings and their implications should be discussed in the broadest context possible. Future research directions may also be highlighted.
4.1. Data Sources
Calculating carbon dioxide emissions in the transportation sector is an important basis for assessing local TCE and for guiding “carbon” governance. At present, the calculation methods mainly include the “top-down” method, “bottom-up” method and life cycle method. The “top-down” method is to calculate the TCE according to the energy consumption data of the transportation industry within the scope of the region (such as raw coal, gasoline, kerosene, diesel, fuel oil, electricity, etc.) multiplied by the fuel carbon emission coefficient. The “bottom-up” method is based on the activity level (such as mileage) of various transportation modes (such as aviation, seaport, railway, public transportation, car, motorcycle, etc.) multiplied by the carbon emission factor per unit activity level to calculate TCE. The life cycle method calculates the total carbon emissions generated during the entire life cycle of production, operation and recycling of various vehicles.
In general, the “bottom-up” method is difficult to operate due to the variety of transportation methods, with various types of data scattered in different departments and enterprises. It is difficult to obtain data and the amount of data is huge. The whole life cycle method involves multi-disciplinary, multi-link and multi-department in terms of data acquisition and quantification, and the calculation is complicated with large data error. The “top-down” method, as a common method for calculating TCE, can obtain data through statistical yearbooks. Considering the statisticability and accuracy of data, this paper chooses the “top-down” method to calculate the TCE of various provinces in China, and to calculate the carbon emission factors of various energy sources according to the “IPCC Guidelines for National Greenhouse Gas Inventories”. The calculation formula is as follows:
where, TCE represents the total carbon emissions of transportation, and i represents the type of energy required by the transportation sector (with reference to the “Guidelines for Compiling Provincial Greenhouse Gas Inventories”, the terminal consumption of various transportation modes mainly includes raw coal, gasoline, kerosene, diesel, fuel oil, liquefied petroleum gas, natural gas). represents the consumption of the i-th energy source, which comes from the “China Energy Statistical Yearbook”, represents the average low-level calorific value of the i-th energy source, represents the unit calorific value of the i-th energy source, represents the carbon oxidation rate of the i-th energy, represents the carbon emission factor of the i-th energy, as is shown in Table 1. The average low-level calorific value of raw coal, gasoline, kerosene, diesel, fuel oil, liquefied petroleum gas and natural gas is derived from the “General Principles for Calculation of Comprehensive Energy Consumption” (GB/T2589-2020), and the carbon oxidation rate and unit calorific value of carbon content are derived from “Guidelines for Compilation of Provincial Greenhouse Gas Inventories” (Fa Gai Ban Climate [2011] No. 1041).

Table 1.
Statistical description of energy carbon emission factors.
Electricity is widely used in China’s railways, highways, waterways and air transportation, with new energy trams and buses as examples. With the development of the transportation industry, electricity is also used to power ships and planes when they are parked, changing the situation for self-combustion gas heating. In order to fully reflect carbon emissions in the transportation sector, electricity consumption should be included in the scope of carbon emission measurement, and the carbon emission factor of electricity should refer to “Carbon Emission Accounting and Reporting Requirements for Electric Power Production Industry” (DB11/T 1785-2020), which varies from region to region, with differences shown in Table 2.
Table 2.
Statistical description of electricity carbon emission factors in different regions.
Taking 2010 to 2019 as the research period, this paper explores the degree of relevance between five factors, namely population (), gross industrial production (), tertiary industry (), energy structure () and logistics scale (), on TCE. The data source of TCE is the transportation, warehousing and postal industry data in the “China Energy Statistical Yearbook”. The data approximates the energy consumption of the transportation industry. The yearbook also includes the consumption of lubricating oil and other energy consumed in certain years. Lubricating oil is negligible because of their small content. The population data and GDP of each province are obtained from the National Bureau of Statistics of China. Data on passenger and freight volumes, which represent the level of transport activity by mode of transport, are obtained from provincial statistical bureaus. Due to the availability of data, data dimension and other issues, the transportation industry studied in this paper mainly includes road transportation, waterway transportation, railway transportation and civil aviation transportation. Tibet, with no pilot city, is not included in this study.
4.2. Data Analysis
4.2.1. Characteristic Analysis of TCE
With the gradual perfection of the Chinese infrastructure network and the substantial improvement of transportation capacity and transportation level between 2010 and 2019, Chinese highway operation mileage has increased by about 1/4, and railway operation mileage has increased from 66,000 km to nearly 140,000 km, more than twice as much as before. Railway transportation has a large transportation capacity, with low energy consumption. At the same time, passenger traffic has increased by about 45%, and freight traffic has increased by about 46%. In general, the proportion of carbon emissions in the transportation sector in each province has also been increasing.
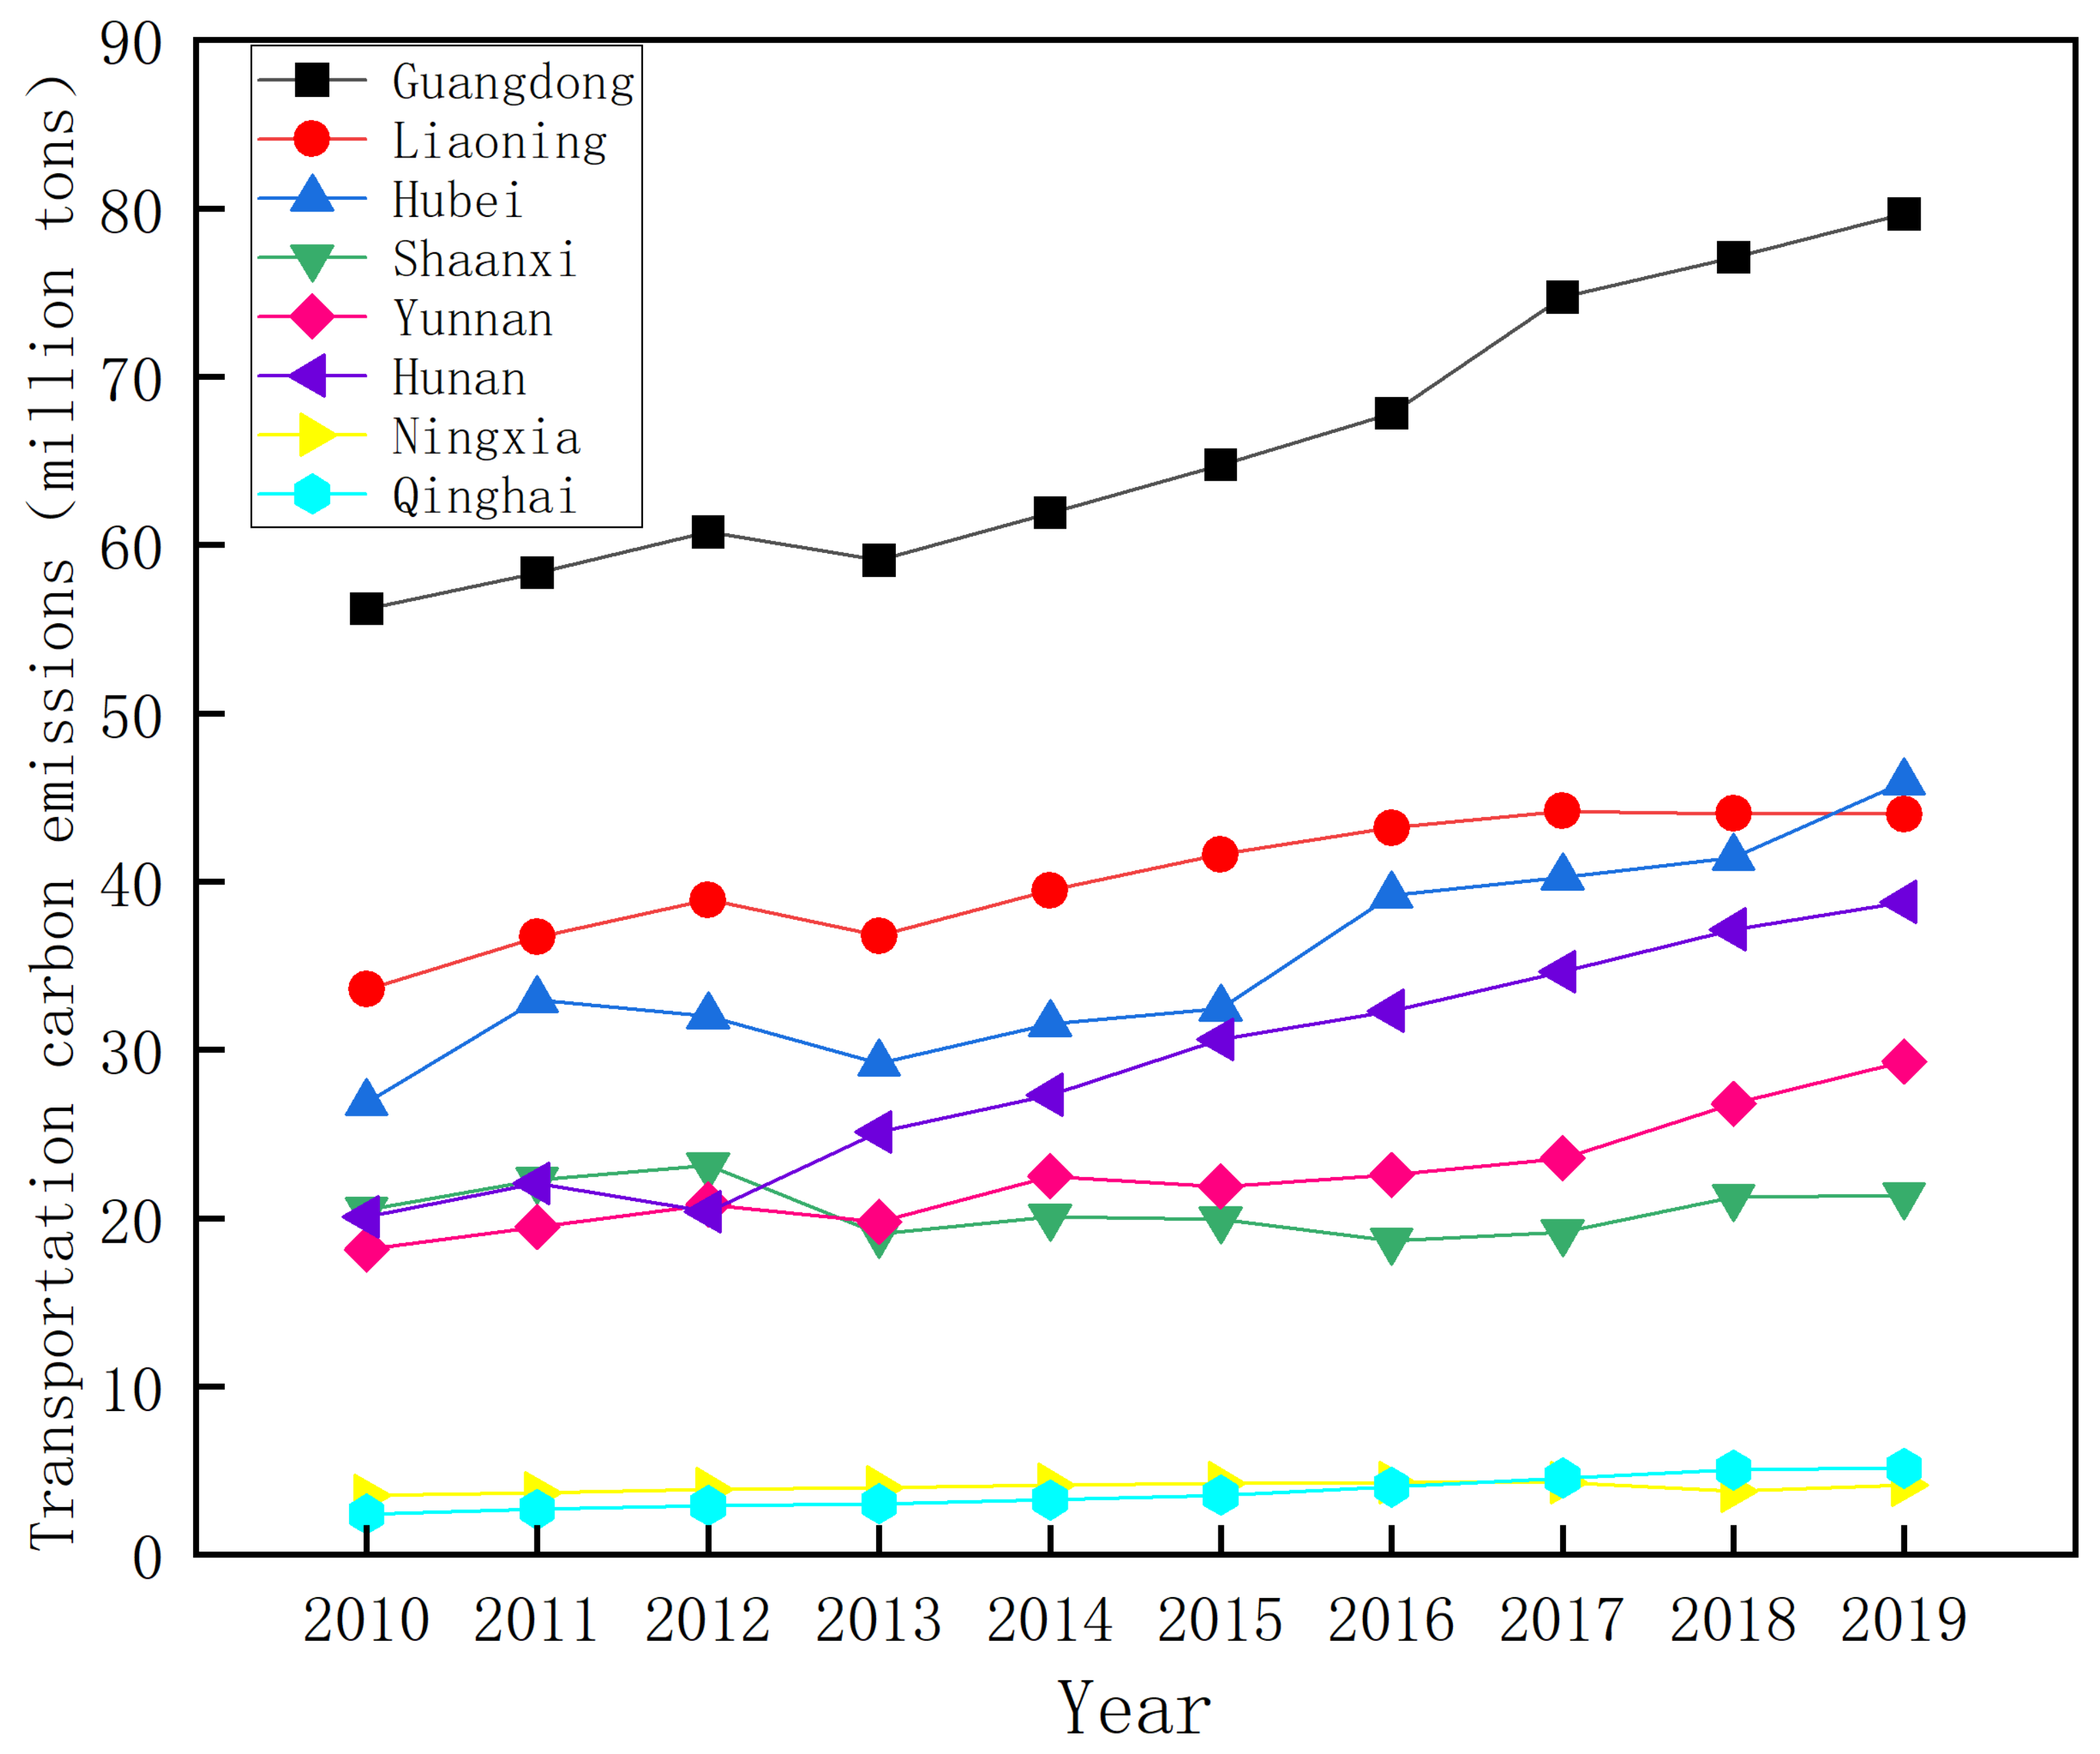
As can be seen from Figure 2, TCE in each province generally show a fluctuating upward trend. In terms of total amount, TCE of Ningxia and Qinghai are at the lowest level, Guangdong is at the highest level, and Liaoning, Hubei, Shaanxi, Yunnan and Hunan are all in the middle stage. Due to the complex effects of many other factors, the level of total TCE in a specific period of time cannot fully reflect the level of transportation emission reduction in a region. From the perspective of growth rate, Qinghai Province has increased by nearly 114%, but considering Qinghai’s TCE base is relatively small, its total amount is still not high. Hunan’s TCE have increased by 93%, Hubei by 71% and other provinces by 30% to 60%. It is worth noting that the growth rate of TCE in Shaanxi is only 4%, because the province steadily promotes low-carbon pilot projects, optimizes the energy structure, adjusts the industrial structure and builds low-carbon transportation. In 2020, it has completed the emission reduction targets set by the state during the “13th Five-Year Plan” ahead of schedule [42].

Figure 2.
TCE by provinces from 2010 to 2019.
4.2.2. Decomposition of Changes in TCE
Based on the three-dimensional grey correlation analysis model, this paper firstly analyzes the five factors of TCE, including population (), gross industrial production (), tertiary industry (), energy structure() and logistics scale (). A total of six sets of matrix data of influencing factors are initialized (Table 3, Table 4, Table 5, Table 6, Table 7 and Table 8). According to the formula of step (2), the initial edge zeroing surface of the behavioral surface is shown in Figure 3. The horizontal axis is the time dimension, and the vertical axis is 1 to 8, which respectively represent Guangdong, Liaoning, Hubei, Shaanxi, Yunnan, Hunan, Ningxia and Qinghai. It can be seen from Figure 3 that after standardization and dimensionlessization, the unit limitation of each matrix data can be removed, thereby converting it into dimensionless pure data. Then, factors such as population and GDP in different units and different value ranges can be comprehensively analyzed to facilitate further research and improve computational efficiency and accuracy.
Table 3.
Population () data initialization results.
Table 4.
GDP () data initialization results.
Table 5.
Tertiary industry () data initialization results.
Table 6.
Energy structure () data initialization results.
Table 7.
Logistics scale () data initialization results.
Table 8.
TCE data initialization results.
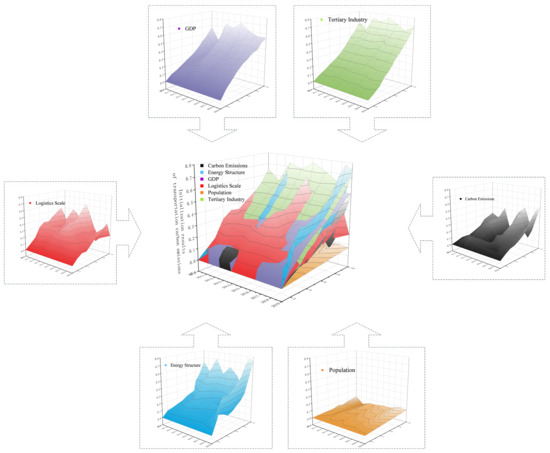
Figure 3.
Beginning edge zeroing surface of behavioral surface.
Based on the initialized data, we calculate the distance matrix between the five behavior matrices and their mother matrix, and obtain the grey correlation coefficient between them according to the three-dimensional grey correlation analysis model (Table 9). After sorting, it was found that , which means the influence of each factor on TCE is ranked as follows: energy structure > logistics scale > population > GDP > tertiary industry. This shows that energy structure and logistics scale are the main influencing factors of TCE in most provinces, followed by population. The movement and stay of the population will also lead to an increase in the demand for travel, which indirectly increases carbon emissions of transportation. The grey correlation of gross industrial production and tertiary industry is slightly less correlated, which means that they have less impact on TCE, indicating China’s efforts to build a benign and sustainable low-carbon ecosystem.
Table 9.
Grey correlation degree of matrix data.
Table 10 is a comparison of existing research results. It analyzes the influencing factors of Chinese carbon emissions in agriculture, construction, logistics and fossil energy, and compares the differences among some industries and transportation.
Table 10.
Comparison of existing results in different fields.
4.2.3. Time Series Grey Correlation Analysis
The time series grey correlation degree of the five influencing factors and TCE was calculated, and the results are shown in Table 11. The time series grey correlation degree reflects the relationship between each of the five influencing factors and TCE in the time dimension from 2010 to 2019. By 2019, the grey correlation between the five factors and TCE decreased to varying degrees. The most obvious decrease was the correlation between tertiary industry and TCE, which dropped from 0.9239 in 2010 to 0.4957 in 2019.
Table 11.
Time series grey correlation degree of matrix data.
In order to more intuitively see the changes in the correlation of various factors to TCE, Table 10 is further processed, and a graph of the correlation of factors is drawn (Figure 4). The time series grey correlation between the three influencing factors, the total value, the tertiary industry and the energy structure, on TCE show a downward trend of fluctuation. The correlation curve reflects the closeness of each influencing factor, showing that transportation carbon emission is more and more inconsistent with the change curve of these three influencing factors. In the past two years, the grey correlation between population and logistics scale factors on TCE rebounded.
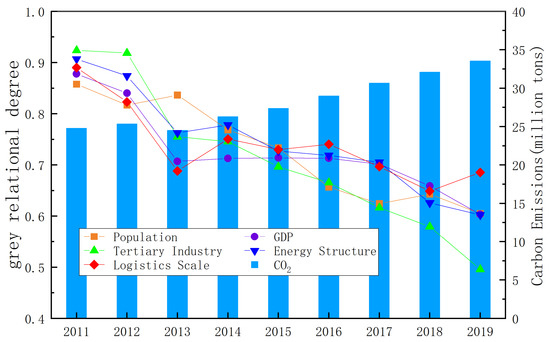
Figure 4.
Change trend diagram of grey correlation degree.
In 2010, the National Development and Reform Commission issued the “Notice on Carrying out Pilot Work in Low-Carbon Provinces and Low-Carbon Cities” (Fa Gai Climate [2010] No. 1587). In 2009, after the State Council proposed the 2020 action target for controlling greenhouse gas emissions, all provinces in China took the initiative to implement the central decision-making. It can be seen from Figure 3 that the tertiary industry has the largest decline, with a clear downward trend, showing that both low-carbon pilot and non-pilot provinces are actively advocating green transportation, and that the tertiary industry is well developed. At the same time, there has been no corresponding increase in carbon emissions from the transport sector. The correlation degree between population and TCE has gradually decreased from 2010 to 2017 to a gradually upward trend in the past two years. It is due to the increase in travel demand caused by population growth, which directly or indirectly leads to a gradual increase in TCE.
The rebound in the correlation between logistics scale and TCE is caused by the absolute increase in the total freight volume. According to the National Bureau of Statistics, the total domestic freight volume in China reached 53.4 billion tons at the end of 2019, with an increase of 5.5% year-on-year on a comparable basis. The substantial increase in internal freight volume also resulted in an increase in TCE, but with the implementation of national and provincial policies, it can be seen that the growth of carbon emissions will also be under control. The changes in the correlations of the other three factors are similar, which stabilized from 2012 to 2017, but began to decline slowly from 2017 to 2019, also reflecting that the provinces are in a period of progress in promoting sustainable transportation development. While the economy is developing rapidly, energy consumption is increasing, and the scale of passengers as well as freight transport is expanding, while carbon emissions are minimized.
4.2.4. Region Series Grey Correlation Analysis
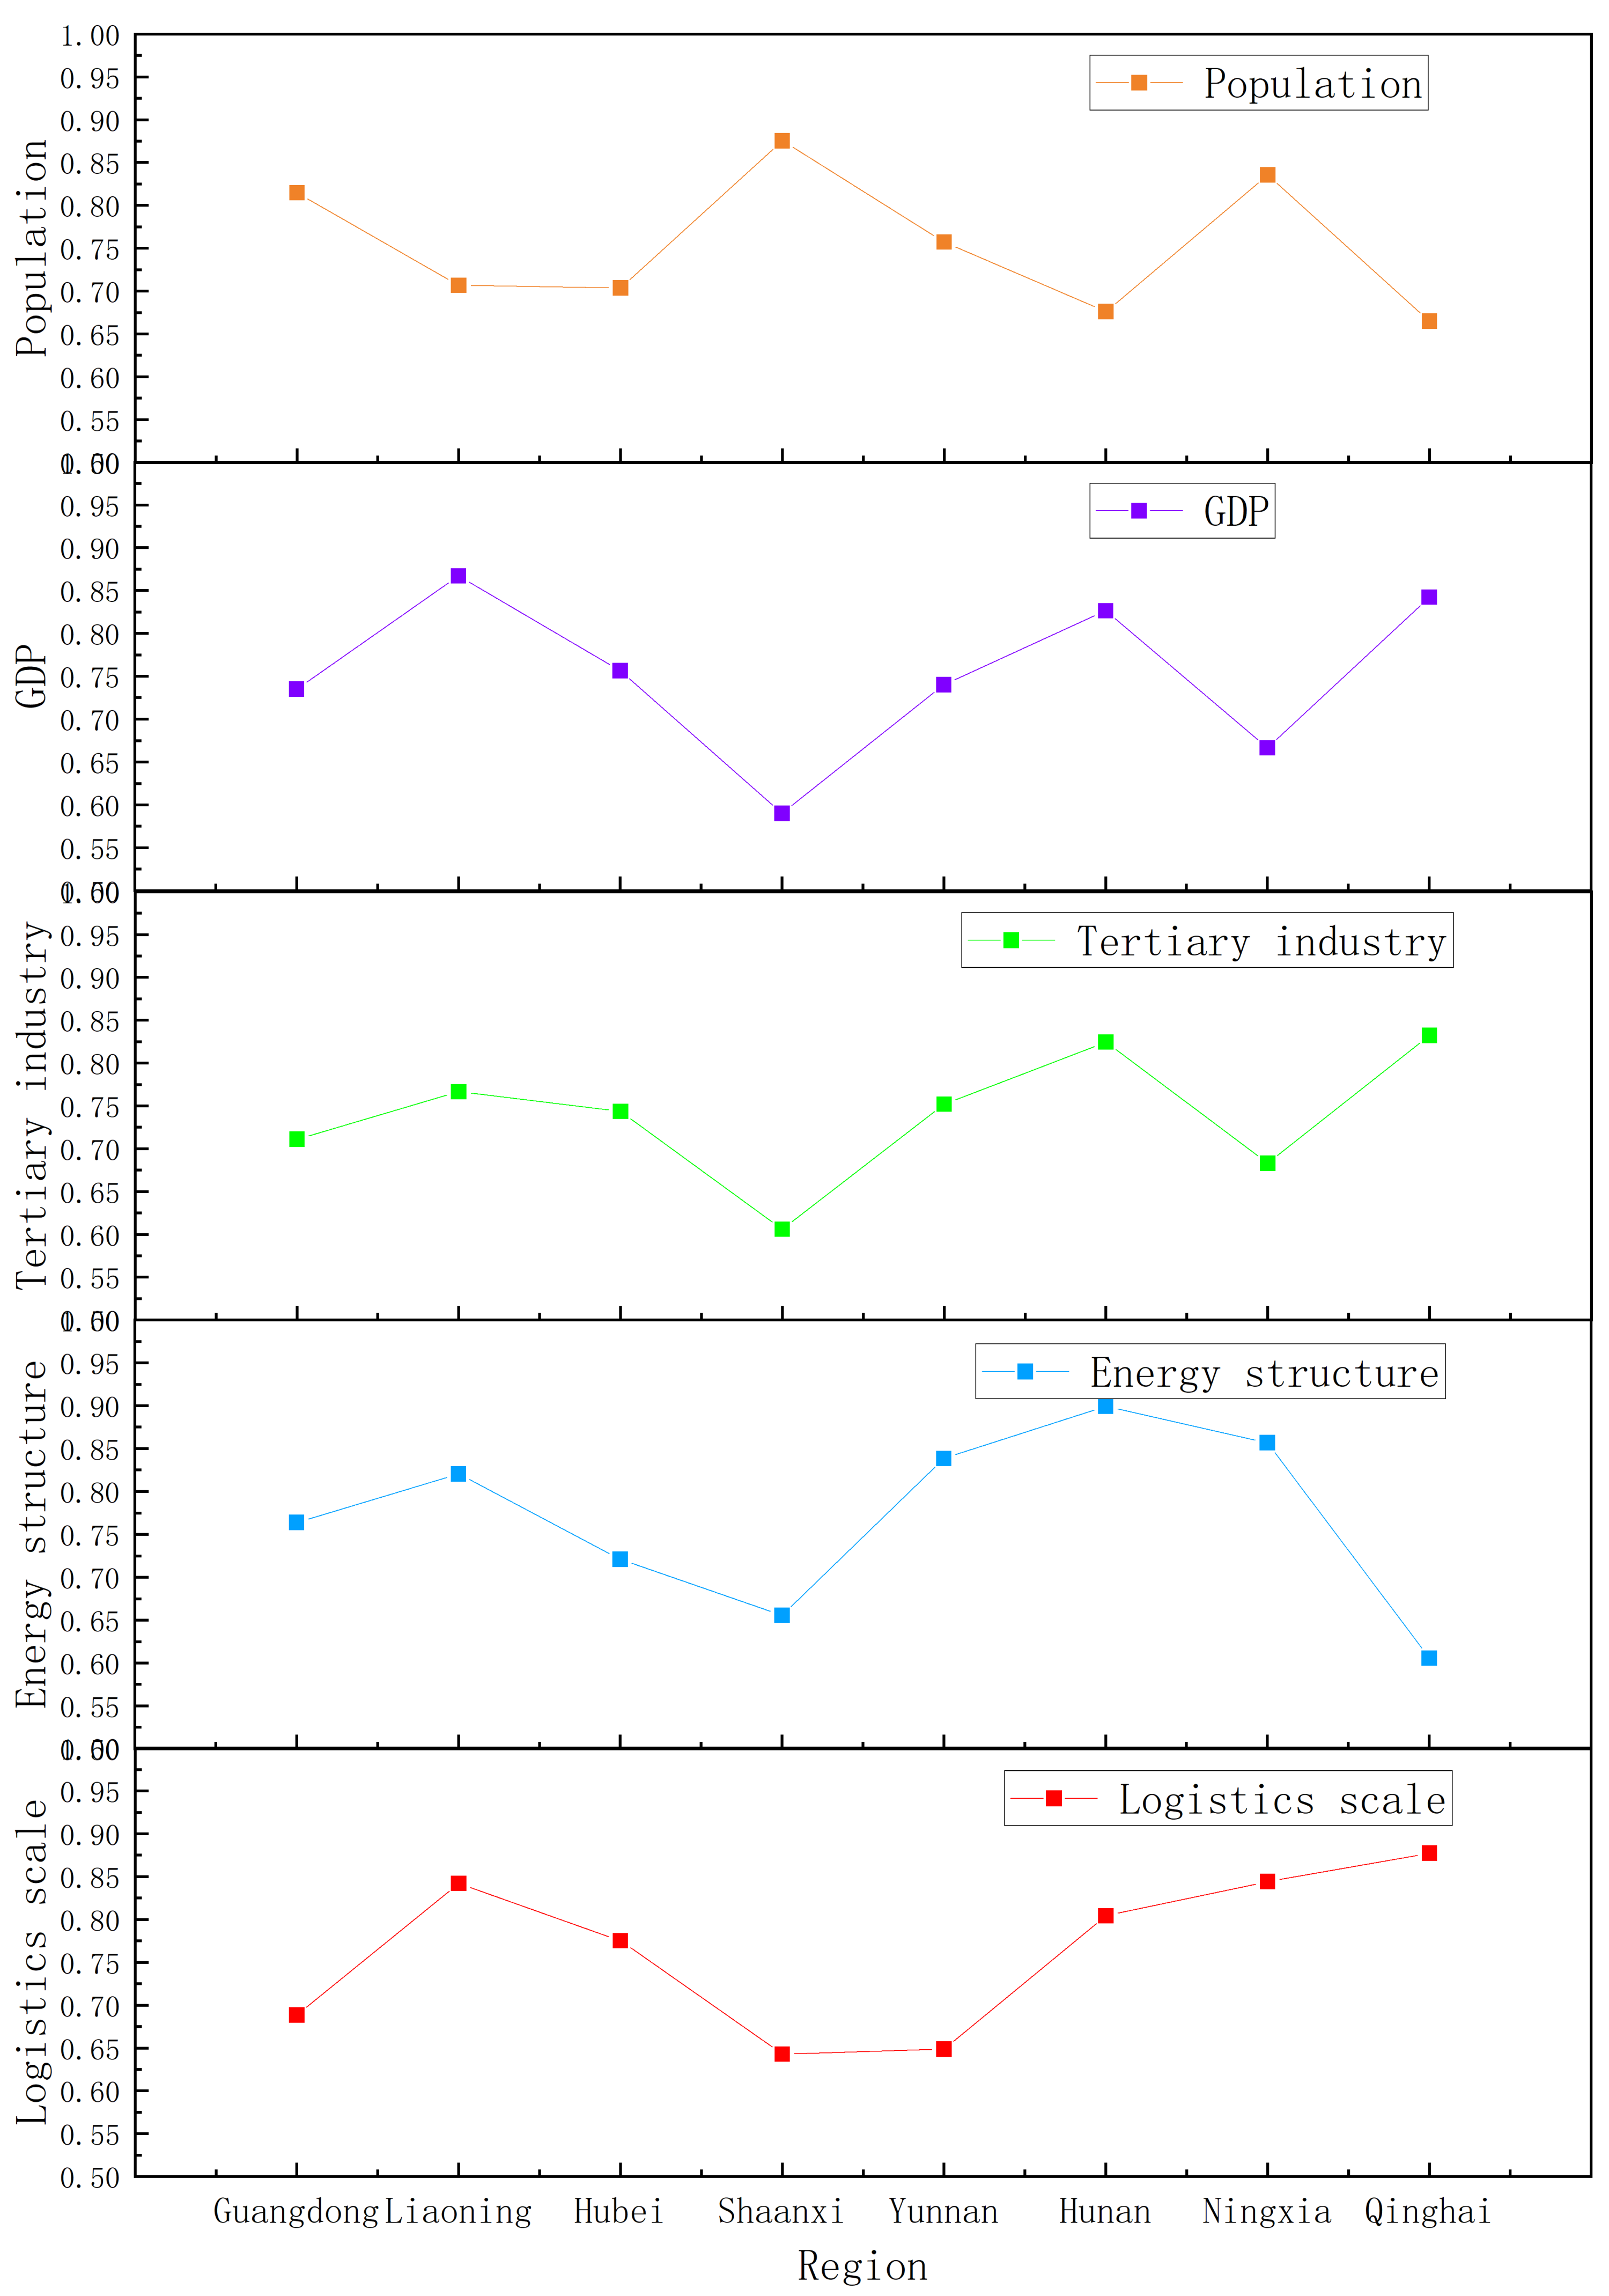
The regional grey correlation between the five influencing factors and carbon emissions was calculated (Table 12, a more intuitive display shown in Figure 5). The correlation degree gives the impact correlation of each province in the same time state.
Table 12.
Region series grey correlation degree of matrix data.
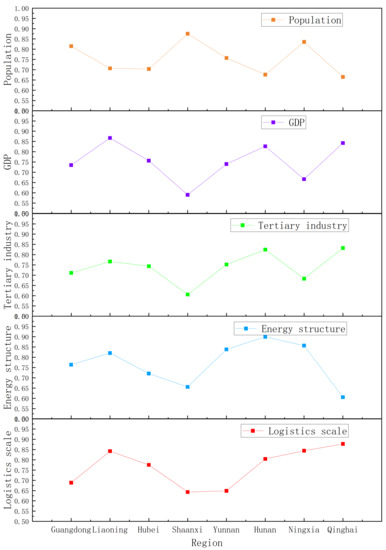
Figure 5.
Dot-line graph of regional grey relational degree of matrix data.
The region series grey correlation between the population and TCE shows that the correlation between the total population and TCE in Shaanxi, Ningxia and Guangdong ranks among the top three, being 0.88, 0.84 and 0.81, respectively. The grey correlation in other regions is between 0.6 and 0.8. Guangdong Province is the most populous province, ranking first in the Chinese population (this paragraph’s data originate from the China Statistical Yearbook). Larger population size has more travel demand to a certain extent, and its population inflow is also high. The continuous agglomeration of traffic has brought economic and social activities, resulting in more carbon emissions from transportation. The operating mileage of railways in Ningxia is only 1553 km, at a low level among the provinces, and the waterway transportation is only 130 km. Meanwhile, there are only 19 ordinary colleges and institutions in Ningxia, which reflects the lack of professional construction team talent, so the overall low-carbon development of the region lags behind. The other five regions are also highly correlated, indicating that the population needs to consume resources for living and development, which will definitely have an impact on TCE. For Guangdong and Shaanxi, the impact of population on TCE ranks first among these five influencing factors. Guangdong, with its GDP of RMB 10,767.107 billion, ranks first among the provinces. It belongs to a relatively developed area, and the labor force and activities brought by population are larger in scale. Compared with other factors, the impact of population on transport carbon emissions is even more important. The increase in TCE in Shaanxi is mainly due to the increase in passenger turnover, which is closely related to population factors [50]. In Liaoning, Hubei, Yunnan, Hunan and Qinghai, the impact of population on TCE is relatively weak. (This paragraph’s data originate from the China Statistical Yearbook.)
From the perspective of the region series grey correlation between GDP and TCE, Liaoning, Hunan and Qinghai are slightly higher than the other five regions, indicating that the trend of GDP in Liaoning, Hunan and Qinghai is the same with that of TCE. The similar degree of emission growth trend is higher than that of other regions. It can be seen that economic development has a greater driving effect on transportation, and economy has a greater impact on TCE. The TCE and GDP in these regions are in a stage of coordinated increase, and GDP is an indirect driving factor for the increase in carbon emissions. For several regions with low correlation between GDP and TCE, especially Shaanxi, great importance is attached to climate and environmental change. Through the implementation of 11 measures, such as optimizing the energy structure and improving energy conservation and energy efficiency, the province has achieved remarkable results in low-carbon development [51].
From the perspective of the region series grey correlation between tertiary industry and TCE, the correlation in Hunan and Qinghai was relatively high, both above 0.8, followed by Liaoning, Guangdong, Hubei and other places, which were lower than 0.75; however, Shaanxi’s correlation degree was only 0.6. Tertiary industry in Hunan and Qinghai had the highest degree of correlation with the growth trend of TCE, but in Guangdong, Hubei and Shaanxi, tertiary industry was not the most important factor. Similar to the change in the regional, the grey correlation degree between GDP and TCE, the low correlation degree in some regions is often due to their remarkable achievements in low-carbon transportation development, while in other regions, the low correlation degree may be caused by their relatively backward economic development.
From the perspective of the region series grey correlation between energy structure and TCE, in Hunan and Ningxia, it was relatively high. The energy structure in this paper was measured by electricity consumption. From the data collected, it was found that the per capita electricity consumption in the transportation sector in Hunan was at a low level, and the total electricity consumption in the transportation sector in Ningxia ranked low among all provinces. To a certain extent, they both reflect the low utilization rate of electricity. The electric transportation system is one of the main energy consumption systems of future smart cities [52], and its regional energy consumption structure still needs to be further adjusted. The grey correlation between energy structure and TCE in the other six provinces is not as high as in the other four aspects, mainly because the consumption of electric energy in the transportation sector has increased exponentially from 2010 to 2019 (originated from China Energy Statistical Yearbook). It is worth noting that in some relatively developed regions, the carbon emissions of transportation also maintain a relatively high level. In a low-carbon transportation system, the optimization of the energy structure promotes the electrification of private vehicles, while the development of public trams can promote the optimization of the energy consumption structure in most cities [53]. Under the urgent task of realizing double carbon” in the transportation industry, the provinces urgently need to accelerate the transition to electrification of buses, optimize green transportation infrastructure and conduct research on low-carbon cutting-edge technologies.
From the perspective of the region series grey correlation between logistics scale and TCE, Liaoning, Ningxia, and Qinghai regions had a relatively high degree. With the growth of the absolute amount of TCE, the proportion of logistic carbon emissions also continued to increase, especially heavy-duty diesel trucks, which produce a lot of pollution during the transportation of goods. Currently, the road market is mainly responsible for bulk cargo transportation [54]. In particular, the proportion of railway transportation in Ningxia and Qinghai is relatively low, resulting in a decrease in the efficiency of logistics and transportation, as well as an increase in carbon emissions from transportation.
4.3. Analysis of Emission Reduction Potential in Transportation
The emission reduction potential of transportation changes with factors such as the size of the emission base, economic development, technological progress and development stage of the society during the dynamic change of emissions, and measures the dynamic amount of emission reduction driven by these factors. Many scholars use the scenario analysis method [55] or horizontal comparison method [56] to analyze the emission reduction potential. The former is more suitable for forecasting carbon emissions before researching, while the latter maybe lead to large errors due to differences in development, structure and environment between industries. This paper studies the emission reduction potential based on environmental impact factors, and then introduces the environmental learning curve.
The production and development process of the transportation industry not only requires a lot of labor, but also consumes a lot of natural resources and emits a lot of pollutants. If the consumption of resources and the impact on the environment in the process of industry production and development are regarded as the costs that must be paid in the production process of the enterprise, the environmental learning curve refers to analyzing the regular changes of resource consumption or pollutant discharge per unit of output value with the increase of output value [57]. Therefore, this paper uses the environmental learning curve as the theoretical basis to analyze the contribution of benign economic growth to the emission reduction in the process of transportation development.
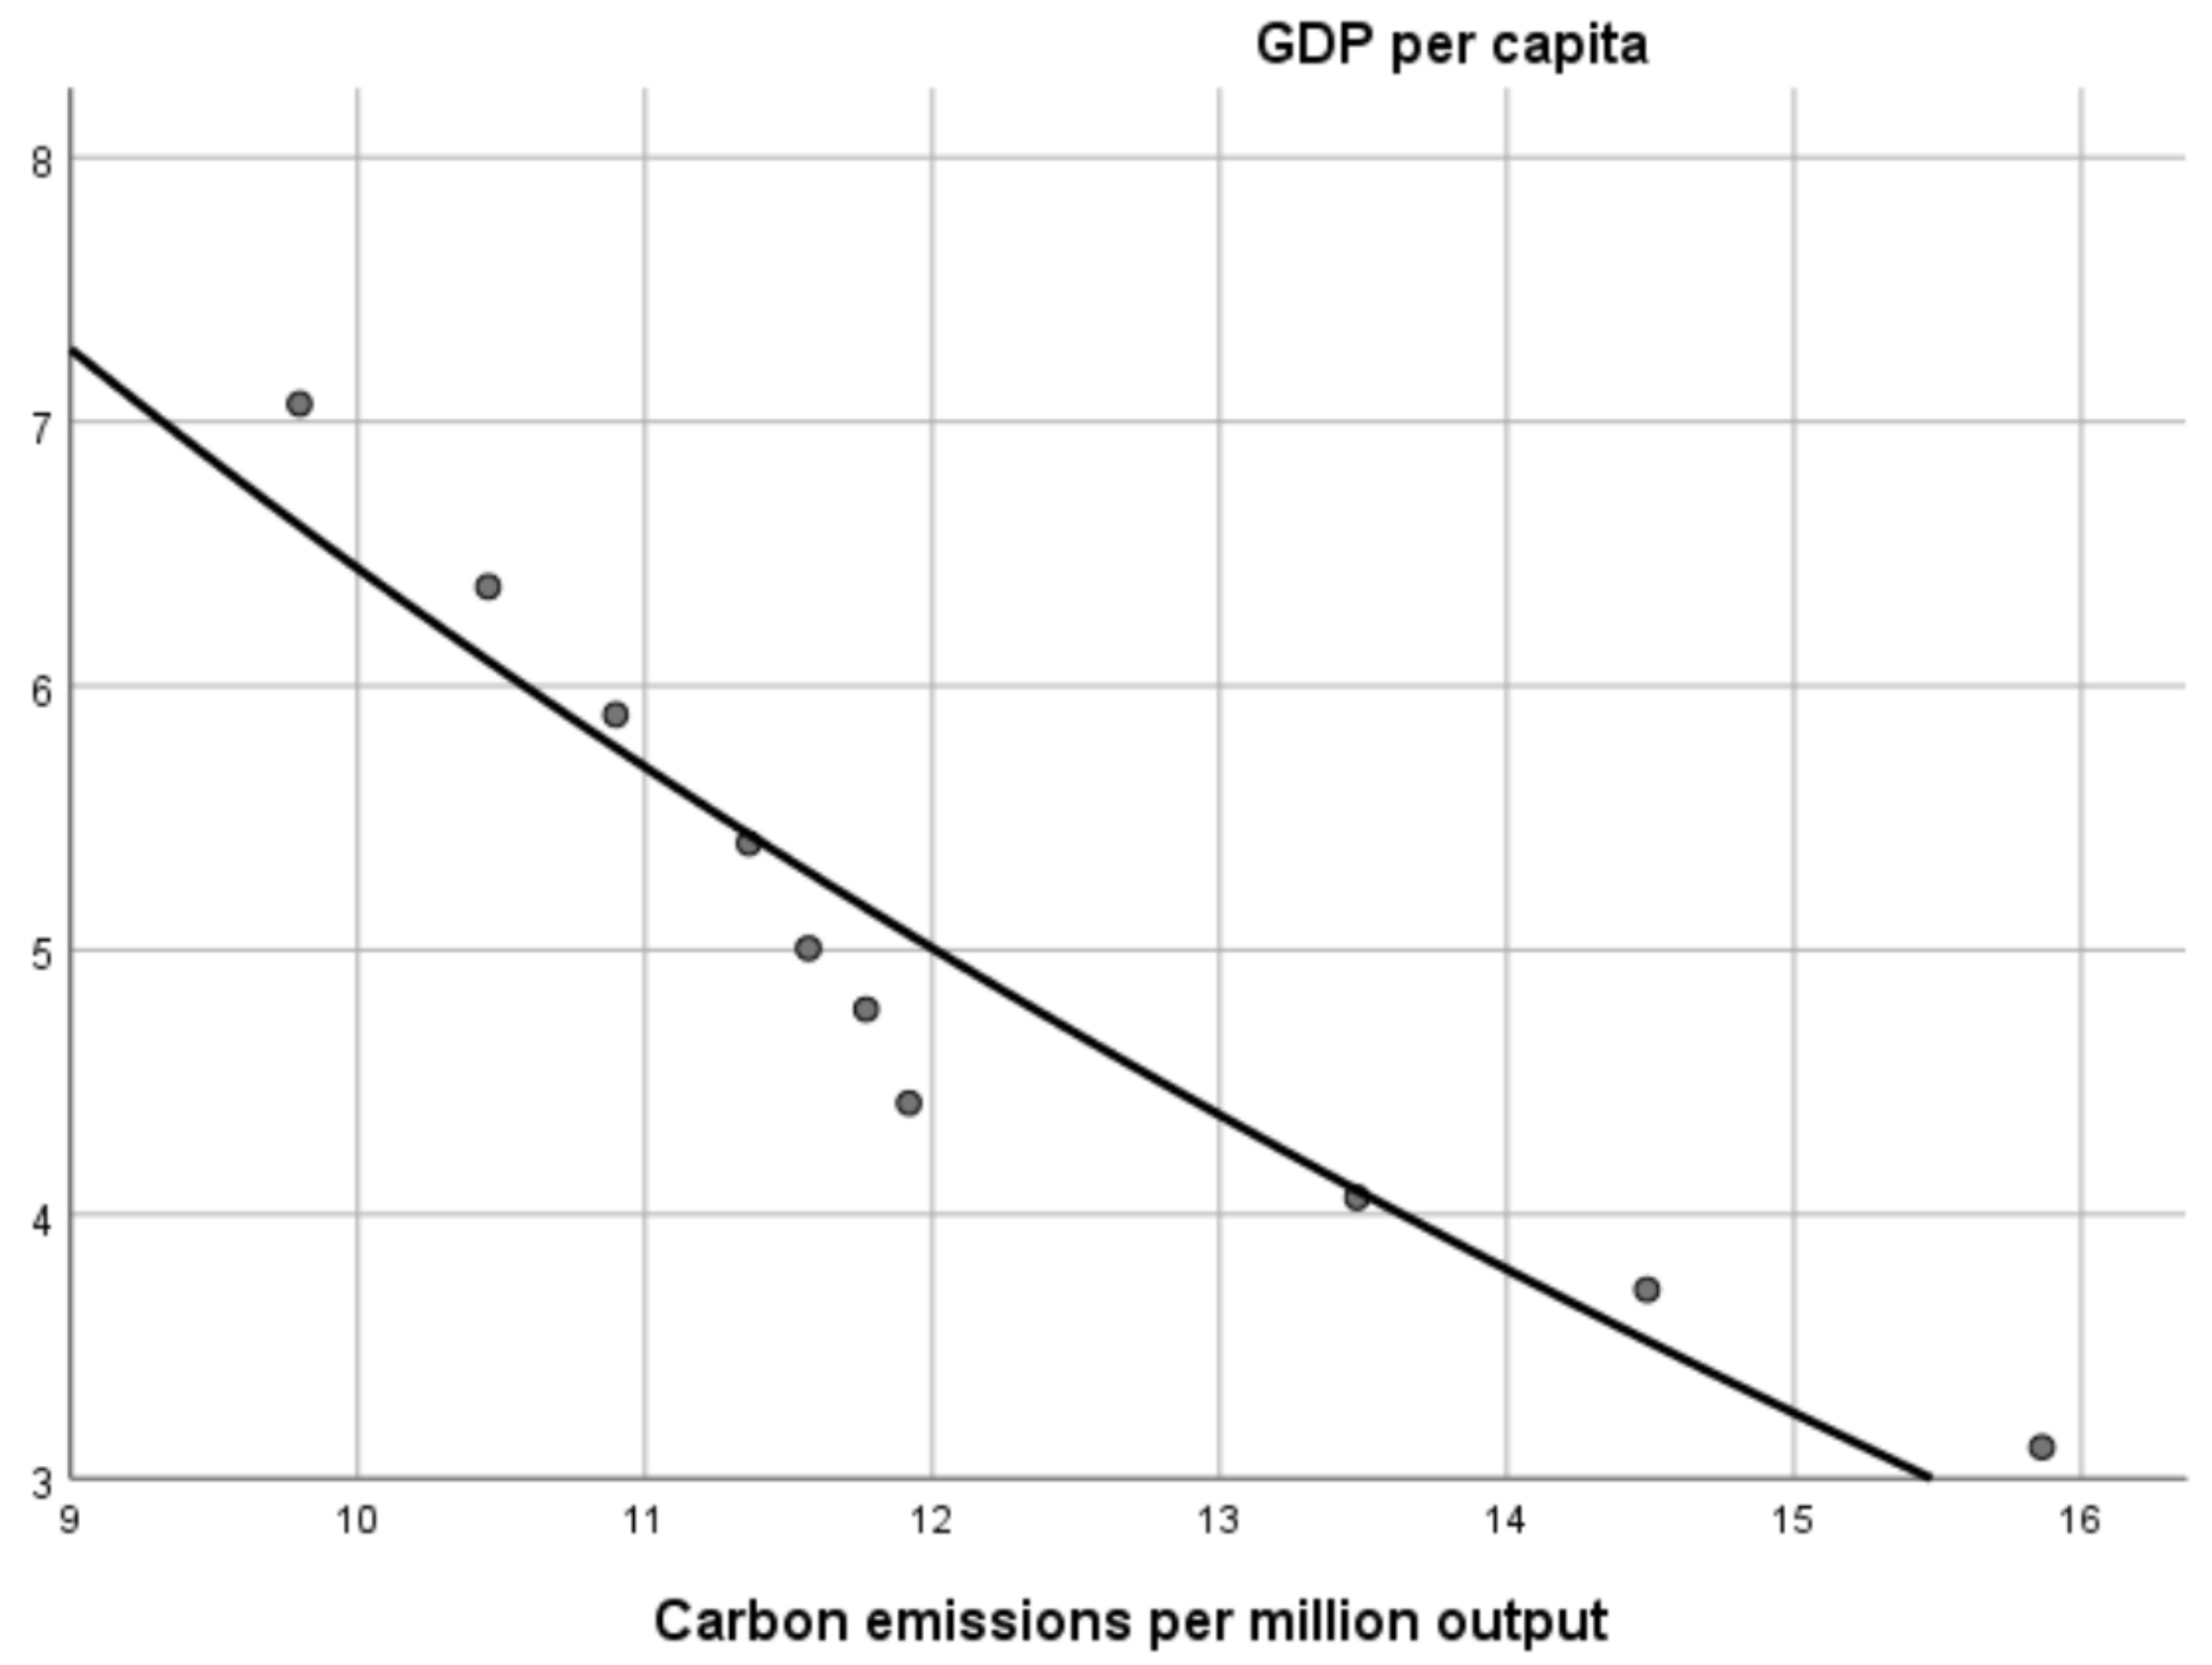
Based on the results of factor analysis, and considering the impact of changes in energy structure optimization and transportation structure adjustment combined with social economy and transportation industry on the carbon emission intensity of the transportation industry, the environmental learning curve of transportation carbon emission is constructed in this paper, with per capita GDP as the independent variable, and TCE intensity as the dependent variable.
Regression analysis was performed, and the regression equation and the exponential change graph were obtained as shown in Figure 6.
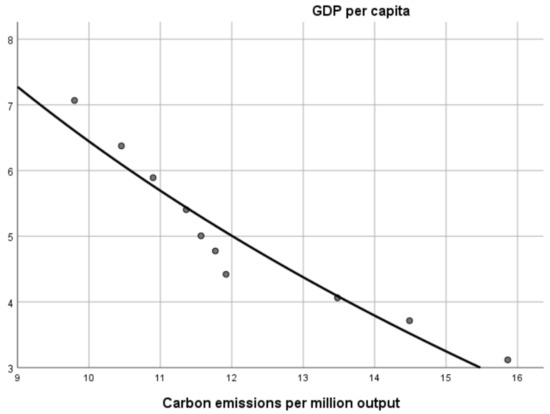
Figure 6.
Environmental learning curve diagram.
Correlation coefficient .
The value of the ordinate at any point on Figure 6 represents the environmental load of the transportation industry to a certain stage, and its derivative value at any point reflects the emission reduction potential of the transportation industry to a certain stage. The value of the ordinate at any point on Figure 6 represents the environmental load of transportation to a certain stage, and its derivative value at any point reflects the emission reduction potential of transportation to a certain stage. We calculated the first derivative of the value added per unit of GDP in 2019, and then calculated the carbon emission reduction potential of transportation. Based on Figure 6, assuming that the added value brought by unit GDP increases by one unit, it can be concluded that the carbon emission per unit output value of transportation was reduced by 25.19 kilotons.
To a certain extent, the changing trend of the environmental learning curve reflects the operation efficiency of the transportation system in the process of economic growth. Therefore, there is potential to reduce carbon emissions by improving the operational efficiency of the transportation system. The higher the transport efficiency, the lower the carbon emissions per unit of value added. This method can also be used to analyze the emission reduction potential of different industries and regions, and provide support for emission reduction policy formulation and forecasting in economic development.
5. Conclusions and Suggestions
5.1. Conclusions
According to the relevant research data of the China Carbon Peak and Carbon Neutrality Research Center (Carbon Neutrality Center), the key to the “double carbon” policy is to achieve a carbon neutral state, through two paths of “reducing emissions” and “neutralizing emissions”. On the one hand, by replacing fossil energy and technological breakthroughs, we reduce the total carbon emissions of existing industrial industries; on the other hand, for carbon dioxide that cannot be replaced by energy and must be emitted, carbon sequestration and carbon absorption methods are used. To sum up, based on the three-dimensional grey correlation analysis model, this paper analyzes the correlation between the TCE in China’s low-carbon pilot and non-pilot provinces and five influencing factors. Next, the model results are analyzed from the five aspects.
(1) With the expansion of the total population, the demand for material resources will increase accordingly, which will promote the expansion of the scale of the transportation industry and generate more travel activities, leading to an increase in TCE. Areas with higher increases in permanent population have a greater correlation between the population and TCE. The main reasons for attracting population agglomeration are the degree of openness to foreign population and more employment opportunities [58].
It is worth noting that Guangdong is the province with the largest population, but its carbon emissions are not the highest related to population. Therefore, the way to control the increase in carbon emissions from population and transportation is not simply to control the number of people and restrict people’s activities, but to reduce the pressure of the population on the environment. What should be taken into consideration is not only the population size, but also the travel structure characteristics. Under the pressure of population, Guangdong vigorously develops green transportation, implements the carbon GSP (Generalized System of Preferences) system, provides incentives for low-carbon travel, enhances people’s awareness of green transportation and has a high utilization rate of Bicycle-sharing. Qinghai has the lowest population density among the eight provinces, with the lowest correlation between its carbon emissions and population. It can be seen that reducing population density can effectively reduce transportation carbon emissions. Shaanxi has the highest degree of regional grey correlation, and it is urgent to learn from the development policies of other regions.
(2) Regional GDP and tertiary industry are closely related to the increase of TCE. From the changes in the time series grey correlation, it can be seen that from 2010 to 2011, the correlation degree between tertiary industry and the TCE is as high as 0.92, which was significantly greater than that of other factors. This is mainly due to the rapid increase in transportation demand in China in the course of rapid economic development and many drawbacks in the transportation structure, mainly road transportation.
From the perspective of regional grey correlation, Liaoning, Hunan and Qinghai are all relatively high; that is, the “decoupling” of economic growth and transportation carbon emissions has not yet been achieved. It is necessary to speed up the transformation of the economic development mode, and promote the green transformation and agglomeration development of the industry. Guangdong took the lead in introducing the market mechanism, and started the pilot construction of carbon emission trading in 2012. The scope of the carbon market has continued to expand. It is a regional carbon emission trading market with a sound regulatory system, effective supervision methods, and high market participation. Qinghai and Ningxia’s GDP rankings have been low for a long time, and the transportation infrastructure is not perfect. They need to continue to promote the high-quality development of transportation, thereby boosting the circulation of the economy.
(3) The grey correlation between energy structure and TCE is the highest among all factors, because China’s transportation mainly uses fossil energy as the main fuel. From the summary analysis results in Table 9, it can be seen that the energy structure is an important influencing factor in various fields, and the optimization of the energy structure has a positive impact on the transportation field.
It is necessary to speed up the transformation and upgrading of energy utilization structure, and adopt clean energy such as solar energy, wind energy, biomass energy, etc. Utilization of multiple energy sources realizes the diversification of the energy structure. Therefore, the transportation sector has great potential for energy saving. With the acceleration of urbanization, the energy consumption and material consumption in the transportation sector have gradually increased, and carbon emission has also increased year by year. Secondly, compared with buildings and industries, energy consumption in the transportation sector has increased slowly.
(4) From the perspective of a logistics scale, from 2018 to 2019, the correlation between the logistics scale and TCE was the highest among the five factors.According to the "National Comprehensive Three-dimensional Transportation Network Planning Outline", the demand for cargo transportation is rising steadily, and the demand for high-value, small-batch, and time-sensitive demand is rising rapidly.
The logistics industry has developed into an important modern service industry. From 2021 to 2035, it is expected that Chinese freight volume will increase by about 2% annually, postal express business volume will increase by about 6.3% annually, and international logistics and transportation will maintain a long-term steady growth trend.
5.2. Suggestions
The coronavirus 2019 (COVID-19, or SARS-CoV-2) pandemic, which started in December 2019, has had an unprecedented impact in most countries around the word. Due to a series of lockdown measures, significant reductions in carbon emissions have been made nationwide, but in the long run, the reductions in carbon emissions during the pandemic are unsustainable as socioeconomic activity across the countries will still recover. If policies and measures related to transportation, climate and environment are not taken, the carbon emissions of transportation will continue to grow [59]. Next, the following policy recommendations are put forward in the field of transportation.
(1) In population control and talent introduction, the local government should (a) make efficient use of the resources of scientific research institutes through policy encouragement or economic support, and encourage enterprises and universities to cultivate professional talents; (b) spread the concept of low-carbon travel, attract the active participation of the masses and choose walking, cycling, bus and subway and other low-carbon travel modes; (c) reasonably reduce population density, scientifically plan urban production, living and ecological space and orderly evacuate general manufacturing, regional logistics bases and excessively concentrated public resources in central urban areas; (d) promote traffic demand management, such as formulating a traffic congestion charging system, a parking charging system and a traffic subsidy system, implement a flexible working system, reduce the number of employee trips and stagger peak hours.
(2) In the background of the upgrading of the industrial structure, the improvement of technology, the acceleration of resource-saving transportation infrastructure as well as structural optimization of railway transportation, water transportation, air transportation and road transportation, it is possible to effectively reduce carbon emissions while maintaining rapid economic growth. The increase in GDP has gradually reduced the correlation between regional GDP, tertiary industry and TCE. However, there is a long-term equilibrium relationship between Chinese TCE and GDP [60]. In order to break this relationship, the government can support new enterprises and some small enterprises to carry out low-carbon development through policy guidance and capital investment based on local technological advantages. Developing and upgrading new energy technologies can promote the overall technological progress of transportation emission reduction in each province. The government can also promote financial innovation to support green transition development. By capitalizing the ecological value of green transportation, it will guide more social capital to invest in the green economy field, and use a combination of new energy vehicle projects and green development funds to provide support for the green transformation of transportation.
(3) In optimizing the energy structure, on the one hand, the government needs to adjust energy structure according to local conditions. For example, Guangdong and Liaoning can take advantage of coastal geographical advantages to build wind energy and hydropower facilities. Other regions can use forest resources and solar energy. For example, Qinghai can use desertified land to build solar power. On the other hand, enterprises can promote professional and technological progress, improve vehicle fuel efficiency, increase recycling and utilization of waste vehicles, lithium batteries and other resources. At the same time, local government should support new energy vehicles to replace high-energy-consuming vehicles, optimize the electric vehicle charging process and improve infrastructure such as charging piles.
(4) In terms of transportation structure adjustment, various regions need to optimize the transportation structure regionally, enhance the adaptability of transportation vehicles and modern transportation organizations, improve the large-scale, specialized, standardized and modernized level of transportation equipment, promote energy-saving and environmentally friendly transportation vehicles, ships and equipment and comprehensively optimize freight modes. For example, Guangdong actively responds to the National Development and Reform Commission to create a favorable environment to promote the implementation plan of the integrated development of transportation and logistics, accelerating the improvement of the transportation and logistics network system. Guangdong Pearl Freight is developing self-driving trucks, which can not only significantly reduce carbon emissions, but also improve driving safety. In addition, the choice of vehicles for the personalization of goods can also improve the carbon emission efficiency of freight transportation, strengthen the comparative advantages of various modes of transportation and generate an incentive from the source of freight transportation. For Qinghai, Ningxia and other areas with underdeveloped waterway transportation, we should focus on increasing the proportion of railway freight to realize effective transfer and connection of transportation methods.
Author Contributions
Conceptualization, Y.S. and S.L.; methodology, S.L.; software, S.L.; validation, Y.S. and S.L.; formal analysis, Y.S.; investigation, Y.S.; resources, Y.S. and L.L.; data curation, S.L.; writing—original draft preparation, S.L.; writing—review and editing, Y.S. and S.L.; visualization, S.L. and L.L.; supervision, Y.S.; project administration, Y.S.; funding acquisition, Y.S. All authors have read and agreed to the published version of the manuscript.
Funding
This research received no external funding.
Data Availability Statement
Restrictions apply to the availability of these data. Data was obtained from China Statistics Bureau and are available China Statistics Bureau with the permission of China Statistics Bureau.
Conflicts of Interest
The authors declare no conflict of interest.
References
- Yuan, Z.; Li, Z. A review of low-carbon measurements and transition pathway of transport sector in China. Clim. Chang. Res. 2021, 17, 27–35. [Google Scholar]
- Tang, B.J.; Li, X.Y. Sustainable development pathway for intercity passenger transport: A case study of China. Appl. Energy 2019, 254, 113632. [Google Scholar] [CrossRef]
- Low-Carbon Pilot Cities. Available online: https://baike.baidu.com/item/%E4%BD%8E%E7%A2%B3%E8%AF%95%E7%82%B9%E5%9F%8E%E5%B8%82 (accessed on 7 November 2021).
- Ang, B.W. The LMDI approach to decomposition analysis: A practical guide. Energy Policy 2005, 33, 867–871. [Google Scholar] [CrossRef]
- Yu, J.; Da, Y. Analysis of Carbon Emission Changes in China’s Transportation Industry Based on LMDI Decomposition Method. China J. Highw. Transp. 2015, 28, 112–119. [Google Scholar]
- Engo, J. Decomposing the decoupling of CO2 emissions from economic growth in Cameroon. Environ. Sci. Pollut. Res. 2018, 25, 35451–35463. [Google Scholar] [CrossRef] [PubMed]
- Wang, Y.; Zhou, Y.; Zhu, L.; Zhang, F.; Zhang, Y. Influencing Factors and Decoupling Elasticity of China’s Transportation Carbon Emissions. Energies 2018, 11, 1157. [Google Scholar] [CrossRef] [Green Version]
- Zeng, X.; Qiu, R. Spatio-temporal heterogeneity of transportation carbon emissions and its influencing factors in China. China Environ. Sci. 2020, 40, 4304–4313. [Google Scholar]
- Zhou, W.; Zeng, B. A research review of grey relational degree modle. Stat. Decis. 2020, 6, 29–34. [Google Scholar]
- Zhu, X.; Li, B. Three-Dimensional Dynamic Grey Relational Optimization Algorithm Based on Entropy Weight Method. Math. Pract. Theory 2019, 10, 203–212. [Google Scholar]
- Liu, Z.; Xie, Y. Characteristic test method of matrix grey incidence degree and its application. Oper. Res. Manag. Sci. 2020, 29, 131–138. [Google Scholar]
- Tong, X.; Chen, K. An empirical study of Chinese carbon emissions and influencing factors-grey correlation analysis of China and 30 provincial between 2000 and 2011. J. Ind. Technol. Econ. 2015, 34, 66–78. [Google Scholar]
- Zhou, Z.; Duan, J. Application of the grey related theory to China’s energy structure based on the perspective low carbon economy. Ecol. Econ. 2011, 4, 55–58. [Google Scholar]
- Ma, X.; Chen, R. Factor decomposition and decoupling effect of China’s industrial carbon emissions. China Environ. Sci. 2019, 39, 3549–3557. [Google Scholar]
- Liu, X.; Ke, L. An improved model of three dimensional absolute degree of grey incidence. Stat. Decis. 2018, 5, 20–24. [Google Scholar]
- Lim, J.; Kang, M.; Jung, C. Effect of national-level spatial distribution of cities on national transport CO2 emissions. Environ. Impact Asses. Rev. 2019, 77, 162–173. [Google Scholar] [CrossRef]
- Solaymani, S. CO2 emissions patterns in 7 top carbon emitter economies: The case of transport sector. Energy 2019, 168, 989–1001. [Google Scholar] [CrossRef]
- Shao, H.; Wang, Z. Spatial network structure of transportation carbon emissions efficiency in China and its influencing factors. China Popul. Resour. Environ. 2021, 31, 295–303. [Google Scholar] [CrossRef]
- Shao, H.; Wang, Z. Study on the Influencing Factors of Carbon Emission from Transport Sector in China-Empirical Research Based on the Panel Data. Ph.D. Thesis, Tianjin University, Tianjin, China, 2018. [Google Scholar]
- Ou, G.; Wang, Y. The influence of technological progress on carbon dioxide emissions in transportation: An empirical analysis of the provincial panel data in China. Ecol. Econ. 2018, 34, 64–71. [Google Scholar]
- Wang, L. Research on the Impact of Transportation Infrastructure on Regional Carbon Emission. Ph.D. Thesis, Harbin Institute of Technology, Harbin, China, 2019. [Google Scholar]
- Shang, L. Impact on Transportation Structure on Transportation Carbon Emissions. Ph.D. Thesis, Beijing Jiaotong University, Beijing, China, 2020. [Google Scholar]
- Liimatainen, H.; Kallionpaeae, E.; Poellaenen, M.; Stenholm, P.; Tapio, P.; Mckinnon, A. Decarbonizing road freight in the future—Detailed scenarios of the carbon emissions of Finnish road freight transport in 2030 using a Delphi method approach. Technol. Forecast. Soc. Chang. 2014, 81, 177–191. [Google Scholar] [CrossRef]
- Hickman, R.; Banister, D. Looking over the horizon: Transport and reduced CO2 emissions in the UK by 2030. Transp. Policy 2007, 14, 377–387. [Google Scholar] [CrossRef]
- Fan, J.; Wang, J. Energy demand and greenhouse gas emissions of urban passenger transport in the Internet era: A case study of Beijing. J. Clean. Prod. 2017, 165, 177–189. [Google Scholar] [CrossRef]
- Li, X.; Yu, B. Peaking CO2 emissions for China’s urban passenger transport sector. Energy Policy 2019, 133, 110913. [Google Scholar] [CrossRef]
- Wang, J.; Yan, Y.; Huang, Q.; Song, Y. Analysis of carbon emission reduction potential of China’s transportation. Sci. Technol. Manag. Res. 1965, 2, 200–210. [Google Scholar]
- Rz, A.; Yin, L.B.; Ww, C.; Gl, C. How do transport policies contribute to a low carbon city? An integrated assessment using an urban computable general equilibrium model. Energy Procedia 2018, 152, 606–611. [Google Scholar]
- Dhar, S.; Pathak, M.; Shukla, P.R. Electric vehicles and India’s low carbon passenger transport: A long-term co-benefits assessment. J. Clean. Prod. 2017, 146, 139–148. [Google Scholar] [CrossRef] [Green Version]
- Salvucci, R.; Gargiulo, M.; Karlsson, K. The role of modal shift in decarbonising the Scandinavian transport sector: Applying substitution elasticities in TIMES-Nordic. Appl. Energy 2019, 253, 113593. [Google Scholar] [CrossRef]
- Venturini, G.; Karlsson, K.; Münster, M. Impact and effectiveness of transport policy measures for a renewable-based energy system. Energy Policy 2019, 133, 110900. [Google Scholar] [CrossRef]
- Hong, J.; Li, Y.; Cai, W. Simulating China’s carbon emission peak path under different scenarios based on RICE-LEAP model. Resour. Sci. 2021, 43, 639–651. [Google Scholar]
- Zhang, G.; Su, Z. Analysis of influencing factors and scenario prediction of transportation carbon emissions in the yellow river basin. Manag. Rev. 2021, 29, 283–294. [Google Scholar]
- Gambhir, A.; Tse, L.; Tong, D.; Martinez-Botas, R. Reducing China’s road transport sector CO2 emissions to 2050: Technologies, costs and decomposition analysis. Appl. Energy 2015, 157, 905–917. [Google Scholar] [CrossRef] [Green Version]
- Byers, E.A.; Gasparatos, A.; Serrenho, A.C. A framework for the exergy analysis of future transport pathways: Application for the United Kingdom transport system 2010–2050. Energy 2015, 88, 849–862. [Google Scholar] [CrossRef] [Green Version]
- Grey Correlation Degree Analysis. Available online: https://baike.baidu.com/item/%E7%81%B0%E8%89%B2%E5%85%B3%E8%81%94%E5%88%86%E6%9E%90%E6%B3%95 (accessed on 21 September 2020).
- Zhang, B. A survey of index decomposition analysis in energy and environmental studies. Energy 2000, 25, 1149–1176. [Google Scholar]
- Lo, P.L.; Martini, G.; Porta, F.; Scotti, D. The determinants of CO2 emissions of air transport passenger traffic: An analysis of Lombardy (Italy). Transport Policy 2020, 91, 108–119. [Google Scholar] [CrossRef]
- Lin, B.; Xie, C. Reduction Potential of CO2 Emissions in China’s Transport Industry. Ph.D. Thesis, Xiamen University, Xiamen, China, 2014. [Google Scholar]
- Talbi, B. CO2 emissions reduction in road transport sector in Tunisia. Renew. Sustain. Energy Rev. 2017, 69, 232–238. [Google Scholar] [CrossRef]
- Kim, G.; Jong, Y.; Liu, S. Generalized Hybrid Grey Relation Method for Multiple Attribute Mixed Type Decision Making. J. Grey Syst. 2012, 26, 142–153. [Google Scholar]
- Meng, Z.; Wang, H.; Wang, B. Empirical Analysis of Carbon Emission Accounting and Influencing Factors of Energy Consumption in China. Int. J. Environ. Res. Public Health 2018, 15, 2467. [Google Scholar] [CrossRef] [PubMed] [Green Version]
- Zhang, Y.; Yu, Z.; Zhang, J. Research on carbon emission differences decomposition and spatial heterogeneity pattern of China’s eight economic regions. Environ. Sci. Pollut. Res. 2022, 29, 29976–29992. [Google Scholar] [CrossRef]
- Dong, F.; Gao, X.; Li, J.; Zhang, Y.; Liu, Y. Drivers of China’s Industrial Carbon Emissions: Evidence from Joint PDA and LMDI Approaches. Int. J. Environ. Res. Public Health 2018, 15, 2712. [Google Scholar] [CrossRef] [Green Version]
- Liu, X.; Yu, Y.; Luan, S. Empirical Study on the Decomposition of Carbon Emission Factors in Agricultural Energy Consumption. IOP Conf. Ser. Earth Environ. Sci. 2019, 252, 042045. [Google Scholar] [CrossRef]
- Qi, Z.; Hao, S.; Xu, R. The Influencing Factors of Carbon Emissions in Chinese Construction Industry Based on Factor Analysis and Improved STIRPAT Model. In Proceedings of the International Conference on Construction and Real Estate Management, Guangzhou, China, 12 November 2017. [Google Scholar]
- Zhang, C.; Zhang, W.; Luo, W.; Gao, X.; Zhang, B. Analysis of Influencing Factors of Carbon Emissions in China’s Logistics Industry: A GDIM-Based Indicator Decomposition. Energies 2021, 14, 5742. [Google Scholar] [CrossRef]
- Xua, S.; He, Z.; Long, R. Factors that influence carbon emissions due to energy consumption in China: Decomposition analysis using LMDI. Appl. Energy 2014, 127, 182–193. [Google Scholar] [CrossRef]
- Zhou, Y.; Liu, W.; Lv, X.; Chen, X.; Shen, M. Investigating interior driving factors and cross-industrial linkages of carbon emission efficiency in China’s construction industry: Based on Super-SBM DEA and GVAR model. J. Clean. Prod. 2019, 241, 118322. [Google Scholar] [CrossRef]
- Wang, X. Research on the Temporal and Spatial Evolution Dynamic Mechanism and Emission Reduction Potential of Anthropogenic Carbon Emissions in Shaanxi. Ph.D. Thesis, Shaanxi Normal University, Xi’an, China, 2018. [Google Scholar]
- Shaanxi Provincial Department of Ecology and Environment. Shaanxi’s Carbon Emission Intensity Decreased by 21 Percent Compared with 2015. Available online: http://sthjt.shaanxi.gov.cn/important/2020-07-03/56694.html (accessed on 3 July 2020).
- Mj, A.; Kf, A.; Tn, A.; Oa, B. Stochastic synergies of urban transportation system and smart grid in smart cities considering V2G and V2S concepts. Energy 2020, 215, 119054. [Google Scholar]
- Zhang, X.; Song, G.; Yan, Y. The Impact of Urban Low-carbon Transportation System on the Improvement of The Structure of Energy Consumption-Evidence from 14 Cities in China. Chin. J. Manag. Sci. 2020, 28, 173–183. [Google Scholar]
- Xu, C. Study on the Influence of Freight Transport Structure on Freight Transport Carbon Emissions Efficiency. Ph.D. Thesis, Beijing Jiaotong University, Beijing, China, 2019. [Google Scholar]
- Tian, L.; Jin, R. Theoretical exploration of carbon emissions dynamic evolutionary system and evolutionary scenario analysis. Energy 2012, 40, 376–386. [Google Scholar] [CrossRef]
- Liang, N. Research on CO2 Emission Efficiency and Emission Reduction Potential in Beijing-Tianjin-Hebei Region. IOP Conf. Ser. Earth Environ. Sci. 2020, 450, 012058. [Google Scholar] [CrossRef]
- Wang, W.; Yu, B.; Yao, X.; Niu, T.; Zhang, C. Can technological learning significantly reduce industrial air pollutants intensity in China?—Based on a multi-factor environmental learning curve. J. Clean. Prod. 2018, 185, 137–147. [Google Scholar] [CrossRef]
- Wang, K.; Tang, X. Temporal-spatial evolution and influencing factors of carbon emission intensity of China’s service industry. China Popul. Environ. 2021, 31, 23–31. [Google Scholar]
- Rlr, A.; Vps, B.; Sks, C.; Bsa, D.; Yh, E. What is the impact of COVID-19 pandemic on global carbon emissions? Sci. Total Environ. 2021, 816, 151503. [Google Scholar]
- Wang, J.; Wang, F. Study on the Relationship between the Carbon Emission of China’s Transportation Industry and the Gross Economic Product of the Industry—Based on Decoupling Model and Co-Integration Theory. Spec. Zone Econ. 2021, 4, 75–78. [Google Scholar]


Publisher’s Note: MDPI stays neutral with regard to jurisdictional claims in published maps and institutional affiliations. |
© 2022 by the authors. Licensee MDPI, Basel, Switzerland. This article is an open access article distributed under the terms and conditions of the Creative Commons Attribution (CC BY) license (https://creativecommons.org/licenses/by/4.0/).