Article

Application of Slow Pyrolysis to Convert Waste Plastics from a Compost-Reject Stream into Py-Char

by
Ewa M. Iwanek (nee Wilczkowska)
1,* and
Donald W. Kirk
2
1
Faculty of Chemistry, Warsaw University of Technology, Noakowskiego 3, 00-664 Warsaw, Poland
2
Department of Chemical Engineering and Applied Chemistry, University of Toronto, 200 College Street, Toronto, ON M5S 3E5, Canada
*
Author to whom correspondence should be addressed.
Energies 2022, 15(9), 3072; https://doi.org/10.3390/en15093072
Submission received: 1 March 2022 / Revised: 13 April 2022 / Accepted: 21 April 2022 / Published: 22 April 2022
(This article belongs to the Special Issue Pyrolysis and Gasification of Biomass and Waste)

Abstract

:
There is growing recognition that the degradation of plastics in the environment is a serious problem. This study investigated and reported on the feasibility of removing end-of-life plastics from circulating in the environment. The specific example focuses on non-recyclable plastics found in a waste diversion program for compostable materials, known as the Green Bin Program. The purpose of this study was to identify and quantify the types of polymers in this stream, as well as to determine if it could be successfully turned into char without separation of its components. The measurements show that polyethylene (72 wt.%), polypropylene (14 wt.%) and polyethylene terephthalate (12 wt.%) are the main constituents of this stream, with minor contributions from polybutylene adipate terephthalate (PBAT), polyvinyl alcohol (PVA), poly methyl methacrylate (PMMA), polystyrene (PS), Nitrile rubber and Nylon. Samples of the as-received waste containing plastics and fibrous material were subjected to a slow pyrolysis process. The yield of the char product depended on the conditions of the pyrolysis and a strong synergistic effect was noted when both the plastic and fibrous materials were co-pyrolyzed. The study of variable pyrolysis conditions, along with DTA-TGA-MS studies on the mechanism of the char formation, indicate that the positive effect results from enhanced interaction of plastics with air, in the presence of fibrous material, during the initial/pre-treatment step.

1. Introduction

The pyrolysis of waste plastics has been a current topic for the past several decades [1,2,3,4,5]. With the continuous increase in the production and complexity of plastics, waste streams containing plastics, especially those which cannot be recycled, need to be identified, characterized and, if possible, sequestered [6,7,8]. One of the important environmental incentives introduced in Canada by the Province of Ontario was recycling via the Blue Bin and Green Bin Programs, whose main target was diverting waste from landfill by focusing on comprehensive recycling and launching the first major Green Bin program in North America in 2002. The Supplementary Information contains lists of materials that are accepted for the Toronto Green Bin (Table S1) and those that should not be placed in the Green Bin (Table S2). Similar food/yard waste collection is conducted in many other countries [9,10,11]. In principle, the Green Bin program collects compostable organic material to produce compost and, hence, reduces the use of landfilling. In practice, despite public education programs and signage, non-compostable materials end up in the Green Bin stream and must be removed before composting. This rejected stream is non-recyclable and, therefore, disposed of in landfill. It is well known that plastic wrap and other containers often accompany food wastes, but there have been no reported studies on the actual composition of this reject stream. The purpose of this study is to provide quantitative information regarding the composition of this waste stream and to determine if there is a viable opportunity to produce char via pyrolysis (py-char) from this material, rather than landfilling it. The economic benefit of the application of using py-char in the soil to improve crop yields has been investigated in other studies, e.g., in the paper entitled “Potential Benefits of Biochar in Agricultural Soils: A Review” [12] and references therein. In this case, the char could be put directly into the compost, which would reduce any costs associated with its transportation.
The pyrolysis of plastics, especially fast pyrolysis with the use of a catalyst, has been explored in numerous studies due to the potential of creating fuel [13,14,15,16,17,18,19]. The objective in these studies was to obtain fuel (gaseous or liquid) rather than char; however, studies on obtaining active carbon from plastic waste have also been performed, for example, in [1] and references therein and [3,20]. What is more, pyrolysis has been proposed for converting materials, such as sewage sludge [21,22,23,24], biomass [25,26] and tire waste [27], to char, demonstrating the robustness of the technology. Obtaining char from polyethylene terephthalate [28,29,30] has also drawn considerable attention.
The aim of the current research was to experimentally determine whether a useful yield of char could be obtained from the unsorted mixed waste stream. It is known that through varying the pyrolysis conditions, such as co-pyrolysis of different materials [19,31,32], increasing char yield is possible. Since forming py-char is dependent upon the type of polymer present, it is important to characterize the waste stream. Two findings made char formation attractive: (1) the fiber entrapment in the reject material makes separation infeasible, and (2) the presence of food wastes and duration between collection and processing makes the likelihood of microbes, viruses and pathogens a concern for any treatment. Pyrolysis was chosen as a robust method, which can handle the abovementioned issues, i.e., it can be used on a mixed waste stream without separation of the components and it ensures destruction of pathogens. Organic matter, such as plants [33,34], wood [35,36], or other types of biomass, including waste streams [35,37,38], can be pyrolyzed to produce char. In the case of wood, thermal treatment at slightly lower temperatures (200–300 °C), called torrefaction, is used to produce energy-rich pellets and has been implemented in the industry in various countries, such as The Netherlands, Sweden, Austria, Spain, USA and Portugal [39]. The char yield varies with the type of biomass, pyrolysis temperature, atmosphere, etc. The heating rate is also one of the most important parameters and leads to distinguishing between fast pyrolysis, whose aim is obtaining high yield of oils and gases [25,36], and slow pyrolysis. In the case of plastics, obtaining char is much more difficult [15,19]. For this reason, it may be necessary to perform a pre-treatment of polymers using oxidation, chemical reaction, or co-pyrolysis [32]. Testing representative samples of an actual plastic waste stream is the best indicator of the potential for a successful application of pyrolysis. Producing py-char from the plastics, in which a substantial part of the carbon is retained as a non-biodegradable carbon sequestering product, is an approach for the mitigation of such waste streams. The aim of the current study was to verify if pyrolysis of the waste stream, without any pre-treatment or additives, was possible.
An effective way of identifying polymers and microplastics is Fourier Transform Infra-Red (FTIR) Spectroscopy. The addition of an Attenuated Total Reflectance (ATR) unit enables the non-invasive testing of plastics of almost any shape and size, without the need for extensive sample preparation [40]. Raman spectroscopy can also be used to identify polymers by comparing obtained spectra with those of standards [41]. However, since there is no contact with the surface of the sample, unlike in ATR, surface contaminants can present a significant challenge for post-consumer plastics without substantial preparation. Avoiding a preparation stage has made ATR-FTIR the most commonly used method for the identification of plastics [42,43,44,45]. The spectra of recycled/reused plastics can differ from those of laboratory standards [46] due to surface aging of the plastics [47], blending during recycling and the presence of manufacturing additives.

2. Materials and Methods

2.1. Feedstocks

Two 5-gallon pails with samples of waste from the sorting operation at a composting site in Ontario, Canada were obtained. Coming from one specific composting site collected on a specific day, these samples were used to gain some insight into the contents of the unidentified waste stream, but are not representative of all composting sites and all seasons. The contents of the two pails were weighed without any treatment and included the moisture present in the samples. The contents of one pail were air dried for 8 days, reweighed, then were sorted into polyfilm plastics, extraneous hard plastic pieces and fibrous materials. The fractions were determined on a dry weight basis. The dry materials were used for making char.
The other pail was quantitatively analyzed for the polymers present. For this task, the plastics were washed thrice in bleach water to reduce the odor and potential pathogens, rinsed, and dried in a continuous air flow and then used for analysis. The water washing was not expected to remove organic contaminants.

2.2. Identification and Quantification

The Fourier Transform InfraRed spectra were collected using a Perkin Elmer Spectrum Two (Waltham, MA, USA) instrument equipped with an ATR add on in the 450–4000 cm−1 wavenumber range. The individual pieces were categorized based on the obtained spectra and the content of the different types of plastics was determined on a wt.% basis.

2.3. Carbonization Experiments

The carbonization experiments consisted of three steps: preparation of the pellets, partial oxidation to facilitate the charring, and carbonization. The procedure for each step is described below.
Preparation of pellets. The pellets were obtained by a short thermal treatment which allowed disks to be formed. Three types of disks were obtained: from only PE, from only fibers, and pellets which were a 1:1 mixture of the two components. A total of 1 g of material was used to make one pellet. In order to obtain the mixed disks, 500 mg of PE pieces were cut to match the cylindrical Al boat diameter and 500 mg of fiber from the Green Bin reject stream was placed between the PE layers in the cylindrical Al boat. The boat and contents were heated to 200 °C at a rate of 10 °C/min, by which time the pellet was consolidated into a single mass. There was no mass change.
Oxidation step. Prior to carbonization PE was partially oxidized so that char formation would occur with a higher yield. There were two temperature programs used for this step. The conditions of this step were chosen based on the information available in the literature: It is well known that directly heating PE, PP and PS polymers above 500 °C causes chain-end scission and vaporization (gasification) of the polymer, which leaves no residual char. At temperatures lower than 270 °C polymers simply remain molten. We chose to pick the middle of a pretreatment range used by Choi et al. who reported stabilization temperatures in air ranged from 270 to 330 °C for LLDPE [48,49].
The oxidization step was carried out in an electrically heated quartz-glass tubular reactor (diameter 2 cm, length = 22 cm). A manually operated powerstat was used for electrical heating and a thermistor with the sensor element on the sample pellet was used to monitor temperature. Large pieces from the waste were removed because of the sample size used in the tubular furnace (~2 cm diameter). The samples of the recombined waste stream, as well as those of the separated polymer fraction and fibrous fraction were tested for overall char yield.
The pellet was placed in an aluminum boat midway in the vertical tube furnace, in the center of the heated zone. The temperature probe was lowered to contact the sample and boat and a fiberglass porous plug was placed in the exit of the furnace to prevent any loss of particulate matter and to collect any heavy tars that might be produced.
In the first type of oxidation experiments the temperature was ramped to 300 °C at a rate of 5 °C/min under the atmosphere of the products forming during heating. The reactor was allowed to cool and the sample was reweighed after removal from the boat.
In the second type of oxidization experiments the temperature was increased to 330 °C at a rate of 5 °C/min and this temperature was held for 10 min. Additionally, these experiments were conducted with or without a restriction of air flow to the pellet. To minimize air access to the sample in the runs with air restriction, a fitted Al disk was placed onto the Al boat.
Carbonization step. The carbonization experiments were carried out in an STA 449C (NETZSCH) thermobalance with a mass spectrometer (QMS 403C, NETZSCH). The three types of char were subjected to heating in either an inert atmosphere or in synthetic air. The aim of the first type of experiments was to gain an understanding of how advanced the charring process was, which was assessed using the weight loss. The second type of measurement was carried out in order to determine how much ash is found in the waste stream. Both were performed with a heating rate of 5 °C/min to 850 °C.
The mechanism of char formation was investigated by heating a part of a pellet in either an inert atmosphere or in synthetic air to 300 °C with a heating rate of 5 °C/min and holding it under that atmosphere for 20 min.

2.4. Char Characterization

SEM imaging. Scanning Electron Microscopy imaging was used to determine the topography of the produced char. SEM images were acquired with a Quanta FEG 250 scanning electron microscope (Field Electron and Ion Company, FEI, Hillsboro, OR, USA) with the following parameters: beam energy 10 kV, working distance 10.4 mm, spot size 2.0; magnifications: 200, 500, 1000, 2000 and 5000 times.
Attenuated Total Reflectance-Fourier Transform InfraRed Spectroscopy (ATR-FTIR). Spectra of char as obtained, as well as that after heat treatment in inert gas and the ash obtained from burning the carbonaceous matter off, were collected using a Nicolet 6700 (Thermo Fisher, MA, USA) instrument equipped with a Specac Quest ATR add on.
X-Ray Diffraction. The XRD pattern of the char was collected using a Siemens D 5000 instrument (Bruker AXS GmbH, Karlsruhe, Germany). Operating parameters: Cu lamp; 40 kV, 40 mA. The measurement was performed for scattering angles: 10–85 degrees (0.2 deg steps). The sample was fixed in place with Kapton® tape. The background associated with the tape was subtracted and the resulting diffraction pattern was analyzed.
The quality of the obtained char can be evaluated as in [50,51], but was beyond the scope of this paper.

3. Results

3.1. Composition Determination

The contents of the first pail of the waste stream from the composting site, as determined without any pre-treatment, were: 13% polyfilm plastics, 10% hard plastics and extraneous material, and 77% fibrous material, which contained fabrics and paper used for wrapping and disposal of food and food scraps, which were entangled in the fibers. The waste obtained from the site contained approximately 30 wt.% moisture. A picture of the plastics after sorting is shown in Figure 1A and the fibrous material in Figure 1B. The extraneous material (not shown) included a plastic lunch pail, parts of a water bottle, elastic bands, bottle caps, large fruit seeds and peel. It was clear in performing the manual separation of fractions that the fibrous material, which is the dominant fraction, entangles polyfilm pieces and extraneous materials, making additional recycling impractical. Microscopically, the fibers appeared similar to paper fibers. After drying (Figure 1C), a fiber was tested with ATR-FTIR and the spectra indicate that it has a variable amount of carbon (C-H aliphatic stretch), as well as numerous functional groups, which will be shown to be beneficial for char formation. A dry piece of paper was also found in the second group of materials. A study by Grieco and Baldi [31] showed a beneficial effect of the co-pyrolysis of PE with paper.
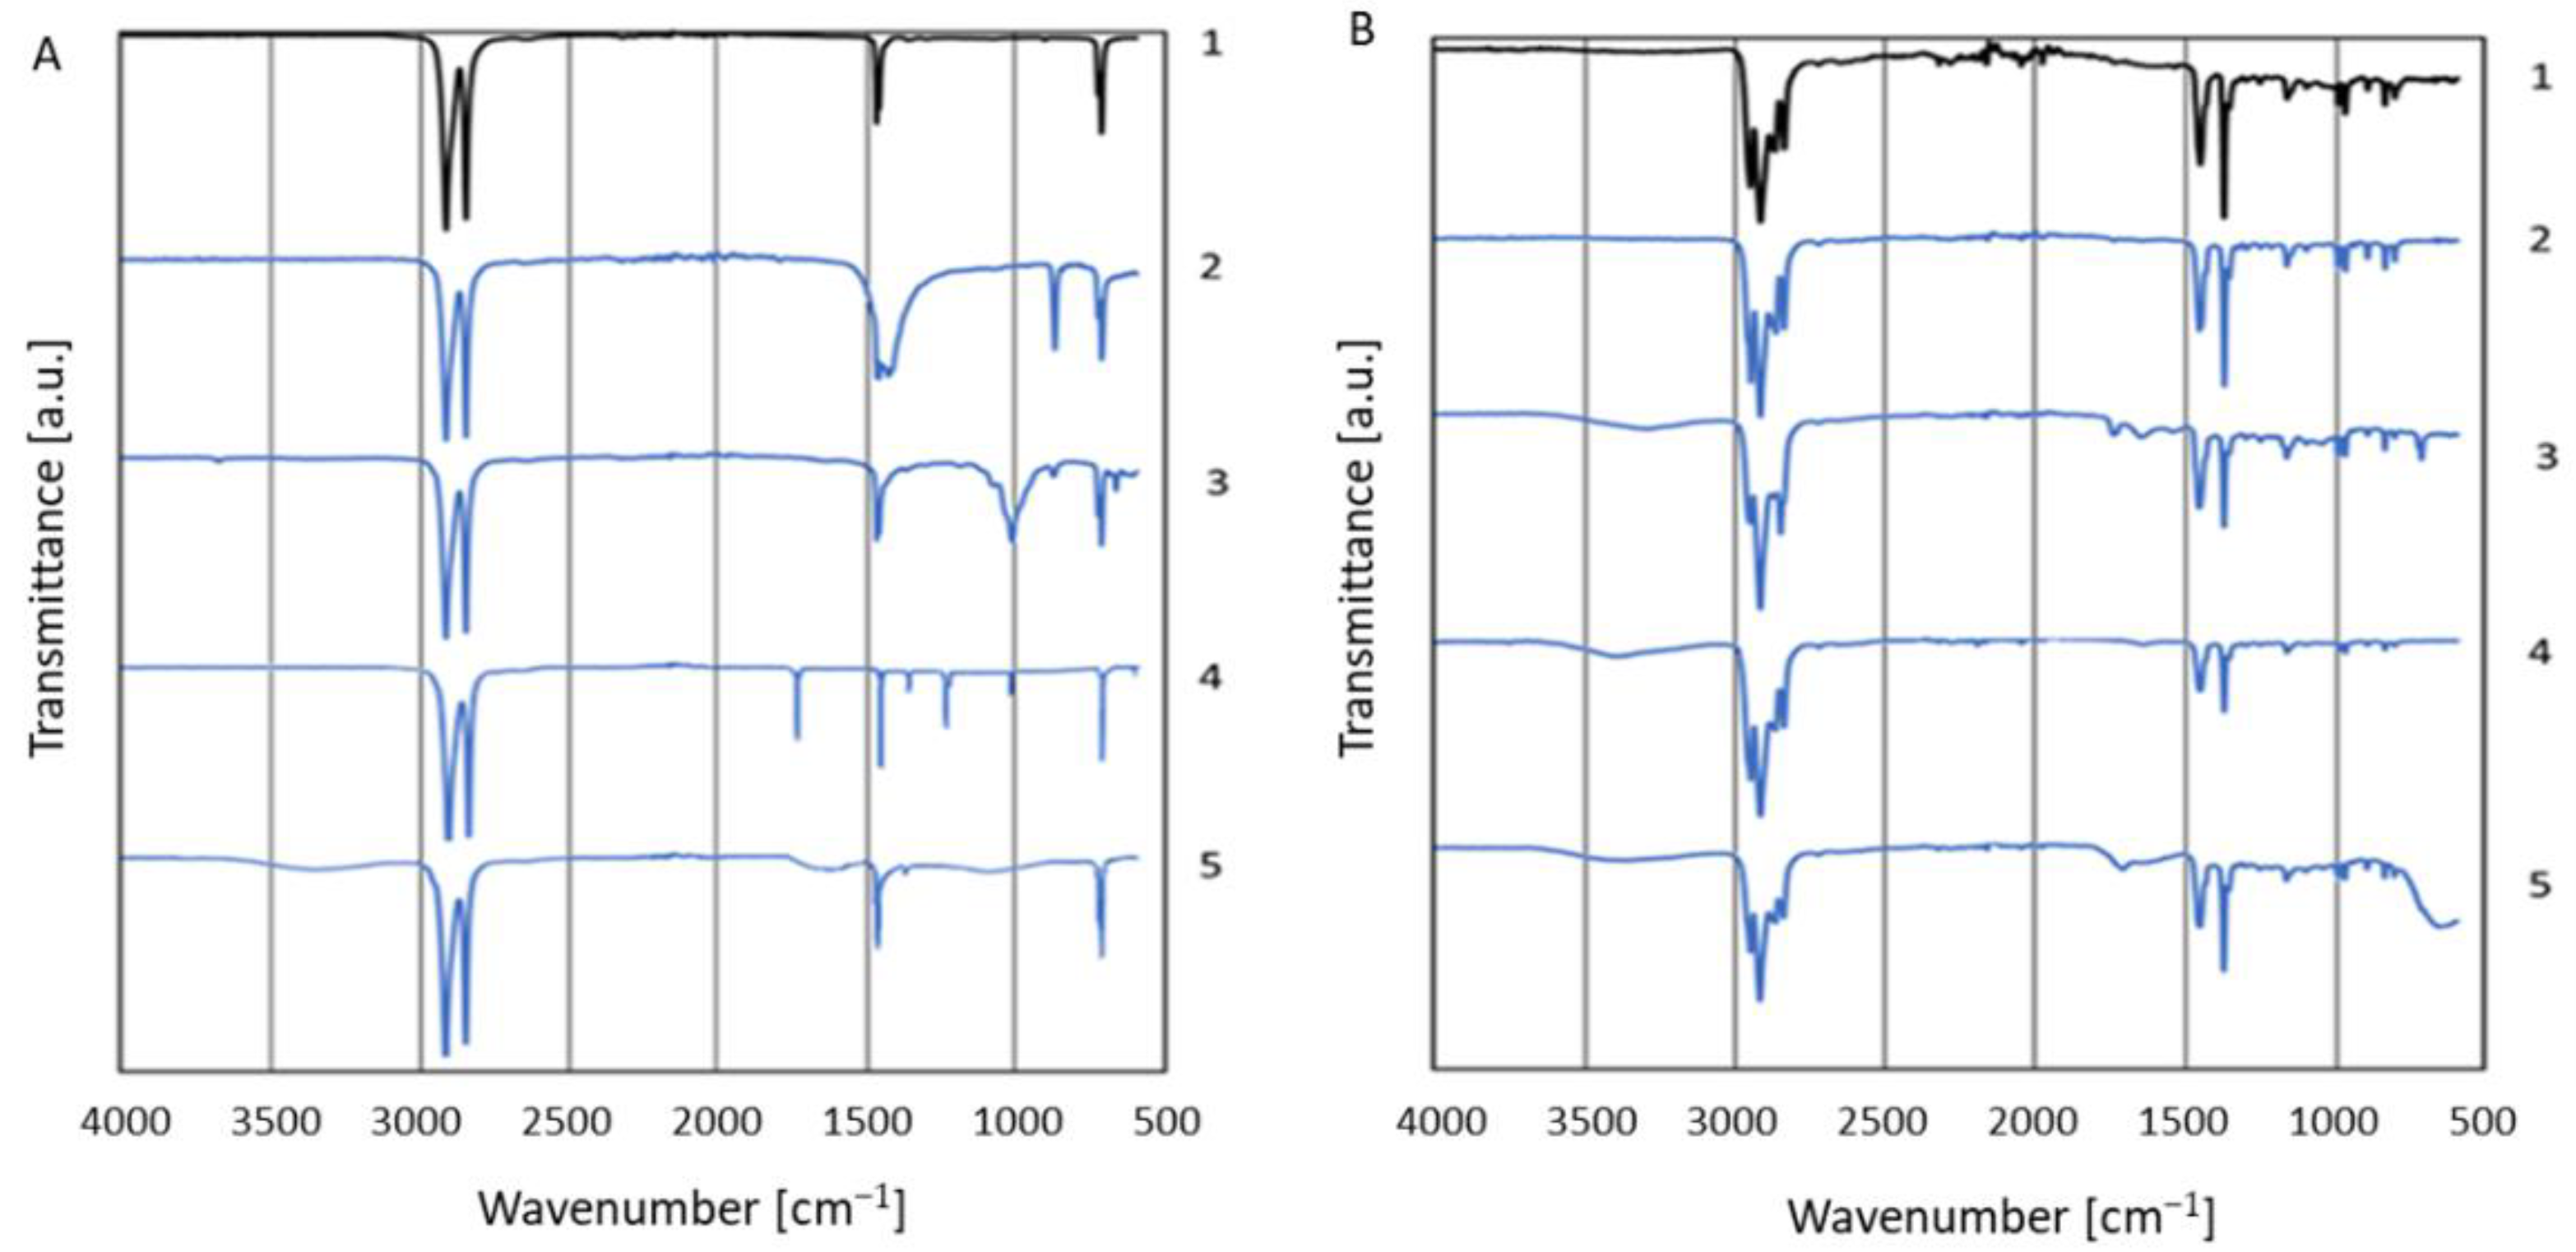
The ATR-FTIR analysis has shown that residual surface contamination can sometimes lead to ambiguous results, as spectra have a substantial contribution from signals, from contaminants. Additional peaks may also arise from intentionally added components in the film, and aging of the polymers. To illustrate this, a series of spectra have been compiled in Figure 2. The spectra from pure standards, as well as commercial items, such as bags and containers with a legible label, are shown in Figure 2. For both LDPE and HDPE polyethylene, sharp, intense signals at 2916 and 2849 cm−1 are typical for the symmetric and asymmetric -C-H2- stretch in PE, as are bands at 1473 cm−1 and 719 cm−1, which correspond to asymmetric in-plane bending of the -C-H- bond and rocking -C-H(-CH2-)n ≥ 6, respectively [40]. These are the bands visible in the spectrum of a PE standard, which is shown in Figure 2A (black curve). The next two spectra (Figure 2A spectrum 2 and spectrum 3) depict samples of grocery bags, which had the abbreviation HDPE on them, the latter with the words “up to 30% recycled”. It can be seen that the spectra are different than the standard. These additional spectra were very useful in the identification of PE in the compost site sample. Spectrum 4 is that of a non-labeled plastic used, which has those same bands as the standard, but it also has additional bands, not present in the pure PE standard. These bands, however, are sharp, which is an indication that the plastic is a co-polymer blend. A very similar spectrum can be found in [52] for HDPE/20EVA. The fifth spectrum in Figure 2A is that of PE, which shows the effect of ageing, with broad bands associated with the presence of OH surface groups. Sometimes additional washing with ethanol was needed. Before and after examples of how washing with ethanol helped to reduce the additional signals in the spectra are shown in Figure S1 (Supplementary Information).
Figure 2B depicts the spectra of commercially available polypropylene. The black curve (curve 1) is that of the pure standard. Curve 2 is that obtained from a pasta wrapper, which was identified in the pail of samples due to the name of the producer and color of the wrapper. The spectrum of the store-bought wrapper has the same bands as those of the pure standard and no additional ones. In contrast, the spectrum of a store-bought piece of another item found in the compost site sample, identified due to its unique oval shape and color, had more bands than the PP standard, though it can be clearly seen that the product is mainly made of polypropylene. Figure 2B spectra 4 and 5 are those of office items, which are made of PP and show signs of aging.
Five different polymers and their spectra are shown in Figure 3 with the corresponding sorted pieces in clear plastic bags. Without the aid of the ATR-FTIR, identification would not be possible considering the range of colors and similarities in property behavior. The identified polymer types were separated and weighed. The majority of plastics were polyethylene, PE, (72 wt.%), polypropylene, PP, (14%) and polyethylene terephthalate, PET, (12%) with minor contributions from polybutylene adipate terephthalate, PBAT—a biodegradable polymer—polyvinyl alcohol and poly methyl methacrylate, PVA/PMMA, polystyrene, PS, Nitrile rubber and Nylon. The distribution is shown in Figure 3F. It is important to remember that the analysis was carried out on a single sampling and, therefore, the findings should only be used as guidelines for planning treatment. The analytical method revealed the wide range of polymers in the reject stream which suggested that a simple yet robust method of thermal carbonization would be required.

3.2. Char Formation and Characterization

This research investigated the opportunity to convert this complex waste reject stream into char products. Two findings made char formation attractive: (1) the fiber entrapment makes separation infeasible, and (2) the presence of food wastes and duration between collection and processing makes the likelihood of microbes, viruses and pathogens a concern for any treatment. Pyrolysis was chosen as a robust method, which can handle the abovementioned issues, i.e., it can be used on a mixed waste stream without separation of the components, and it ensures the destruction of pathogens. The char obtained after pyrolysis was weighed and imaged with Secondary Emission Microscopy, as well as Thermal Analysis (DTA-TGA-MS) and ATR-FTIR. There was no odor from the char material and, as a result of the high temperature and time the pellet was subjected to, the material should be sterile and free of any microorganisms.
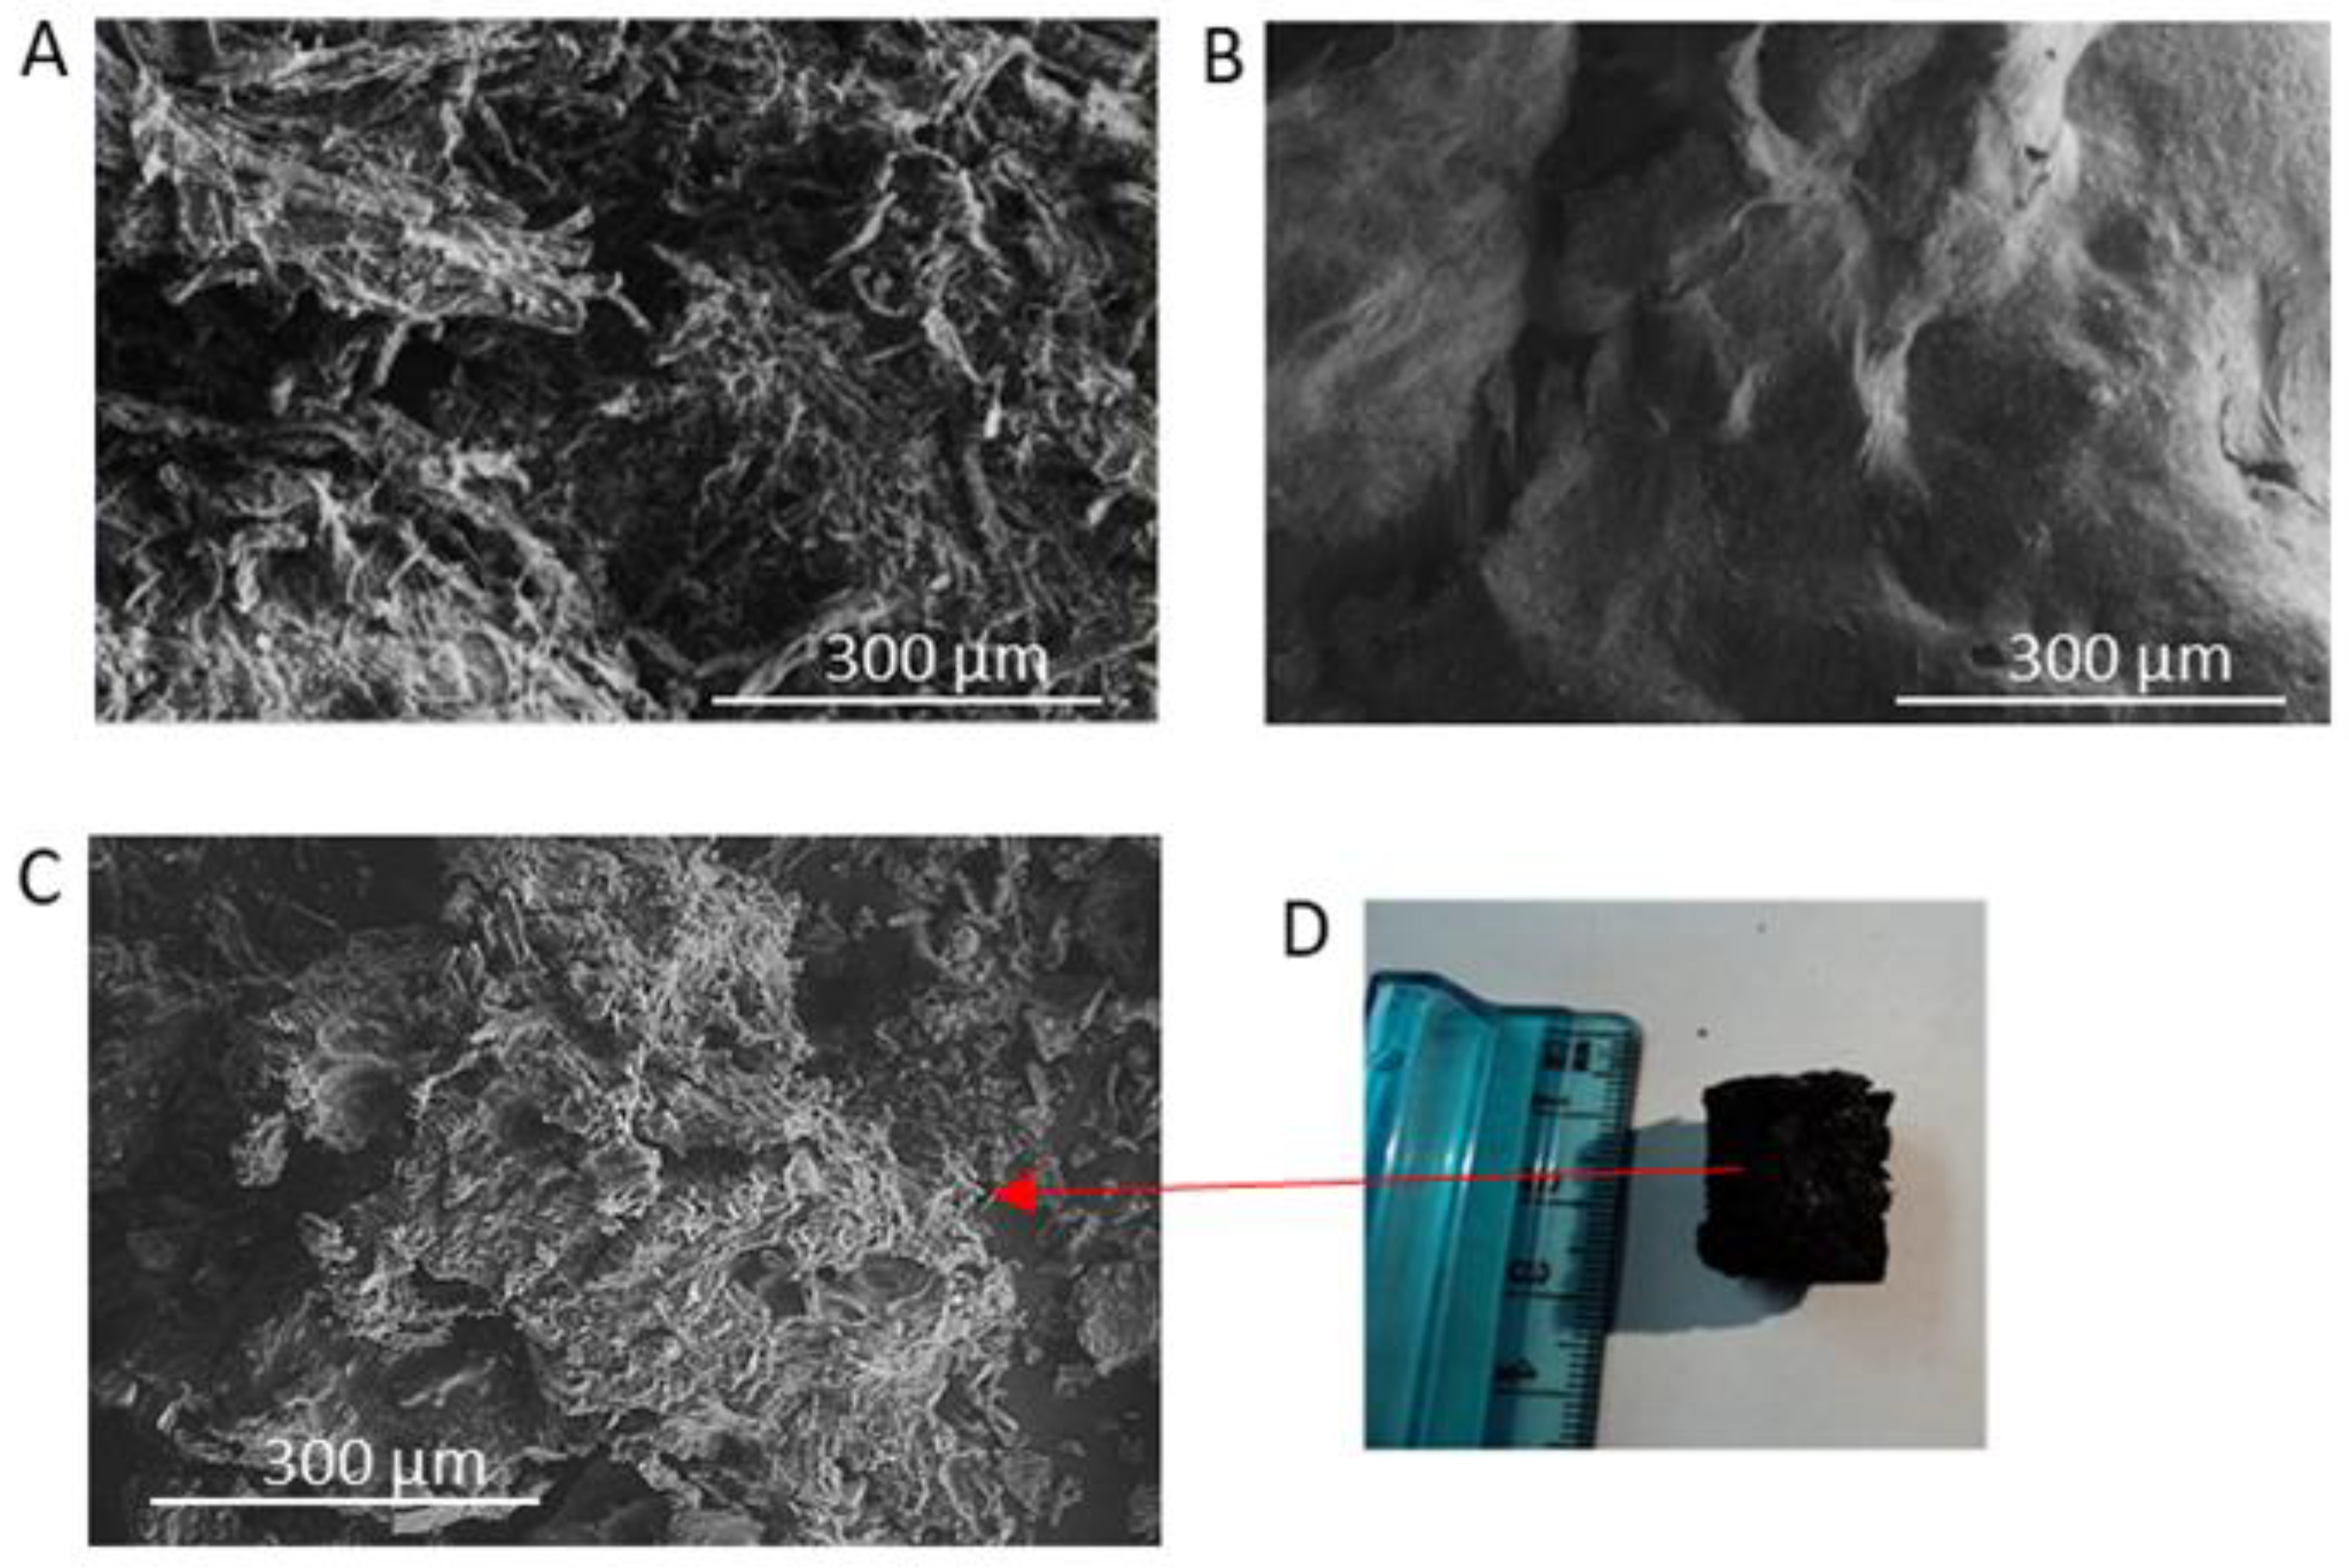
Pyrolysis (pre-carbonization) experiments began with the separated components. For separated fiber in repeated runs, the yields were 33 wt.% ± 4 wt.%. In contrast, under the same pyrolysis conditions, the char yields from separated polyfilms did not reach 5 wt.%. Both fiber and polyfilm materials produced condensables that were captured in the glass wool plug. For the fibrous material and polyfilm runs, 6–7 wt.% condensables were found. For both materials, the most significant product was gaseous. The SEM images of char, which came from the separated materials, are shown in Figure 4, and indicated that the morphology of the char from the fibers (Figure 4A) and polyfilm (Figure 4B) significantly differs. In the case of the fibers, the SEM analysis reveals a complex char structure with rod-like and plate-like fragments. In contrast, the char from the polyfilm alone appears smoother and has fewer features.
The char yield in pre-carbonization runs up to 300 °C were conducted with the recombined polyfilm, and fibrous materials were higher than for the separated materials, i.e., 55 wt.% ± 4 wt.%. There was approximately 4% gain in weight in the fiberglass plugs and little change in the color, indicating low oil and tar formation. The char obtained after pyrolysis was weighed and imaged using Scanning Electron Microscopy, as well as Thermal Analysis (DTA-TGA-MS) and ATR-FTIR. A picture of the char product is shown in Figure 4C and the entire charred pellet can be seen in Figure 4D. The structure appears similar to that of the fibrous material alone.
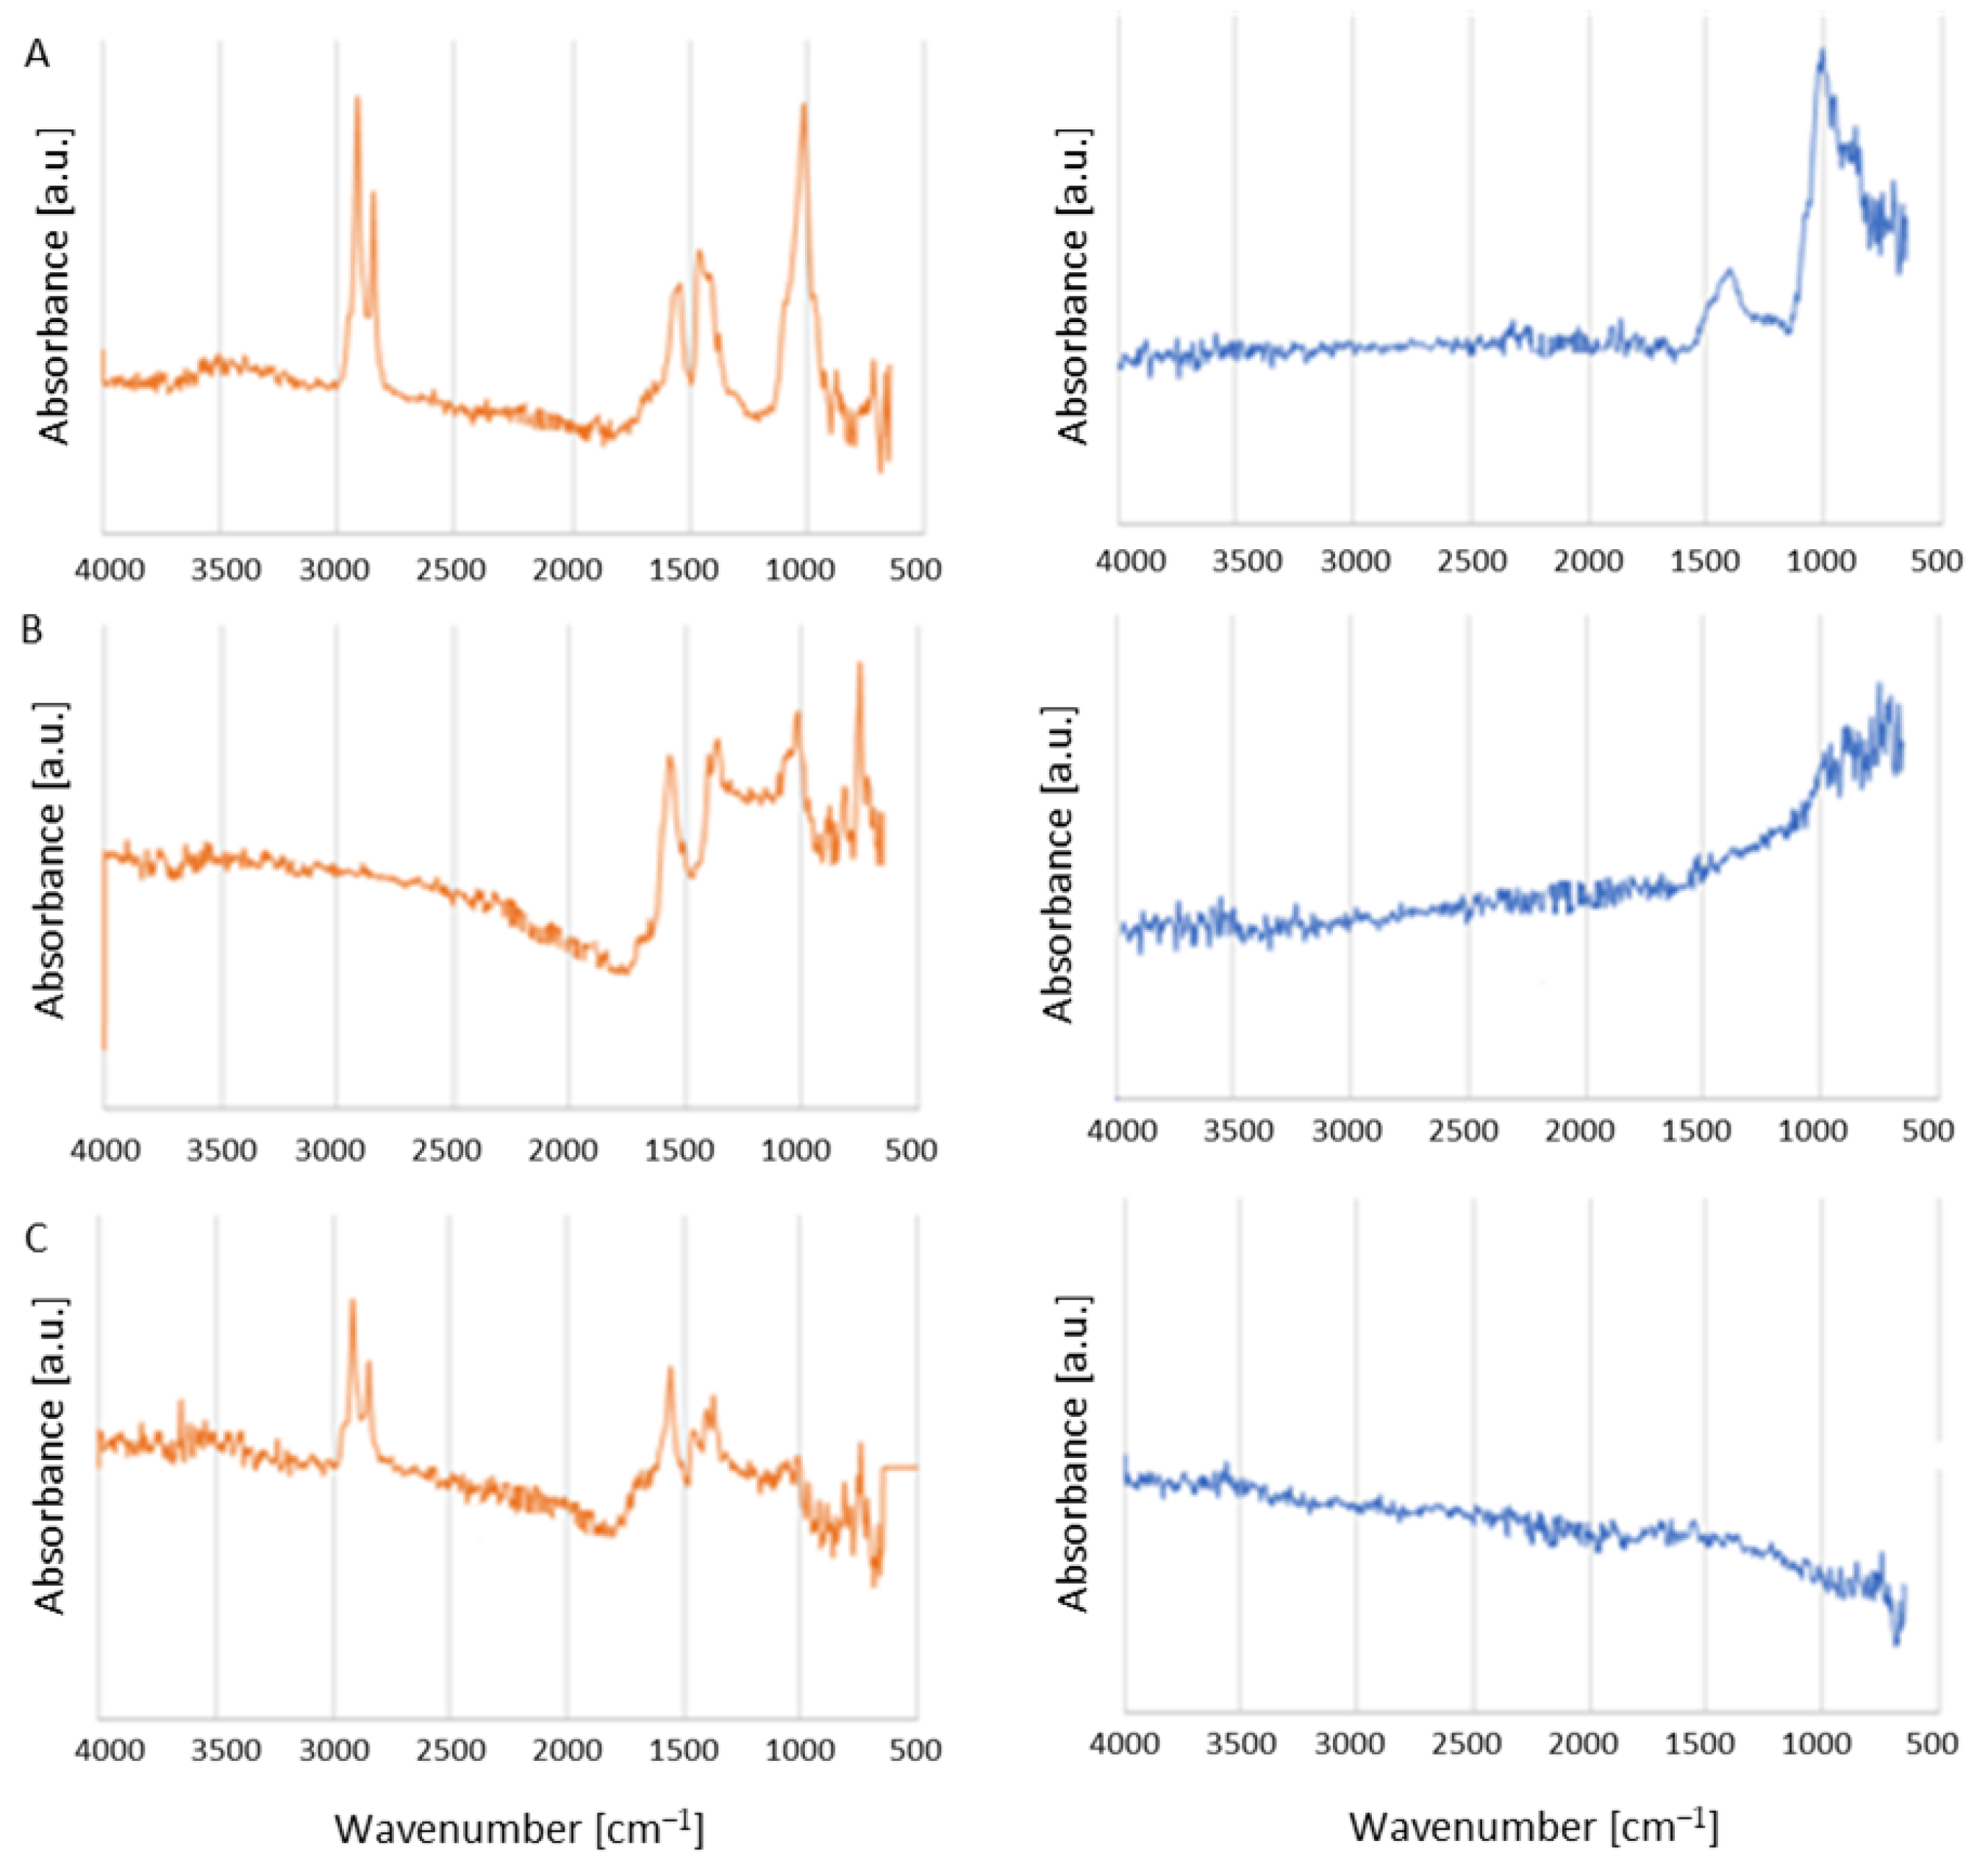
The surface area of the chars obtained from the pre-carbonization step to 300 °C was found to be very low. They were >1 m2/g in the case of the polymer char. The ATR-FTIR spectra of the Thermal analysis of the chars heated to 850 °C in air and inert gas are shown in Figure 5 and indicate that the polymer char still has a contribution of unprocessed PE (Figure 5A left panel). As mentioned earlier and seen for the unprocessed PE, the bands at approx. 2916 and 2849 cm−1 in the relative ratio, visible in the spectrum, with no other bands present in this region (no bands above 3000 cm−1 observed for aromatic hydrocarbons, no bands indicative of the incorporation of heteroatoms nor formation of multiple bonds) are typical for polyethylene. This indicates that some of the PE has been left unchanged. It can be seen that the spectrum of the char from the fiber pellet is different from that of the polymer sample in that there are no bands that correspond to C-H bond stretching (Figure 5B left panel). The spectrum of the mixed pellet char seems to be a combination of the two single-component chars. The surface areas of these chars were also small, i.e., 5 and 3 m2/g for the fiber and mixed char, respectively. The thermal treatment in argon led to a substantial decrease in the signals in the FTIR spectrum (Figure 5 right panel) and the carbonized material became brittle. The surface area was only 9 m2/g. However, there are numerous well-known methods for introducing porosity into carbon materials and, therefore, this property of the char was not considered further.
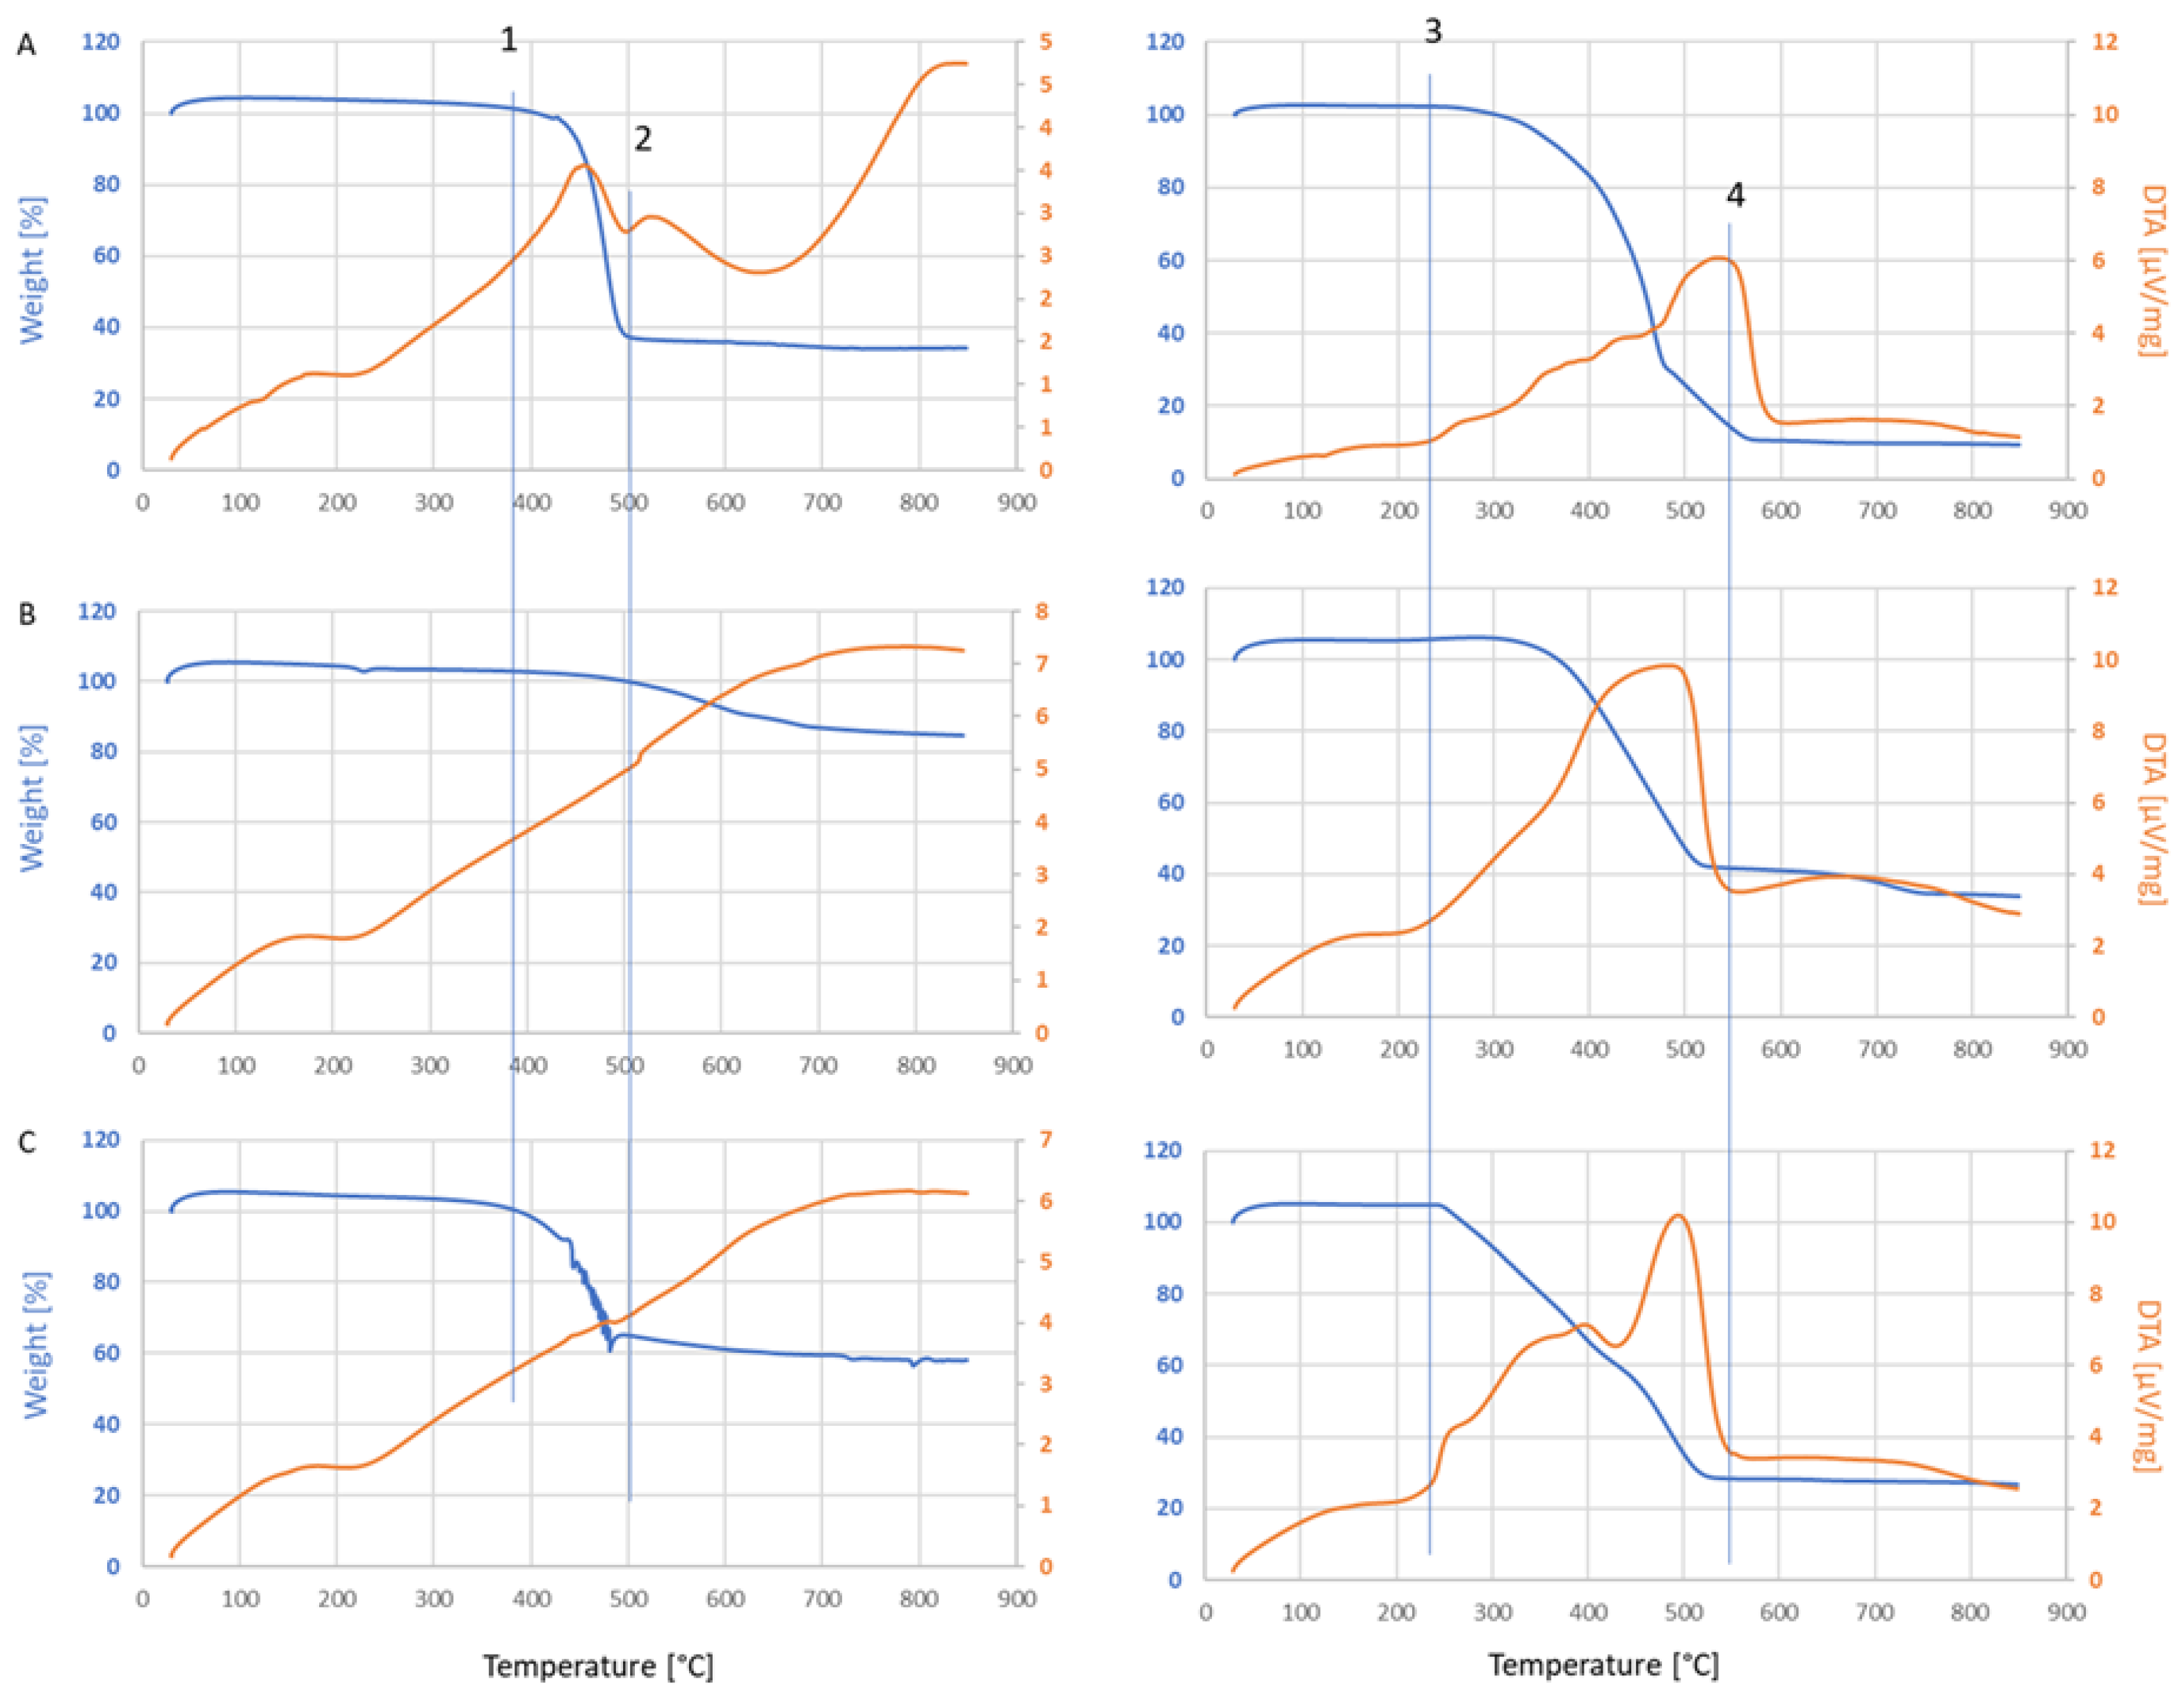
Pyrolysis measurements coupled with MS form an important method in analytical pyrolysis [53] and were applied in this study to elucidate the reason for the synergistic effect of co-pyrolysis of the two types of materials of the investigated waste stream. The results of this study are summarized in Figure 6 and Figure 7. The weight loss and DTA curves obtained during the treatment of the single component and mixed pre-carbonized disks in argon (left panel) and air (right panel) are depicted in Figure 6. In argon, the mass loss of the single component disks (Figure 6A,B left panel) occurs at a different temperature and to a different extent. The DTA curve of the poly sample indicates a two-step weight loss: the first one occurs below 500 °C, the second directly after. The total weight loss of this sample in argon is more than 60%. In contrast, the fiber char exhibits only the weight loss at the higher temperature and the overall loss is only approximately 20%. The mixed char has a weight loss of about 40%, which occurs below 500 °C (Figure 6C lines 1 and 2).
The treatment of the chars in air resulted in devolatilization and subsequent combustion of the char (Figure 6 right panel). The combustion of char leads to a higher mass loss and higher H2O and CO2 evolution. The slopes of the TG curves for both the poly char (Figure 6A) and the mixed char (Figure 6C) change distinctly during the experiment. The latter slope is ascribed to char combustion. It is noteworthy that in the case of the poly char, the slope becomes less steep in this step, whereas for the mixed char, the slope of weight loss associated with combustion is steeper. This indicates a difference in the way the formed carbonaceous product behaves. For the fiber char, both the TG and DTA curves show a more uniform weight loss.
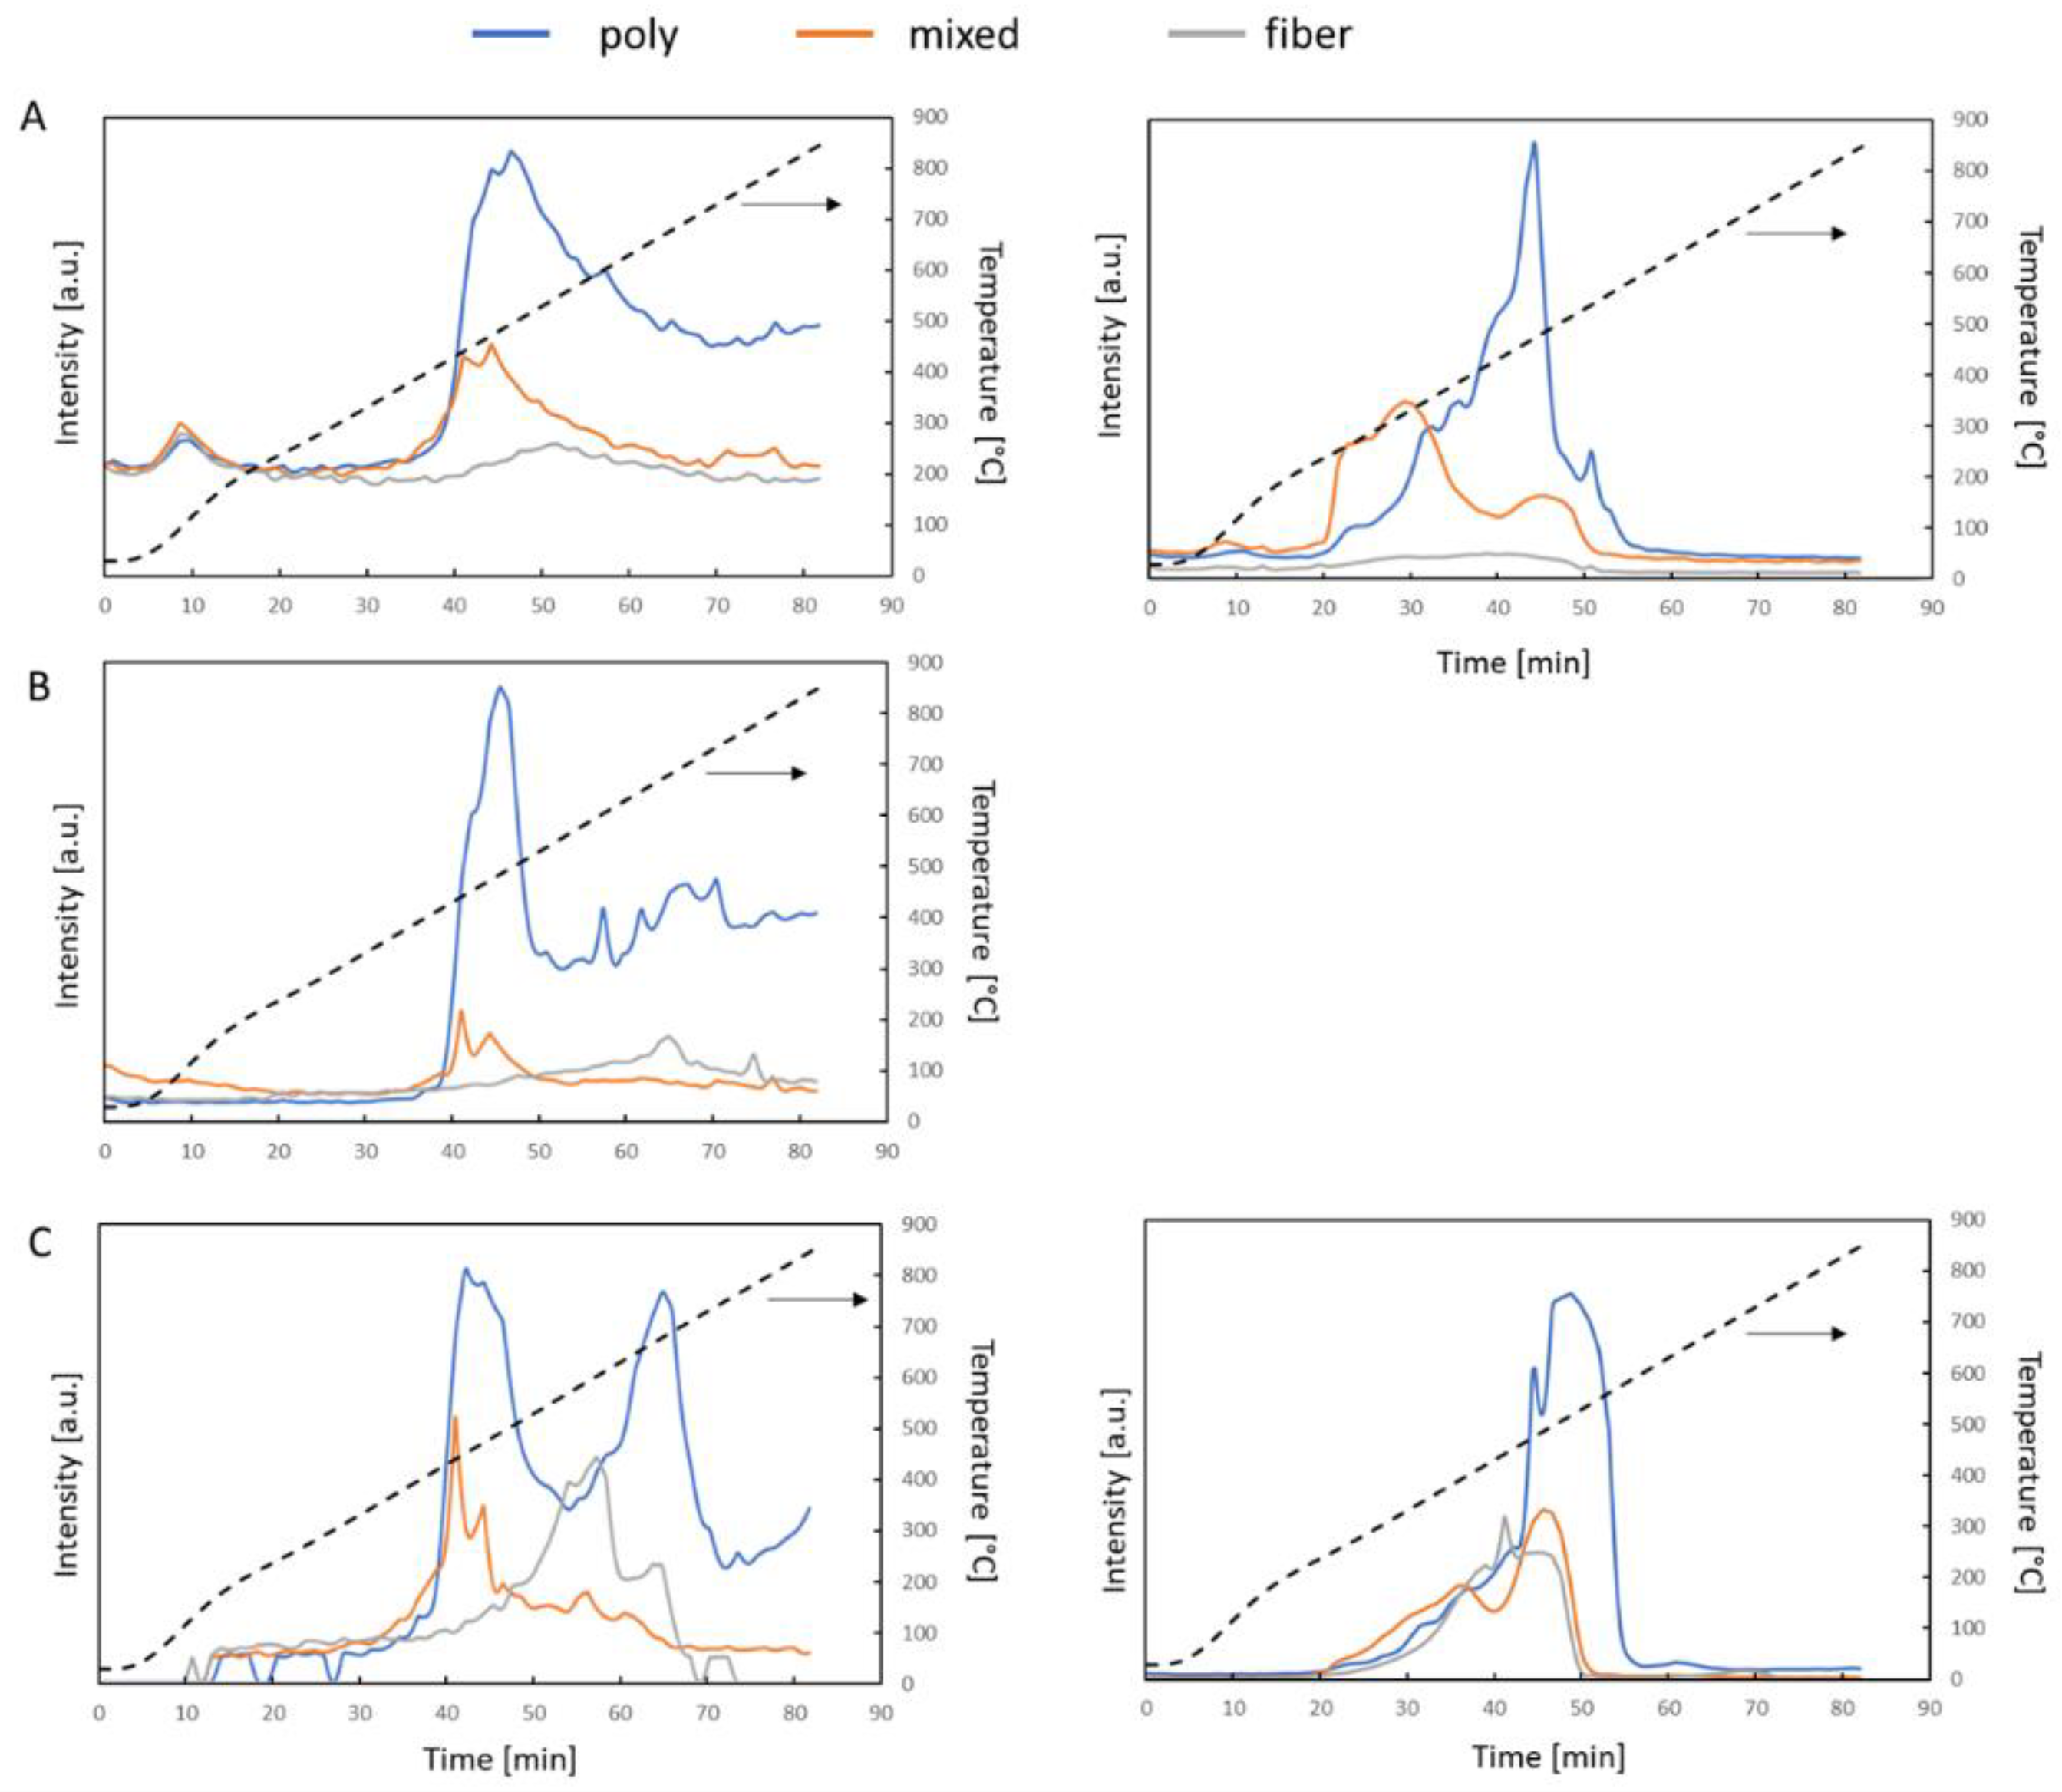
In order to gain more insight into the mechanisms of the weight loss for each type of char, the MS data for m/z signals 18 (Figure 7A), 28 (Figure 7B) and 44 (Figure 7C) were analyzed and are compiled in Figure 7. The m/z = 28 curve for the measurement in air is omitted due to the substantial impact of nitrogen on the signal. It can be seen that in argon, both the poly char and the mixed char begin devolatilization at the same time, which is true for all three studied masses: water, carbon monoxide and carbon dioxide. The poly char shows two, comparable in their intensity, stages of carbon dioxide evolution, whereas the other samples do not. In is noteworthy that the fiber char releases volatiles at a later time (higher temperature) than the poly char and the mixed char, and that the maxima of the evolution of each of the studied compounds come in sequence: H2O, CO2, CO. In contrast, the evolution of volatiles in the presence of air is facilitated in the mixed char sample, probably due to the facilitated ingress of air, which results from inhomogeneity of the pellet. This shows that co-pyrolysis of the two main components of the reject stream in air lowers the devolatilization temperature, which leads to higher char yields of the mix than the individual components.
A slight change in the oxidation treatment prior to carbonization, i.e., heating the disk to 330 °C with 10 min holding time, led to an increase in the char formation. It is noteworthy that the air restriction during this step had a substantial effect on the char formation in the case of a single-component PE pellet. It was observed that, instead of volatilizing, the pellet remained unaffected, except at the very top of the pellet, which was blackened. This showed that the PE reaction relied upon oxygen ingress from the surface. Without air restriction, the entire pellet turned black. In contrast, no effect of the air restriction was observed for the mixed pellet (char yield of 83% and 84% with and without air restriction), which indicates a substantial enhancement in the interaction of PE with air when fibrous material is present. The presence of the fiber promoted oxidation of the entire disk.
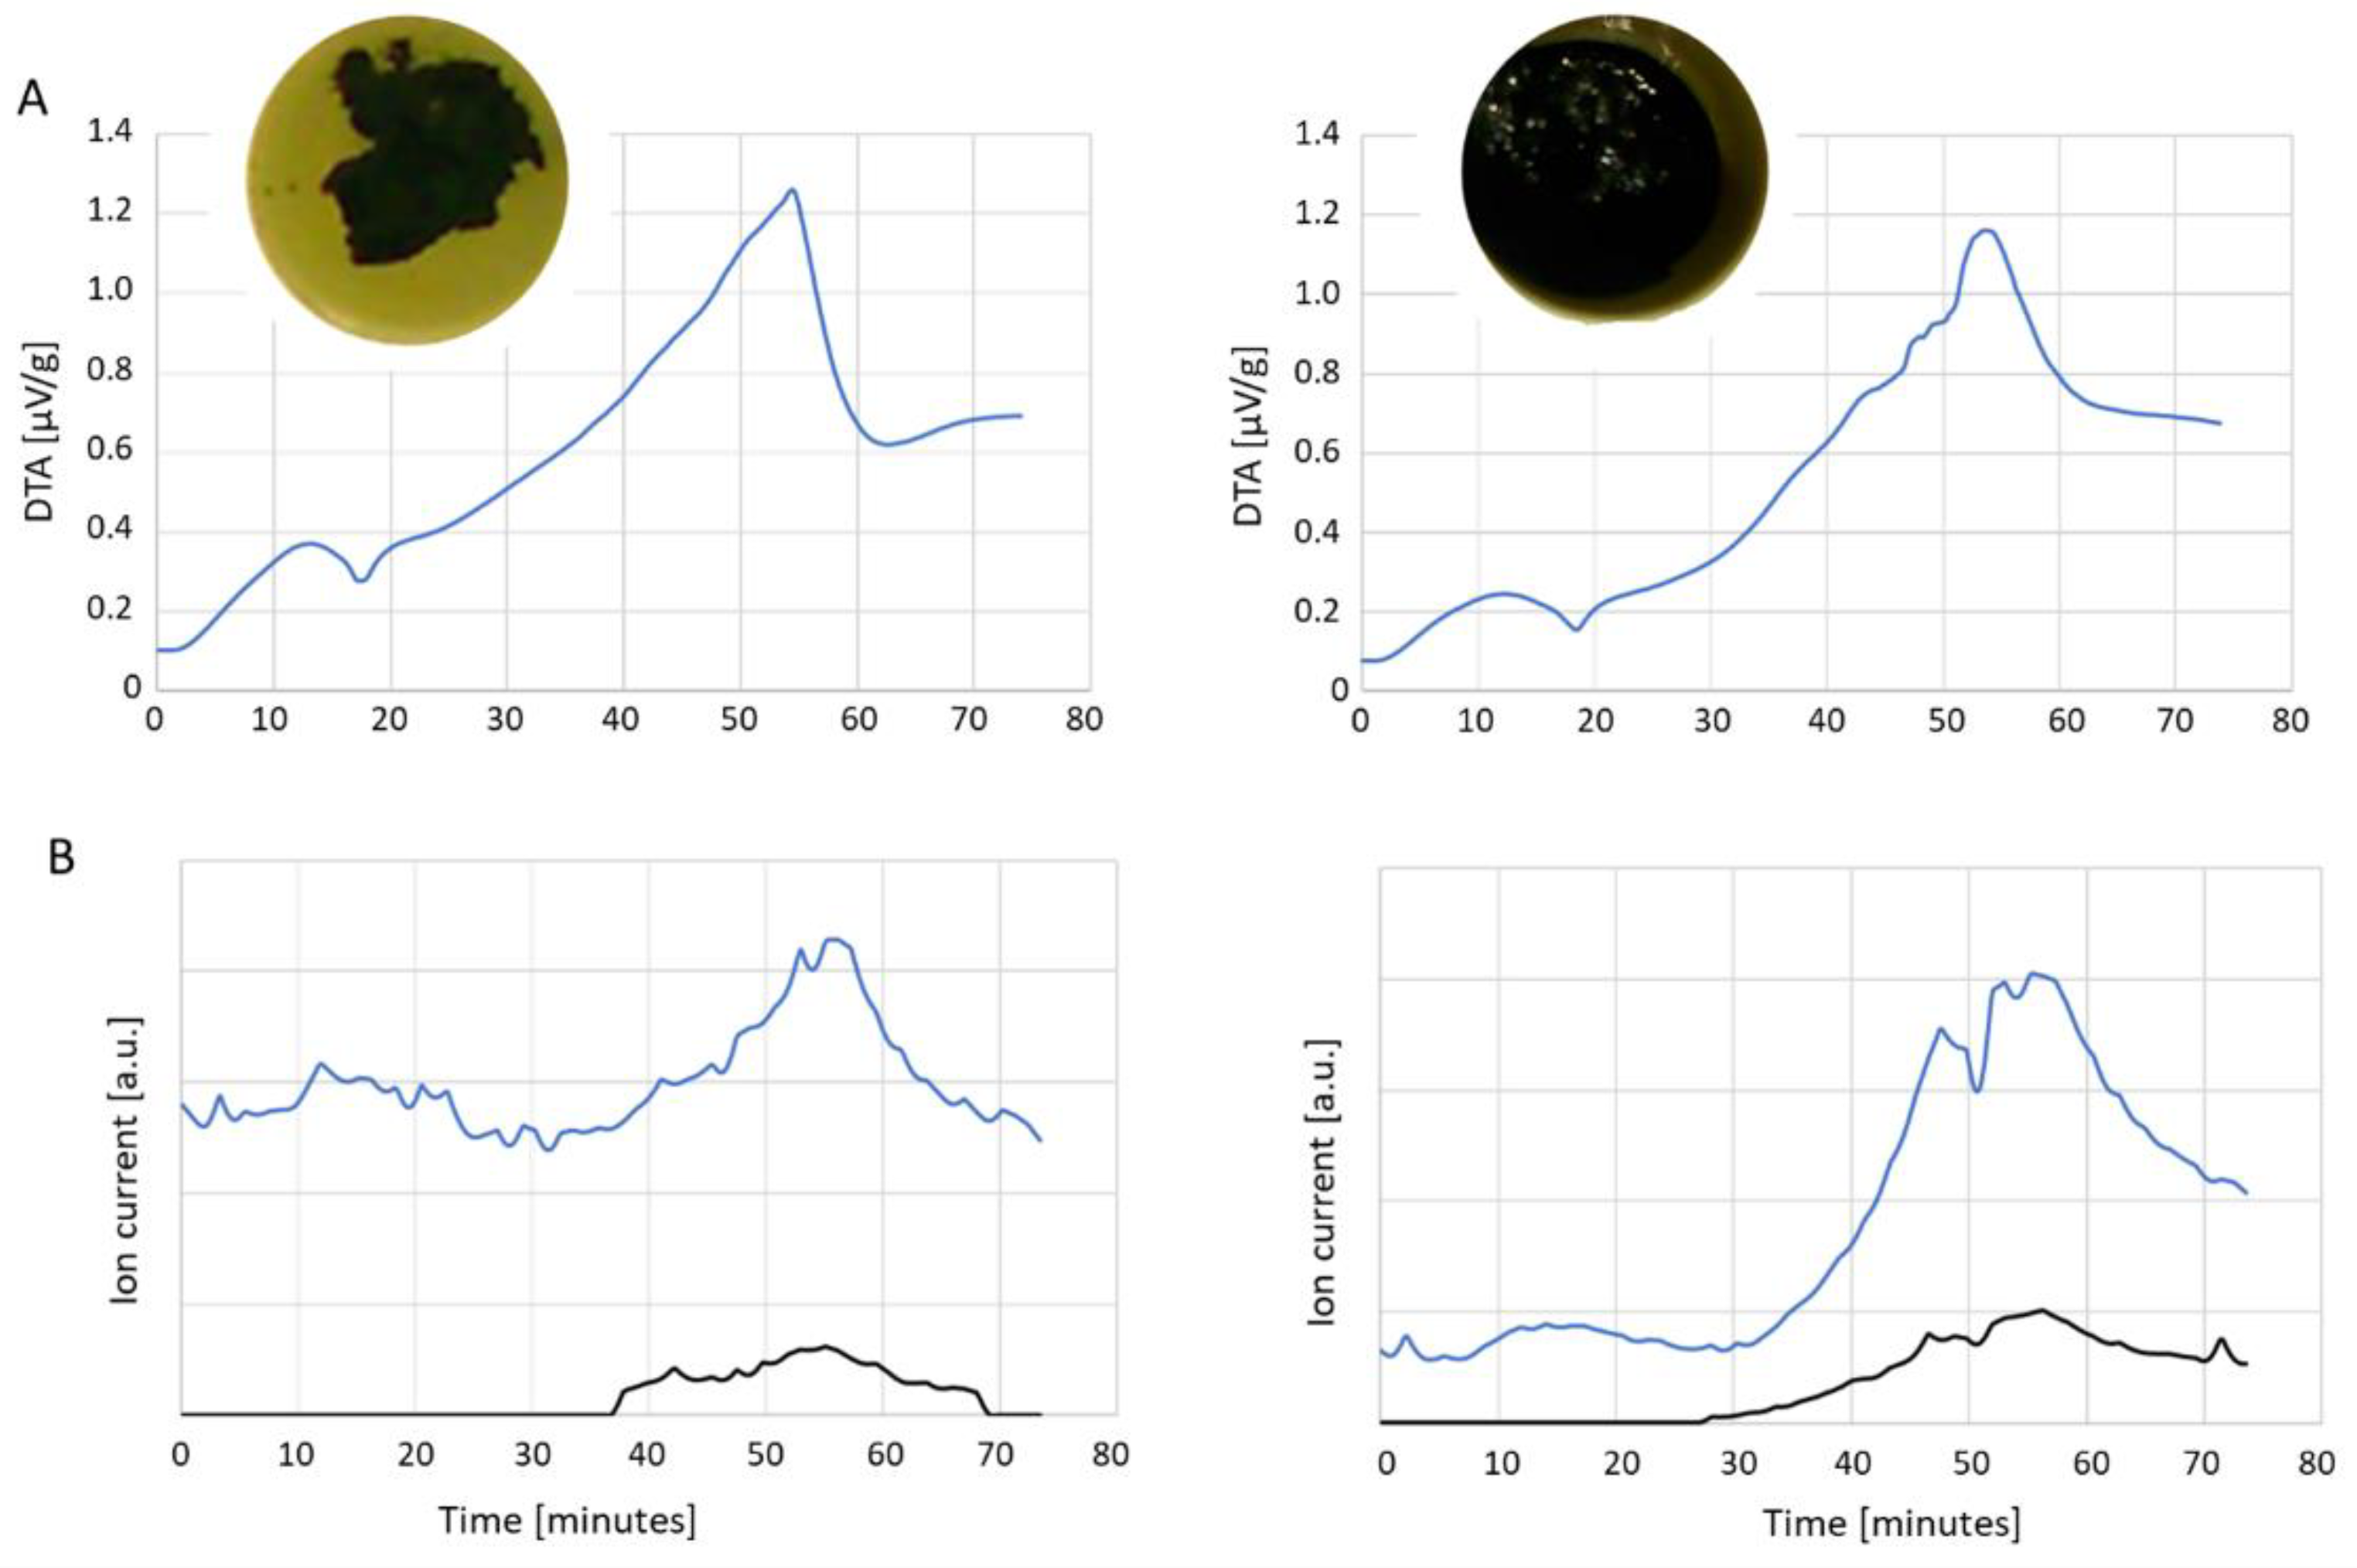
The mechanistic aspects of the synergy of char formation were further studied using thermal analysis with a raw mixed pellet. A pellet was cut into pieces and heated either in argon (Figure 8, left panel) or in air (Figure 8, right panel). The results are collected in Figure 8. Two measurements were performed in each atmosphere. A large discrepancy in the mass loss was seen between the runs. This was most likely due to the fact that the pellets were not homogeneous. Nevertheless, some distinctive differences were visible between the process and the final outcome (char) in argon and in air. The most obvious difference was that the char that was obtained in argon had a shape similar to that of the original pieces put into the crucible (Figure 8A, left panel insert), whereas the char obtained in air had a look of a solid, which solidified after being molten, and the walls were orange due to the presence of condensables (Figure 8A, right panel insert). The DTA curves (Figure 8B) show that even in the case of the two measurements in different atmospheres, which led to the same magnitude of mass loss, the DTA curve of the measurement in air has more thermal effects due to reactions than the almost smooth DTA curves of the measurement in argon. This indicates that either different reactions (more exothermic) took place in the presence of air than in argon, or that the same reactions occurred with a higher intensity. Considering the appearance of the char and the presence of condensable compounds on the walls of the crucible after treatment in air, the former option seems more probable. The MS results show that, in the case of char treated in air (Figure 8B, right panel), the evolution of water vapor during the reactions is much higher compared to that resulting from the desorption of water at the beginning of the measurement, much more so than in the case of the measurement in argon (Figure 8B left panel). The evolution of CO2 begins earlier, i.e., at a lower temperature, in air than in argon.
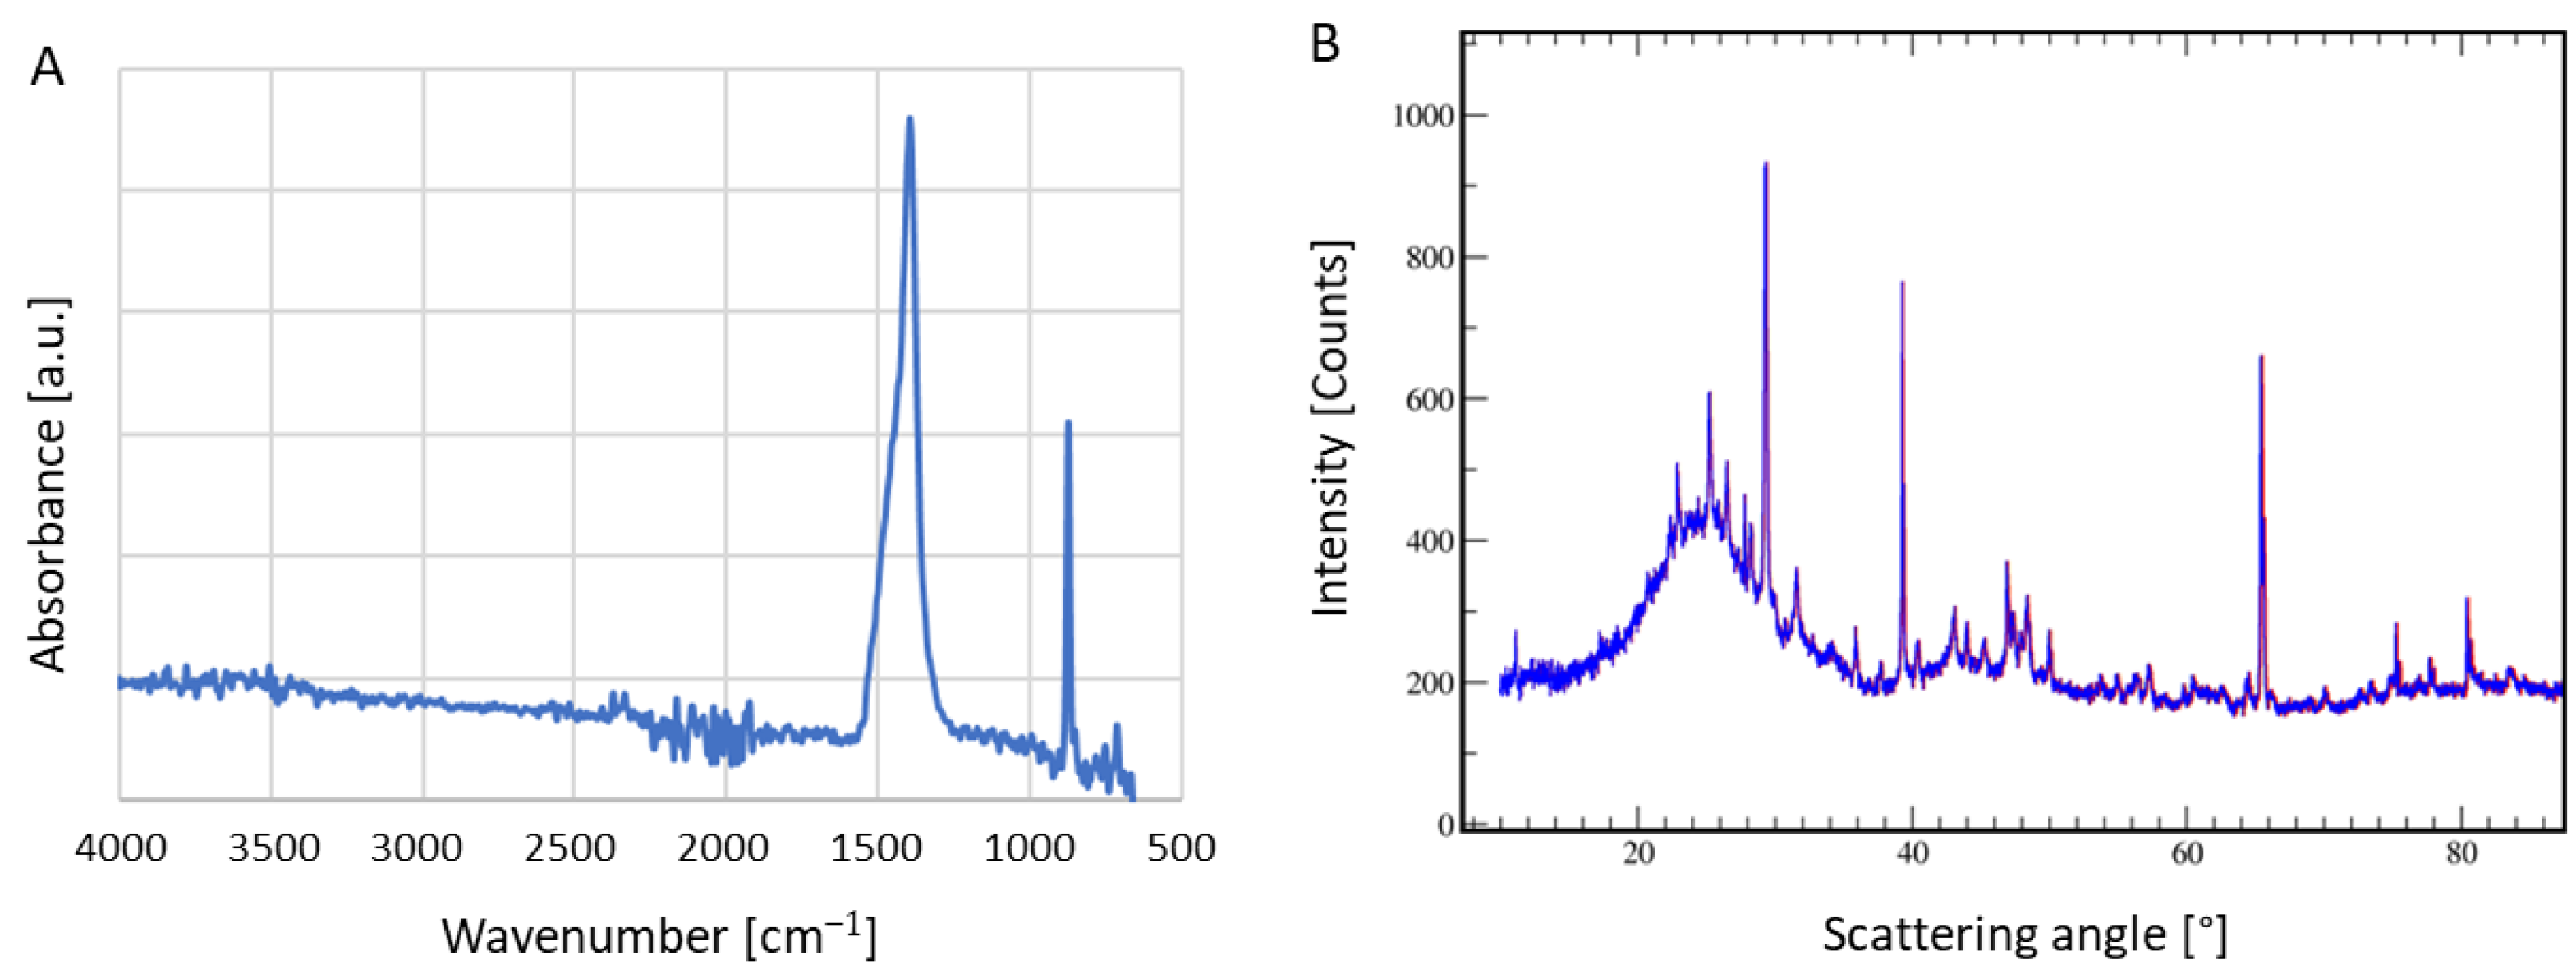
The ash left after the combustion of char was most abundant when the fiber char was heated in air, but all samples had a substantial amount of ash (Figure 6 right panel). The ash was characterized by ATR-FTIR, revealing a spectrum typical for that of calcium carbonate (Figure 9A). The XRD of a fiber pellet carbonized at 600 °C in nitrogen also has signals that correspond to calcite (Figure 9B) and titanium oxide, which is the most common pigment used in coloring polymers. The diffraction pattern of the char shows a small shift in the signals of carbon, smearing. It is mostly amorphous. During carbonization, carbon-containing materials, e.g., polymers, have a tendency for cyclization of polymeric chains with growing C content, which favors sp2 bonding, usually forming small, initially deformed hexagonal sheets. They have a strong tendency to arrange themselves in parallel stacks. The size of the sheet depends on the C contents. With temperature treatment, the sheets grow and weak bonding with neighboring sheets is formed, which leads to decreasing the distance between neighboring atoms and to the alignment of the position of carbon atoms in the neighboring sheets. Ultimately, the material adopts the structure of graphite, which is hexagonal with the spacegroup P63mc (after Hermann–Mauguin), with the strongest diffraction peak indexed as 0002 (following Miller–Bravais notation) or in simplified form, 002 (structure described, e.g., by JCPDS card 75-1621). Significantly broadened peaks of such a structure can be recognized in Figure 9B, in a background of more crystalline sharp peaks. The broad symmetric maximum at 24–25 deg. corresponds to 002 and its full width at half maximum (FWHM) was analyzed using the Scherrer equation. The result indicates a stack height of carbon of approx. 0.8 nm, which corresponds to approx. three layers.
Char materials, such as those obtained in our studies, should be environmentally benign and have a number of potential applications, including soil remediation [12,20]. A compilation of studies on the crop yield increase can be found in [54]. It was not the aim of this research to verify these findings, but to identify the composition of and perform the pyrolysis of both components of this waste stream, as well as their co-pyrolysis. The char yields obtained with the first pre-carbonization procedure are comparable to most of those reported in [20], whereas those noted for the second pre-carbonization procedure exceed even the highest yield cited in [20]. There is a potential application for Green Bin reject to convert it to char to provide value-added properties to the existing compost product. By doing this, no plastic waste stream would be sent to landfill and the compost could have better properties than that without the additional carbon content.

4. Conclusions

The initial work has revealed the diversity of plastic material found in a landfill compost diversion stream. ATR-FTIR was used for identifying polymers in a contaminated waste stream. The results have shown that comingled plastics were present, representing a wide range of polymer types, structures and colors. The three most common polymer types identified were polyethylene, polypropylene and polyethylene terephthalate, which accounted for approximately 98 wt.% of the plastics. A key finding of the pyrolysis measurements is that the reject stream can be processed to obtain a useful carbon char product and the unsorted material was found to have a better char yield than the individual components. Mixed unsorted material, which primarily contained fibers and polyfilms, carbonized with reasonable char yield, so the technology approach appears promising. A slight change in the pre-carbonization procedure led to a substantial increase in the char yield. Further experiments and DTA-TGA-MS results have shown that the behavior of samples heated in air is different for the mixed char samples than for the single-component pellets. The presence of fiber facilitates the oxygen ingress and alters the mechanism of formation of the carbonaceous product by improving devolatilization.

Supplementary Materials

The following supporting information can be downloaded at: https://www.mdpi.com/article/10.3390/en15093072/s1, Table S1: Approved Green Bin materials; Table S2: Items Not Accepted in the Green Bin; Figure S1: ATR-FTIR spectra of three pieces of plastic A, C and E water washed and the same pieces: B, D, and F, respectively, after cleaning with ethanol.

Author Contributions

Conceptualization, D.W.K. and E.M.I.; methodology, D.W.K. and E.M.I. validation, D.W.K. and E.M.I.; formal analysis D.W.K. and E.M.I.; investigation, D.W.K. and E.M.I.; resources, D.W.K.; data curation, D.W.K. and E.M.I.; writing—original draft preparation, D.W.K. and E.M.I.; writing—review and editing, D.W.K. and E.M.I.; visualization, E.M.I.; funding acquisition, D.W.K. All authors have read and agreed to the published version of the manuscript.

Funding

This research was funded by the Natural Sciences and Engineering Research Council (NSERC) of Canada (grant number 505369).

Institutional Review Board Statement

Not applicable.

Informed Consent Statement

Not applicable.

Data Availability Statement

Not applicable.

Acknowledgments

The authors would like to thank Zbigniew Kaszkur from the Polish Academy of Sciences for performing the analysis of the X-ray diffraction patterns, Ilya Gourevich from the Centre for Nanostructure Imaging, University of Toronto, for acquiring images of the charred samples, and to Magdalena Zybert, Warsaw University of Technology, for performing the nitrogen physisorption studies. The authors are also grateful to Diana Wati from Sheridan College and Michał Młotek from the Warsaw University of Technology for allowing us to perform ATR-FTIR measurements.

Conflicts of Interest

The authors declare no conflict of interest.

References

  1. Papari, S.; Bamdad, H.; Berruti, F. Pyrolytic Conversion of Plastic Waste to Value-Added Products and Fuels: A Review. Materials 2021, 14, 2586. [Google Scholar] [CrossRef] [PubMed]
  2. Demirbas, A. Pyrolysis of municipal plastic wastes for recovery of gasoline-range hydrocarbons. J. Anal. Appl. Pyrolysis 2004, 72, 97–102. [Google Scholar] [CrossRef]
  3. Song, M.; Tang, M.; Lv, S.; Wang, X.; Jin, B.; Zhong, Z.; Huang, Y. The pyrolysis of multi-component municipal solid waste in fixed bed reactor for activated carbon production. J. Anal. Appl. Pyrolysis 2014, 109, 278–282. [Google Scholar] [CrossRef]
  4. Pinto, F.; Costa, P.; Gulyurtlu, I.; Cabrit, I. Pyrolysis of plastic wastes. 1. Effect of plastic waste composition on product yield. J. Anal. Appl. Pyrolysis 1999, 51, 39–55. [Google Scholar] [CrossRef]
  5. Milne, B.J.; Behie, L.A.; Berruti, F. Recycling of waste plastics by ultrapyrolysis using an internally circulating fluidized bed reactor. J. Anal. Appl. Pyrolysis 1999, 51, 157–166. [Google Scholar] [CrossRef]
  6. Anuar Sharuddin, S.D.; Abnisa, F.; Wan Daud, W.M.A.; Aroua, M.K. Energy recovery from pyrolysis of plastic waste: Study on non-recycled plastics (NRP) data as the real measure of plastic waste. Energy Convers. Manag. 2017, 148, 925–934. [Google Scholar] [CrossRef]
  7. Qureshi, M.S.; Oasmaa, A.; Pihkola, H.; Deviatkin, I.; Tenhunen, A.; Mannila, J.; Minkkinen, H.; Pohjakallio, M.; Laine-Ylijoki, J. Pyrolysis of plastic waste: Opportunities and challenges. J. Anal. Appl. Pyrolysis 2020, 152, 104804. [Google Scholar] [CrossRef]
  8. Ates, F.; Miskolczi, N.; Borsodi, N. Comparison of real waste (MSW and MPW) pyrolysis in batch reactor over different catalysts. Part I: Production yields, gas and pyrolysis oil properties. Bioresour. Technol. 2013, 133, 443–454. [Google Scholar] [CrossRef]
  9. Bary, A.I.; Cogger, C.G.; Sullivan, D.M.; Myhre, E.A. Characterization of fresh yard trimmings for agricultural use. Bioresour. Technol. 2005, 96, 1499–1504. [Google Scholar] [CrossRef]
  10. Boldrin, A.; Andersen, J.K.; Moller, J.; Christensen, T.H.; Favoino, E. Composting and compost utilization: Accounting of greenhouse gases and global warming contributions. Waste Manag. Res. 2009, 27, 800–812. [Google Scholar] [CrossRef] [Green Version]
  11. Akinbile, C.O.; Suffian, Y.M. Solid waste generation and decomposition using compost bin technique in Pulau Pinang, Malaysia. Waste Manag. Res. 2012, 30, 498–505. [Google Scholar] [CrossRef] [PubMed]
  12. Ding, Y.; Liu, Y.; Liu, S.; Huang, X.; Li, Z.; Tan, X.; Zeng, G.; Zhou, L. Potential Benefits of Biochar in Agricultural Soils: A Review. Pedosphere 2017, 27, 645–661. [Google Scholar] [CrossRef]
  13. Almeida, D.; Marques, M.D.F. Thermal and catalytic pyrolysis of plastic waste. Polímeros 2016, 26, 44–51. [Google Scholar] [CrossRef]
  14. Chen, R.; Zhang, S.; Yang, X.; Li, G.; Zhou, H.; Li, Q.; Zhang, Y. Thermal behaviour and kinetic study of co-pyrolysis of microalgae with different plastics. Waste Manag. 2021, 126, 331–339. [Google Scholar] [CrossRef] [PubMed]
  15. Czajczyńska, D.; Anguilano, L.; Ghazal, H.; Krzyżyńska, R.; Reynolds, A.J.; Spencer, N.; Jouhara, H. Potential of Pyrolysis Processes in the Waste Management Sector. Therm. Sci. Eng. Progress. 2017, 3, 171–197. [Google Scholar] [CrossRef]
  16. López, A.; Marco, D.I.; Caballero, B.M.; Laresgoiti, M.F.; Adrados, A. Pyrolysis of municipal plastic wastes: Influence of raw material composition. Waste Manag. 2010, 30, 620–627. [Google Scholar] [CrossRef]
  17. Miandad, R.; Barakat, M.A.; Aburiazaiza, A.S.; Rehan, M.; Nizami, A.S. Catalytic pyrolysis of plastic waste: A review. Process Saf. Environ. Prot. 2016, 102, 822–838. [Google Scholar] [CrossRef]
  18. Saeaung, K.; Phusunti, N.; Phetwarotai, W.; Assabumrungrat, S.; Cheirsilp, B. Catalytic pyrolysis of petroleum-based and biodegradable plastic waste to obtain high-value chemicals. Waste Manag. 2021, 127, 101–111. [Google Scholar] [CrossRef]
  19. Zhang, J.; Gu, J.; Yuan, H.; Chen, Y. Catalytic fast pyrolysis of waste mixed cloth for the production of value-added chemicals. Waste Manag. 2021, 127, 141–146. [Google Scholar] [CrossRef]
  20. Chen, S.; Liu, Z.; Jiang, S.; Hou, H. Carbonization: A feasible route for reutilization of plastic wastes. Sci. Tot. Environ. 2020, 710, 136250. [Google Scholar] [CrossRef]
  21. Bagreev, A.; Bandosz, T.J.; Locke, D.C. Pore structure and surface chemistry of adsorbents obtained by pyrolysis of sewage sludge derived fertilizer. Carbon 2001, 39, 1971–1979. [Google Scholar] [CrossRef]
  22. Chiang, P.C.; You, J.H. Use of sewage sludge for manufacturing adsorbents. Can. J. Chem. Eng. 1987, 65, 922–927. [Google Scholar] [CrossRef]
  23. Lu, G.Q.; Low, J.C.F.; Liu, C.Y.; Lua, A.C. Surface area development of sewage sludge during pyrolysis. Fuel 1995, 74, 344–348. [Google Scholar] [CrossRef]
  24. Rio, S.; Faur-Brasquet, C.; le Coq, L.; le Cloirec, P. Structure Characterization and Adsorption Properties of Pyrolyzed Sewage Sludge. Environ. Sci. Technol. 2005, 39, 4249–4257. [Google Scholar] [CrossRef] [PubMed]
  25. Rasaq, W.A.; Golonka, M.; Scholz, M.; Białowiec, A. Opportunities and Challenges of High-Pressure Fast Pyrolysis of Biomass: A Review. Energies 2021, 14, 5426. [Google Scholar] [CrossRef]
  26. Wądrzyk, M.; Plata, M.; Zaborowska, K.; Janus, R.; Lewandowski, M. Py-GC-MS Study on Catalytic Pyrolysis of Biocrude Obtained via HTL of Fruit Pomace. Energies 2021, 14, 7288. [Google Scholar] [CrossRef]
  27. Grzywacz, P.; Czerski, G.; Gańczarczyk, W. Effect of Pyrolysis Atmosphere on the Gasification of Waste Tire Char. Energies 2022, 15, 34. [Google Scholar] [CrossRef]
  28. Hu, H.; Gao, L.; Chen, C.; Chen, Q. Low-Cost, Acid/Alkaline-Resistant, and Fluorine-Free Superhydrophobic Fabric Coating from Onionlike Carbon Microspheres Converted from Waste Polyethylene Terephthalate. Environ. Sci. Technol. 2014, 48, 2928–2933. [Google Scholar] [CrossRef]
  29. Pol, S.V.; Pol, V.G.; Sherman, M.D.; Gedanken, A.S. A solvent free process for the generation of strong, conducting carbon spheres by the thermal degradation of waste polyethylene terephthalate. Green Chem. 2009, 11, 448–451. [Google Scholar] [CrossRef]
  30. Wei, L.Z.; Yan, N.; Chen, Q.W. Converting Poly(ethylene terephthalate) waste into carbon microspheres in a supercritical CO2 system. Environ. Sci. Technol. 2011, 45, 534–539. [Google Scholar] [CrossRef]
  31. Grieco, E.M.; Baldi, G. Pyrolysis of polyethylene mixed with paper and wood: Interaction effects on tar, char and gas yields. Waste Manag. 2012, 32, 833–839. [Google Scholar] [CrossRef] [PubMed]
  32. Zhang, X.; Lei, H.; Chen, S.; Wu, J. Catalytic co-pyrolysis of lignocellulosic biomass with polymers: A critical review. Green Chem. 2016, 18, 4145–4169. [Google Scholar] [CrossRef]
  33. Boateng, A.A.; Hicks, K.B.; Vogel, K.P. Pyrolysis of switchgrass (Panicum virgatum) harvested at several stages of maturity. J. Anal. Appl. Pyrolysis 2006, 75, 55–64. [Google Scholar] [CrossRef] [Green Version]
  34. Iwanek, E.; Gliński, M. Application of thermal analysis in determining properties of herbaceous materials. J. Chem. Edu. 2018, 95, 1359–1364. [Google Scholar] [CrossRef]
  35. Di Blasi, C.; Signorelli, G.; Di Russo, C.; Rea, G. Product Distribution from Pyrolysis of Wood and Agricultural Residues. Ind. Eng. Chem. Res. 1999, 38, 2216–2224. [Google Scholar] [CrossRef]
  36. Mohan, D.; Pittman, C.U.; Steele, P.H. Pyrolysis of Wood/Biomass for Bio-oil: A Critical Review. Energy Fuels 2006, 20, 848–889. [Google Scholar] [CrossRef]
  37. McNamara, P.J.; Koch, J.D.; Liu, Z.; Zitomer, D.H. Pyrolysis of Dried Biosolids Can Be Energy Positive. Water Environ. Res. 2016, 88, 804–810. [Google Scholar] [CrossRef] [PubMed] [Green Version]
  38. Liu, Z.; McNamara, P.; Zitomer, D. Autocatalytic pyrolysis of wastewater biosolids for product upgrading. Environ. Sci. Technol. 2017, 51, 9808–9816. [Google Scholar] [CrossRef] [Green Version]
  39. Ribeiro, J.M.C.; Godina, R.; Oliveira Matias, J.C.; Ribeiro Nunes, L.J. Future Perspectives of Biomass Torrefaction: Review of the Current State-Of-The-Art and Research Development. Sustainability 2018, 10, 2323. [Google Scholar] [CrossRef] [Green Version]
  40. Asensio, R.C.; San Andrés Moya, M.; de la Roja, J.M.; Gómez, M. Analytical characterization of polymers used in conservation and restoration by ATR-FTIR spectroscopy. Anal. Bioanal. Chem. 2009, 395, 2081–2096. [Google Scholar] [CrossRef]
  41. Lenz, R.; Enders, K.; Stedmon, C.A.; Mackenzie, D.M.A.; Nielsen, T.G. A critical assessment of visual identification of marine microplastic using Raman spectroscopy for analysis improvement. Mar. Pollut. Bull. 2015, 100, 82–91. [Google Scholar] [CrossRef] [PubMed]
  42. Nor, N.H.M.; Obbard, J.P. Microplastics in Singapore’s coastal mangrove ecosystems. Mar. Pollut. Bull. 2014, 79, 278–283. [Google Scholar] [CrossRef] [PubMed]
  43. Käppler, A.; Fischer, M.; Scholz-Böttcher, B.M.; Oberbeckmann, S.; Labrenz, M.; Fischer, D.; Eichhorn, K.-J.; Voit, B. Comparison of μ-ATR-FTIR spectroscopy and py-GCMS as identification tools for microplastic particles and fibers isolated from river sediments. Anal. Bioanal. Chem. 2018, 410, 5313–5327. [Google Scholar] [CrossRef] [PubMed]
  44. Korez, Š.; Gutow, L.; Saborowski, R. Microplastics at the strandlines of Slovenian beaches. Mar. Pollut. Bull. 2019, 145, 334–342. [Google Scholar] [CrossRef]
  45. Veerasingam, S.; Ranjani, M.; Venkatachalapathy, R.; Bagaev, A.; Mukhanov, V.; Litvinyuk, D.; Mugilarasane, M.; Gurumoorthi, K.; Guganathan, L.; Aboobackera, V.M.; et al. Contributions of Fourier transform infrared spectroscopy in microplastic pollution research: A review. Critic. Rev. Environ. Sci. Technol. 2020, 50, 1–64. [Google Scholar] [CrossRef]
  46. Strain, I.N.; Wu, Q.; Pourrahimi, A.M.; Hedenqvist, M.S.; Olsson, R.T.; Andersson, R.L. Electrospinning of recycled PET to generate tough mesomorphic fibre membranes for smoke filtration. J. Mater. Chem. A 2015, 3, 1632–1640. [Google Scholar] [CrossRef] [Green Version]
  47. Signoret, C.; Edo, M.; Caro-Bretelle, A.-S.; Lopez-Cuesta, J.-M.; Ienny, P.; Perrin, D. MIR spectral characterization of plastic to enable discrimination in an industrial recycling context: III. Anticipating impacts of ageing on identification. Waste Manag. 2020, 109, 51–64. [Google Scholar] [CrossRef]
  48. Choi, D.; Jang, D.; Joh, H.-I.; Reichmanis, E.; Lee, S. High performance graphitic carbon from waste polyethylene: Thermal oxidation as a stabilization pathway revisited. Chem. Mater. 2017, 29, 9518–9527. [Google Scholar] [CrossRef]
  49. Choi, D.; Yeo, J.S.; Joh, H.I.; Lee, S. Carbon nanosheet from polyethylene thin film as a transparent conducting film: “Upcycling” of waste to organic photovoltaics application. ACS Sustain. Chem. Eng. 2018, 6, 12463–12470. [Google Scholar] [CrossRef]
  50. Smith, M.W.; Pecha, B.; Helms, G.; Scudiero, L.; Garcia-Perez, M. Chemical and morphological evaluation of chars produced from primary biomass constituents: Cellulose, xylan, and lignin. Biomass Bioenergy 2017, 104, 17–35. [Google Scholar] [CrossRef]
  51. Szwaja, S.; Poskart, A.; Zajemska, M. A new approach for evaluating biochar quality from Virginia Mallow biomass thermal processing. J. Clean. Prod. 2018, 214, 356–364. [Google Scholar] [CrossRef]
  52. Morais, J.A.; Gadioli, R.; Paoli, M.-A. Curaua fiber reinforced high-density polyethylene composites: Effect of impact modifier and fiber loading. Polímeros 2016, 26, 115–122. [Google Scholar] [CrossRef] [Green Version]
  53. Blazsó, M. Recent trends in analytical and applied pyrolysis of polymers. J. Anal. Appl. Pyrolysis 1997, 39, 1–25. [Google Scholar] [CrossRef]
  54. Manyà, J.J. Pyrolysis for Biochar Purposes: A Review to Establish Current Knowledge Gaps and Research Needs. Environ. Sci. Technol. 2012, 46, 7939–7954. [Google Scholar] [CrossRef]
Figure 1. Two parts of the green bin reject stream: (A) pieces of plastic bags, wrappers and rigid plastic pieces, and (B) fabrics/fibers and food scraps, (C) dry fiber and its ATR-FTIR spectra.
Energies 15 03072 g001
Figure 2. ATR-FTIR spectra of reference standards (black curves) and commercial plastic products (blue curves) of (A) polyethylene and (B) polypropylene.
Energies 15 03072 g002
Figure 3. As-obtained ATR-FTIR spectra and images (inserts) of the corresponding pieces of: (A) PE, (B) PET, (C) PBAT, (D) PP, (E) PS, and (F) the overall composition of the plastic waste.
Energies 15 03072 g003
Figure 4. SEM images of char at magnifications of 500-times obtained from: (A) a fiber pellet, (B) a polyfilm pellet, (C) a mixed pellet, and (D) an image of the whole pellet (mixed).
Energies 15 03072 g004
Figure 5. ATR-FTIR spectra of chars (A) poly, (B) fiber, (C) mixed, as received (left) and after thermal treatment to 850 °C (right).
Energies 15 03072 g005
Figure 6. DTA-TGA results of chars (A) poly, (B) fiber, (C) mixed, in argon (left) and in air (right). Points 1, 3—onset of mass loss of mixed char; 2, 4—end of mass loss of mixed char.
Energies 15 03072 g006
Figure 7. MS data for thermal analysis experiments: (A) water, (B) CO, and (C) CO2, in argon (left) and in air (right); temperature (dashed line).
Energies 15 03072 g007
Figure 8. Thermal analysis measurement results: (A) DTA curves and (B) MS data: m/z = 18 (blue curve) and 44 (black curve) of a mixed raw pellet heated in argon (left panel) and air (right panel); inserts: images of the char inside TGA crucibles.
Energies 15 03072 g008
Figure 9. Ash composition determination: (A) ATR-FTIR spectrum of ash, and (B) XRD pattern of fiber char after thermal treatment.
Energies 15 03072 g009
Publisher’s Note: MDPI stays neutral with regard to jurisdictional claims in published maps and institutional affiliations.