
Analyzing Wind Energy Potential Using Efficient Global Optimization: A Case Study for the City Gdańsk in Poland


Abstract
:1. Introduction
2. Development of the WE Market in Poland
2.1. WE: A Brief History
2.2. WE in Poland and Pomerania Voivodeship
2.3. WE in the Pomerania Voivodeship
3. Methodology
3.1. Parameter Estimation for Distribution of WS
3.2. Estimating Parameters of WD Using MLE
3.3. EGO
4. Data
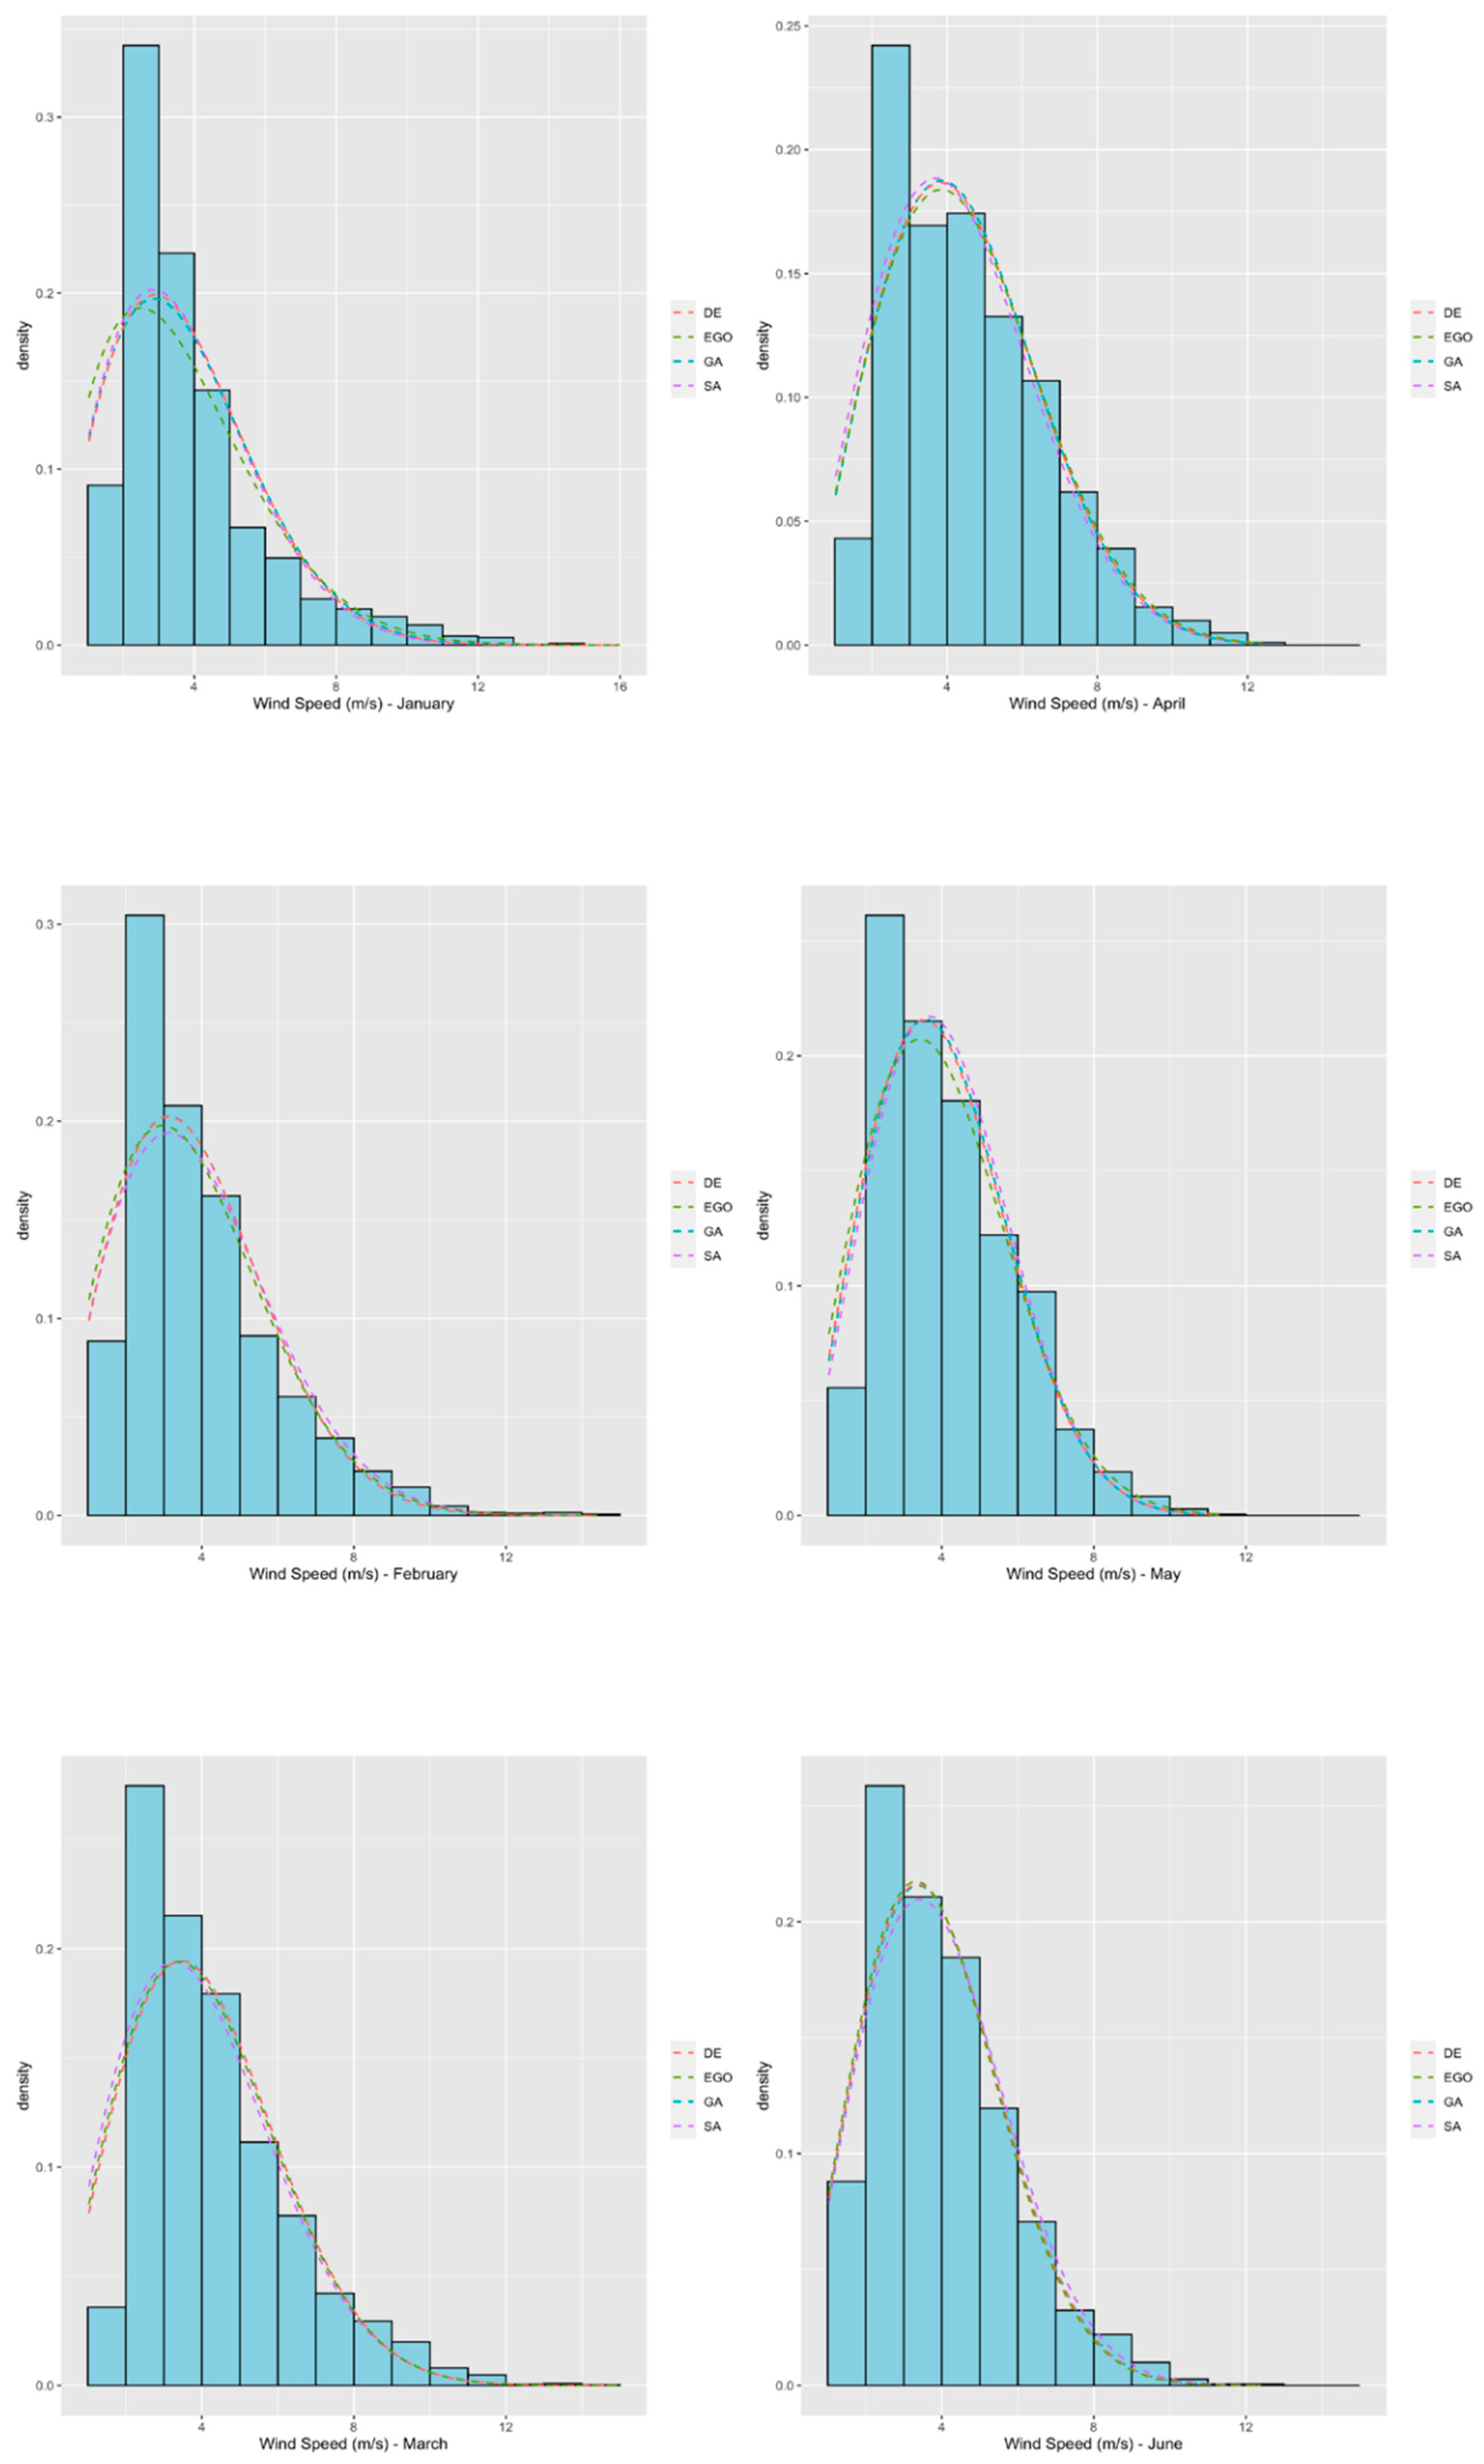
5. Results
6. Conclusions and Recommendations
Author Contributions
Funding
Institutional Review Board Statement
Informed Consent Statement
Data Availability Statement
Conflicts of Interest
References
- Lin, M.-X.; Liou, H.M.; Chou, K.T. National Energy Transition Framework toward SDG7 with Legal Reforms and Policy Bundles: The Case of Taiwan and Its Comparison with Japan. Energies 2020, 13, 1387. [Google Scholar] [CrossRef] [Green Version]
- Pietrzak, M.B.; Igliński, B.; Kujawski, W.; Iwański, P. Energy transition in Poland—Assessment of the renewable energy sector. Energies 2021, 14, 2046. [Google Scholar] [CrossRef]
- Strunz, S. The German energy transition as a regime shift. Ecol. Econ. 2014, 100, 150–158. [Google Scholar] [CrossRef] [Green Version]
- Bednarczyk, J.L.; Brzozowska-Rup, K.; Luściński, S. Determinants of the energy development based on renewable energy sources in Poland. Energies 2021, 14, 6762. [Google Scholar] [CrossRef]
- Janowski, M. Generacja wiatrowa w KSE—diagnoza funkcjonowania w latach 2010–2018. Elektroenerg. Współczesność I Rozw. 2019, 1, 18–24. [Google Scholar]
- Marks-Bielska, R.; Bielski, S.; Pik, K.; Kurowska, K. The importance of renewable energy sources in Poland’s energy mix. Energies 2020, 13, 4624. [Google Scholar] [CrossRef]
- Matuszewska-Janica, A.; Żebrowska-Suchodolska, D.; Ala-Karvia, U. Hozer-Koćmiel, M. Changes in electricity production from renewable energy sources in the European Union countries in 2005–2019. Energies 2021, 14, 6276. [Google Scholar] [CrossRef]
- Chovancová, J.; Tej, J. Decoupling economic growth from greenhouse gas emissions: The case of the energy sector in V4 countries. Equilib. Q. J. Econ. Econ. Policy 2020, 15, 235–251. [Google Scholar] [CrossRef]
- Grosse, T.G. Low Carbon Economy Policy in Poland: An Example of the Impact of Europeanisation. Equilib. Quart. J. Econ. Econ. Policy 2011, 6, 9–39. [Google Scholar] [CrossRef]
- Piekut, M. The Consumption of Renewable Energy Sources (RES) by the European Union Households between 2004 and 2019. Energies 2021, 14, 5560. [Google Scholar] [CrossRef]
- Henderson, J.; Anupama, S. The Energy Transition: Key Challenges for Incumbent and New Players in the Global Energy System, OIES Paper. Oxford Institute for Energy Studies. 2021. Available online: www.oxfordenergy.org/publications/the-energy-transition-key-challenges-for-incumbent-and-new-players-in-the-global-energy-system/ (accessed on 10 January 2022).
- United Nations. Theme Report on Energy Transition. Toward the Achievement of SDG7 and Net-Zero Emission. 2021. Available online: https://www.un.org/sites/un2.un.org/files/2021-twg_2–062321.pdf (accessed on 10 January 2022).
- Markandya, A.; Arto, I.; González-Eguino, M.; Román, M.V. Towards a green energy economy? Tracking the employment effects of low-carbon technologies in the European Union. Appl. Energy 2016, 179, 1342–1350. [Google Scholar] [CrossRef] [Green Version]
- Gielen, D.; Boshell, F.; Saygin, D.; Bazilian, M.D.; Wagner, N.; Gorini, R. The role of renewable energy in the global energy transformation. Energy Strat. Rev. 2019, 24, 38–50. [Google Scholar] [CrossRef]
- Ellabban, O.; Abu-Rub, H.; Blaabjerg, F. Renewable energy resources: Current status, future prospects and their enabling technology. Renew. Sustain. Energy Rev. 2014, 39, 748–764. [Google Scholar] [CrossRef]
- Balcerzak, A.P. Quality of Institutions in the European Union countries. Application of TOPSIS Based on Entropy Measure for Objective Weighting. Acta Polytech. Hung. 2020, 17, 101–122. [Google Scholar] [CrossRef]
- Overland, I. Energy: The missing link in globalization. Energy Res. Soc. Sci. 2016, 14, 122–130. [Google Scholar] [CrossRef] [Green Version]
- Rees, W.E. Globalization, trade and migration: Undermining sustainability. Ecol. Econ. 2006, 59, 220–225. [Google Scholar] [CrossRef]
- Dreher, A. Does globalization affect growth? Evidence from a new index of globalization. Appl. Econ. 2006, 38, 1091–1110. [Google Scholar] [CrossRef] [Green Version]
- Sánchez-López, C.; Aceytuno, M.T.; De Paz-Bañez, M.A. Inequality and globalisation: Analysis of European countries. Econ. Sociol. 2019, 4, 84–100. [Google Scholar] [CrossRef]
- Simionescu, M.; Lazányi, K.; Sopková, G.; Dobeš, K.; Balcerzak, A.P. University of Economics in Bratislava Determinants of Economic Growth in V4 Countries and Romania. J. Compet. 2017, 9, 103–116. [Google Scholar] [CrossRef] [Green Version]
- Skare, M.; Porada-Rochoń, M. Financial and economic development link in transitional economies: A spectral Granger causality analysis 1991–2017. Oecon. Copernic. 2019, 10, 7–35. [Google Scholar] [CrossRef]
- Ginevičius, R. Multi-criteria assessment of socioeconomic systems’ conditions based on hierarchically structured indicator systems. Econ. Sociol. 2020, 13, 256–266. [Google Scholar] [CrossRef] [PubMed]
- Zinecker, M.; Doubravský, K.; Balcerzak, A.P.; Pietrzak, M.B.; Dohnal, M. The COVID-19 disease and policy response to mitigate the economic impact in the EU: An exploratory study based on qualitative trend analysis. Technol. Econ. Dev. Econ. 2021, 27, 742–762. [Google Scholar] [CrossRef]
- Roszko-Wójtowicz, E.; Grzelak, M.M. Macroeconomic stability and the level of competitiveness in EU member states: A comparative dynamic approach. Oecon. Copernic. 2020, 11, 657–688. [Google Scholar] [CrossRef]
- Prokop, V.; Kotkova Striteska, M.; Stejskal, J. Fostering Czech firms? innovation performance through efficient cooperation. Oecon. Copernic. 2021, 12, 671–700. [Google Scholar] [CrossRef]
- Markauskas, M.; Baliute, A. Technological progress spillover effect in Lithuanian manufacturing industry. Equilib. Q. J. Econ. Econ. Policy 2021, 16, 783–806. [Google Scholar] [CrossRef]
- Androniceanu, A.-M.; Kinnunen, J.; Georgescu, I.; Androniceanu, A. A Multidimensional Approach to Competitiveness, Innovation and Well-Being in the EU Using Canonical Correlation Analysis. J. Compet. 2020, 12, 5–21. [Google Scholar] [CrossRef]
- Cheba, K.; Szopik-Depczyńska, K. Multidimensional comparative analysis of the competitive capacity of the European Union countries and geographical regions. Oecon. Copernic. 2017, 8, 487–504. [Google Scholar] [CrossRef] [Green Version]
- Nowak, P. Cooperation of enterprises in innovative activities on the example of Polish regions. Equilib. Q. J. Econ. Econ. Policy 2021, 16, 839–857. [Google Scholar] [CrossRef]
- Jankiewicz, M.; Pietrzak, M.B. Assesment of Trends in the Share of Expenditure on Services and Food in the Visegrad Group Member States. Int. J. Bus. Soc. 2020, 21, 977–996. [Google Scholar] [CrossRef]
- Piekut, M. Patterns of Energy Consumption in Polish One-Person Households. Energies 2020, 13, 5699. [Google Scholar] [CrossRef]
- Zadykowicz, A.; Chmielewski, K.J.; Siemieniako, D. Proactive customer orientation and joint learning capabilities in collaborative machine to machine innovation technology development: The case study of automotive equipment manufacturer. Oecon. Copernic. 2020, 11, 531–547. [Google Scholar] [CrossRef]
- Wosiek, M. Unemployment and new firm formation: Evidence from Polish industries at the regional level. Equilib. Q. J. Econ. Econ. Policy 2021, 16, 765–782. [Google Scholar] [CrossRef]
- Fragkos, P.; Paroussos, L. Employment creation in EU related to renewables expansion. Appl. Energy 2018, 230, 935–945. [Google Scholar] [CrossRef]
- Gajdos, A.; Arendt, L.; Balcerzak, A.P.; Pietrzak, M.B. Future trends of labour market polarisation in Poland—The perspective of 2025. Transform. Bus. Econ. 2020, 3, 114–135. [Google Scholar]
- Dmytrów, K.; Bieszk-Stolorz, B. Comparison of changes in the labour markets of post-communist countries with other EU member states. Equilib. Q. J. Econ. Econ. Policy 2021, 16, 741–764. [Google Scholar] [CrossRef]
- Pietrzak, M.B.; Balcerzak, A.P.; Gajdos, A.; Arendt, Ł. Entrepreneurial environment at regional level: The case of Polish path towards sustainable socio-economic development. Entrep. Sustain. Issues 2017, 5, 190–203. [Google Scholar] [CrossRef] [Green Version]
- Svabova, L.; Tesarova, E.N.; Durica, M.; Strakova, L. Evaluation of the impacts of the COVID-19 pandemic on the development of the unemployment rate in Slovakia: Counterfactual before-after comparison. Equilib. Q. J. Econ. Econ. Policy 2021, 16, 261–284. [Google Scholar] [CrossRef]
- European Commission. The European Green Deal. 2019. Available online: https://eur-lex.europa.eu/legal-content/EN/TXT/?uri=COM%3A2019%3A640%3AFIN (accessed on 10 January 2022).
- Zielenkiewicz, M. Institutional Environment in the Context of Development of Sustainable Society in the European Union Countries. Equilib. Quart. J. Econ. Econ. Policy 2014, 9, 21–38. [Google Scholar] [CrossRef]
- Szopik-Depczynska, K.; Cheba, K.; Bąk, I.; Stajniak, M.; Simboli, A.; Ioppolo, G. The study of relationship in a hierarchical structure of EU sustainable development indicators. Ecol. Indic. 2018, 90, 120–131. [Google Scholar] [CrossRef]
- Szopik-Depczynska, K.; Kędzierska-Szczepaniak, A.; Szczepaniak, K.; Cheba, K.; Gajda, W.; Ioppolo, G. Innovation in sustainable development: An investigation of the EU context using 2030 agenda indicators. Land Use Policy 2018, 79, 251–262. [Google Scholar] [CrossRef]
- Carley, S.; Konisky, D.M. The justice and equity implications of the clean energy transition. Nat. Energy 2020, 5, 569–577. [Google Scholar] [CrossRef]
- Available online: www.ure.gov.pl/pl/oze/potencjal-krajowy-oze/5753,Moc-zainstalowana-MW.html (accessed on 15 September 2021).
- REN21. Renewables 2021: Global Status Report; REN21: Paris, France, 2021. [Google Scholar]
- Olabi, A.G.; Wilberforce, T.; Elsaid, K.; Salameh, T.; Sayed, E.T.; Husain, K.S.; Abdelkareem, M.A. Selection Guidelines for Wind Energy Technologies. Energies 2021, 14, 3244. [Google Scholar] [CrossRef]
- Igliński, B.; Iglińska, A.; Koziński, G.; Skrzatek, M.; Buczkowski, R. Wind energy in Poland—History, current state, surveys, renewable energy sources Act, SWOT analysis. Renew. Sustain. Energy Rev. 2016, 64, 19–33. [Google Scholar] [CrossRef]
- Ustawa z Dnia 20 Maja 2016 r. o Inwestycjach w Zakresie Elektrowni Wiatrowych, Dz.U. poz. 961. 2016. Available online: https://isap.sejm.gov.pl/isap.nsf/DocDetails.xsp?id=WDU20160000961 (accessed on 25 October 2021).
- Wyrobek, J.; Popławski, Ł.; Dzikuć, M. Analysis of financial problems of wind farms in Poland. Energies 2021, 14, 1239. [Google Scholar] [CrossRef]
- Available online: www.ure.gov.pl/pl/sekcja/456,Odnawialne-Zrodla-Energii.html (accessed on 17 September 2021).
- Carta, J.A.; Ramirez, P.; Velazquez, S. A review of wind speed probability distributions used in wind energy analysis: Case studies in the Canary Islands. Renew. Sustain. Energy Rev. 2009, 13, 933–955. [Google Scholar] [CrossRef]
- Polish Wind Energy Association Official Web Page. Available online: http://psew.pl/en (accessed on 24 September 2021).
- PSEW. Wkład Krajowych Dostawców w Rozwój Energetyki Wiatrowej na Lądzie i jej Wpływ na Polski Rynek Pracy do 2040 r. 2019. Available online: http://psew.pl/wp-content/uploads/2019/06/Analiza-WiseEuropa-Wp%C5%82yw-energetyki-wiatrowej-na-l%C4%85dzie-na-gospodark%C4%99-Polski.pdf (accessed on 10 October 2021).
- Institute of Meteorology and Water Management: Warszawa, Poland, 2021; unpublished work.
- Li, G.; Shi, J. Application of Bayesian model averaging in modeling long-term wind speed distributions. Renew. Energy 2010, 35, 1192–1202. [Google Scholar] [CrossRef]
- Available online: https://zbkiks.ug.edu.pl/mk/kistowski_b_2_4.pdf (accessed on 11 October 2021).
- Igliński, B.; Kiełkowska, U.; Pietrzak, M.B.; Skrzatek, M. Energia Odnawialna w Województwie Pomorskim; Nicolaus Copernicus University: Toruń, Poland, 2021. [Google Scholar]
- Celik, A.N. A statistical analysis of wind power density based on the Weibull and Rayleigh models at the southern region of Turkey. Renew. Energy 2004, 29, 593–604. [Google Scholar] [CrossRef]
- Elmahdy, E.E.; Aboutahoun, A.W. A new approach for parameter estimation of finite Weibull mixture distributions for reliability modeling. Appl. Mathem. Model. 2013, 37, 1800–1810. [Google Scholar] [CrossRef]
- Mathew, S. Wind Energy: Fundamentals, Resource Analysis and Economics; Springer: Berlin/Heidelberg, Germany, 2006; Volume 1. [Google Scholar]
- Akdag, S.A.; Dinler, A. A new method to estimate Weibull parameters for wind energy applications. Energy Convers. Manag. 2009, 50, 1761–1766. [Google Scholar] [CrossRef]
- Stevens, M.J.M.; Smulders, P.T. The estimation of the parameters of the Weibull wind speed distribution for wind energy utilization purposes. Wind Eng. 1979, 3, 132–145. [Google Scholar]
- Justus, C.; Hargraves, W.; Mikhail, A.; Graber, D. Methods for estimating wind speed frequency distributions. J. Appl. Meteorol. 1978, 17, 350–353. [Google Scholar] [CrossRef]
- Jowder, F.A. Wind power analysis and site matching of wind turbine generators in Kingdom of Bahrain. Appl. Energy 2009, 86, 538–545. [Google Scholar] [CrossRef]
- George, F. A comparison of shape and scale estimators of the two-parameter Weibull distribution. J. Modern Appl. Stat. Methods 2014, 13, 3. [Google Scholar] [CrossRef] [Green Version]
- Chang, T.P. Performance comparison of six numerical methods in estimating Weibull parameters for wind energy application. Appl. Energy 2011, 88, 272–282. [Google Scholar] [CrossRef]
- Chang, T.P. Wind energy assessment incorporating particle swarm optimization method. Energy Convers. Manag. 2011, 52, 1630–1637. [Google Scholar] [CrossRef]
- Rocha, P.A.C.; De Sousa, R.C.; De Andrade, C.F.; da Silva, M.E.V. Comparison of seven numerical methods for determining Weibull parameters for wind energy generation in the northeast region of Brazil. Appl. Energy 2012, 89, 395–400. [Google Scholar] [CrossRef]
- Arslan, T.; Bulut, Y.M.; Yavuz, A.A. Comparative study of numerical methods for determining Weibull parameters for wind energy potential. Renew. Sustain. Energy Rev. 2014, 40, 820–825. [Google Scholar] [CrossRef]
- Usta, I. An innovative estimation method regarding Weibull parameters for wind energy applications. Energy 2016, 106, 301–314. [Google Scholar] [CrossRef]
- Wu, J.; Wang, J.; Chi, D. Wind energy potential assessment for the site of Inner Mongolia in China. Renew. Sustain. Energy Rev. 2013, 21, 215–228. [Google Scholar] [CrossRef]
- Usta, I.; Arik, I.; Yenilmez, I.; Kantar, Y.M. A new estimation approach based on moments for estimating Weibull parameters in wind power applications. Energy Convers. Manag. 2018, 164, 570–578. [Google Scholar] [CrossRef]
- Tosunoglu, F. Accurate estimation of T year extreme wind speeds by considering different model selection criterions and different parameter estimation methods. Energy 2018, 162, 813–824. [Google Scholar] [CrossRef]
- Chaurasiya, P.K.; Ahmed, S.; Warudkar, V. Study of different parameters estimation methods of Weibull distribution to determine wind power density using ground based Doppler SODAR instrument. Alex. Eng. J. 2018, 57, 2299–2311. [Google Scholar] [CrossRef]
- Seo, S.; Oh, S.D.; Kwak, H.Y. Wind turbine power curve modeling using maximum likelihood estimation method. Renew. Energy 2019, 136, 1164–1169. [Google Scholar] [CrossRef]
- Alrashidi, M.; Rahman, S.; Pipattanasomporn, M. Metaheuristic optimization algorithms to estimate statistical distribution parameters for characterizing wind speeds. Renew. Energy 2020, 149, 664–681. [Google Scholar] [CrossRef]
- Guedes, K.S.; De Andrade, C.F.; Rocha, P.A.; Mangueira, R.S.; Moura, E.P. Performance analysis of metaheuristic optimization algorithms in estimating the parameters of several wind speed distributions. Appl. Energy 2020, 268, 114952. [Google Scholar] [CrossRef]
- Gungor, A.; Gokcek, M.; Uçar, H.; Arabacı, E.; Akyüz, A. Analysis of wind energy potential and Weibull parameter estimation methods: A case study from Turkey. Int. J. Environ. Sci. Technol. 2020, 17, 1011–1020. [Google Scholar] [CrossRef]
- Kumar, R.; Kumar, A. Application of differential evolution for wind speed distribution parameters estimation. Wind Eng. 2021, 45, 1544–1556. [Google Scholar] [CrossRef]
- Aydin, L.; Aydin, O.; Artem, H.S.; Mert, A. Design of dimensionally stable composites using efficient global optimization method. Proc. Inst. Mech. Eng. Part L J. Mater. Des. Appl. 2019, 233, 156–168. [Google Scholar] [CrossRef]
- Open Weather Map. Available online: https://openweathermap.org (accessed on 24 October 2021).
- Roustant, O.; Ginsbourger, D.; Deville, Y. DiceKriging, DiceOptim: Two R Packages for the Analysis of Computer Experiments by Kriging-Based Metamodeling and Optimization. J. Stat. Softw. 2012, 51, 1–55. [Google Scholar] [CrossRef] [Green Version]
- Scrucca, L. GA: A Package for Genetic Algorithms in R. Journal of Statistical Software. Found. Open Access Stat. 2013, 53, 1–37. [Google Scholar] [CrossRef] [Green Version]
- Mullen, K.; Ardia, D.; Gil, D.L.; Windover, D.; Cline, J. DEoptim: An R package for global optimization by differential evolution. J. Stat. Softw. 2011, 40, 1–26. [Google Scholar] [CrossRef] [Green Version]
- Husmann, K.; Lange, A.; Spiegel, E. The R Package Optimization: Flexible Global Optimization with Simulated-Annealing. 2017. Available online: https://cran.r-project.org/web/packages/optimization/vignettes/vignette_master.pdf (accessed on 12 March 2022).
- Gökçek, M.; Bayülken, A.; Bekdemir, Ş. Investigation of wind characteristics and wind energy potential in Kirklareli, Turkey. Renew. Energy 2007, 32, 1739–1752. [Google Scholar] [CrossRef]
- Saxena, B.K.; Rao, K.V.S. Estimation of wind power density at a wind farm site located in Western Rajasthan region of India. Procedia Technol. 2016, 24, 492–498. [Google Scholar] [CrossRef] [Green Version]
- WINDExchange: Small Wind Guidebook; Wind Exchange, 18 November 2021. Available online: https://windexchange.energy.gov/small-wind-guidebook (accessed on 12 September 2021).
- Royal Academy of Engineering. Wind Turbine Power Calculations. RWE Npower Renewables, Mechanical and Electrical Engineering Power Industry. 2010. Available online: https://www.raeng.org.uk/publications/other/23-wind-turbine (accessed on 10 November 2021).
- Ray, A. Performance Study of a Small Scale Wind Turbine; Pennsylvania State University: State College, PA, USA, 2014. [Google Scholar]
- Wind Power–Skystream 3.7 Specifications, Solardirect. Available online: https://www.solardirect.com/archives/wind-power/skystream/st-specifications.html (accessed on 15 January 2022).
- Cena Prądu w Polsce w 2021 Roku. Ile Kosztuje 1 kWh Energii Elektrycznej? Available online: www.rachuneo.pl/cena-pradu#cena-pradu-pge (accessed on 18 November 2021).
- Zinecker, M.; Skalická, M.; Balcerzak, A.P.; Pietrzak, M.B. Business angels in the Czech Republic: Characteristics and a classification with policy implications. Econ. Res.-Kenosha Istraživanja 2021, 16, 1–26. [Google Scholar] [CrossRef]
- Gorączkowska, J. Enterprise innovation in technology incubators and university business incubators in the context of Polish industry. Oecon. Copernic. 2020, 11, 799–817. [Google Scholar] [CrossRef]
- Zinecker, M.; Skalická, M.; Balcerzak, A.P.; Pietrzak, M.B. Identifying the impact of external environment on business angel activity. Econ. Res.-Ekonomska Istraživanja 2021, 12, 1–23. [Google Scholar] [CrossRef]
- Meluzín, T.; Zinecker, M.; Balcerzak, A.P.; Pietrzak, M.B.; Doubravský, K. Institutional Settings and their Impact on the IPO Activity: An Exploratory Study Based on Qualitative Modelling. Acta Polytech. Hung. 2021, 18, 215–235. [Google Scholar] [CrossRef]
- Meluzín, T.; Balcerzak, A.P.; Pietrzak, M.B.; Zinecker, M.; Doubravský, K. The impact of rumours related to political and macroeconomic uncertainty on IPO success: Evidence from a qualitative model. Transform. Bus. Econ. 2018, 2017, 148–169. [Google Scholar]
- Meluzín, T.; Zinecker, M.; Balcerzak, A.P.; Doubravský, K.; Pietrzak, M.B.; Dohnal, M. The timing of initial public offerings: Non-numerical model based on qualitative trends. J. Bus. Econ. Manag. 2018, 19, 63–79. [Google Scholar] [CrossRef] [Green Version]
- Meluzín, T.; Zinecker, M.; Balcerzak, A.P.; Pietrzak, M.B. Why do companies stay private? Determinants for IPO candidates to consider in Poland and the Czech Republic. East. Eur. Econ. 2018, 56, 471–503. [Google Scholar] [CrossRef]
- Oehlmann, M.; Meyerhoff, J. Stated preferences towards renewable energy alternatives in Germany–do the consequentiality of the survey and trust in institutions matter? J. Environ. Econ. Policy 2016, 1, 1–16. [Google Scholar] [CrossRef]
- Rogers, J.; Simmons, E.; Convery, I.; Weatherall, A. Public perceptions of community-based renewable energy projects. Energy Policy 2008, 36, 4217–4226. [Google Scholar] [CrossRef] [Green Version]
- Zoellner, J.; Schweizer-Ries, P.; Wemheuer, C. Public acceptance of renewable energies: Results from case studies in Germany. Energy Policy 2008, 36, 4136–4141. [Google Scholar] [CrossRef]


| Type of RE Installation | Installed Capacity [MW] | ||
|---|---|---|---|
| 2010 | 2015 | 2020 | |
| Biogas | 82.884 | 212.497 | 255.699 |
| Biomass | 356.190 | 1122.670 | 1512.885 |
| Photovoltaics | 0.033 | 71.031 | 887.434 |
| Wind Energy | 1180.044 | 4582.036 | 6347.111 |
| Hydropower | 937.044 | 981.799 | 976.047 |
| Total | 2556.423 | 6970.033 | 9979.176 |
| Year | Installed Capacity of Onshore Wind Installations [GW] |
|---|---|
| 2013 | 3.39 |
| 2014 | 3.83 |
| 2015 | 4.58 |
| 2016 | 5.81 |
| 2017 | 5.85 |
| 2018 | 5.86 |
| 2019 | 5.92 |
| 2020 | 6.35 |
| 2021 | ≈6.80 |
| Month | Average WS (m/s) | Min. Temperature (Average—Celciusº) | Max. Temperature (Average—Celciusº) |
|---|---|---|---|
| January | 2.72 | −1.21 | 1.94 |
| February | 2.87 | −0.58 | 2.77 |
| March | 3.15 | 2.33 | 5.39 |
| April | 3.51 | 6.15 | 9.61 |
| May | 3.17 | 10.66 | 14.39 |
| June | 3.02 | 15.65 | 19.24 |
| July | 3.12 | 16.76 | 19.96 |
| August | 2.38 | 17.17 | 20.85 |
| September | 2.68 | 13.29 | 16.52 |
| October | 2.77 | 8.29 | 11.25 |
| November | 2.83 | 4.27 | 6.86 |
| December | 3.19 | 1.86 | 4.48 |
| Month | SA | GA | DE | EGO | ||||
|---|---|---|---|---|---|---|---|---|
| k | c | k | c | k | c | k | c | |
| January | 1.93 | 4.15 | 1.91 | 4.23 | 1.93 | 4.21 | 1.72 | 4.11 |
| February | 2.00 | 4.42 | 2.06 | 4.32 | 2.06 | 4.33 | 1.96 | 4.28 |
| March | 2.06 | 4.51 | 2.15 | 4.64 | 2.15 | 4.64 | 2.12 | 4.60 |
| April | 2.20 | 4.86 | 2.26 | 4.98 | 2.24 | 4.98 | 2.22 | 5.02 |
| May | 2.44 | 4.56 | 2.38 | 4.50 | 2.36 | 4.48 | 2.23 | 4.46 |
| June | 2.25 | 4.44 | 2.27 | 4.35 | 2.27 | 4.34 | 2.26 | 4.31 |
| July | 2.31 | 4.35 | 2.30 | 4.35 | 2.30 | 4.35 | 2.32 | 4.31 |
| August | 2.48 | 3.64 | 2.53 | 3.78 | 2.53 | 3.78 | 2.59 | 3.70 |
| September | 2.41 | 4.04 | 2.24 | 4.13 | 2.26 | 4.13 | 2.17 | 4.09 |
| October | 2.02 | 4.25 | 2.00 | 4.25 | 2.00 | 4.22 | 1.72 | 4.11 |
| November | 2.09 | 3.86 | 2.21 | 3.96 | 2.11 | 3.91 | 2.04 | 3.94 |
| December | 2.24 | 4.45 | 2.13 | 4.28 | 2.13 | 4.28 | 2.09 | 4.27 |
| Month | SA | GA | DE | EGO | ||||
|---|---|---|---|---|---|---|---|---|
| RMSE | R2 | RMSE | R2 | RMSE | R2 | RMSE | R2 | |
| January | 0.6512 | 0.9022 | 0.6496 | 0.9027 | 0.6616 | 0.8990 | 0.6136 | 0.9132 |
| February | 0.4967 | 0.9373 | 0.5130 | 0.9331 | 0.5007 | 0.9363 | 0.4650 | 0.9451 |
| March | 0.4762 | 0.9451 | 0.5178 | 0.9350 | 0.4835 | 0.9434 | 0.4758 | 0.9452 |
| April | 0.3828 | 0.9667 | 0.3830 | 0.9667 | 0.3856 | 0.9662 | 0.3802 | 0.9671 |
| May | 0.3760 | 0.9560 | 0.3732 | 0.9566 | 0.3658 | 0.9583 | 0.3665 | 0.9582 |
| June | 0.3632 | 0.9592 | 0.3605 | 0.9598 | 0.3358 | 0.9651 | 0.3363 | 0.9650 |
| July | 0.3713 | 0.9567 | 0.3672 | 0.9577 | 0.3703 | 0.9570 | 0.3599 | 0.9594 |
| August | 0.4569 | 0.8925 | 0.4526 | 0.8945 | 0.4487 | 0.8963 | 0.4539 | 0.8939 |
| September | 0.4913 | 0.9182 | 0.4471 | 0.9323 | 0.4664 | 0.9263 | 0.4234 | 0.9392 |
| October | 0.6639 | 0.8896 | 0.6802 | 0.8841 | 0.6649 | 0.8893 | 0.6229 | 0.9028 |
| November | 0.5996 | 0.8805 | 0.6262 | 0.8697 | 0.5745 | 0.8903 | 0.5636 | 0.8945 |
| December | 0.6441 | 0.8830 | 0.6111 | 0.8946 | 0.5934 | 0.9007 | 0.5602 | 0.9115 |
| Parameters | Metrics | |||
|---|---|---|---|---|
| Technique | k | c | RMSE | R2 |
| SA | 2.16 | 4.40 | 0.501242 | 0.9300 |
| GA | 2.14 | 4.33 | 0.486022 | 0.9342 |
| DE | 2.15 | 4.33 | 0.482129 | 0.9352 |
| EGO | 2.05 | 4.25 | 0.465032 | 0.9397 |
Publisher’s Note: MDPI stays neutral with regard to jurisdictional claims in published maps and institutional affiliations. |
© 2022 by the authors. Licensee MDPI, Basel, Switzerland. This article is an open access article distributed under the terms and conditions of the Creative Commons Attribution (CC BY) license (https://creativecommons.org/licenses/by/4.0/).
Share and Cite
Aydin, O.; Igliński, B.; Krukowski, K.; Siemiński, M. Analyzing Wind Energy Potential Using Efficient Global Optimization: A Case Study for the City Gdańsk in Poland. Energies 2022, 15, 3159. https://doi.org/10.3390/en15093159
Aydin O, Igliński B, Krukowski K, Siemiński M. Analyzing Wind Energy Potential Using Efficient Global Optimization: A Case Study for the City Gdańsk in Poland. Energies. 2022; 15(9):3159. https://doi.org/10.3390/en15093159
Chicago/Turabian StyleAydin, Olgun, Bartłomiej Igliński, Krzysztof Krukowski, and Marek Siemiński. 2022. "Analyzing Wind Energy Potential Using Efficient Global Optimization: A Case Study for the City Gdańsk in Poland" Energies 15, no. 9: 3159. https://doi.org/10.3390/en15093159