
Comparison of Blind and Open Calculation Results for Top-Slot Break LOCA in Fourth ATLAS Domestic Standard Problem

 , ,
, ,
Abstract
:1. Introduction
2. ATLAS Facility and Test Description
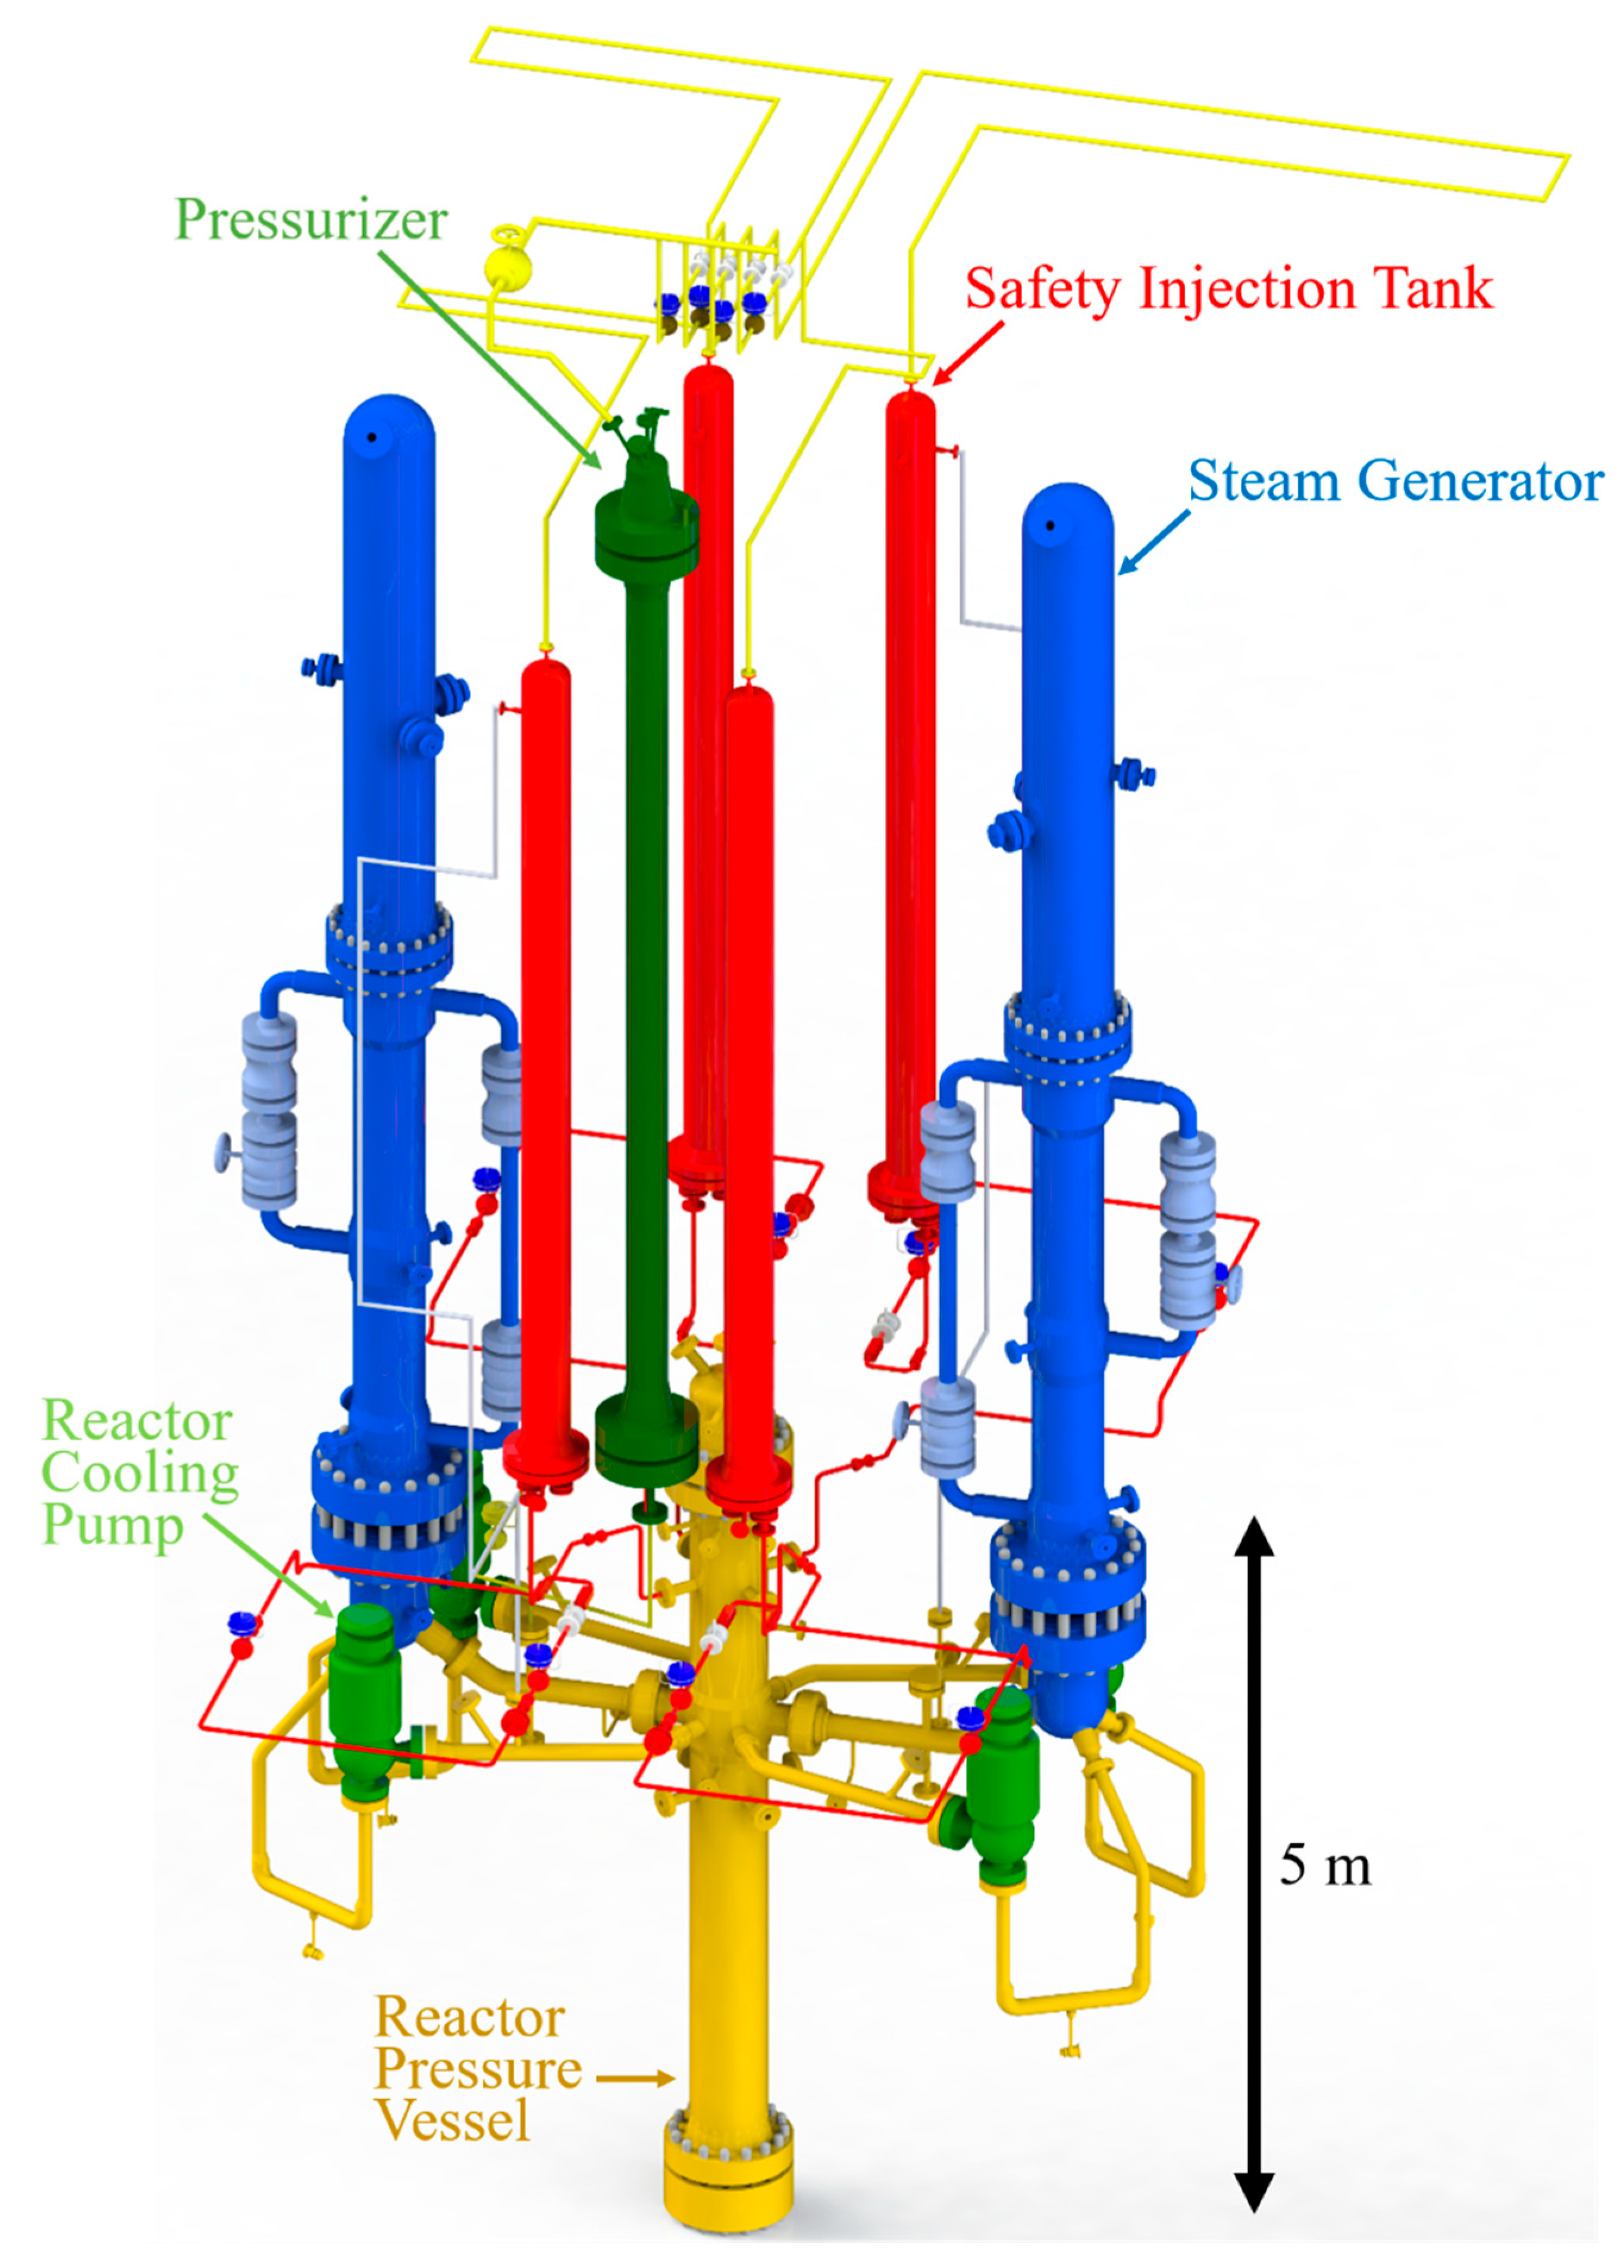
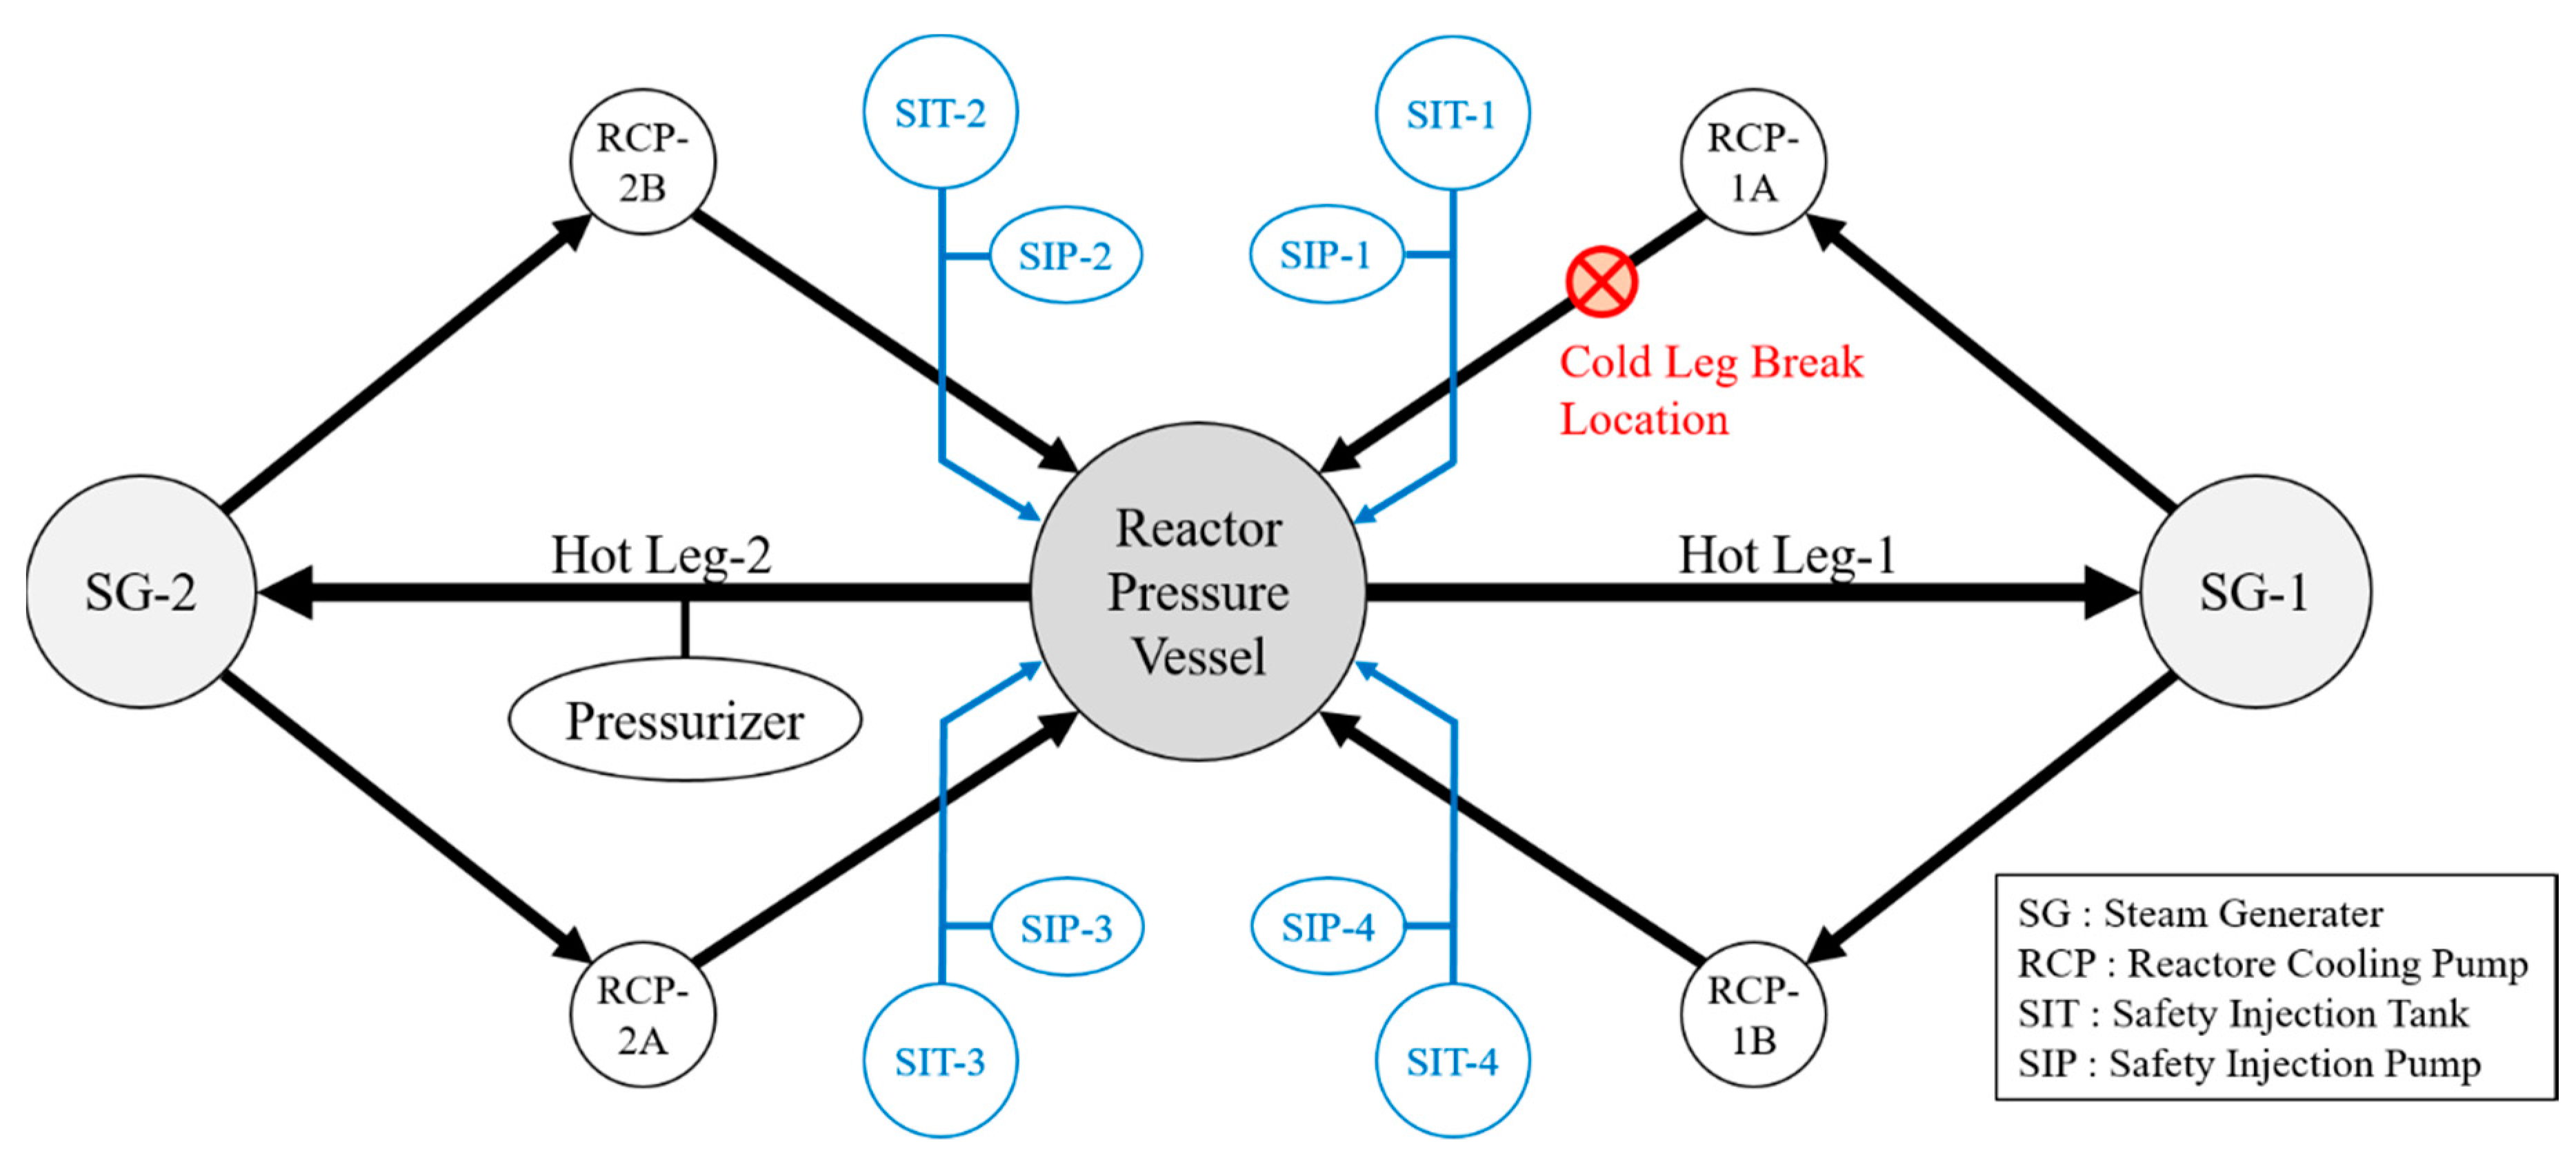
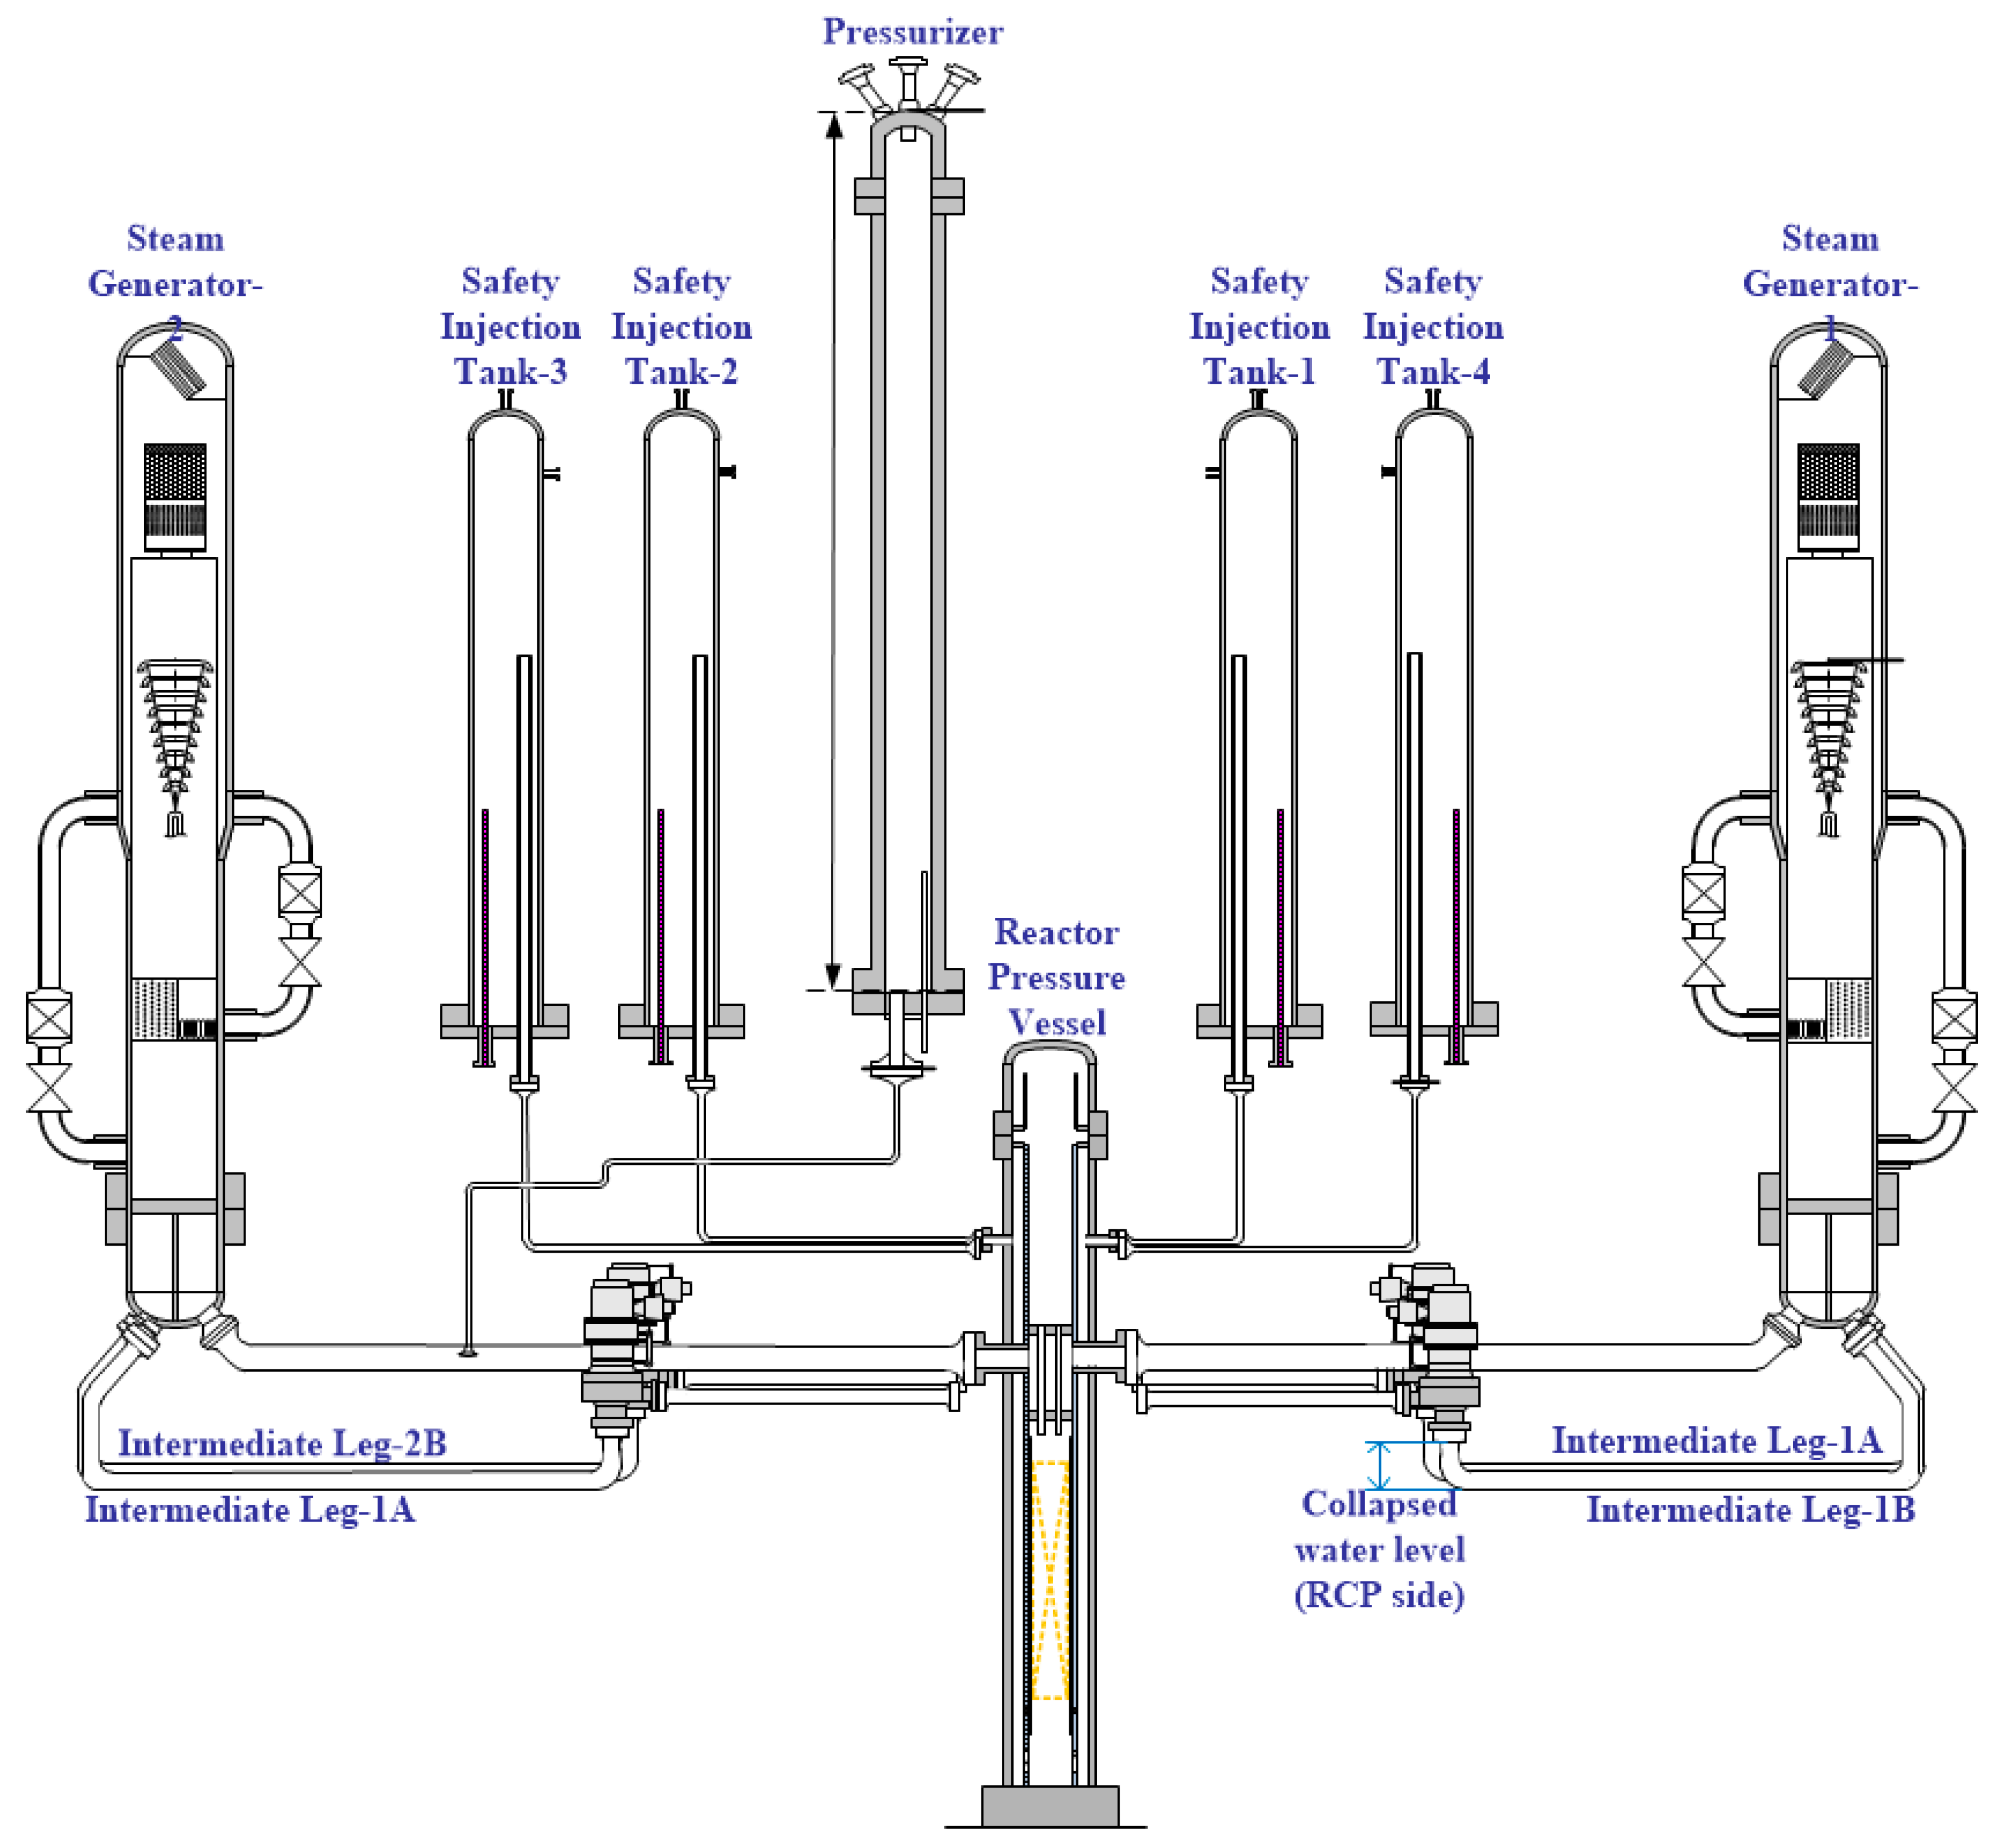
2.1. Overview of the ATLAS Facility
2.2. Experimental Conditions and Procedures
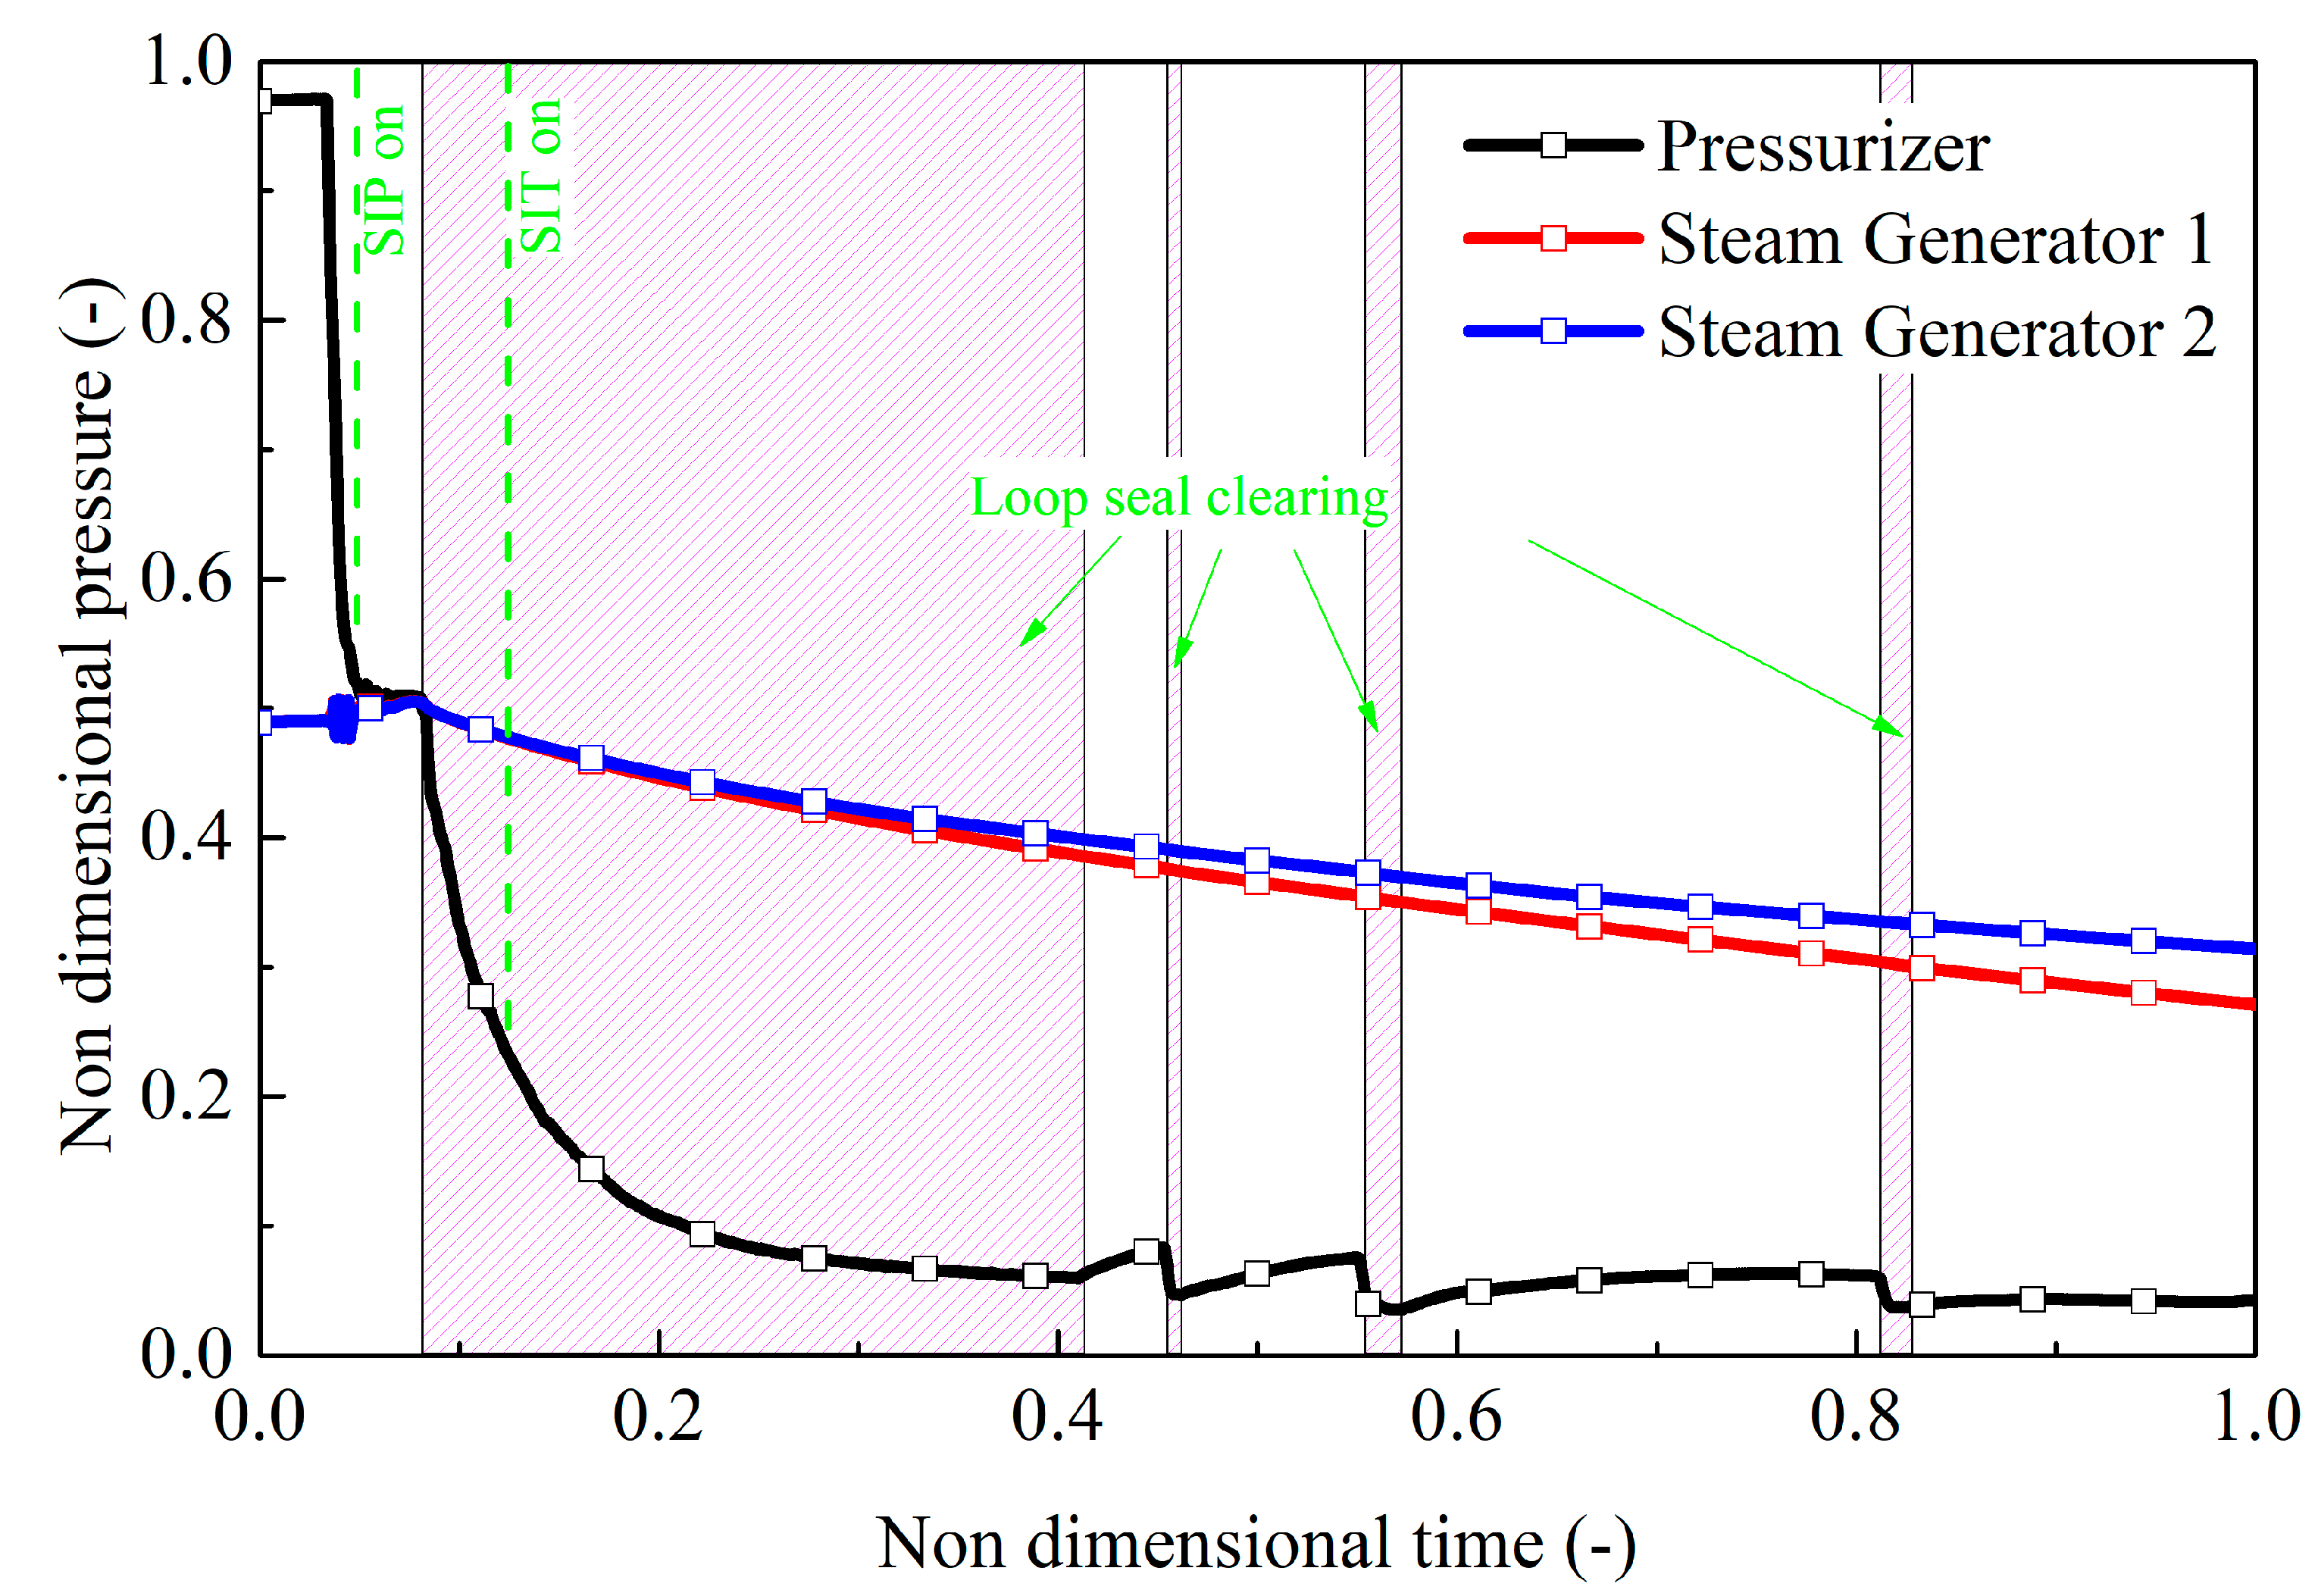
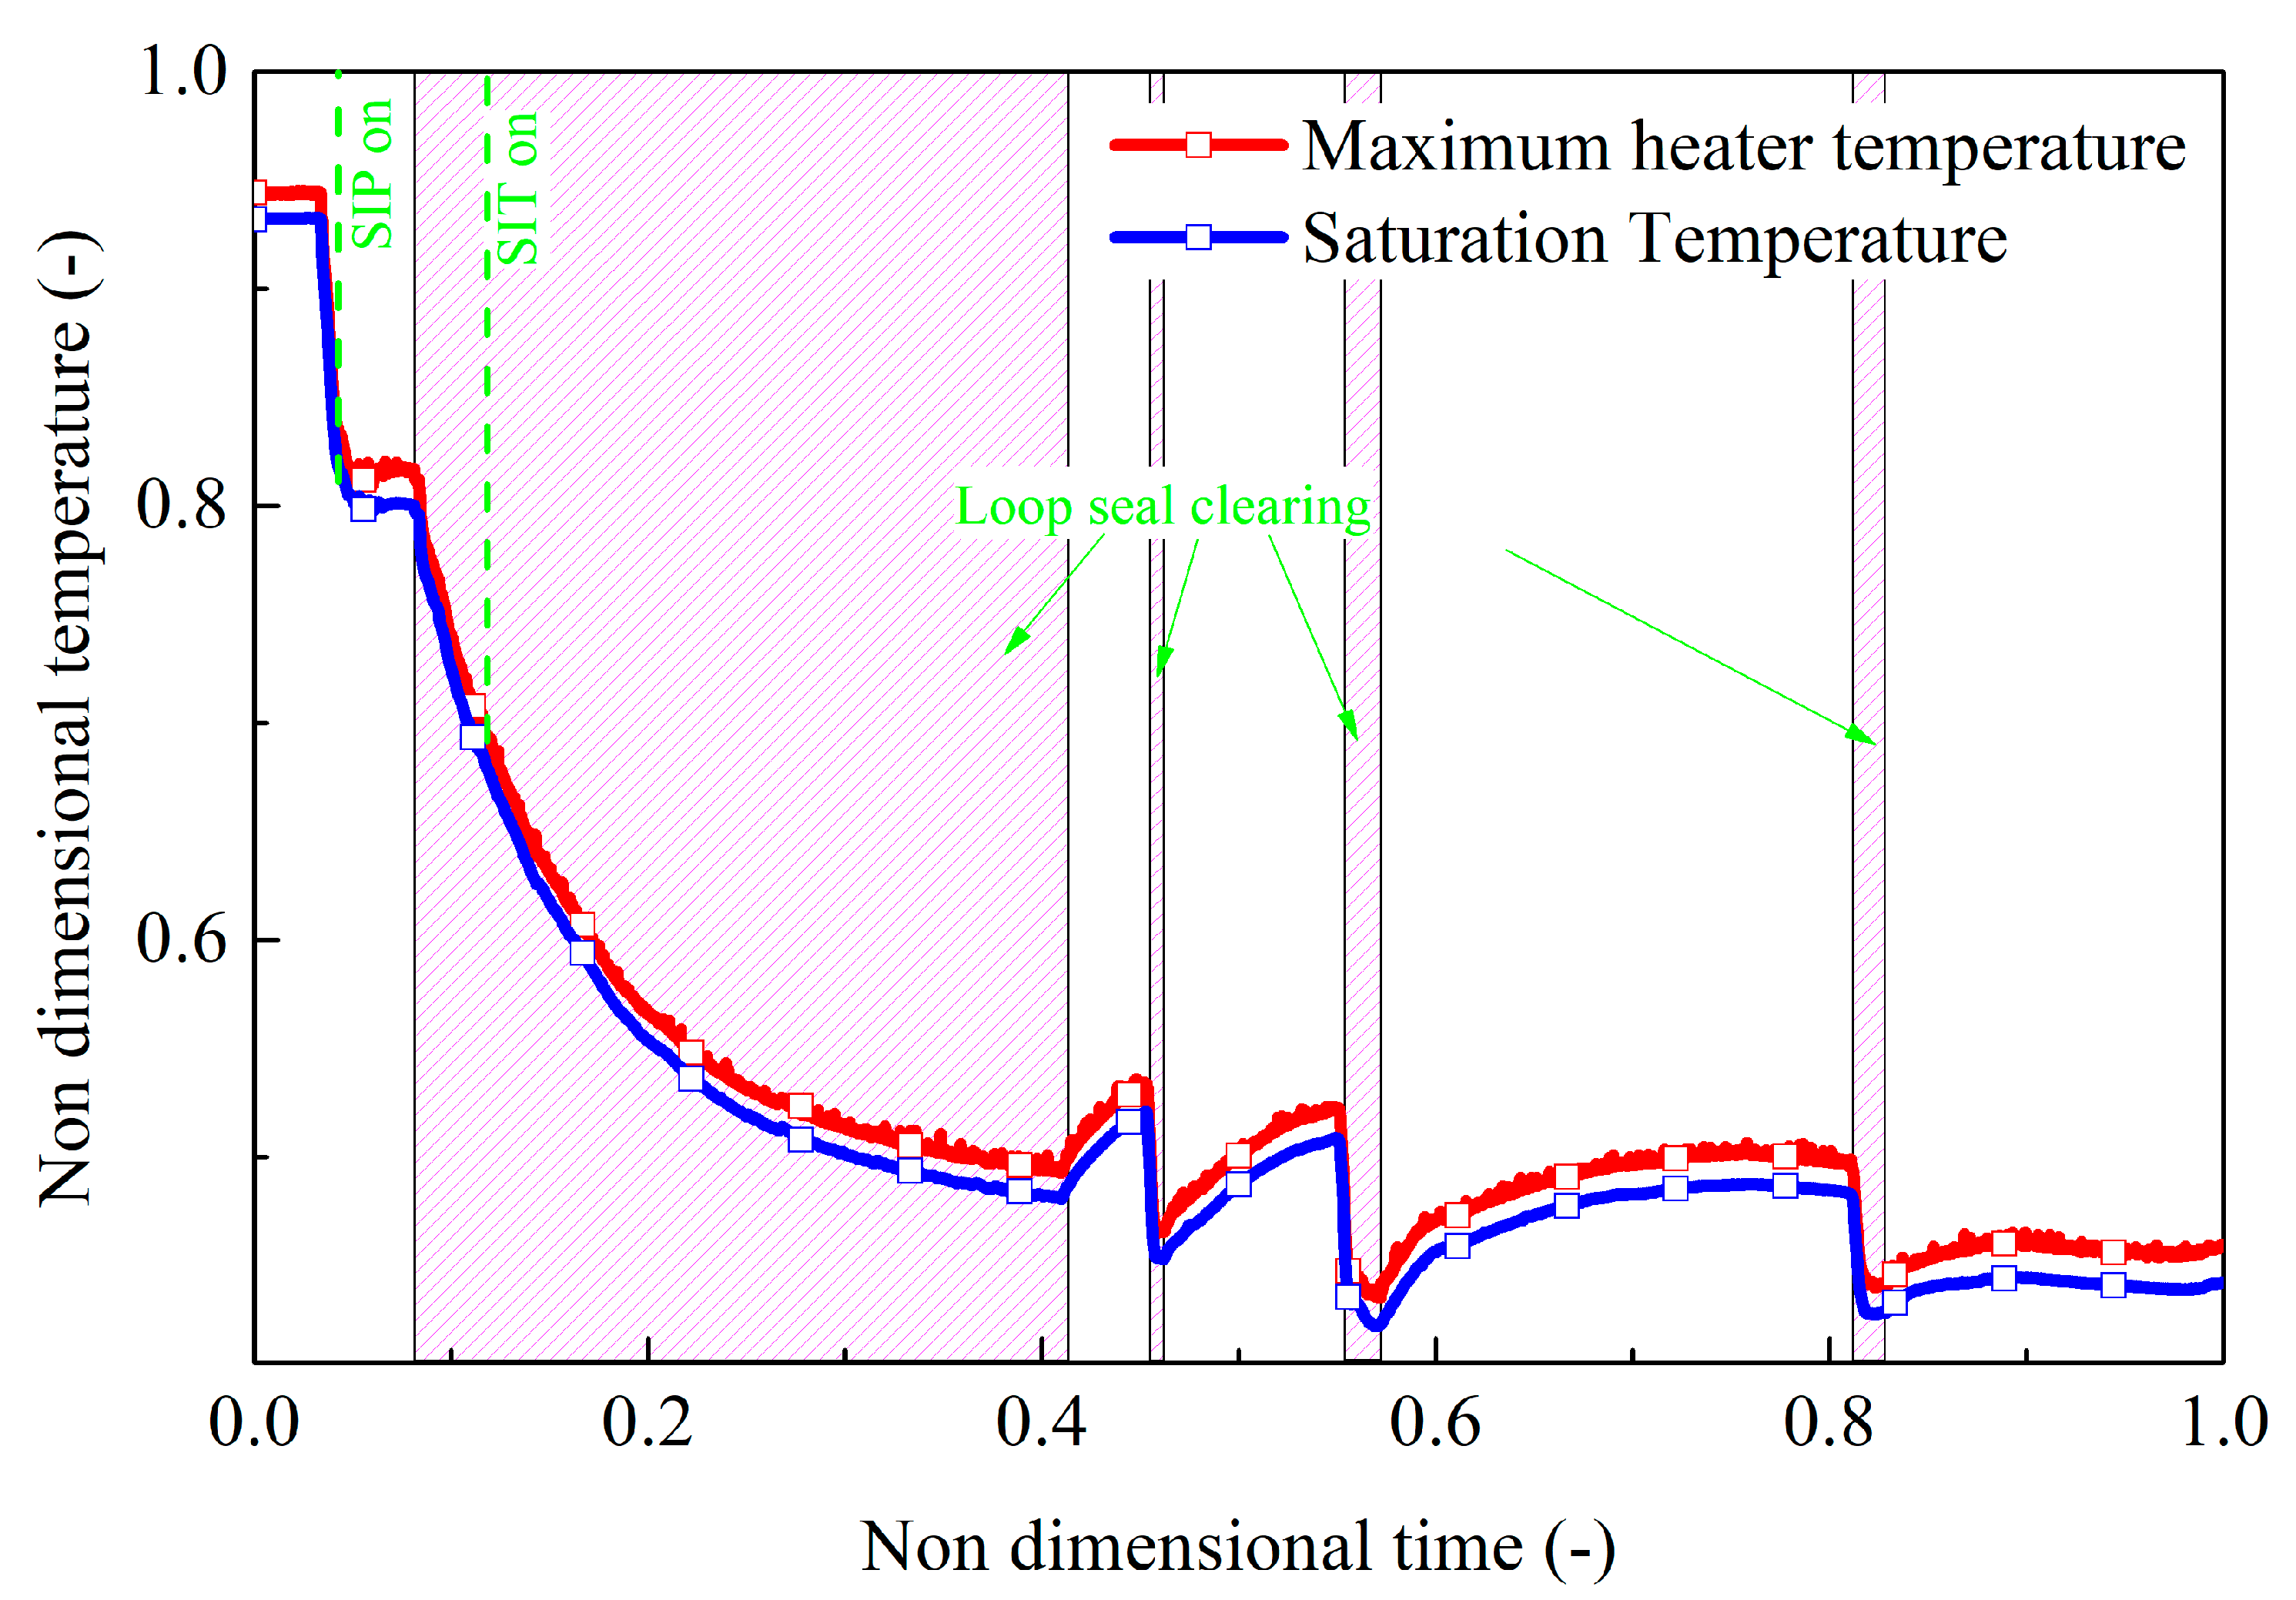
2.3. Major Experimental Results
3. Calculation Result and Findings
3.1. Blind and Open Calculation Results and Discussions
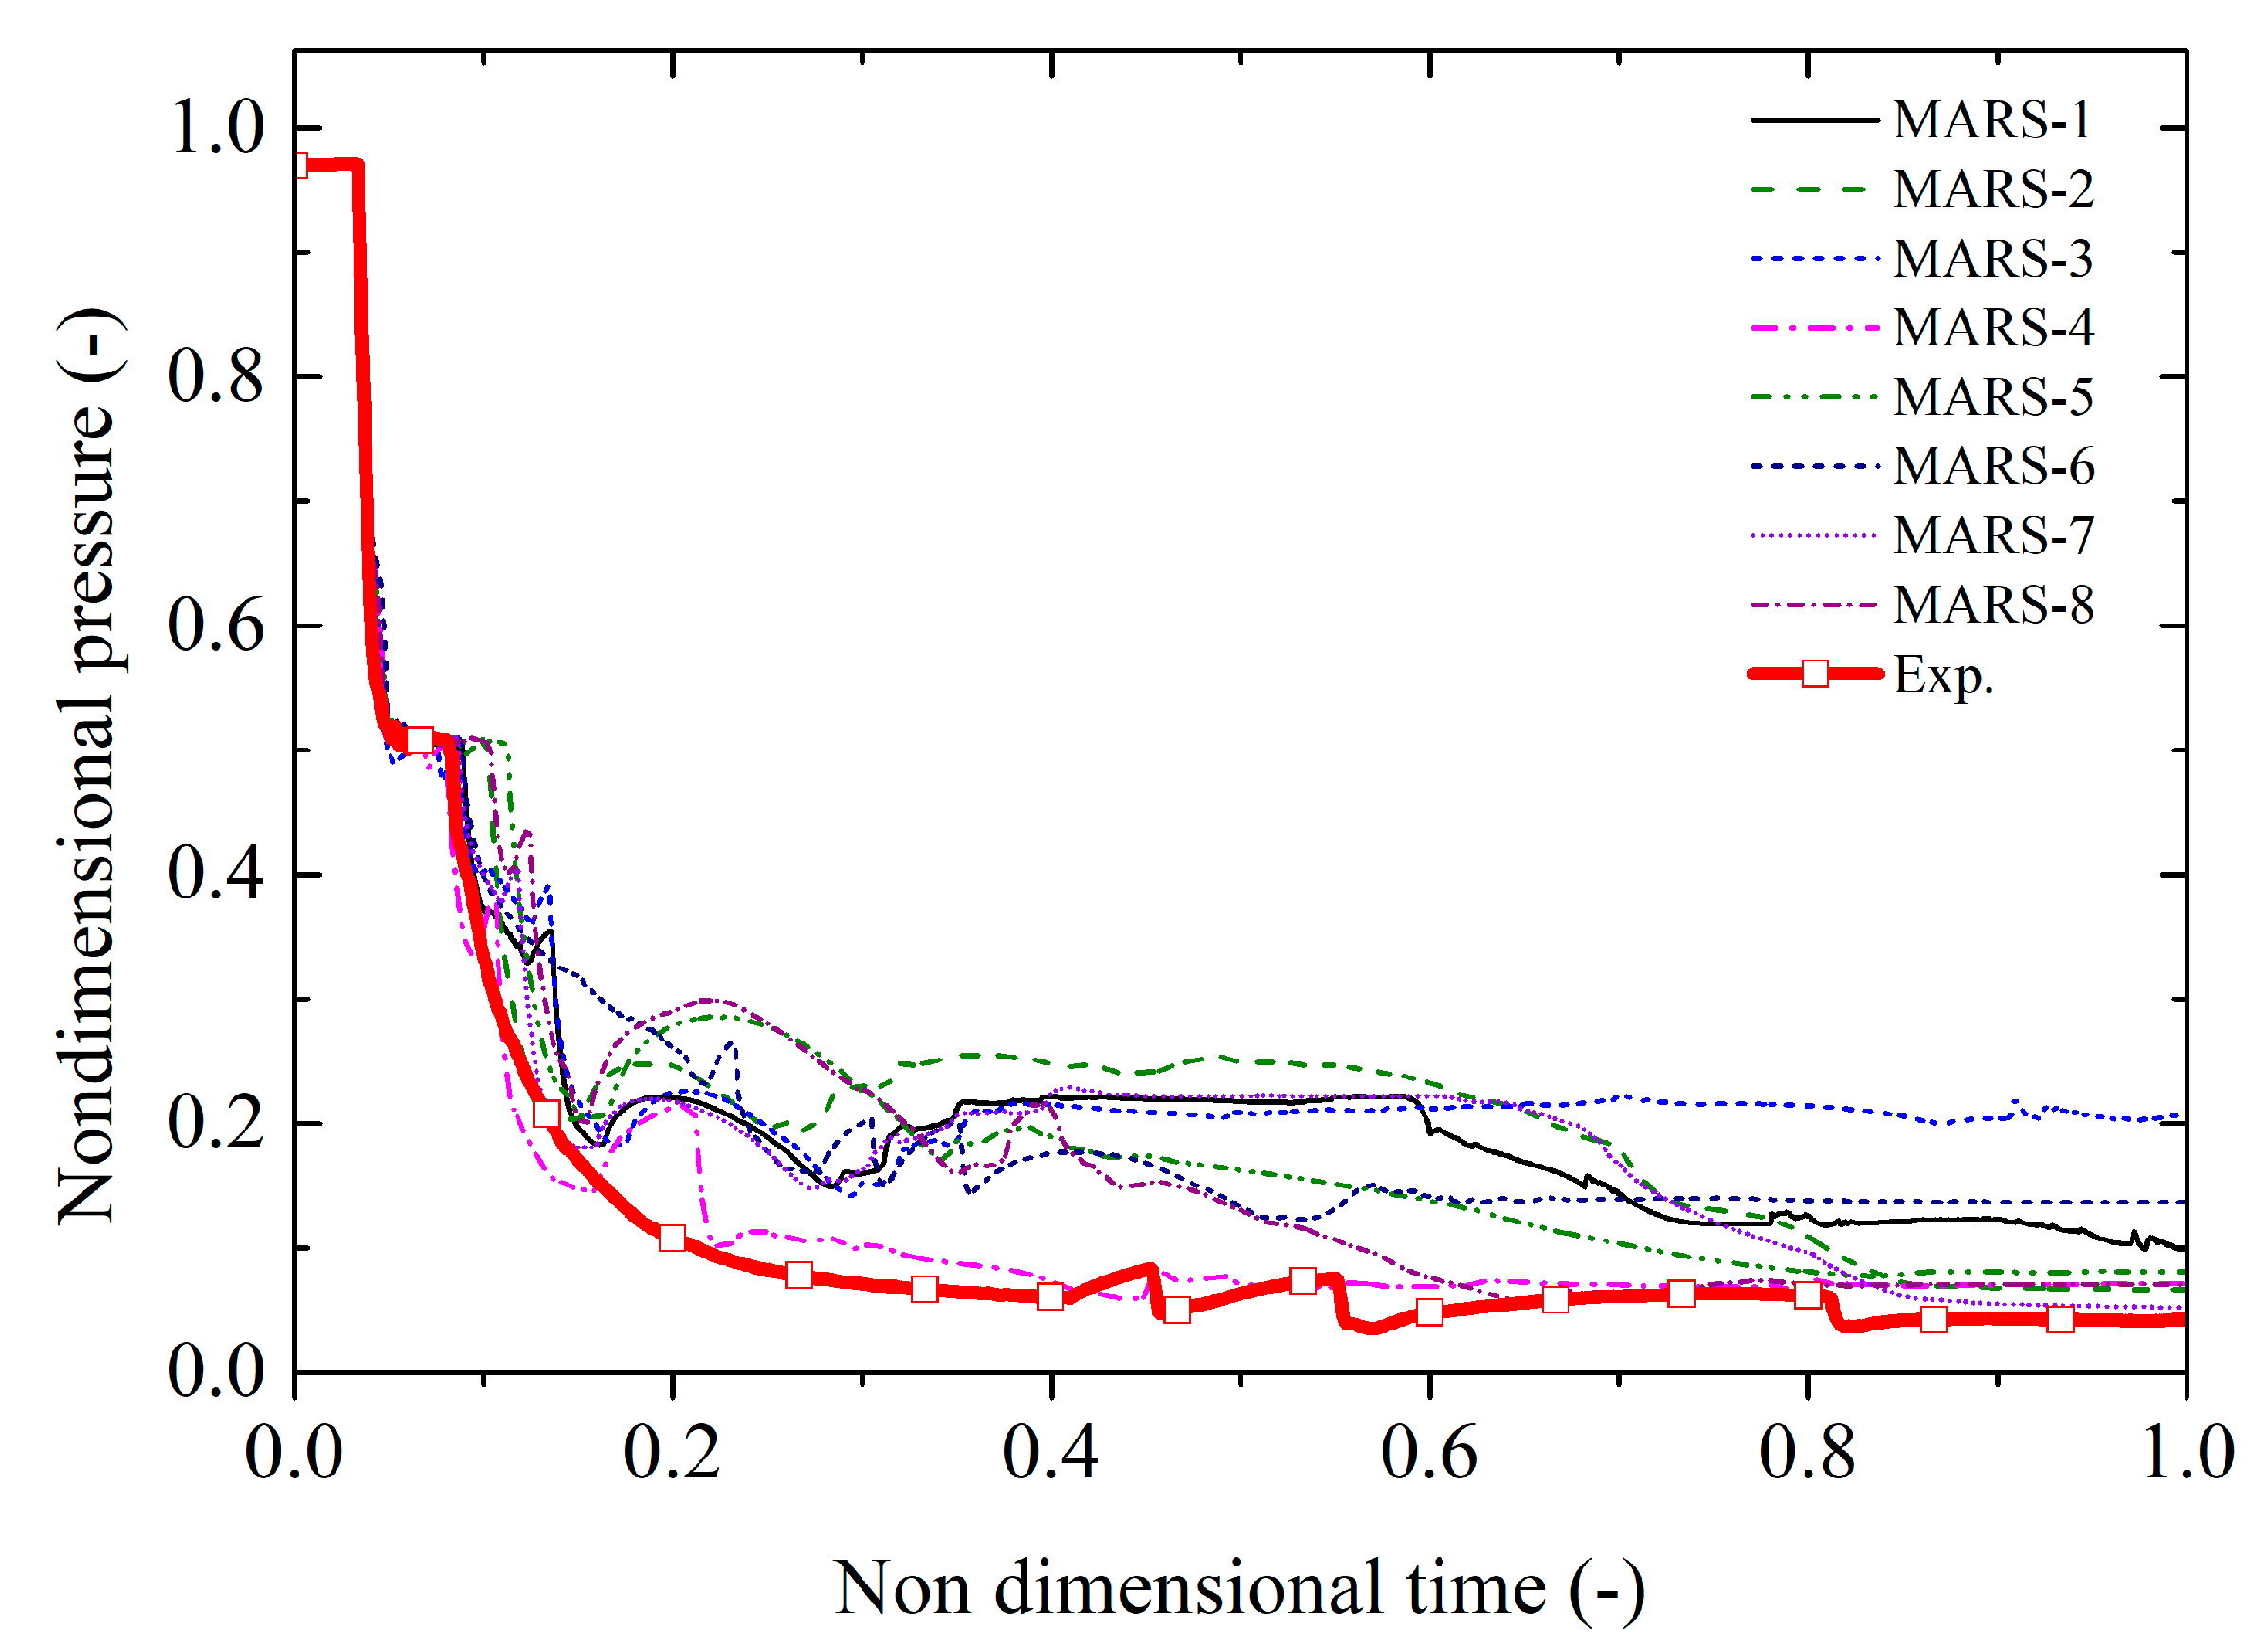
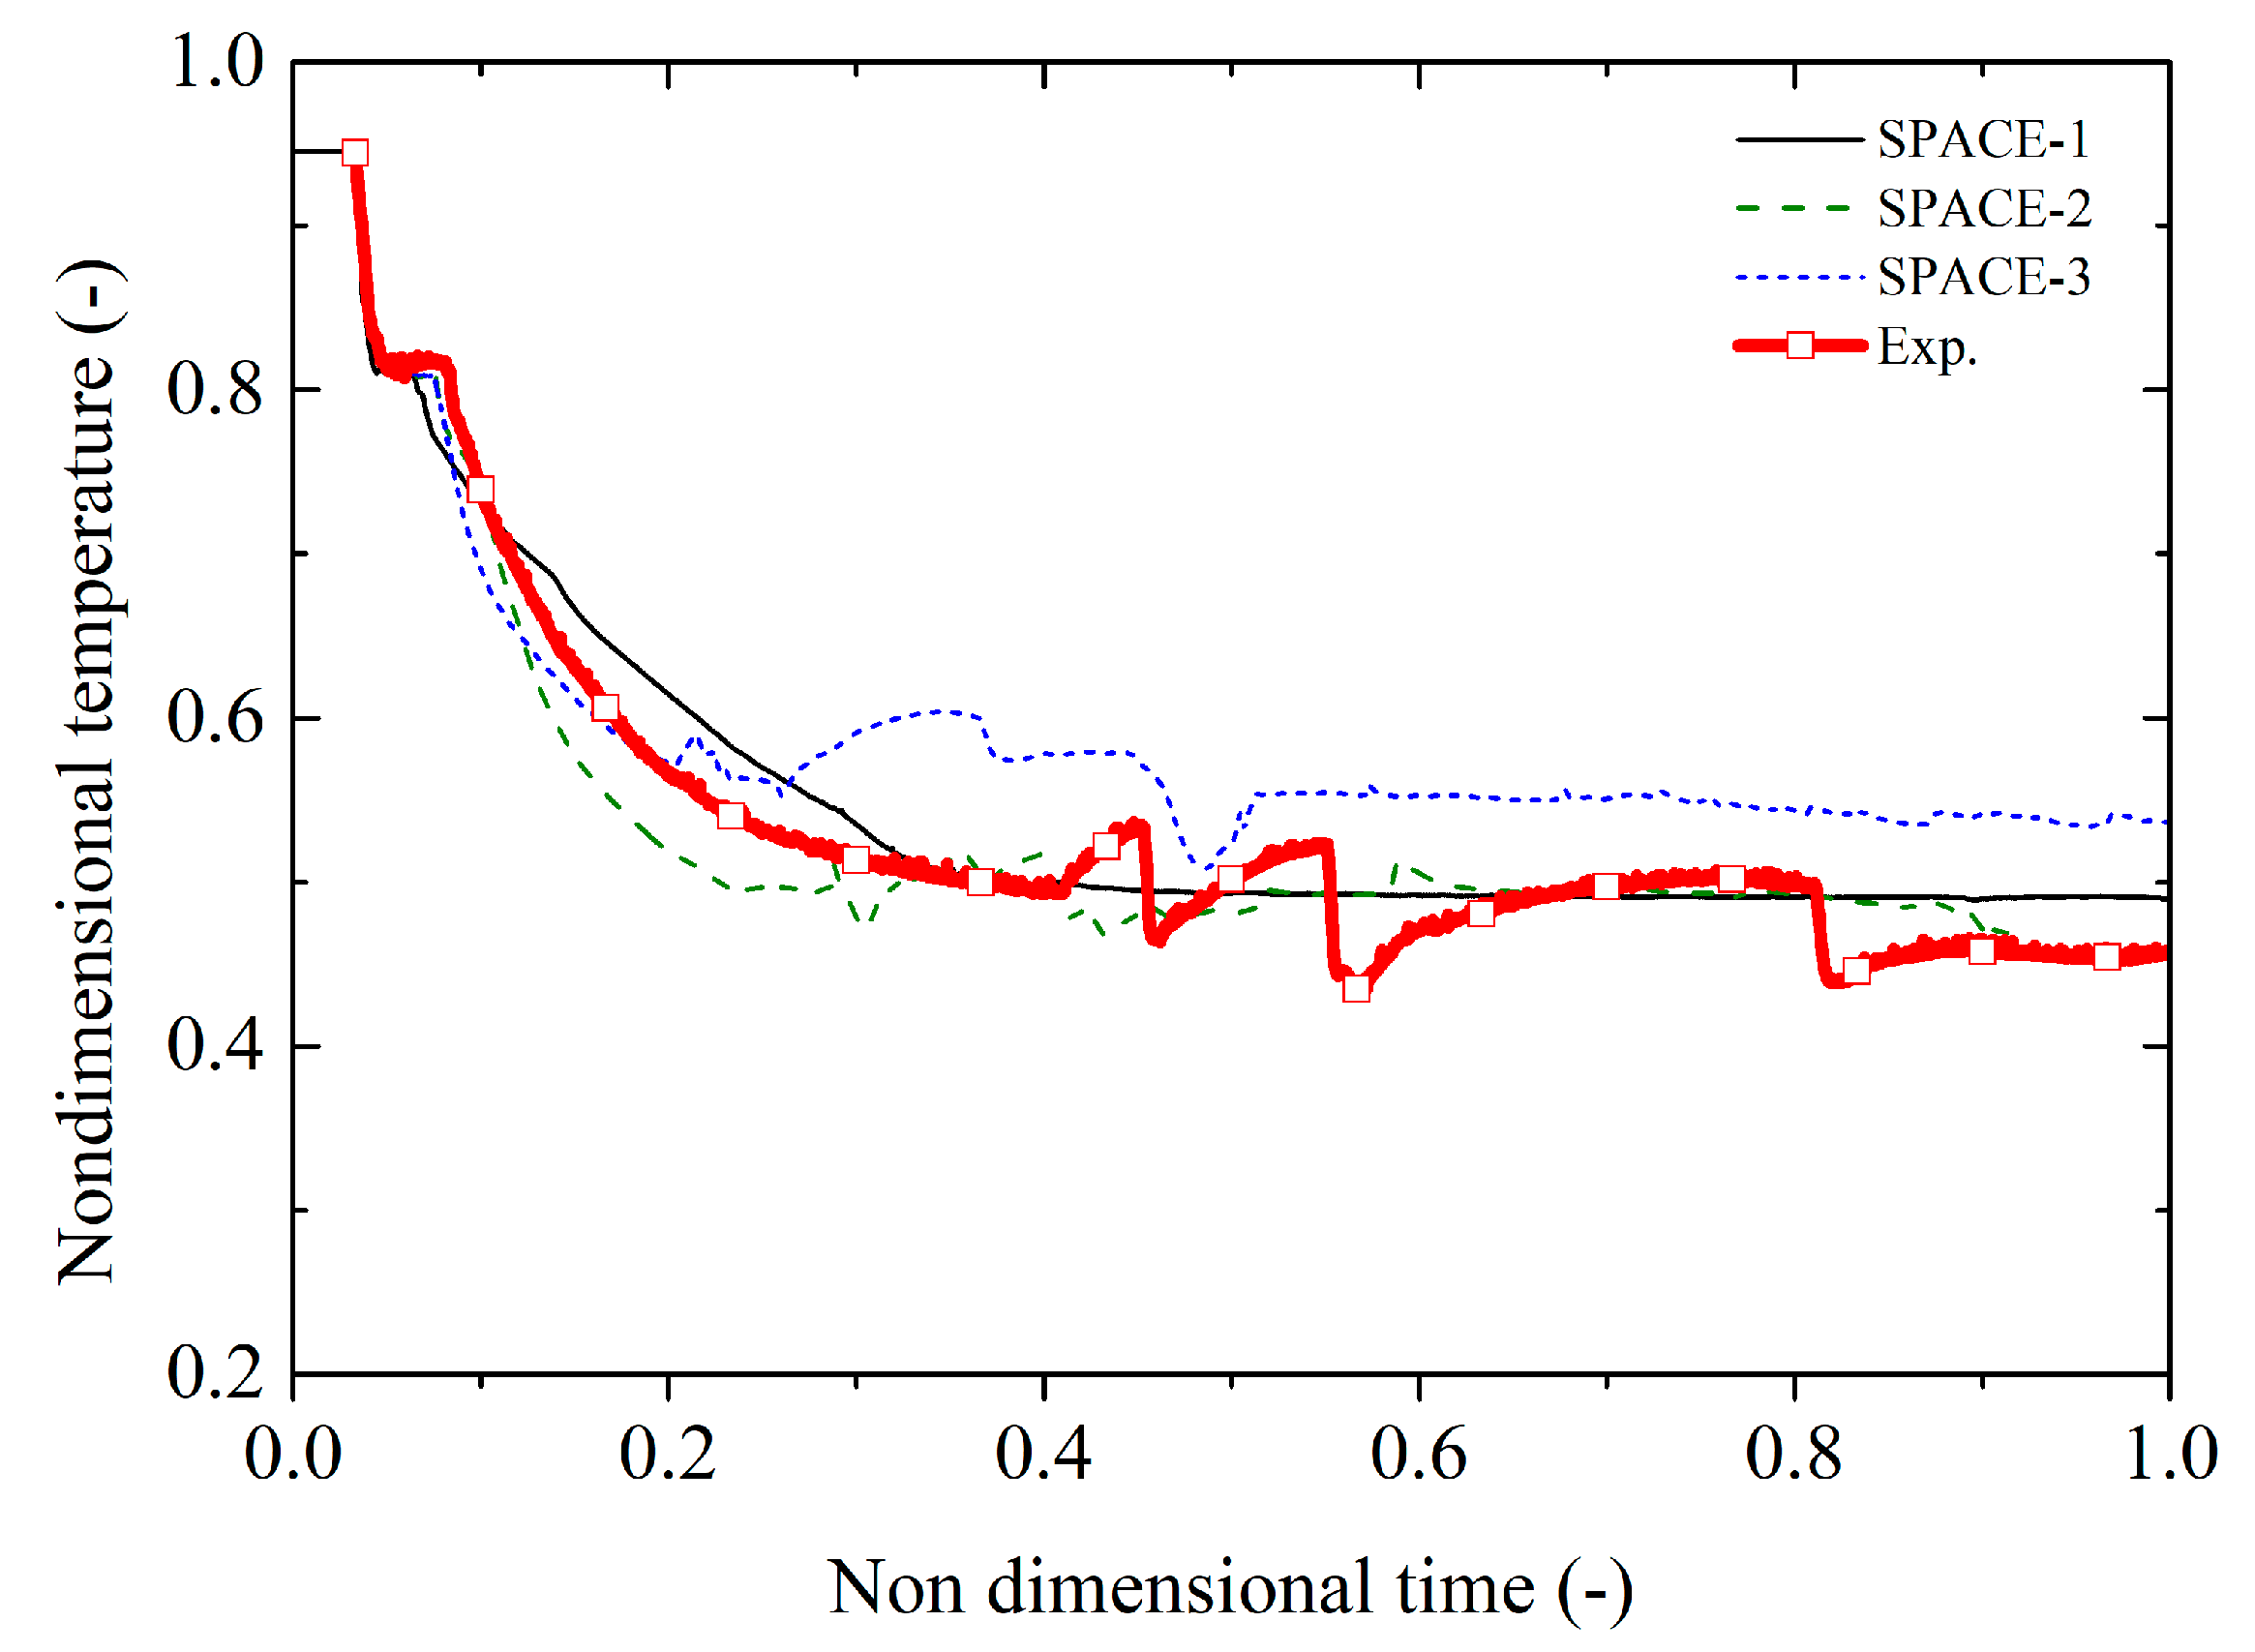
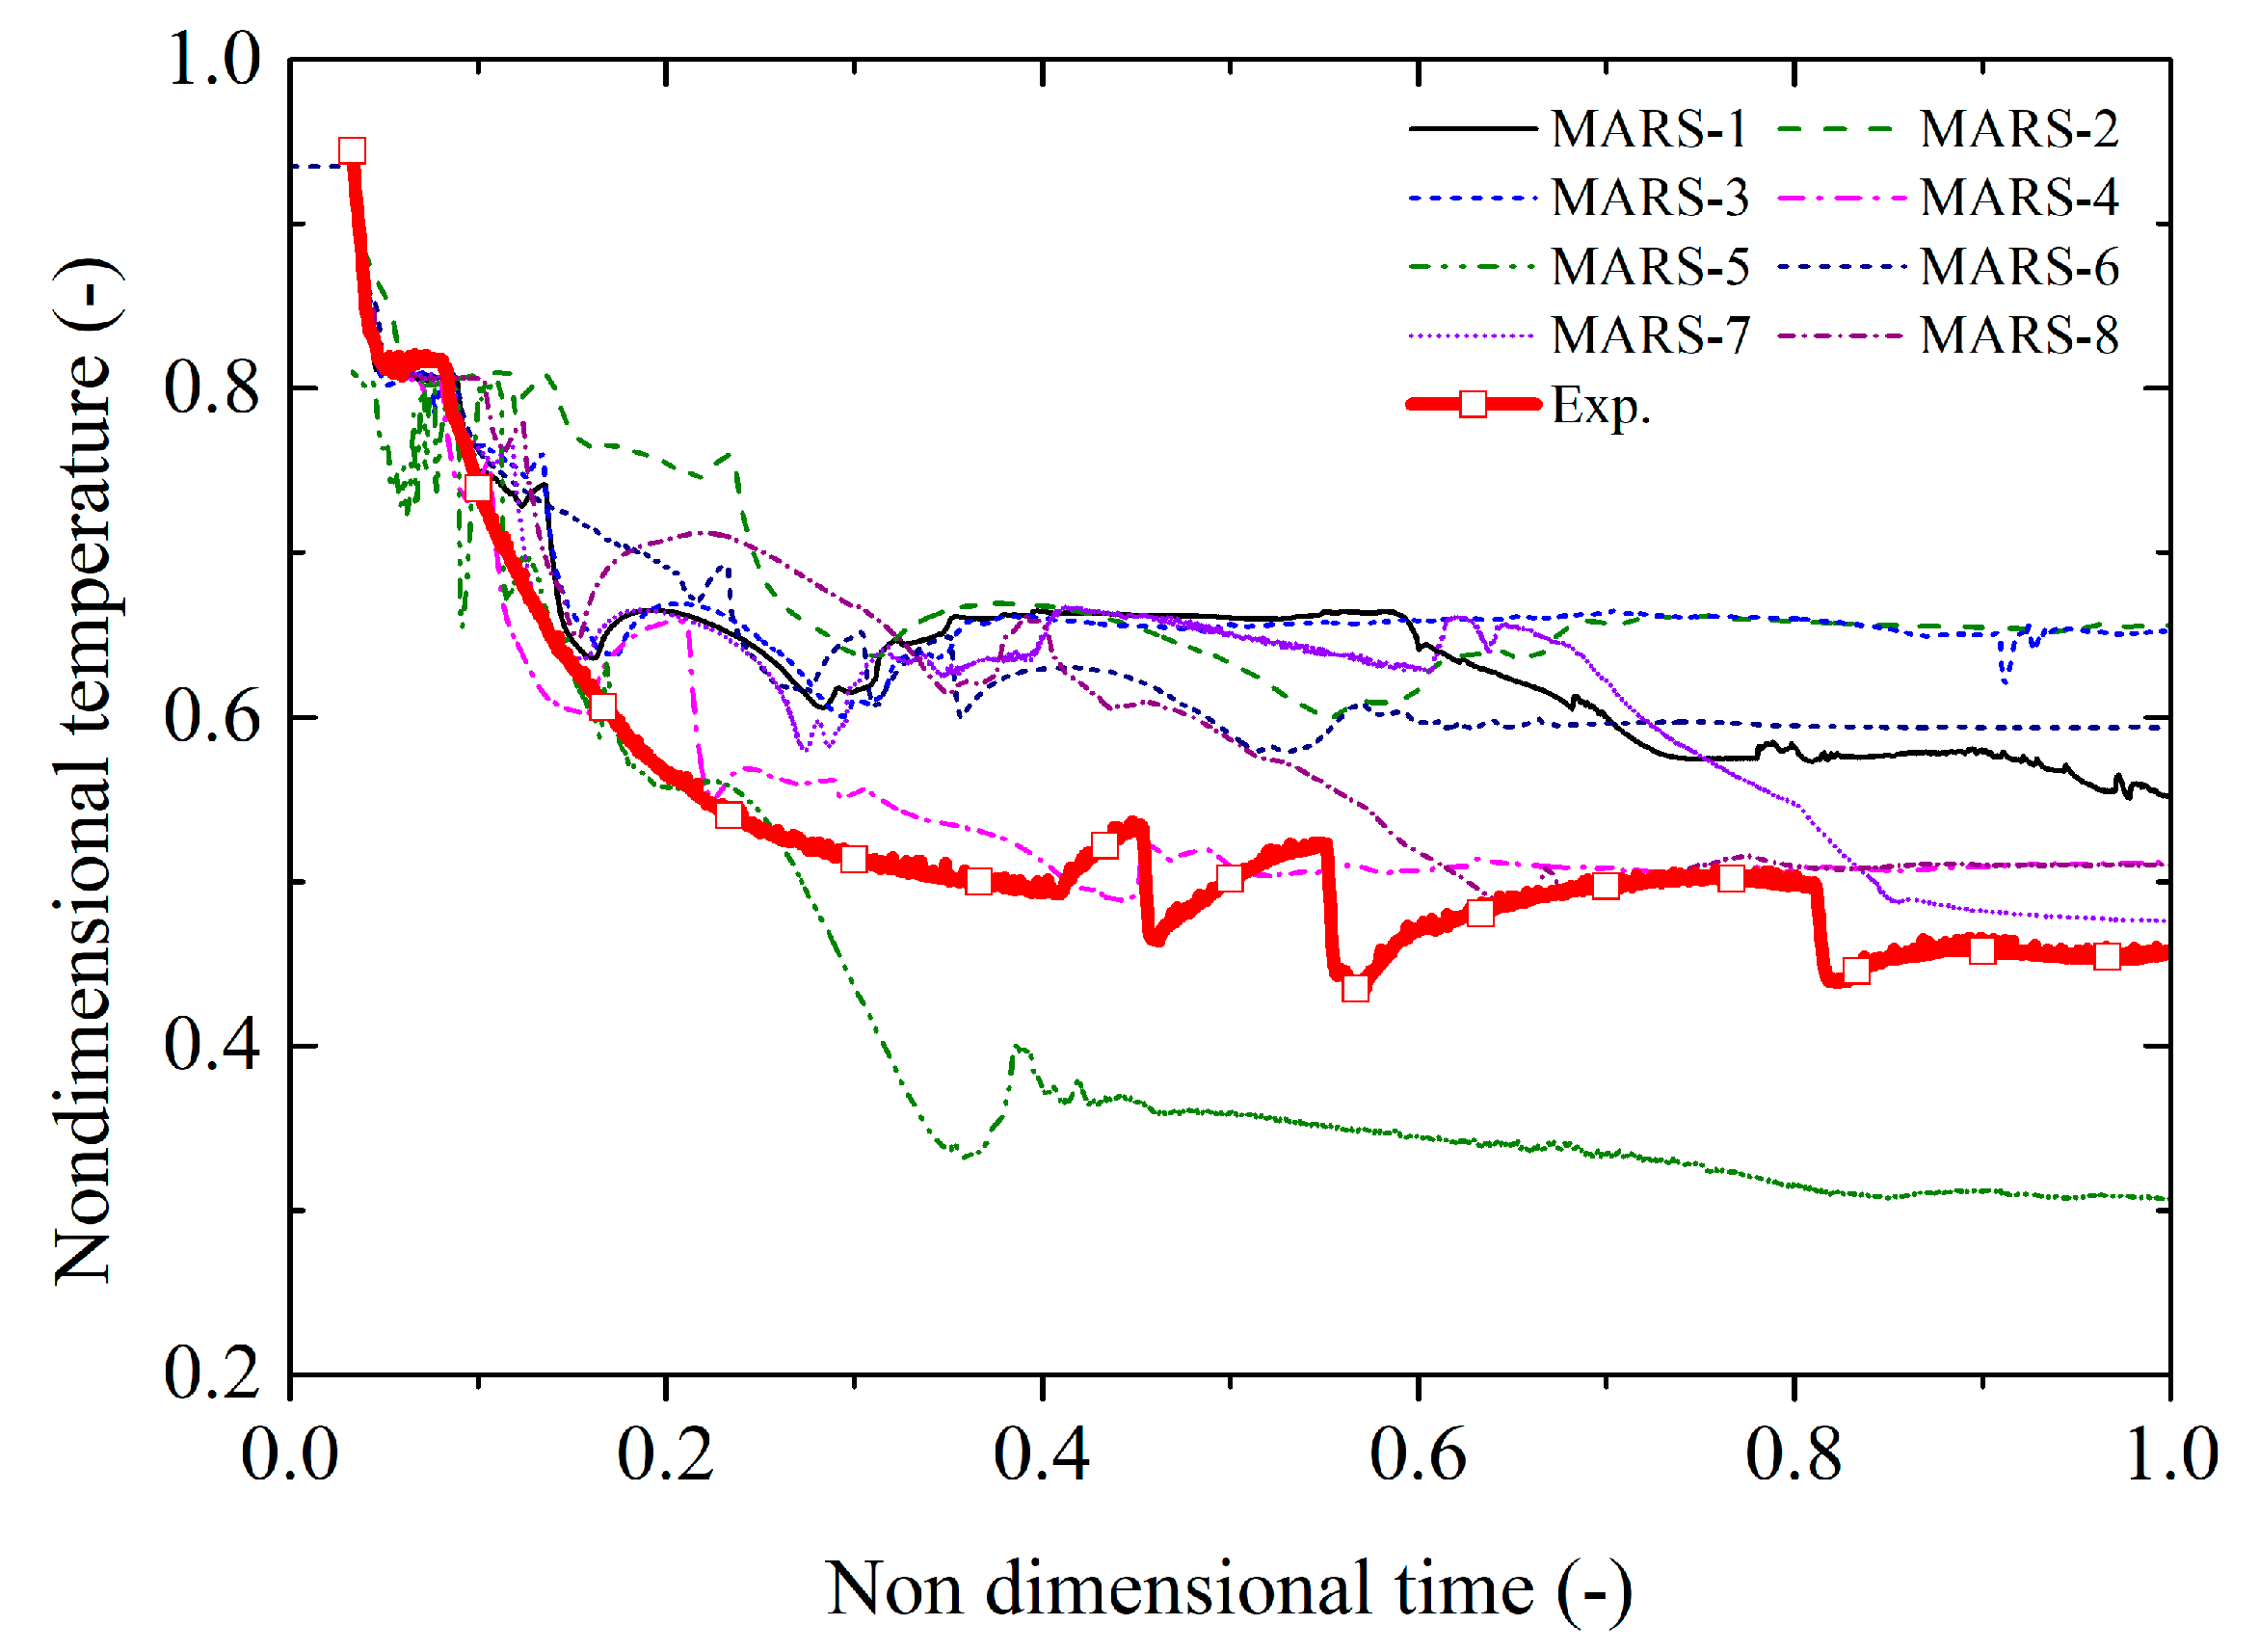
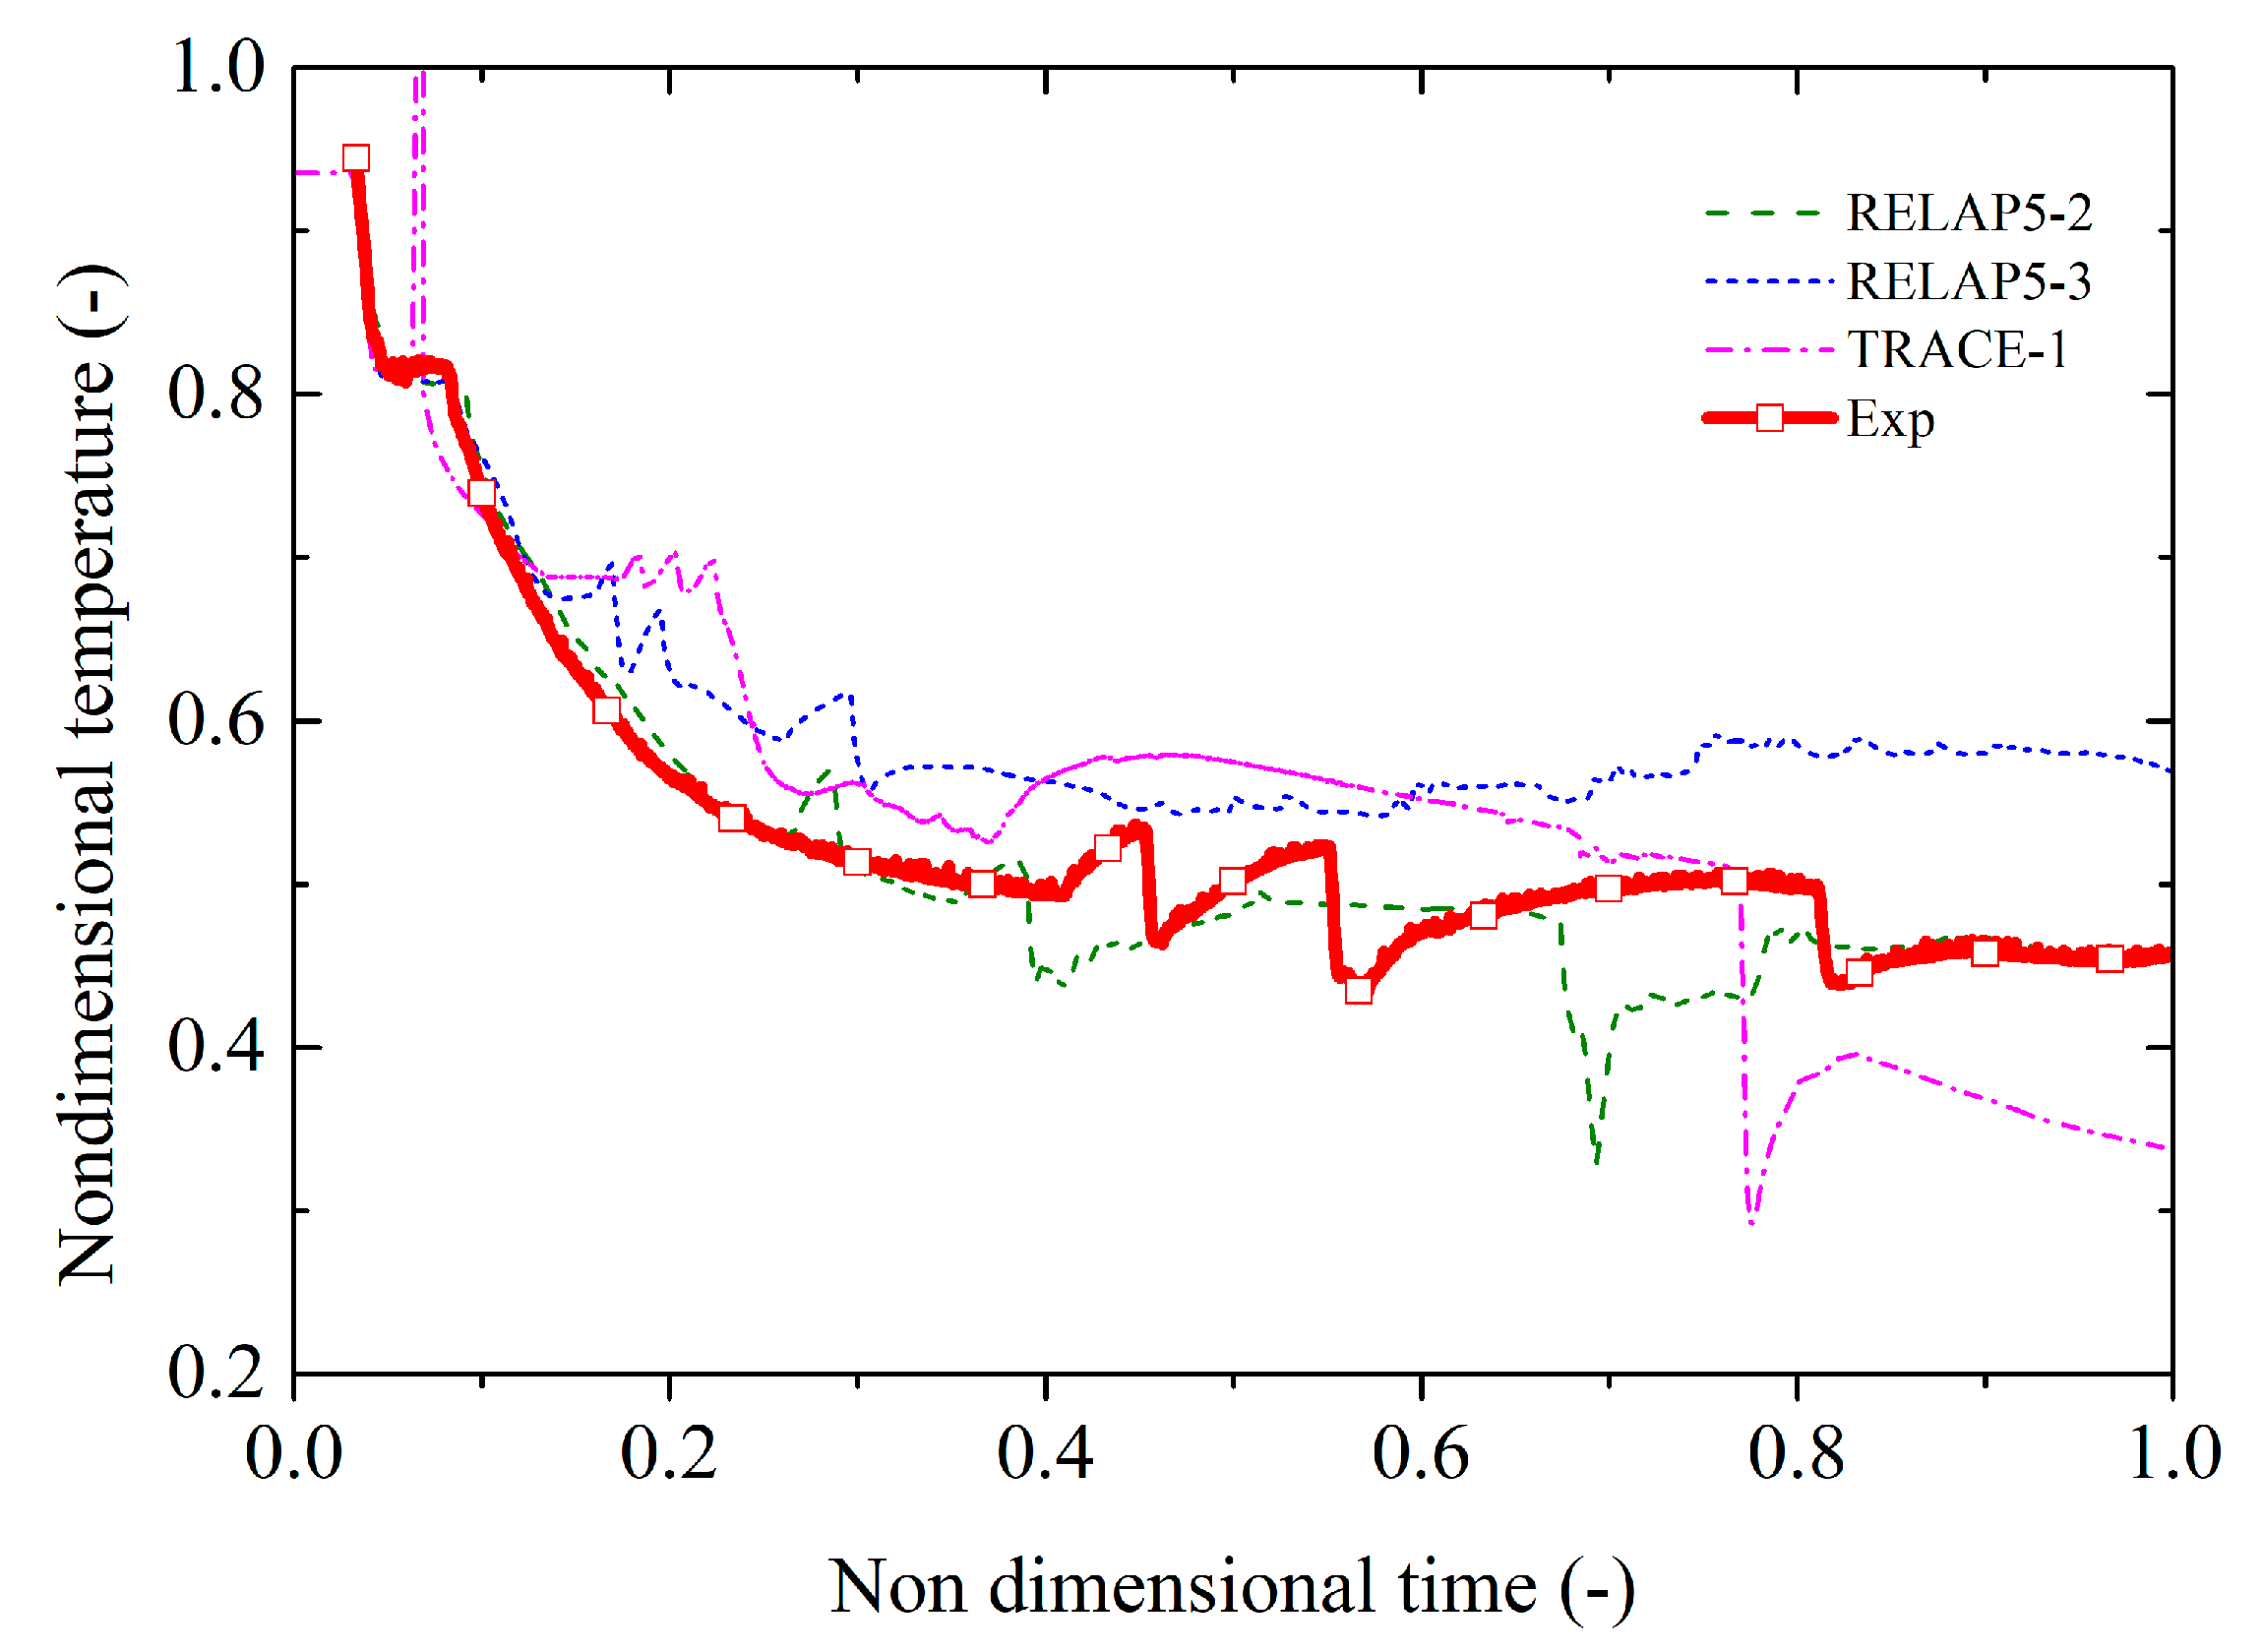
3.1.1. Blind Calculation Results
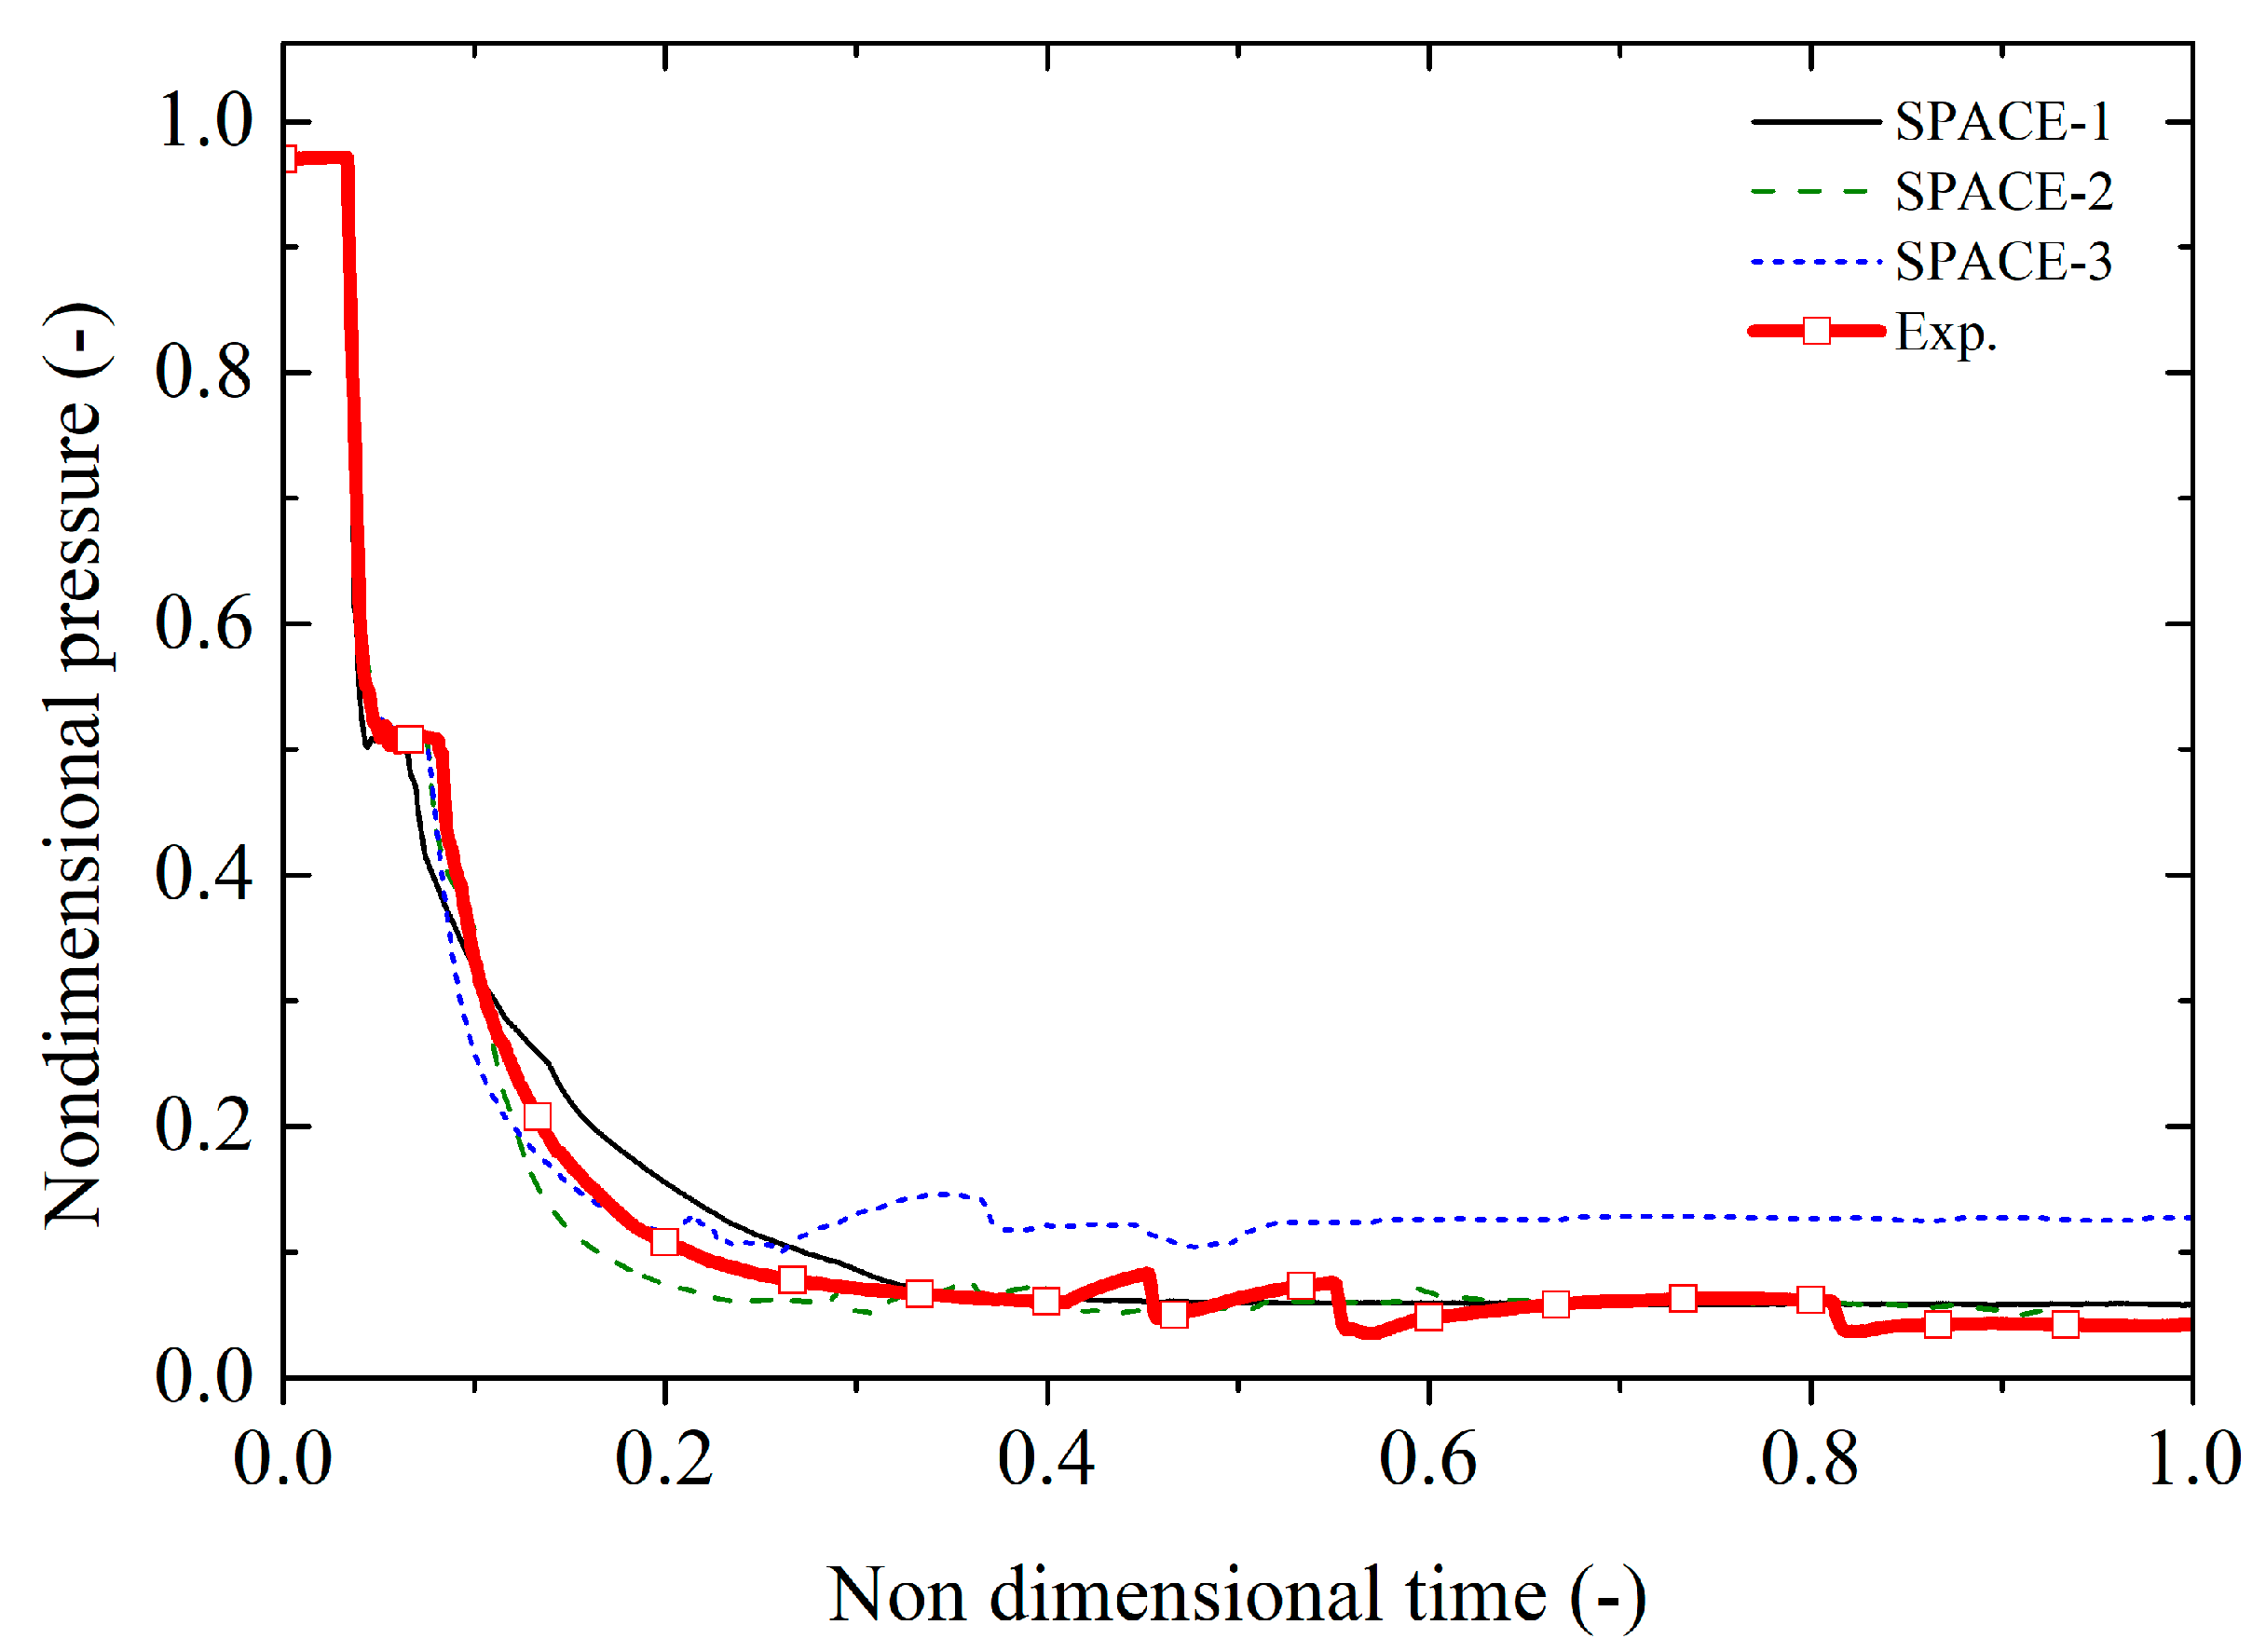
3.1.2. Open Calculation Results
4. Conclusions
Author Contributions
Funding
Conflicts of Interest
References
- Kim, Y.-S.; Choi, K.-Y.; Kang, K.-H.; Park, H.-S.; Cho, S.; Baek, W.-P.; Kim, K.-D.; Sim, S.K.; Lee, E.-H.; Kim, S.; et al. First atlas domestic standard problem (DSP-01) for the code assessment. Nucl. Eng. Technol. 2011, 43, 25–44. [Google Scholar] [CrossRef] [Green Version]
- Kim, Y.-S.; Choi, K.-Y.; Cho, S.; Park, H.-S.; Kang, K.-H.; Song, C.-H.; Baek, W.-P. Second atlas domestic standard problem (DSP-02) for the code assessment. Nucl. Eng. Technol. 2013, 45, 871–894. [Google Scholar] [CrossRef] [Green Version]
- Kang, K.-H.; Park, Y.-S.; Bae, B.-U.; Kim, J.-R.; Choi, N.-H.; Choi, K.-Y. Code assessment of ATLAS integral effect test simulating main steam-line break accident of an advanced pressurized water reactor. J. Nucl. Sci. Technol. 2018, 55, 104–112. [Google Scholar] [CrossRef]
- Choi, K.Y.; Baek, W.P.; Kang, K.H.; Park, H.S.; Cho, S.; Kim, Y.S. A summary of 50th oecd/nea/csni international standard problem exercise (isp-50). Nucl. Eng. Technol. 2012, 44, 561–586. [Google Scholar] [CrossRef] [Green Version]
- Summary Report of the NEA-Advanced Thermal-Hydraulic Test Loop for Accident Simulation (ATLAS) Joint Project; NEA/CSNI/R(2017)9; OECD: Lille, France, 2018.
- Summary Report of the NEA ATLAS-2 Joint Project; NEA/CSNI/R(2021)6; OECD: Lille, France, 2022.
- Lu, S. APR-1400 Loop Seal and Its Impact on Long Term Cooling during a Postulated Loss-of-Coolant Accident; NRC draft RAI, ML14134A347; U.S.NRC: Rockville, MD, USA, 2014.
- Ha, S.J.; Park, C.E.; Kim, K.D.; Ban, C.H. Development of the SPACE code for nuclear power plants. Nucl. Eng. Technol. 2011, 43, 45–62. [Google Scholar] [CrossRef] [Green Version]
- The RELAP5 Development Team. RELAP5/MOD3 Code Manual; NUREG/CR-5535-V4; The RELAP5 Development Team: Idaho Falls, ID, USA, 1995. [Google Scholar]
- MARS Code Manual Volume II: Input Requirements; KAERI/TR-2811/2004; KAERI: Daejeon, Korea, 2004.
- Heralecky, P. Post-Test Analysis of Cold Leg Small Break 4.1% at PSB-VVER Facility Using TRACE V5.0; NUREG/IA-0502; U.S.NRC: Rockville, MD, USA, 2019.
- Kim, Y.S.; Choi, K.Y.; Park, H.S.; Cho, S.; Kim, B.D.; Choi, N.H.; Baek, W.P. Commissioning of the ATLAS thermal hydraulic integral test facility. Ann. Nucl. Energy 2008, 35, 1791–1799. [Google Scholar] [CrossRef]
- Choi, K.Y.; Park, H.S.; Cho, S.; Euh, D.J.; Kim, Y.S.; Baek, W.P. Integral behavior of the ATLAS facility for a 3-inch small break loss of coolant accident. Nucl. Eng. Technol. 2008, 40, 199–212. [Google Scholar] [CrossRef] [Green Version]
- Lee, J.B.; Bae, B.U.; Park, Y.; Kim, J.; Kim, Y.S.; Cho, S.; Jeon, W.; Park, H.-S.; Yi, S.-J.; Moon, S.-K.; et al. Description Report of ATLAS Facility and Instrumentation (Third Revision); KAERI: Daejeon, Korea, 2020. [Google Scholar]
- Kim, J.; Bae, B.-U.; Lee, J.B.; Park, Y.; Cho, S.; Kang, K.-H. Integral effect test on top-slot break scenario with 4 inches cold leg break LOCA in ATLAS facility. Front. Energy Res. 2020, 8, 1–11. [Google Scholar] [CrossRef]
- Kang, J.-y; Hossen, M.M.; Bae, B.-U.; Kim, Y.-S.; Lee, J.B.; Shin, Y.-C.; Jeon, W.J.; Kang, K.-H. Mechanism of loop seal clearance occurring at U-shaped pipe with air-water two-phase flow. Nucl. Eng. Des. 2020, 359, 110398. [Google Scholar] [CrossRef]


| Organizations | Code |
|---|---|
| Korea Atomic Energy Research Institute | SPACE |
| Korea Electric Power Corporation Engineering and Construction | SPACE |
| Korea Hydro & Nuclear Power | SPACE, RELAP5 |
| FNC technology | MARS-KS |
| Hanyang University | MARS-KS |
| Korea Advanced Institute of Science and Technology | MARS-KS |
| Korea Institute of Nuclear Safety | MARS-KS |
| Pusan National University | MARS-KS |
| Sen Tech. | MARS-KS |
| Ulsan National Institute of Science and Technology | MARS-KS |
| EN2T | MARS-KS, TRACE |
| DOOSAN heavy industries | RELAP5 |
| Korea Electric Power Corporation Nuclear Fuel | RELAP5 |
| Set Point (Non-Dimensional Units) | |
|---|---|
| Primary system logic | |
| By-pass rate | 0% |
| Cold leg-break time | 0.033 |
| LPP | Pressurizer pressure < 0.78 |
| Reactor scram/RCP trip/Turbine trip/MFIV and MSIV close | LPP + 0.0 s |
| SIP on time | (Pressurizer pressure < 0.67) + 0.003 |
| SIT on SIT low-flow conversion SIT stop | Downcomer pressure < 0.25 SIT level 1,2,3,4 < 72.8, 72.6, 72.0, 72.2% SIT level 1,2,3,4 < 47.4, 47.2, 46.6, 47.0% |
| Secondary system logic | |
| MSSV1,2-01 open MSSV1,2-01 close | SG secondary pressure > 0.51 SG secondary pressure < 0.48 |
| MSSV1,2-02 open MSSV1,2-02 close | PT-SGSD1,2-01 > 0.52 PT-SGSD1,2-02 < 0.49 |
| MSSV1,2-03 open MSSV1,2-03 close | PT-SGSD1,2-01 > 0.53 PT-SGSD1,2-03 < 0.50 |
| Events | Timing (Non-Dimensional Time) | Remarks |
|---|---|---|
| Break start | 0.033 | MFW terminated |
| MSSV | 0.037/0.038 | SG pressure |
| LPP trip | 0.037 | Low pressurizer pressure |
| SIP on | 0.042 | |
| SIT on | 0.118 | Low downcomer pressure |
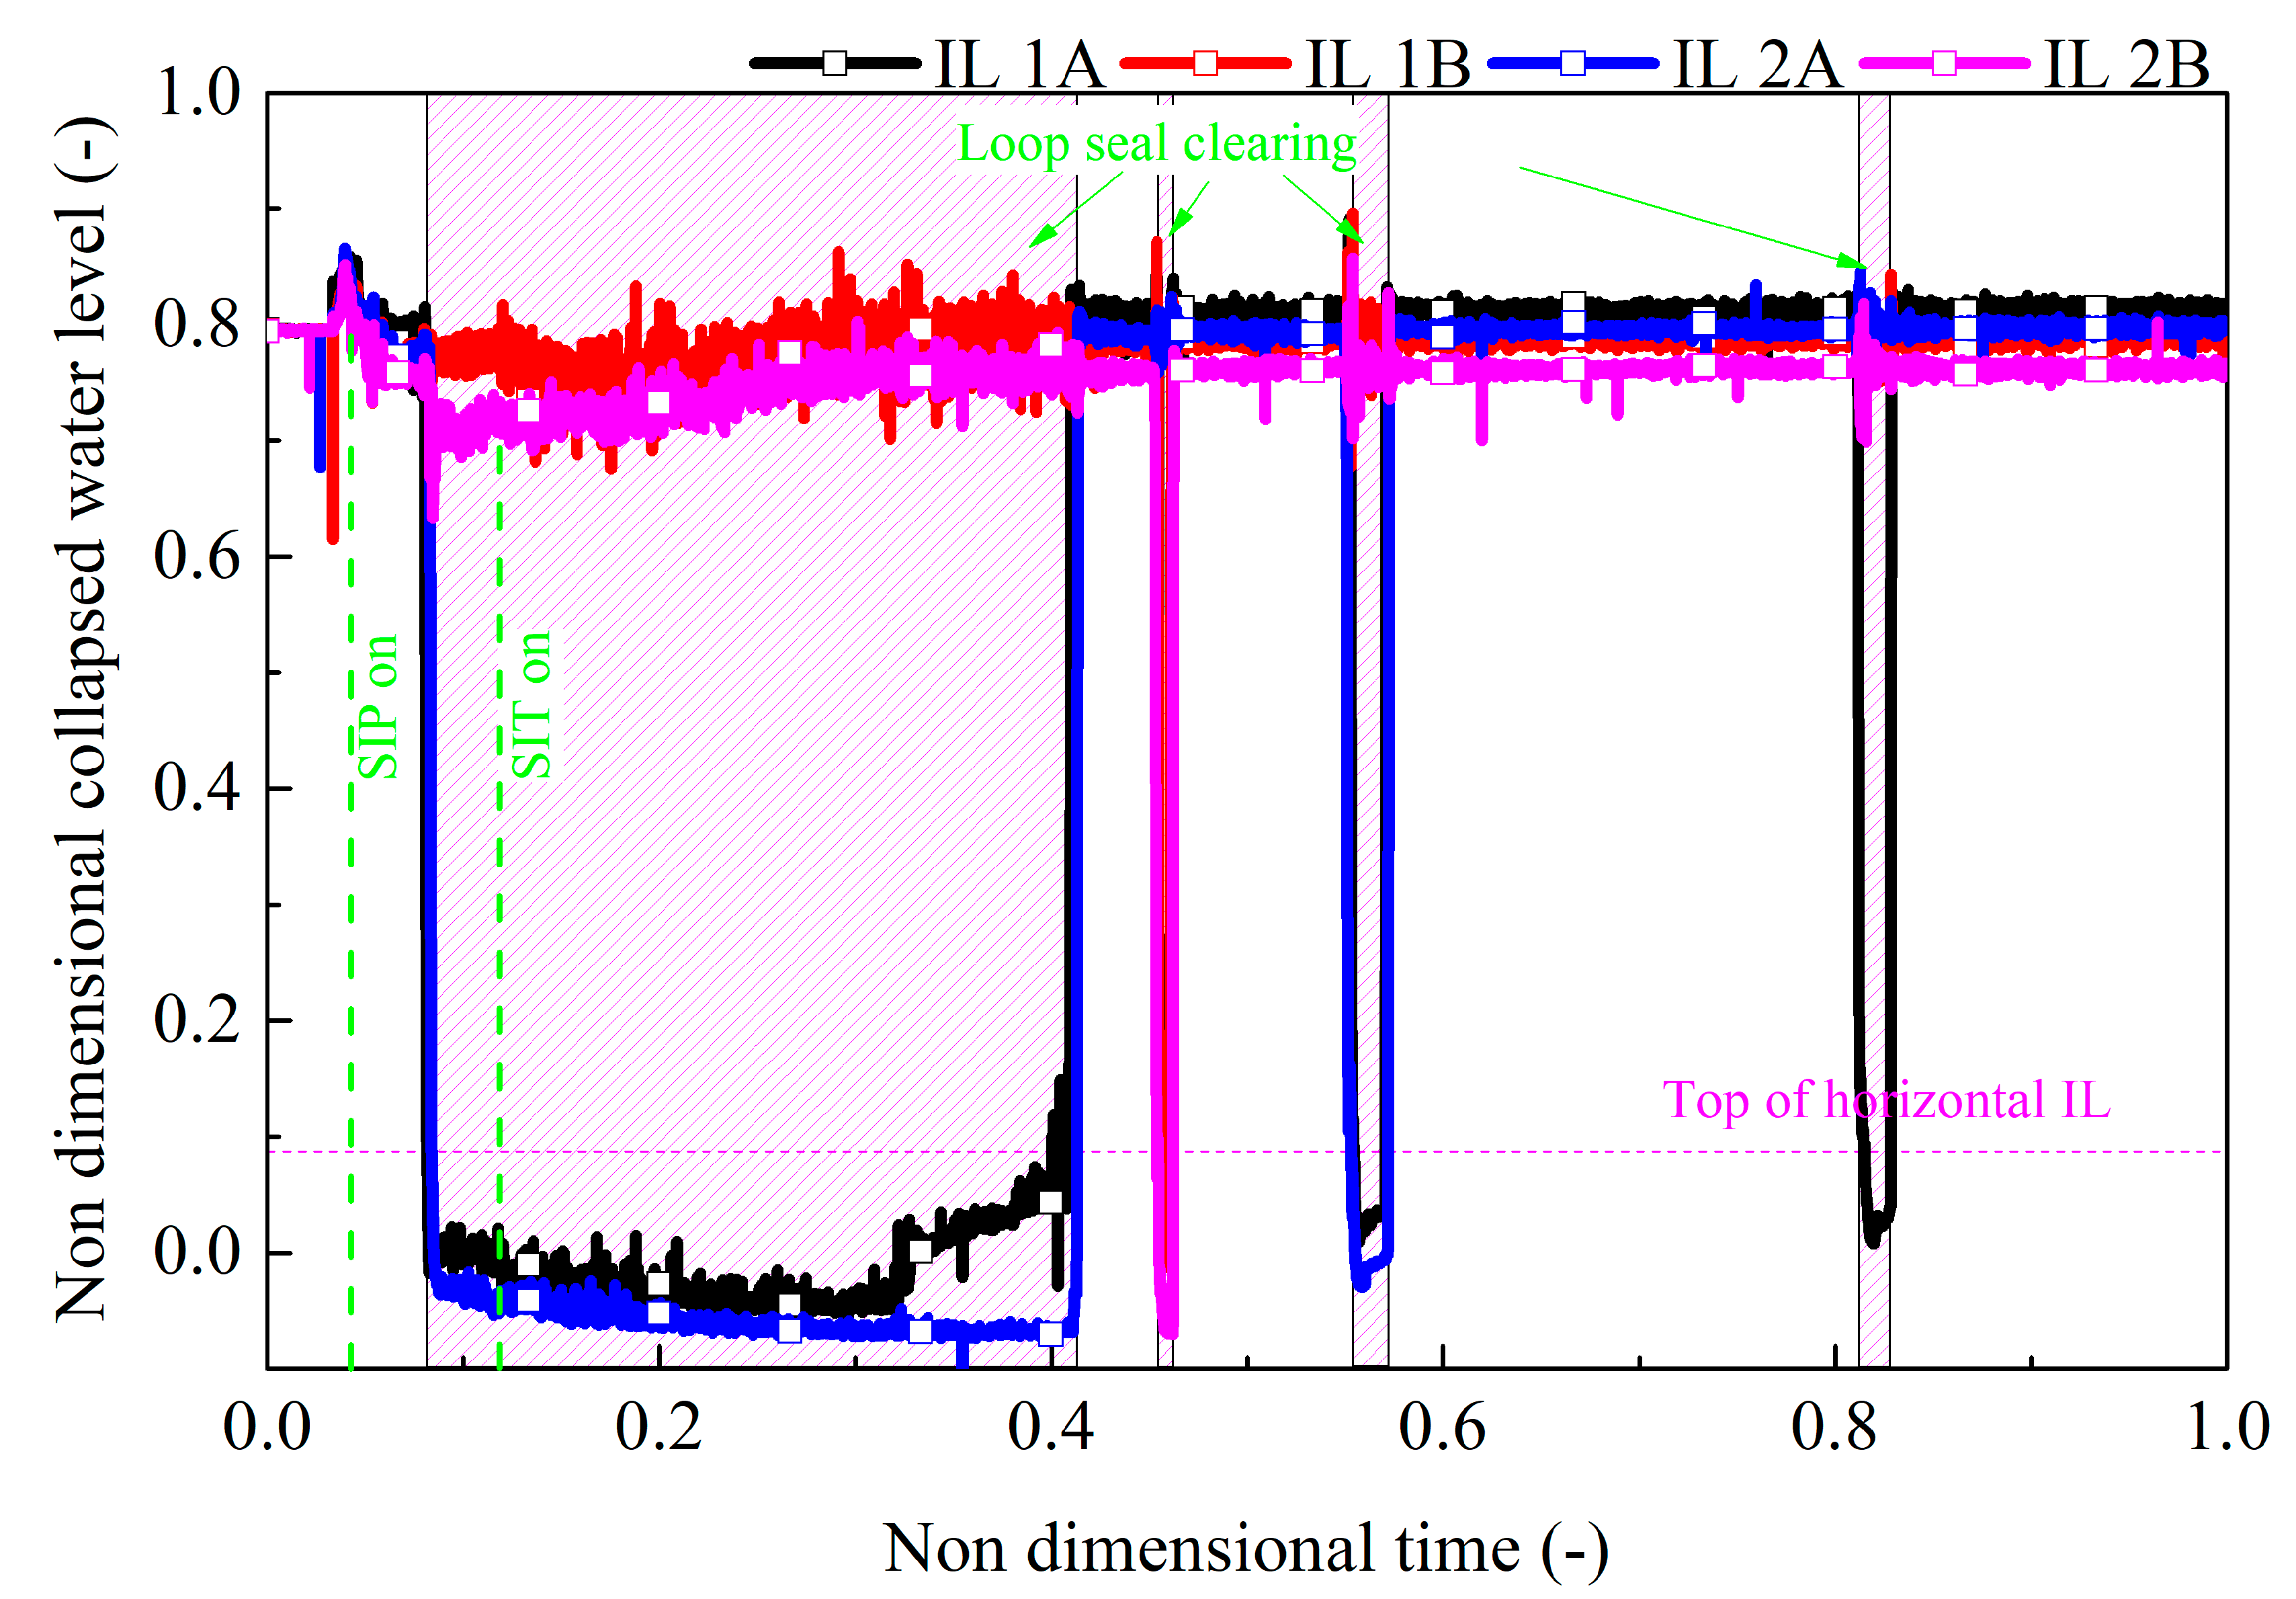
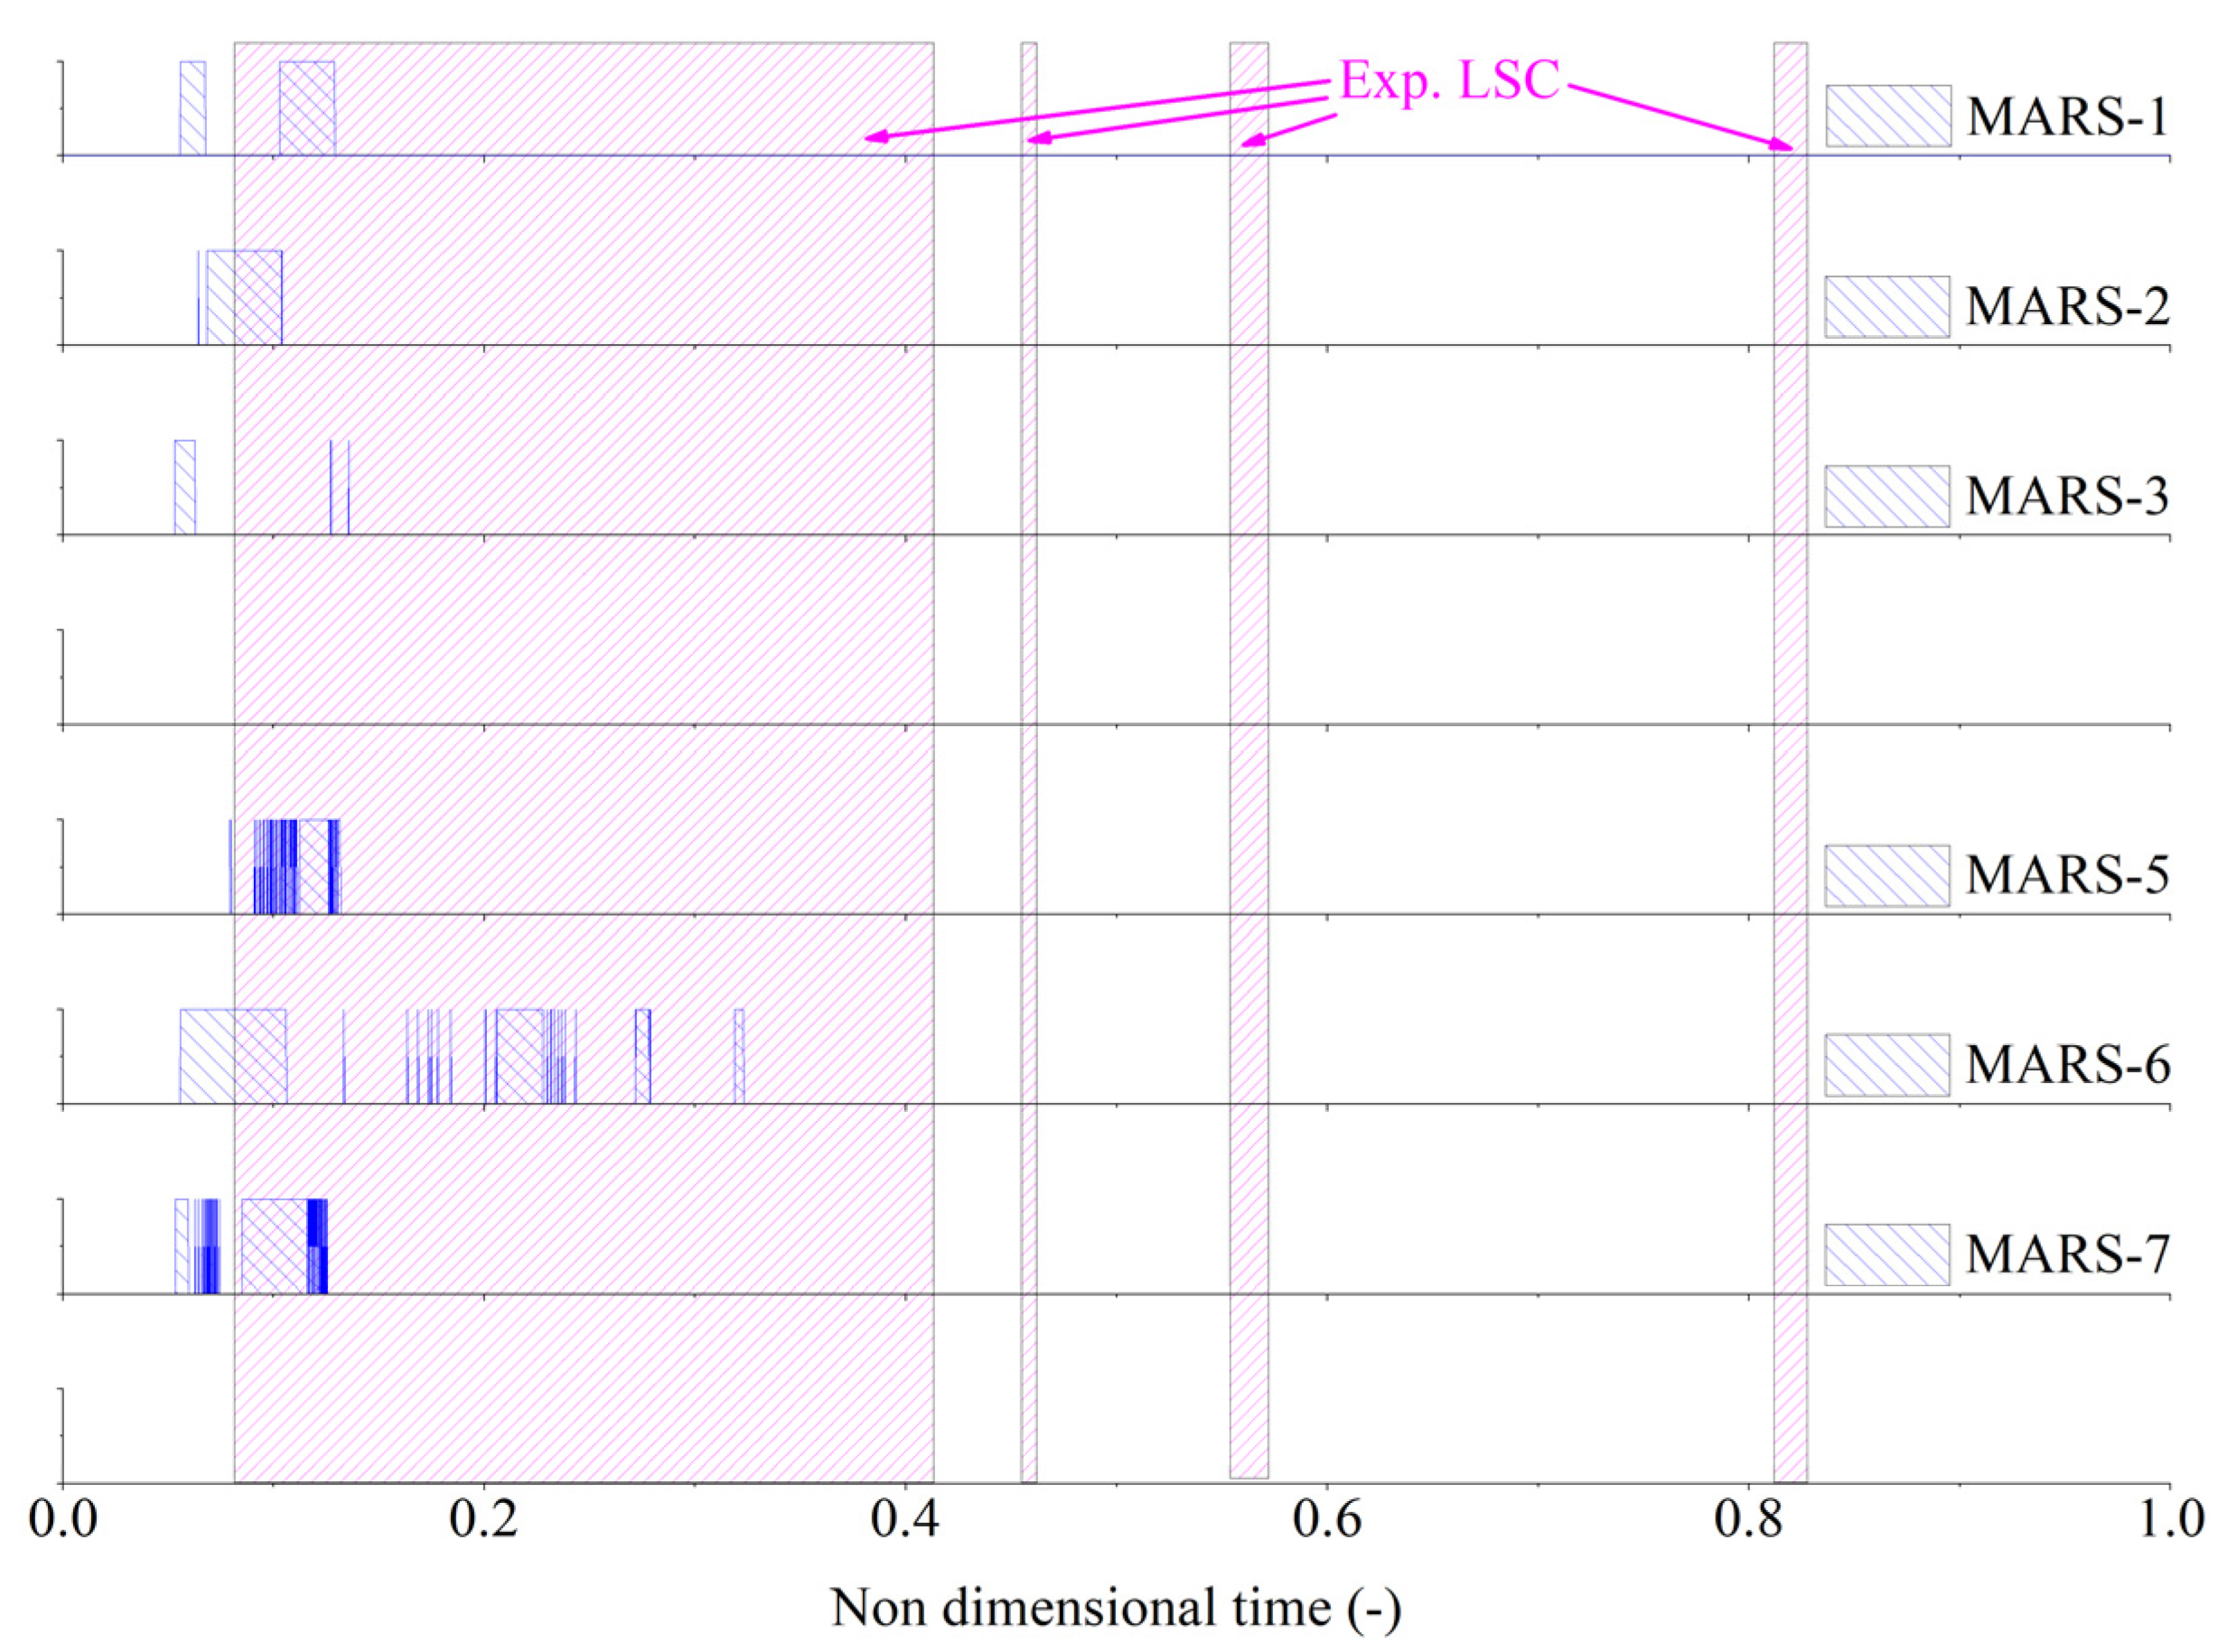
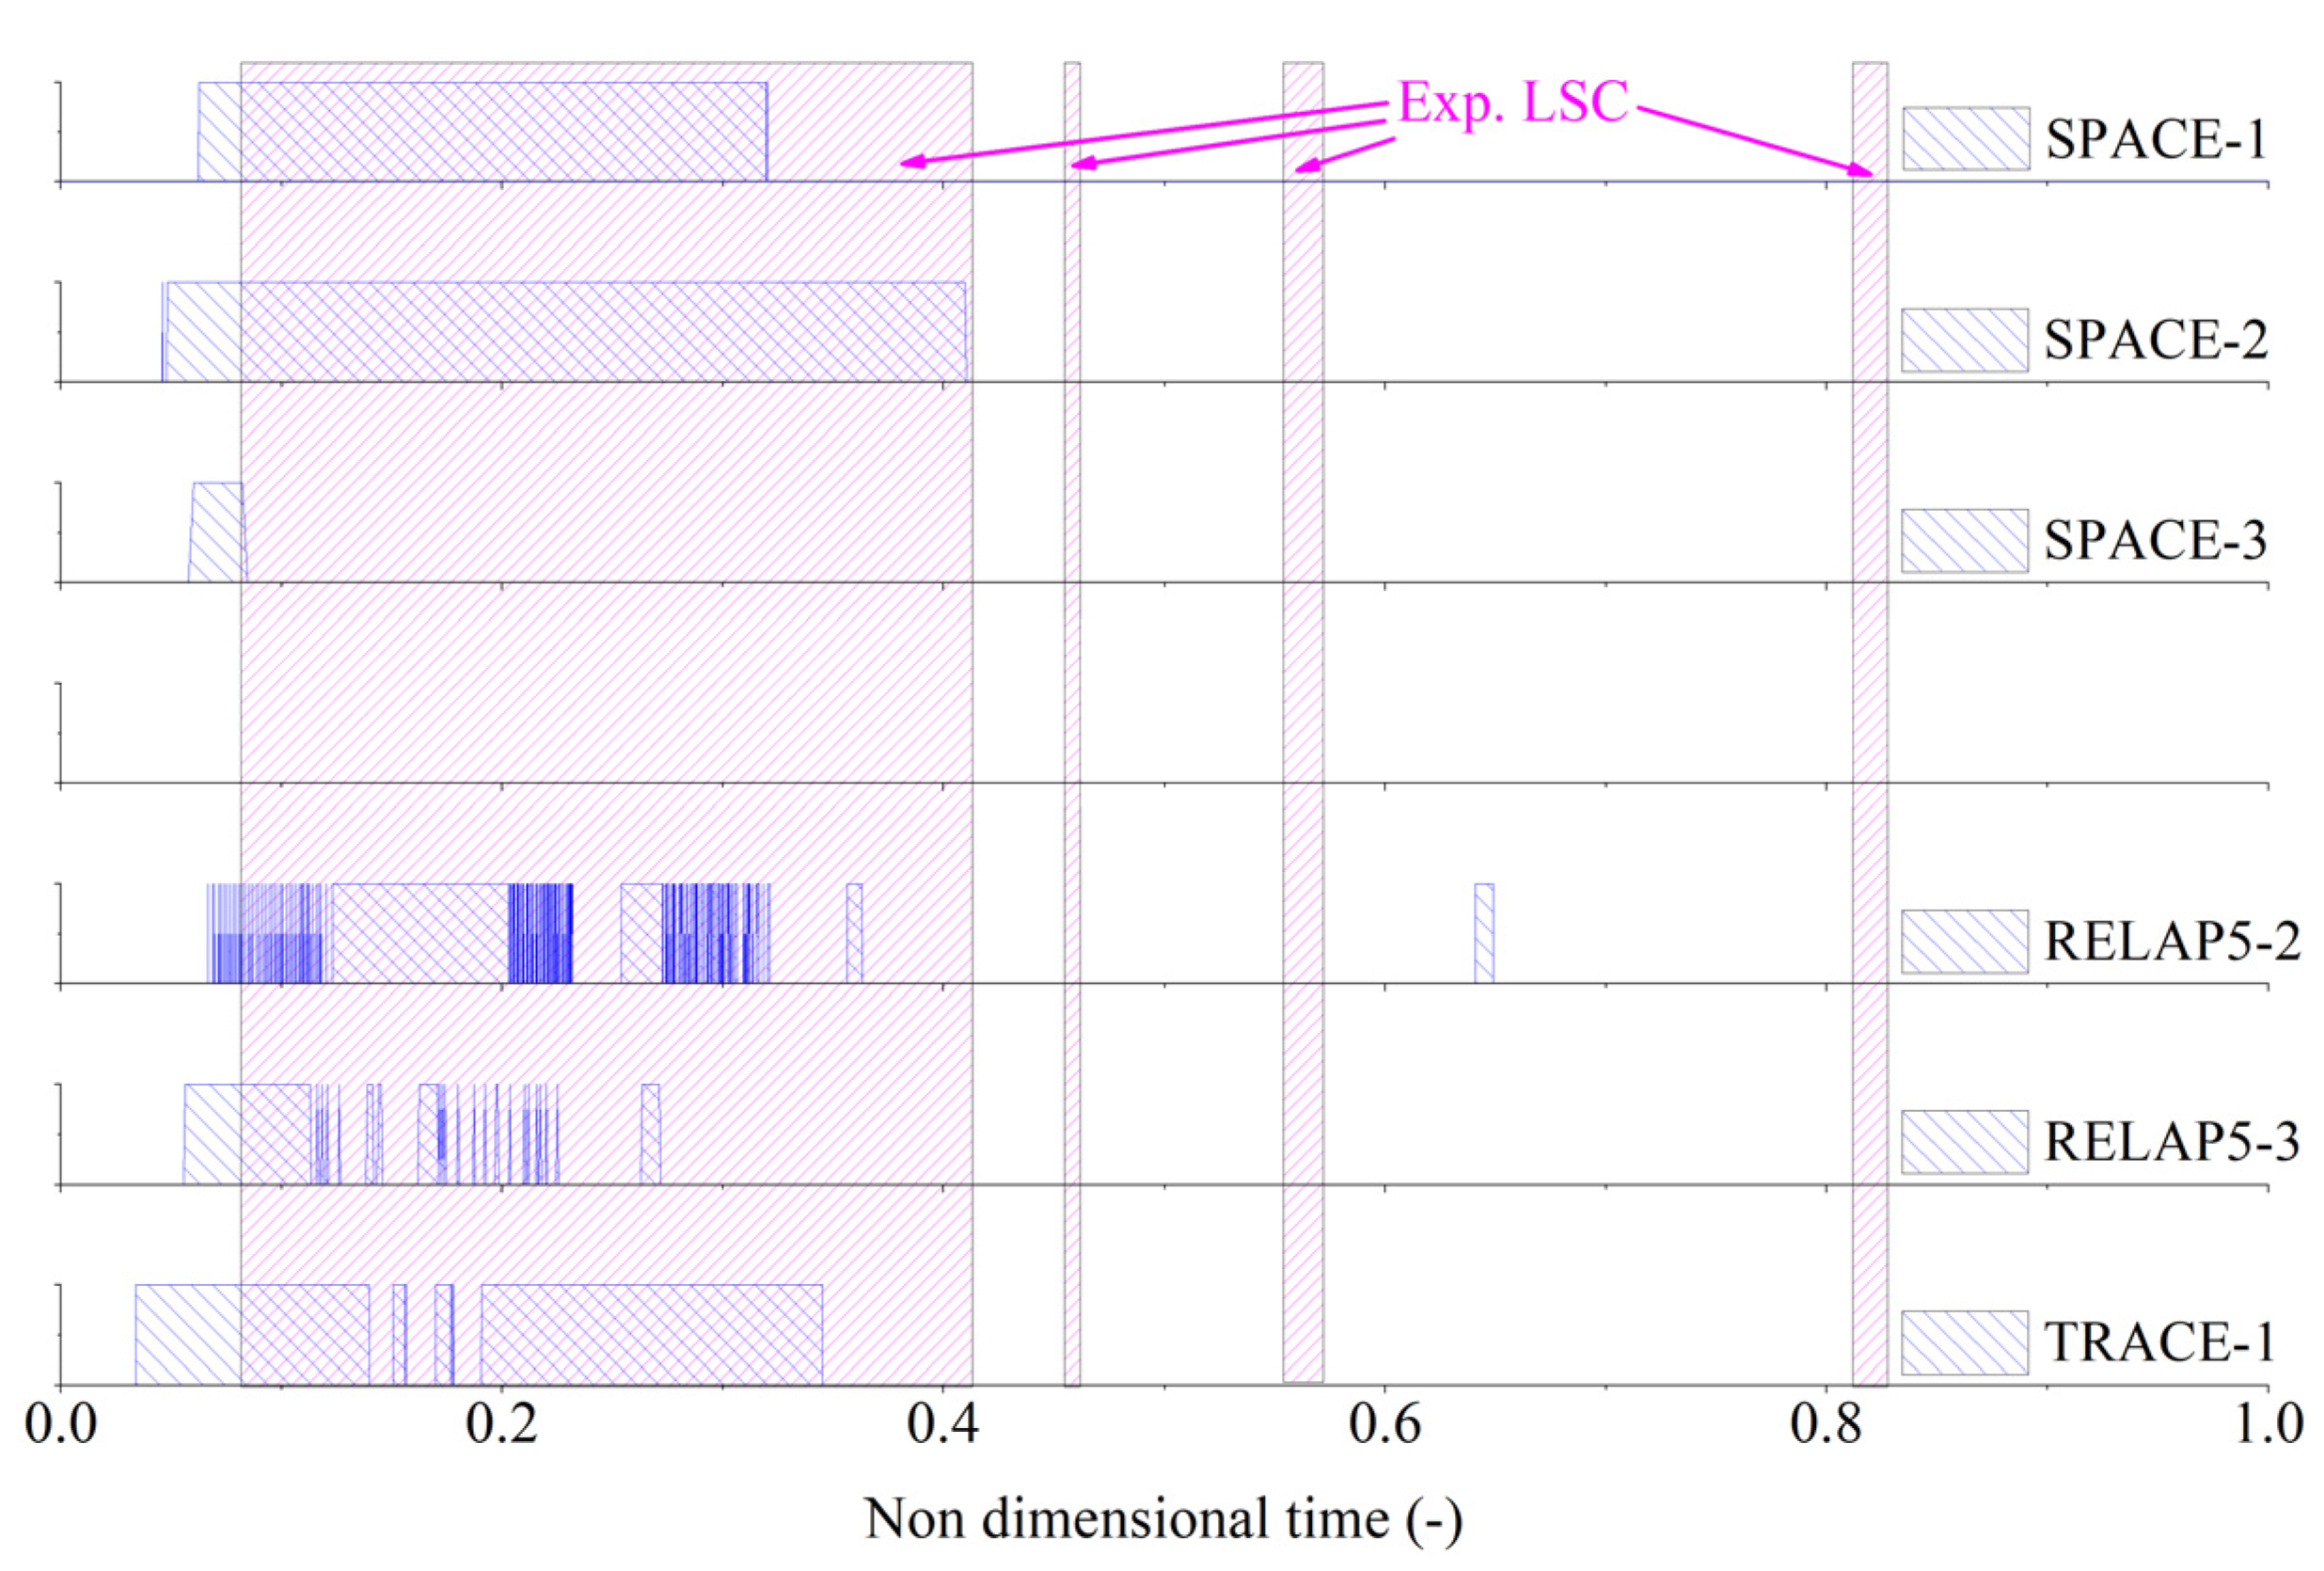
| Loop seal clearing | 0.081–0.410 (1A) 0.084–0.413 (2A) | |
| 0.455–0.461 (1A,1B) 0.455–0.462 (2B) | ||
| 0.554–0.571 (1A) 0.553–0.572 (2A) | ||
| 0.814–0.828 (1A) |
Publisher’s Note: MDPI stays neutral with regard to jurisdictional claims in published maps and institutional affiliations. |
© 2022 by the authors. Licensee MDPI, Basel, Switzerland. This article is an open access article distributed under the terms and conditions of the Creative Commons Attribution (CC BY) license (https://creativecommons.org/licenses/by/4.0/).
Share and Cite
Kim, J.; Bae, B.-U.; Park, Y.; Lee, J.B.; Choi, N.-H.; Cho, S.; Kang, K.-H. Comparison of Blind and Open Calculation Results for Top-Slot Break LOCA in Fourth ATLAS Domestic Standard Problem. Energies 2022, 15, 3189. https://doi.org/10.3390/en15093189
Kim J, Bae B-U, Park Y, Lee JB, Choi N-H, Cho S, Kang K-H. Comparison of Blind and Open Calculation Results for Top-Slot Break LOCA in Fourth ATLAS Domestic Standard Problem. Energies. 2022; 15(9):3189. https://doi.org/10.3390/en15093189
Chicago/Turabian StyleKim, Jongrok, Byoung-Uhn Bae, Yusun Park, Jae Bong Lee, Nam-Hyun Choi, Seok Cho, and Kyoung-Ho Kang. 2022. "Comparison of Blind and Open Calculation Results for Top-Slot Break LOCA in Fourth ATLAS Domestic Standard Problem" Energies 15, no. 9: 3189. https://doi.org/10.3390/en15093189
APA StyleKim, J., Bae, B.-U., Park, Y., Lee, J. B., Choi, N.-H., Cho, S., & Kang, K.-H. (2022). Comparison of Blind and Open Calculation Results for Top-Slot Break LOCA in Fourth ATLAS Domestic Standard Problem. Energies, 15(9), 3189. https://doi.org/10.3390/en15093189