
SST-Based Grid Reinforcement for Electromobility Integration in Distribution Grids

 , , , and
Abstract
:1. Introduction
2. Solid-State Transformer
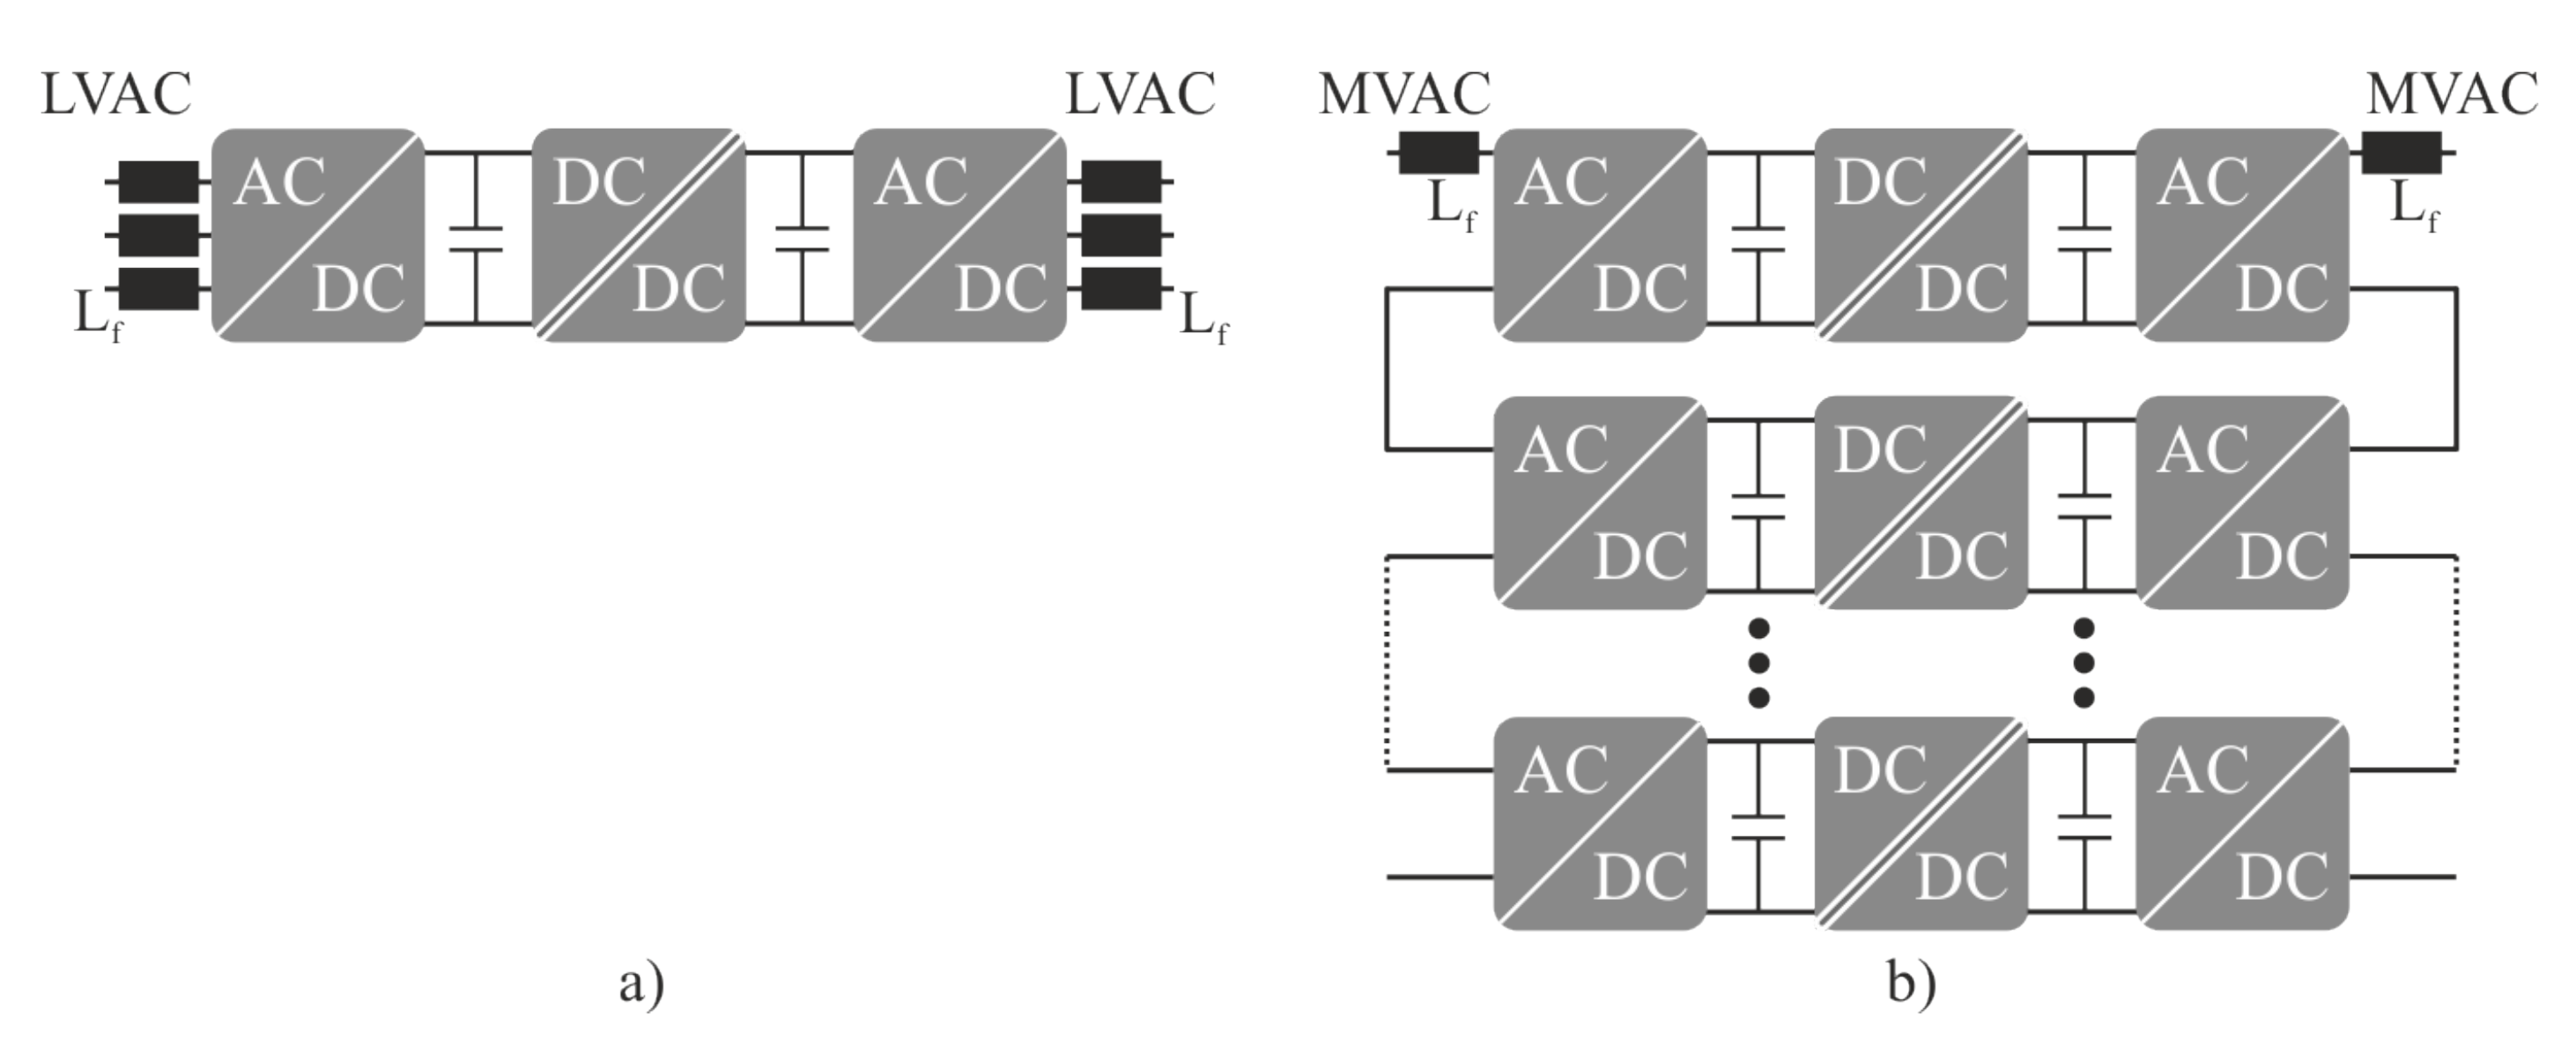
2.1. Topologies
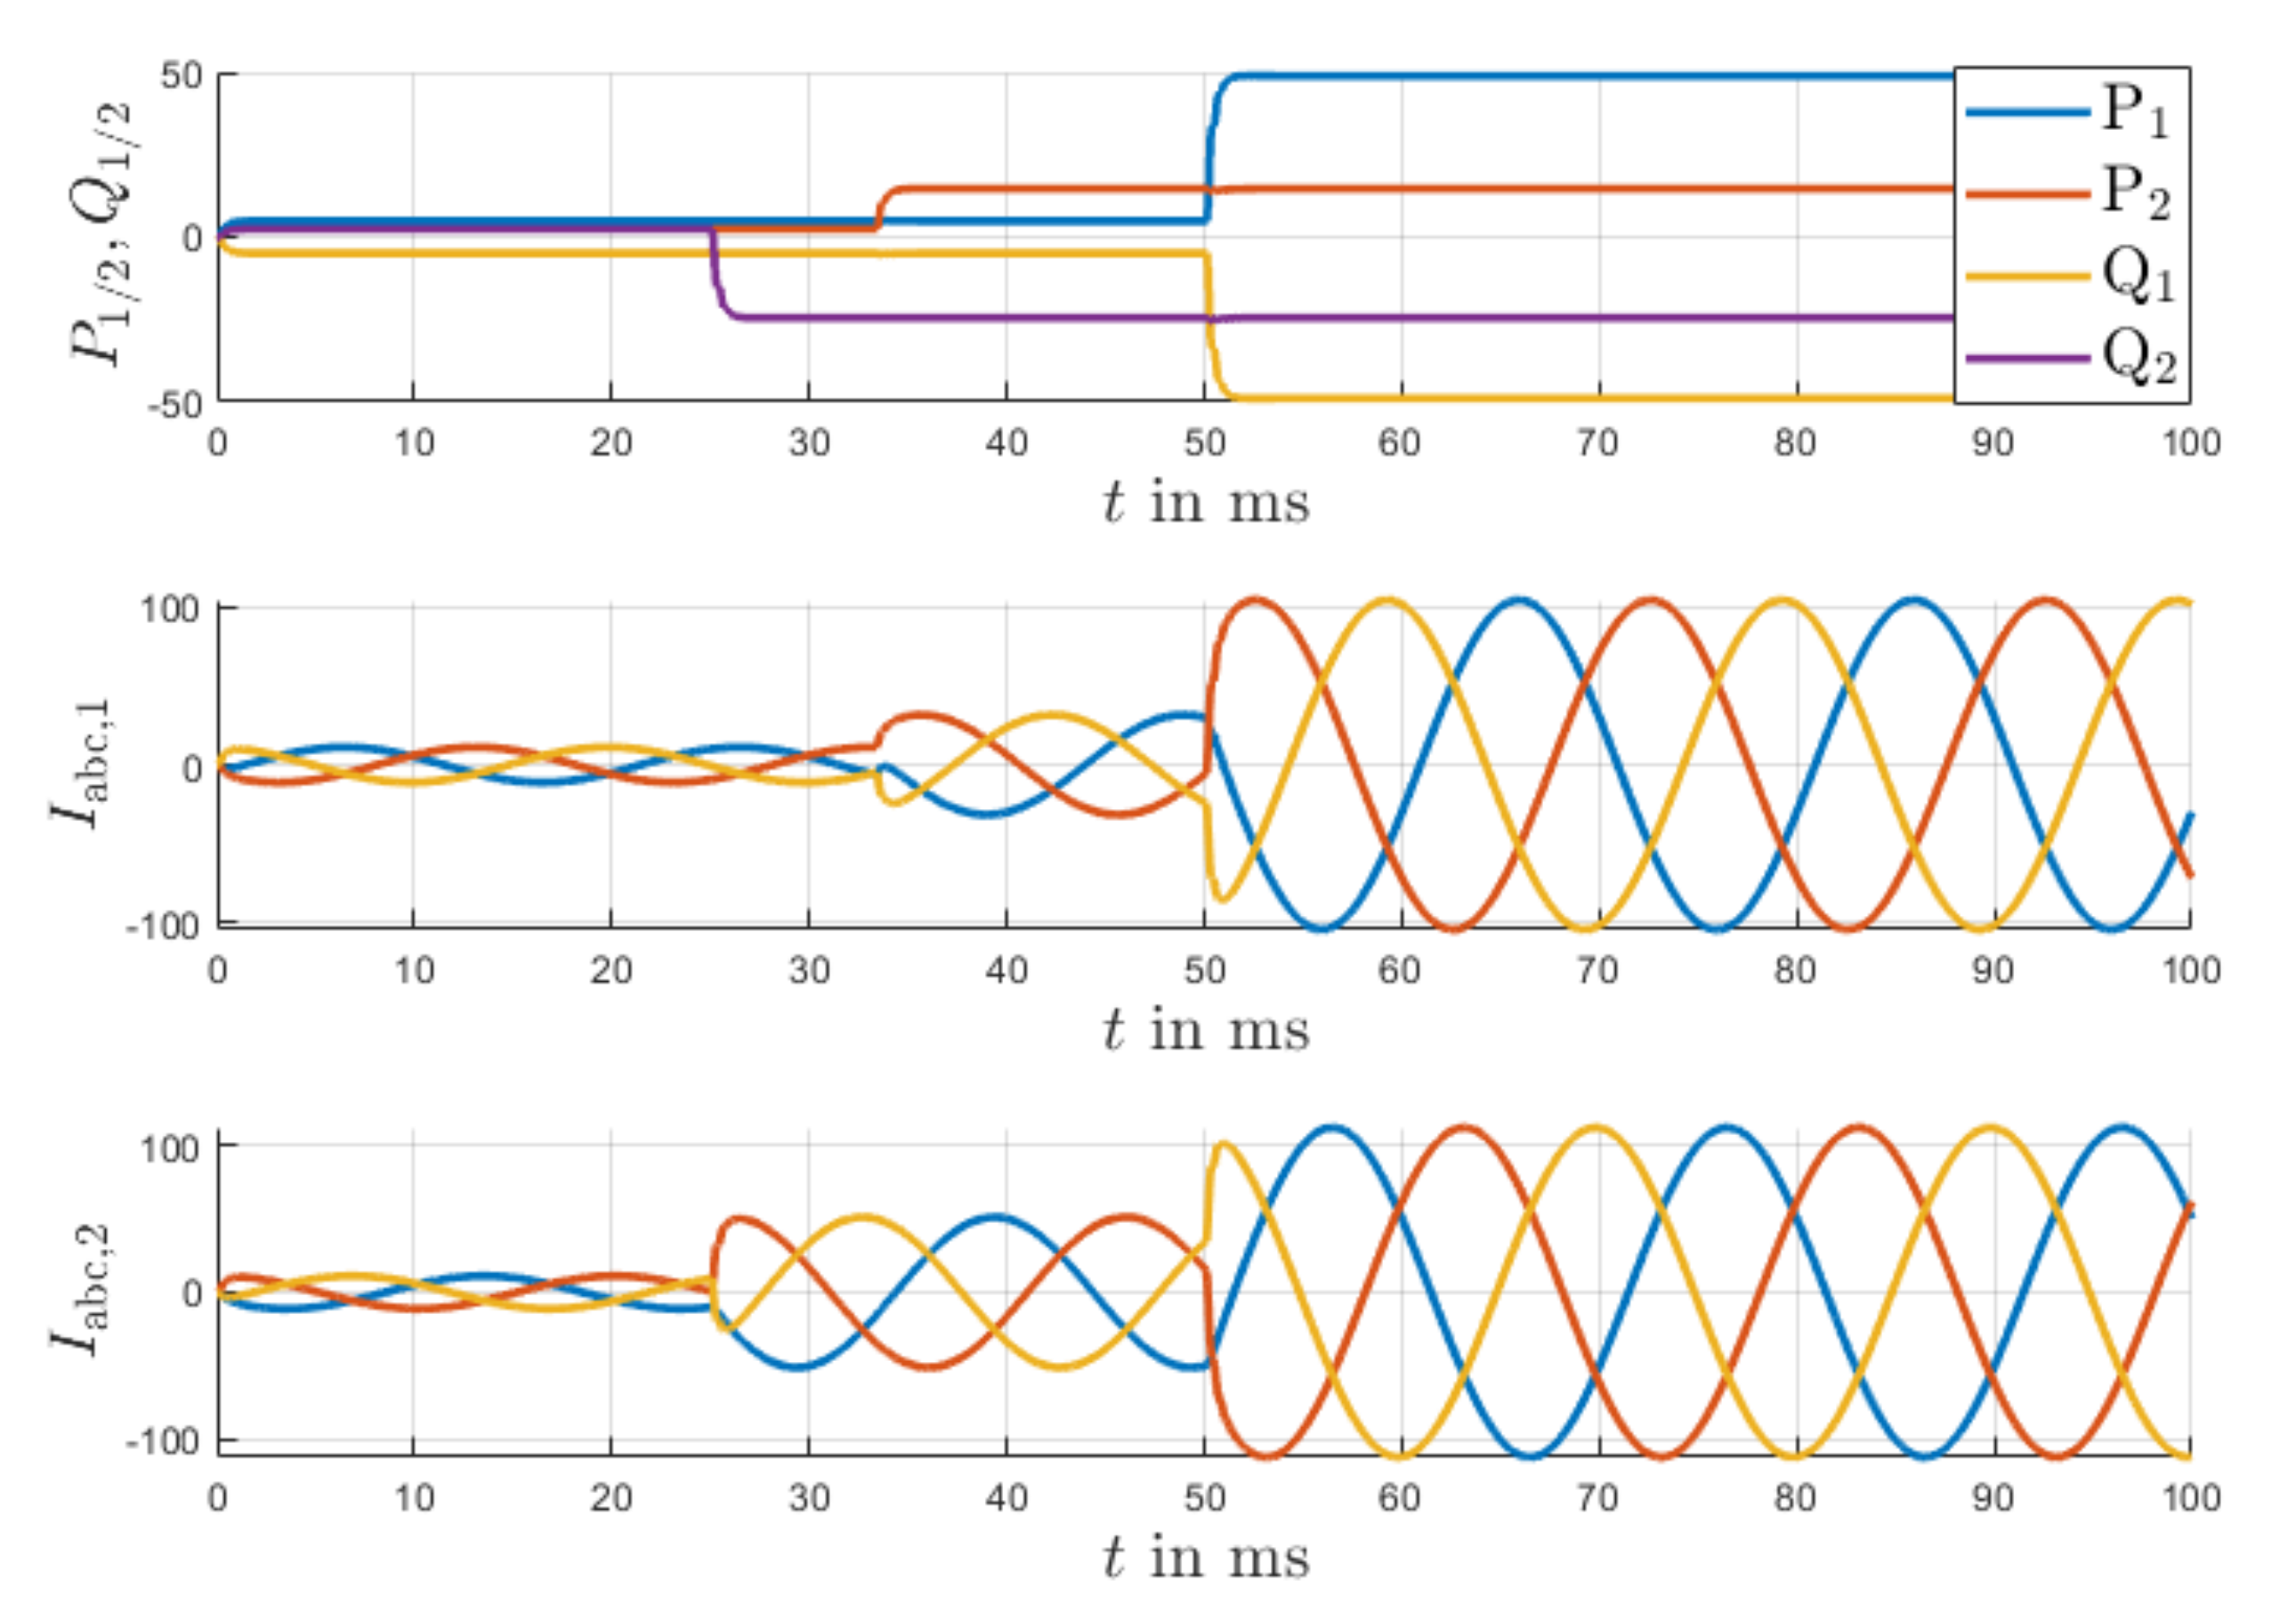
2.2. SST-Control
2.3. Equivalent Steady-State Model
3. Simulation Methodology
- 1.
- Base case (BC) scenario: Base load profile with 0% EV penetration and without any voltage control;
- 2.
- Uncontrolled charging (UC) scenario: Grid operator does not control EV charging loads nor takes any control actions to prevent the violation of grid stability limits. EV users charge at their convenience;
- 3.
- Controlled charging(CC) scenario: EV users adhere to a charging schedule that is determined based on distribution grid constraints.
4. Results
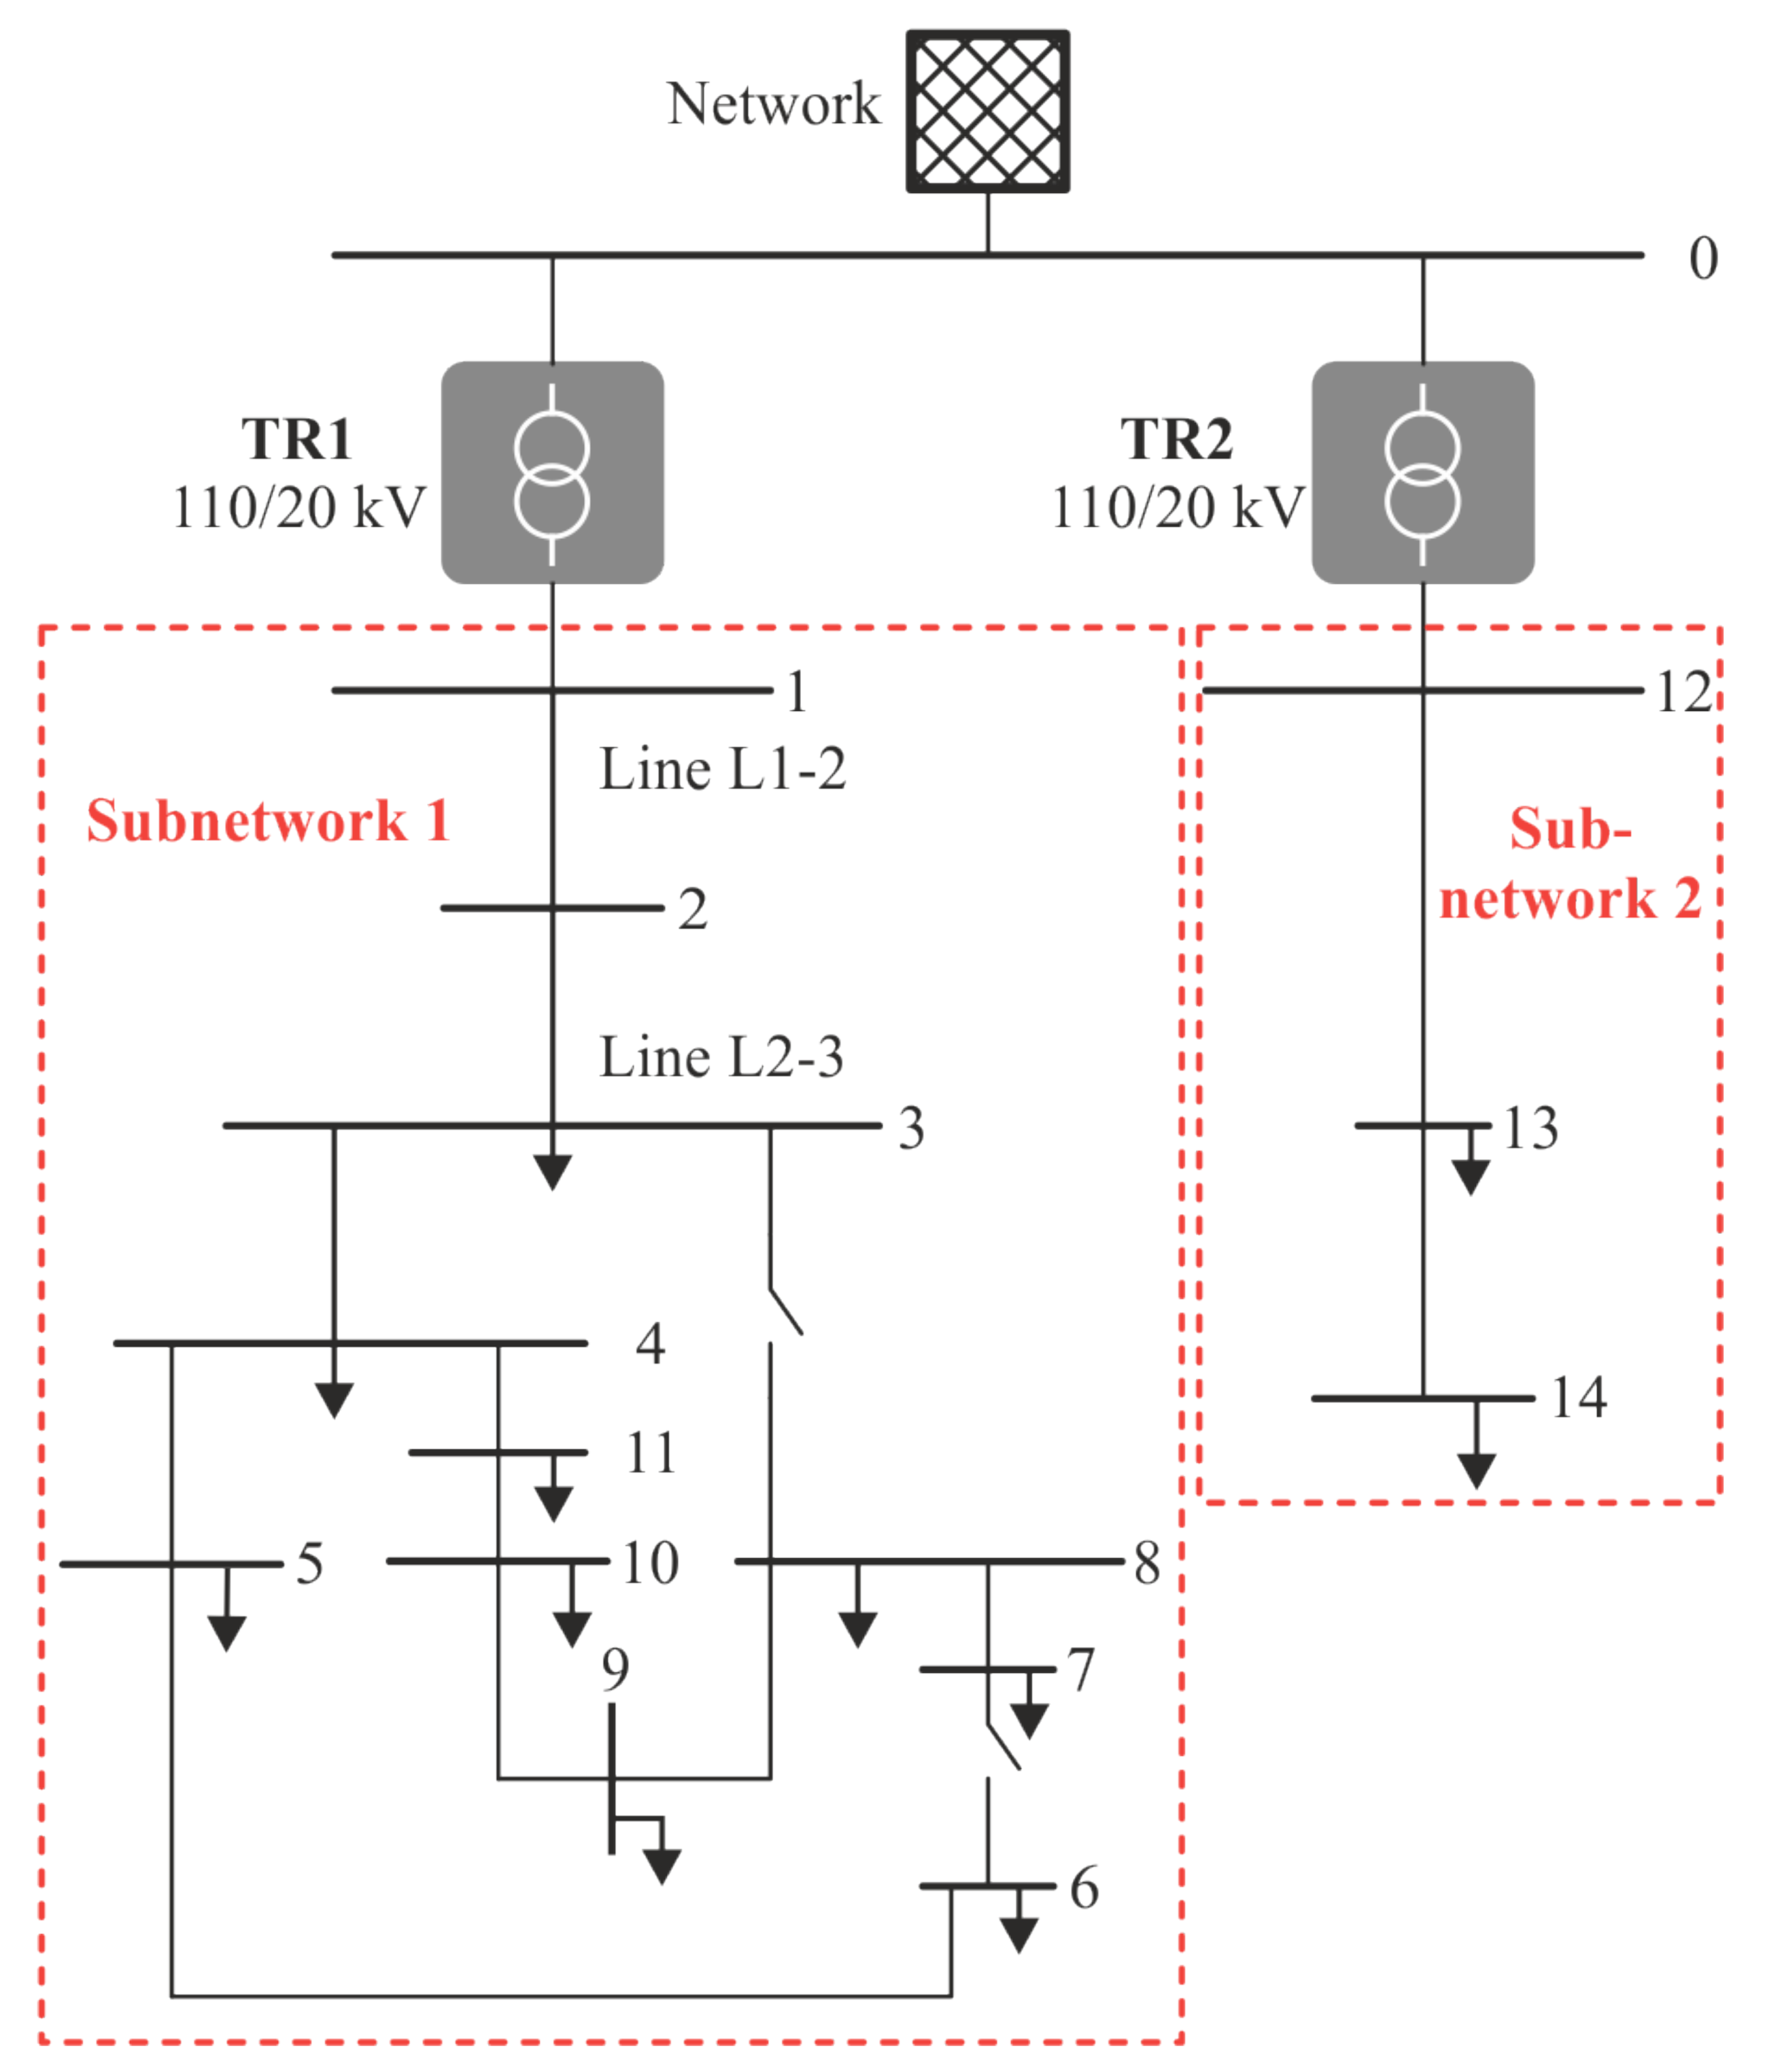
4.1. Medium-Voltage Distribution Grid
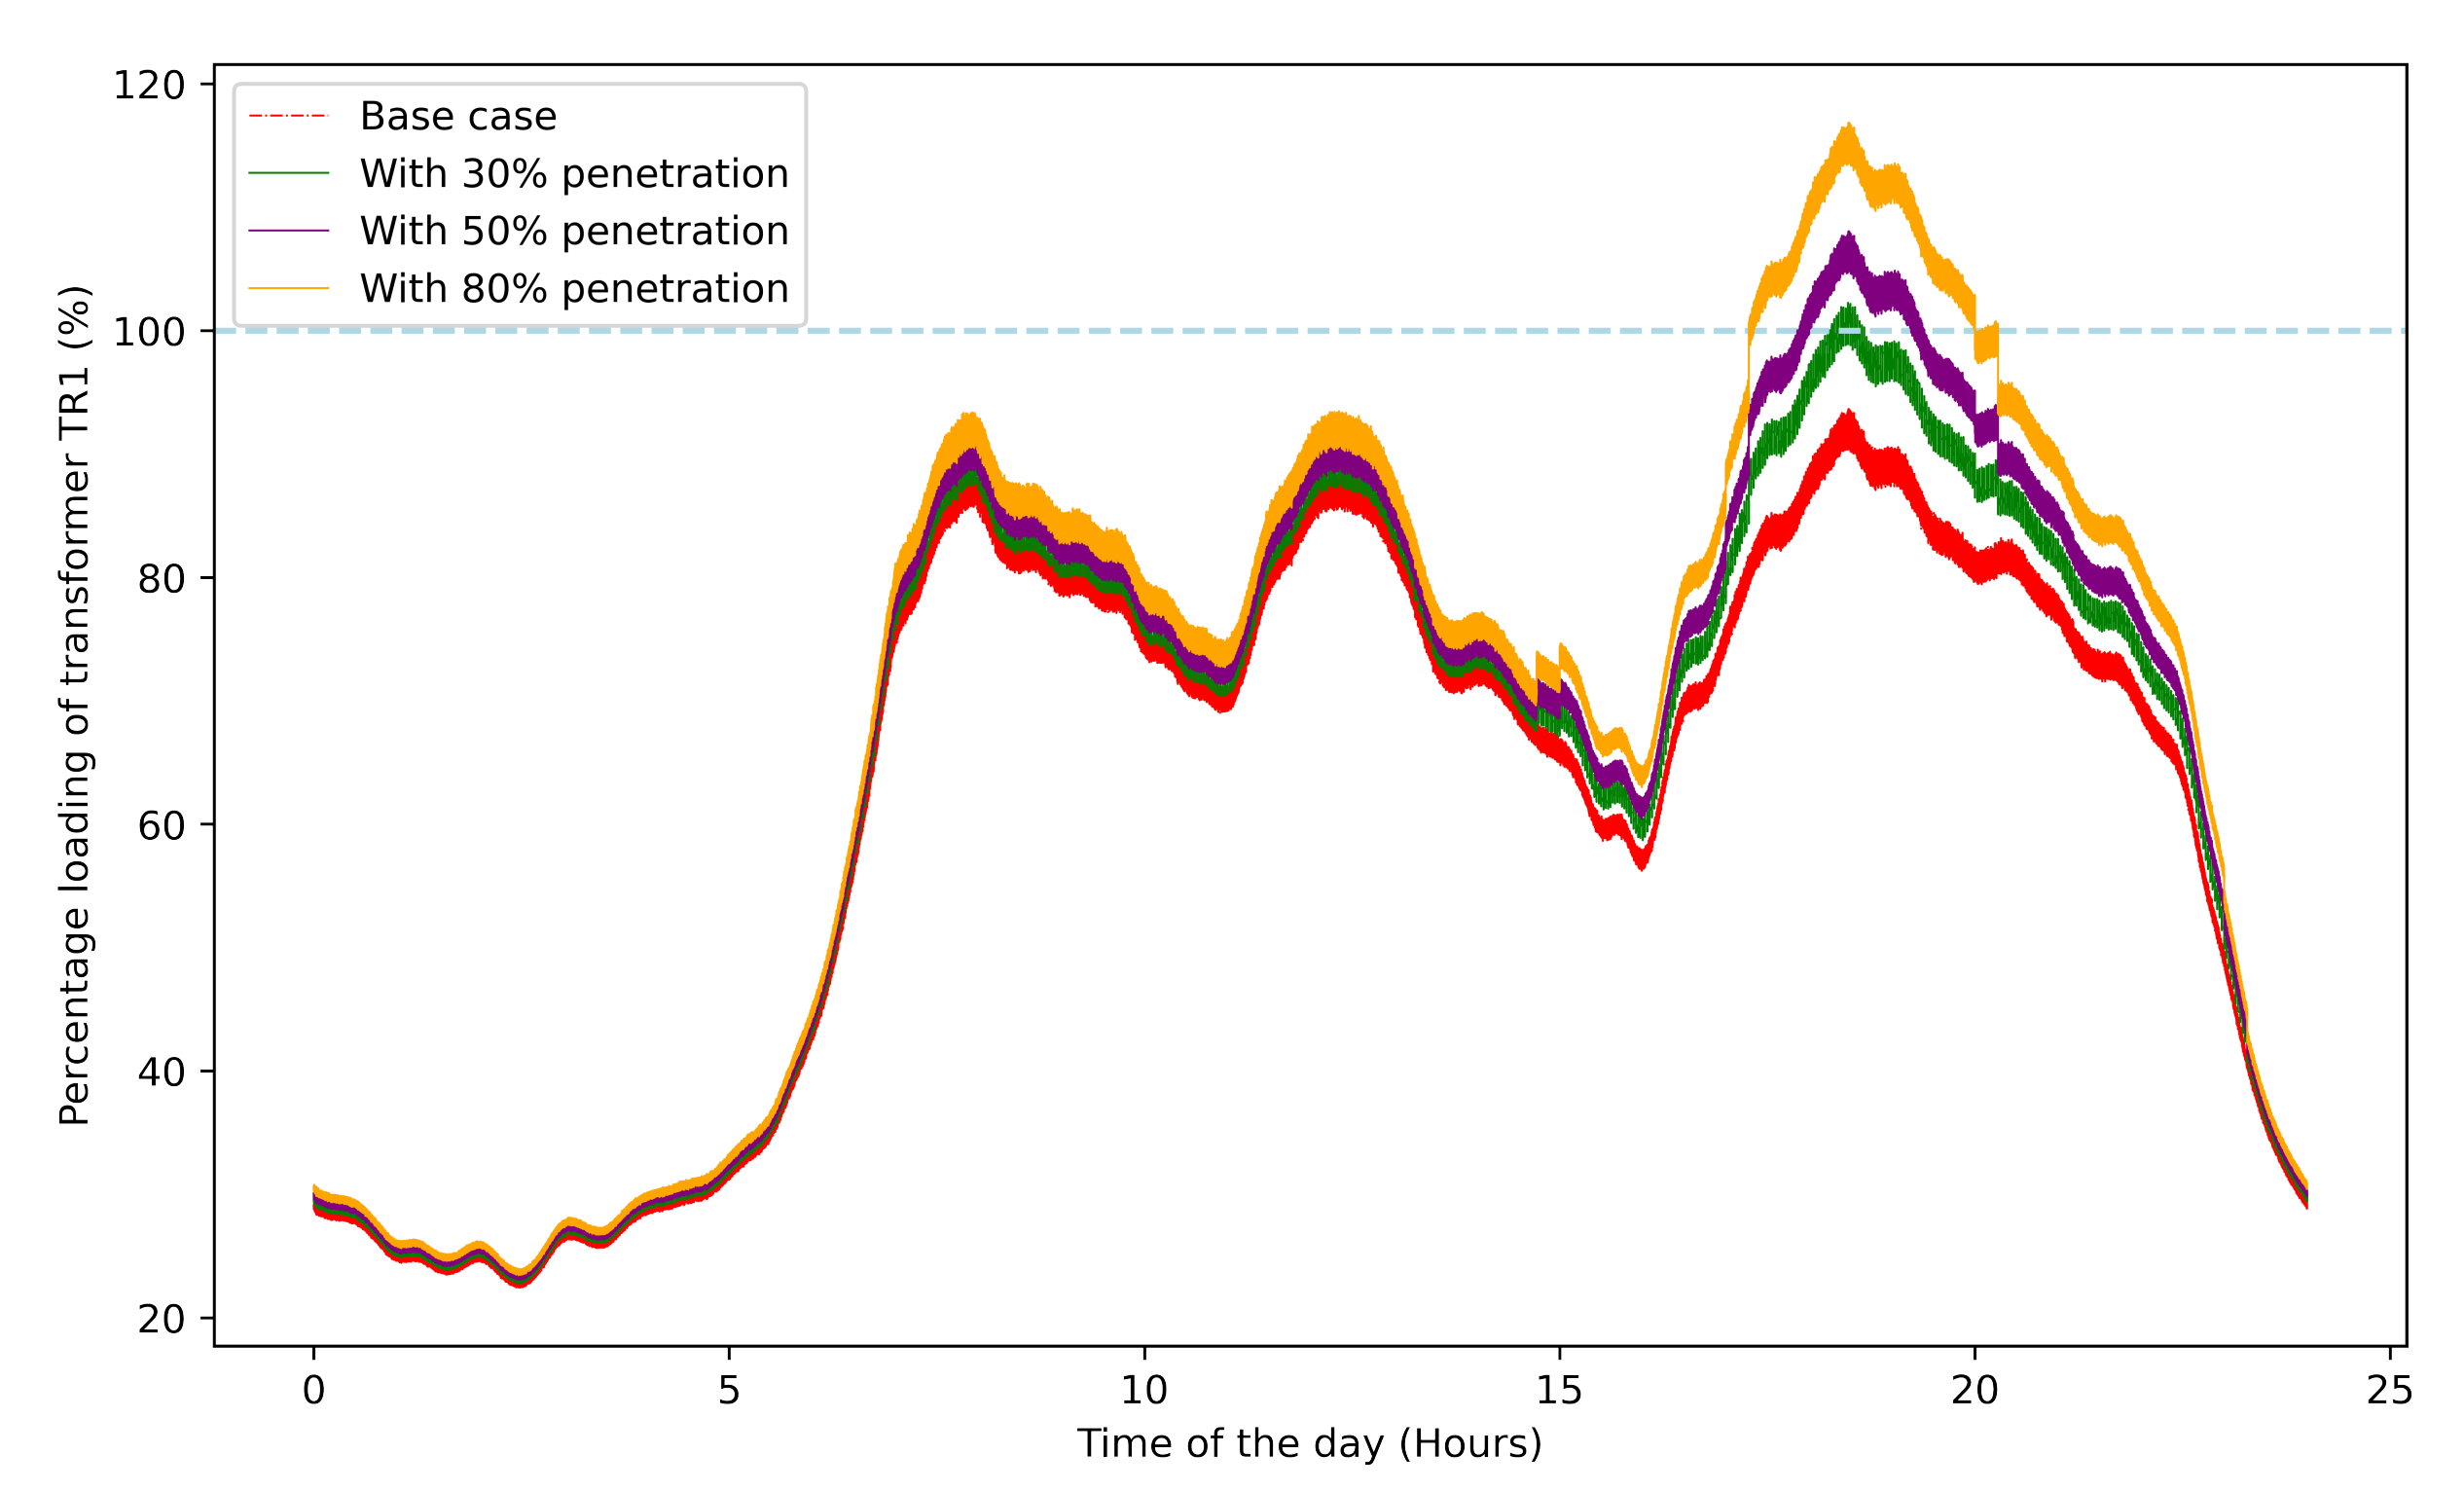
4.1.1. Uncontrolled Charging Scenario
4.1.2. Controlled Charging Scenario
4.2. Low-Voltage Distribution Grid
5. Discussion
6. Conclusions
Author Contributions
Funding
Institutional Review Board Statement
Informed Consent Statement
Data Availability Statement
Conflicts of Interest
Abbreviations
| AC | Alternating Current |
| AFE | Active Frond-End |
| BC | Base Case |
| CC | Controlled Charging |
| DAB | Dual-Active Bridge |
| DC | Direct Current |
| DSO | Distribution System Operator |
| EU | European Union |
| EV | Electric Vehicle |
| EVCS | Electric Vehicle Charging Station |
| IGBT | Insulated-Gate Bipolar Transistor |
| LV | Low Voltage |
| LVAC | Low Voltage Alternating Current |
| MOSFET | Metal–Oxide–Semiconductor Field-Effect Transistor |
| MVAC | Medium Voltage Alternating Current |
| MV | Medium Voltage |
| PLL | Phase-Locked-Loop |
| RMS | Root Mean Square |
| SST | Solid-State Transformer |
| ToU | Time of Use |
| THD | Total Harmonic Distortion |
| UC | Uncontrolled Charging |
| Active Power Set-point | |
| Reactive Power Set-point |
References
- United Nations Website. Available online: https://sdgs.un.org/documents/analysis-transport-relevance-each-21286 (accessed on 31 March 2022).
- Anastasiadis, A.G.; Kondylis, G.P.; Polyzakis, A.; Vokas, G. Effects of Increased Electric Vehicles into a Distribution Network. Technologies and Materials for Renewable Energy, Environment and Sustainability (TMREES). Energy Procedia 2019, 157, 586–593. [Google Scholar] [CrossRef]
- Jiang, Z.; Tian, H.; Beshir, M.J.; Vohra, S.; Mazloomzadeh, A. Analysis of Electric Vehicle Charging Impact on the Electric Power Grid: Based on Smart Grid Regional Demonstration Project—Los Angeles. In Proceedings of the 2016 IEEE PES Transmission Distribution Conference and Exposition-Latin America (PES T D-LA), Morelia, Mexico, 21–24 September 2016; pp. 1–5. [Google Scholar] [CrossRef]
- Dyke, K.J.; Schofield, N.; Barnes, M. The Impact of Transport Electrification on Electrical Networks. IEEE Trans. Ind. Electron. 2010, 57, 3917–3926. [Google Scholar] [CrossRef]
- Tong, X.; Guo, C.; Yang, X.; Chen, C. Research on Characteristics of Electric Vehicle Charging Load and Distribution Network Supportability. In Proceedings of the 2016 IEEE PES Asia-Pacific Power and Energy Engineering Conference (APPEEC), Xi’an, China, 25–28 October 2016; pp. 1539–1542. [Google Scholar] [CrossRef]
- Roe, C.; Farantatos, E.; Meisel, J.; Meliopoulos, A.P.; Overbye, T. Power System Level Impacts of PHEVs. In Proceedings of the 2009 42nd Hawaii International Conference on System Sciences, Washington, DC, USA, 5–8 January 2009; pp. 1–10. [Google Scholar] [CrossRef]
- Dubey, A.; Santoso, S. Electric Vehicle Charging on Residential Distribution Systems: Impacts and Mitigations. IEEE Access 2015, 3, 1871–1893. [Google Scholar] [CrossRef]
- Lopes, J.A.P.; Soares, F.J.; Almeida, P.M.R. Integration of Electric Vehicles in the Electric Power System. Proc. IEEE 2011, 99, 168–183. [Google Scholar] [CrossRef] [Green Version]
- Johansson, S.; Persson, J.; Lazarou, S.; Theocharis, A. Investigation of the Impact of Large-Scale Integration of Electric Vehicles for a Swedish Distribution Network. Energies 2019, 12, 4717. [Google Scholar] [CrossRef] [Green Version]
- Brinkel, N.; Schram, W.; AlSkaif, T.; Lampropoulos, I.; van Sark, W. Should We Reinforce The Grid? Cost and Emission Optimization of Electric Vehicle Charging under Different Transformer Limits. Appl. Energy 2020, 276, 115285. [Google Scholar] [CrossRef]
- Coignard, J.; MacDougall, P.; Stadtmueller, F.; Vrettos, E. Will Electric Vehicles Drive Distribution Grid Upgrades?: The Case of California. IEEE Electrif. Mag. 2019, 7, 46–56. [Google Scholar] [CrossRef]
- Mortimer, B.J.; Bach, A.D.; Hecht, C.; Sauer, D.U.; De Doncker, R.W. Public Charging Infrastructure in Germany—A Utilization and Profitability Analysis. J. Mod. Power Syst. Clean Energy 2021, 1–10. [Google Scholar] [CrossRef]
- Bunn, M.; Das, B.P.; Seet, B.C.; Baguley, C. Empirical Design Method for Distribution Transformer Utilization Optimization. IEEE Trans. Power Deliv. 2019, 34, 1803–1813. [Google Scholar] [CrossRef]
- Landes Energie Agentur Hessen GmbH. Ausbaustrategie der Ladeinfrastruktur zur Elektromobilität in Hessen. 2022. Available online: https://redaktion.hessen-agentur.de/publication/2022/3719_2022-02-22-Studie-Ladeinfrastruktur.pdf (accessed on 23 April 2022).
- Ferreira Costa, L.; De Carne, G.; Buticchi, G.; Liserre, M. The Smart Transformer: A Solid-state Transformer Tailored to Provide Ancillary Services to the Distribution Grid. IEEE Power Electron. Mag. 2017, 4, 56–67. [Google Scholar] [CrossRef] [Green Version]
- Zhu, R.; Liserre, M. Continuous Operation of Smart Transformer-fed Distribution Grid with Single-phase Faults. In Proceedings of the 2018 IEEE Energy Conversion Congress and Exposition (ECCE), Portland, ON, USA, 23–27 September 2018; pp. 458–464. [Google Scholar] [CrossRef]
- Chen, Q.; Liu, N.; Hu, C.; Wang, L.; Zhang, J. Autonomous Energy Management Strategy for Solid-State Transformer to Integrate PV-Assisted EV Charging Station Participating. IEEE Trans. Ind. Inform. 2017, 13, 258–269. [Google Scholar] [CrossRef]
- She, X.; Huang, A.Q.; Burgos, R. Review of Solid-State Transformer Technologies and Their Application in Power Distribution Systems. IEEE J. Emerg. Sel. Top. Power Electron. 2013, 1, 186–198. [Google Scholar] [CrossRef]
- Falcones, S.; Mao, X.; Ayyanar, R. Topology Comparison for Solid State Transformer Implementation. In Proceedings of the IEEE PES General Meeting, Minneapolis, MN, USA, 25–29 July 2010; pp. 1–8. [Google Scholar] [CrossRef]
- Ruiz, F.; Perez, M.A.; Espinosa, J.R.; Gajowik, T.; Stynski, S.; Malinowski, M. Surveying Solid-State Transformer Structures and Controls: Providing Highly Efficient and Controllable Power Flow in Distribution Grids. IEEE Ind. Electron. Mag. 2020, 14, 56–70. [Google Scholar] [CrossRef]
- Zhao, T.; Wang, G.; Bhattacharya, S.; Huang, A.Q. Voltage and Power Balance Control for a Cascaded H-Bridge Converter-Based Solid-State Transformer. IEEE Trans. Power Electron. 2013, 28, 1523–1532. [Google Scholar] [CrossRef]
- Raju, R.; Dame, M.; Steigerwald, R. Solid-state Transformers Using Silicon Carbide-based Modular Building Blocks. In Proceedings of the 2017 IEEE 12th International Conference on Power Electronics and Drive Systems (PEDS), Honolulu, HI, USA, 12–15 December 2017; pp. 1–7. [Google Scholar] [CrossRef]
- Zang, J.; Wang, J.; Zhang, J.; Zhou, J. Overview of Grounding Schemes for Solid-state Transformers in Distribution Networks. IET Gener. Transm. Distrib. 2021, 15, 3081–3099. [Google Scholar] [CrossRef]
- De Doncker, R.; Divan, D.; Kheraluwala, M. A Three-phase Soft-switched High-power-density DC/DC Converter for High-power Applications. IEEE Trans. Ind. Appl. 1991, 27, 63–73. [Google Scholar] [CrossRef]
- Isobe, T.; Tadano, H.; He, Z.; Zou, Y. Control of solid-state-transformer for minimized energy storage capacitors. In Proceedings of the 2017 IEEE Energy Conversion Congress and Exposition (ECCE), Cincinnati, OH, USA, 1–5 October 2017; pp. 3809–3815. [Google Scholar] [CrossRef]
- De Carne, G.; Langwasser, M.; Ndreko, M.; Bachmann, R.; De Doncker, R.W.; Dimitrovski, R.; Mortimer, B.J.; Neufeld, A.; Rojas, F.; Liserre, M. Which Deepness Class Is Suited for Modeling Power Electronics?: A Guide for Choosing the Right Model for Grid-Integration Studies. IEEE Ind. Electron. Mag. 2019, 13, 41–55. [Google Scholar] [CrossRef]
- Van Der Broeck, C.H.; Richter, S.A.; Bloh, J.V.; De Doncker, R.W. Methodology for Analysis and Design of Discrete Time Current Controllers for Three-phase PWM Converters. CPSS Trans. Power Electron. Appl. 2018, 3, 254–264. [Google Scholar] [CrossRef]
- DPsim Documentation. Available online: https://dpsim.fein-aachen.org/docs/ (accessed on 31 March 2022).
- Mirz, M.; Vogel, S.; Reinke, G.; Monti, A. DPsim—A Dynamic Phasor Real-time Simulator for Power Systems. SoftwareX 2019, 10, 100253. [Google Scholar] [CrossRef]
- CIMpy Documentation. Available online: https://acs.pages.rwth-aachen.de/public/cim/cimpy/index.html (accessed on 31 March 2022).
- IEC 61970-552; Energy Management System Application Program interface (EMS-API)—Part 552: CIM XML Model Exchange Format. International Electrotechnical Commission: Geneva, Switzerland, 2016.
- Chophel, U.; Joglekar, C.; Ponci, F.; Wangdee, W.; Monti, A. A Simulation Setup for Analyzing Mitigation Methods for Reducing the Impact of Extensive EV Penetration in the Distribution Network. In Proceedings of the 2021 IEEE PES Innovative Smart Grid Technologies Europe (ISGT Europe), Espoo, Finland, 18–21 October 2021; pp. 01–05. [Google Scholar] [CrossRef]
- Gaete-Morales, C.; Kramer, H.; Schill, W.P.; Zerrahn, A. An Open Tool for Creating Battery-electric Vehicle Time Series from Empirical Data, emobpy. Sci. Data 2021, 8, 152. [Google Scholar] [CrossRef]
- IEEE Std C57. 91-2011; IEEE Guide for Loading Mineral-Oil-Immersed Transformers and Step-Voltage Regulators. Institute of Electrical and Electronics Engineers (IEEE): New York, NY, USA, 7 March 2012. [Google Scholar]
- Markiewicz, H.; Klajn, A. Voltage Disturbances Standard EN 50160—Voltage Characteristics in Public Distribution Systems. Available online: https://www.evm.ua/image/catalog/uslugi/standart-en-50160.pdf (accessed on 26 April 2022).
- Rudion, K.; Orths, A.; Styczynski, Z.A.; Strunz, K. Design of Benchmark of Medium Voltage Distribution Network for Investigation of DG Integration. In Proceedings of the 2006 IEEE Power Engineering Society General Meeting, Montreal, QC, Canada, 8–22 June 2006; p. 6. [Google Scholar] [CrossRef]
- Chophel, U. Grid Friendly Integration of Electric Vehicle Charging Stations in the Distribution Network. Master’s Thesis, RWTH Aachen University, Aachen, Germany, 2021. [Google Scholar]
- Schneider, K.P.; Mather, B.A.; Pal, B.C.; Ten, C.W.; Shirek, G.J.; Zhu, H.; Fuller, J.C.; Pereira, J.L.R.; Ochoa, L.F.; de Araujo, L.R.; et al. Analytic Considerations and Design Basis for the IEEE Distribution Test Feeders. IEEE Trans. Power Syst. 2018, 33, 3181–3188. [Google Scholar] [CrossRef]
- Nobis, C.; Kuhnimhof, T.; Mobilität in Deutschland—MiD: Ergebnisbericht. Technical Report. 2018. Available online: https://elib.dlr.de/125879/1/MiD2017_Ergebnisbericht.pdf (accessed on 26 April 2022).


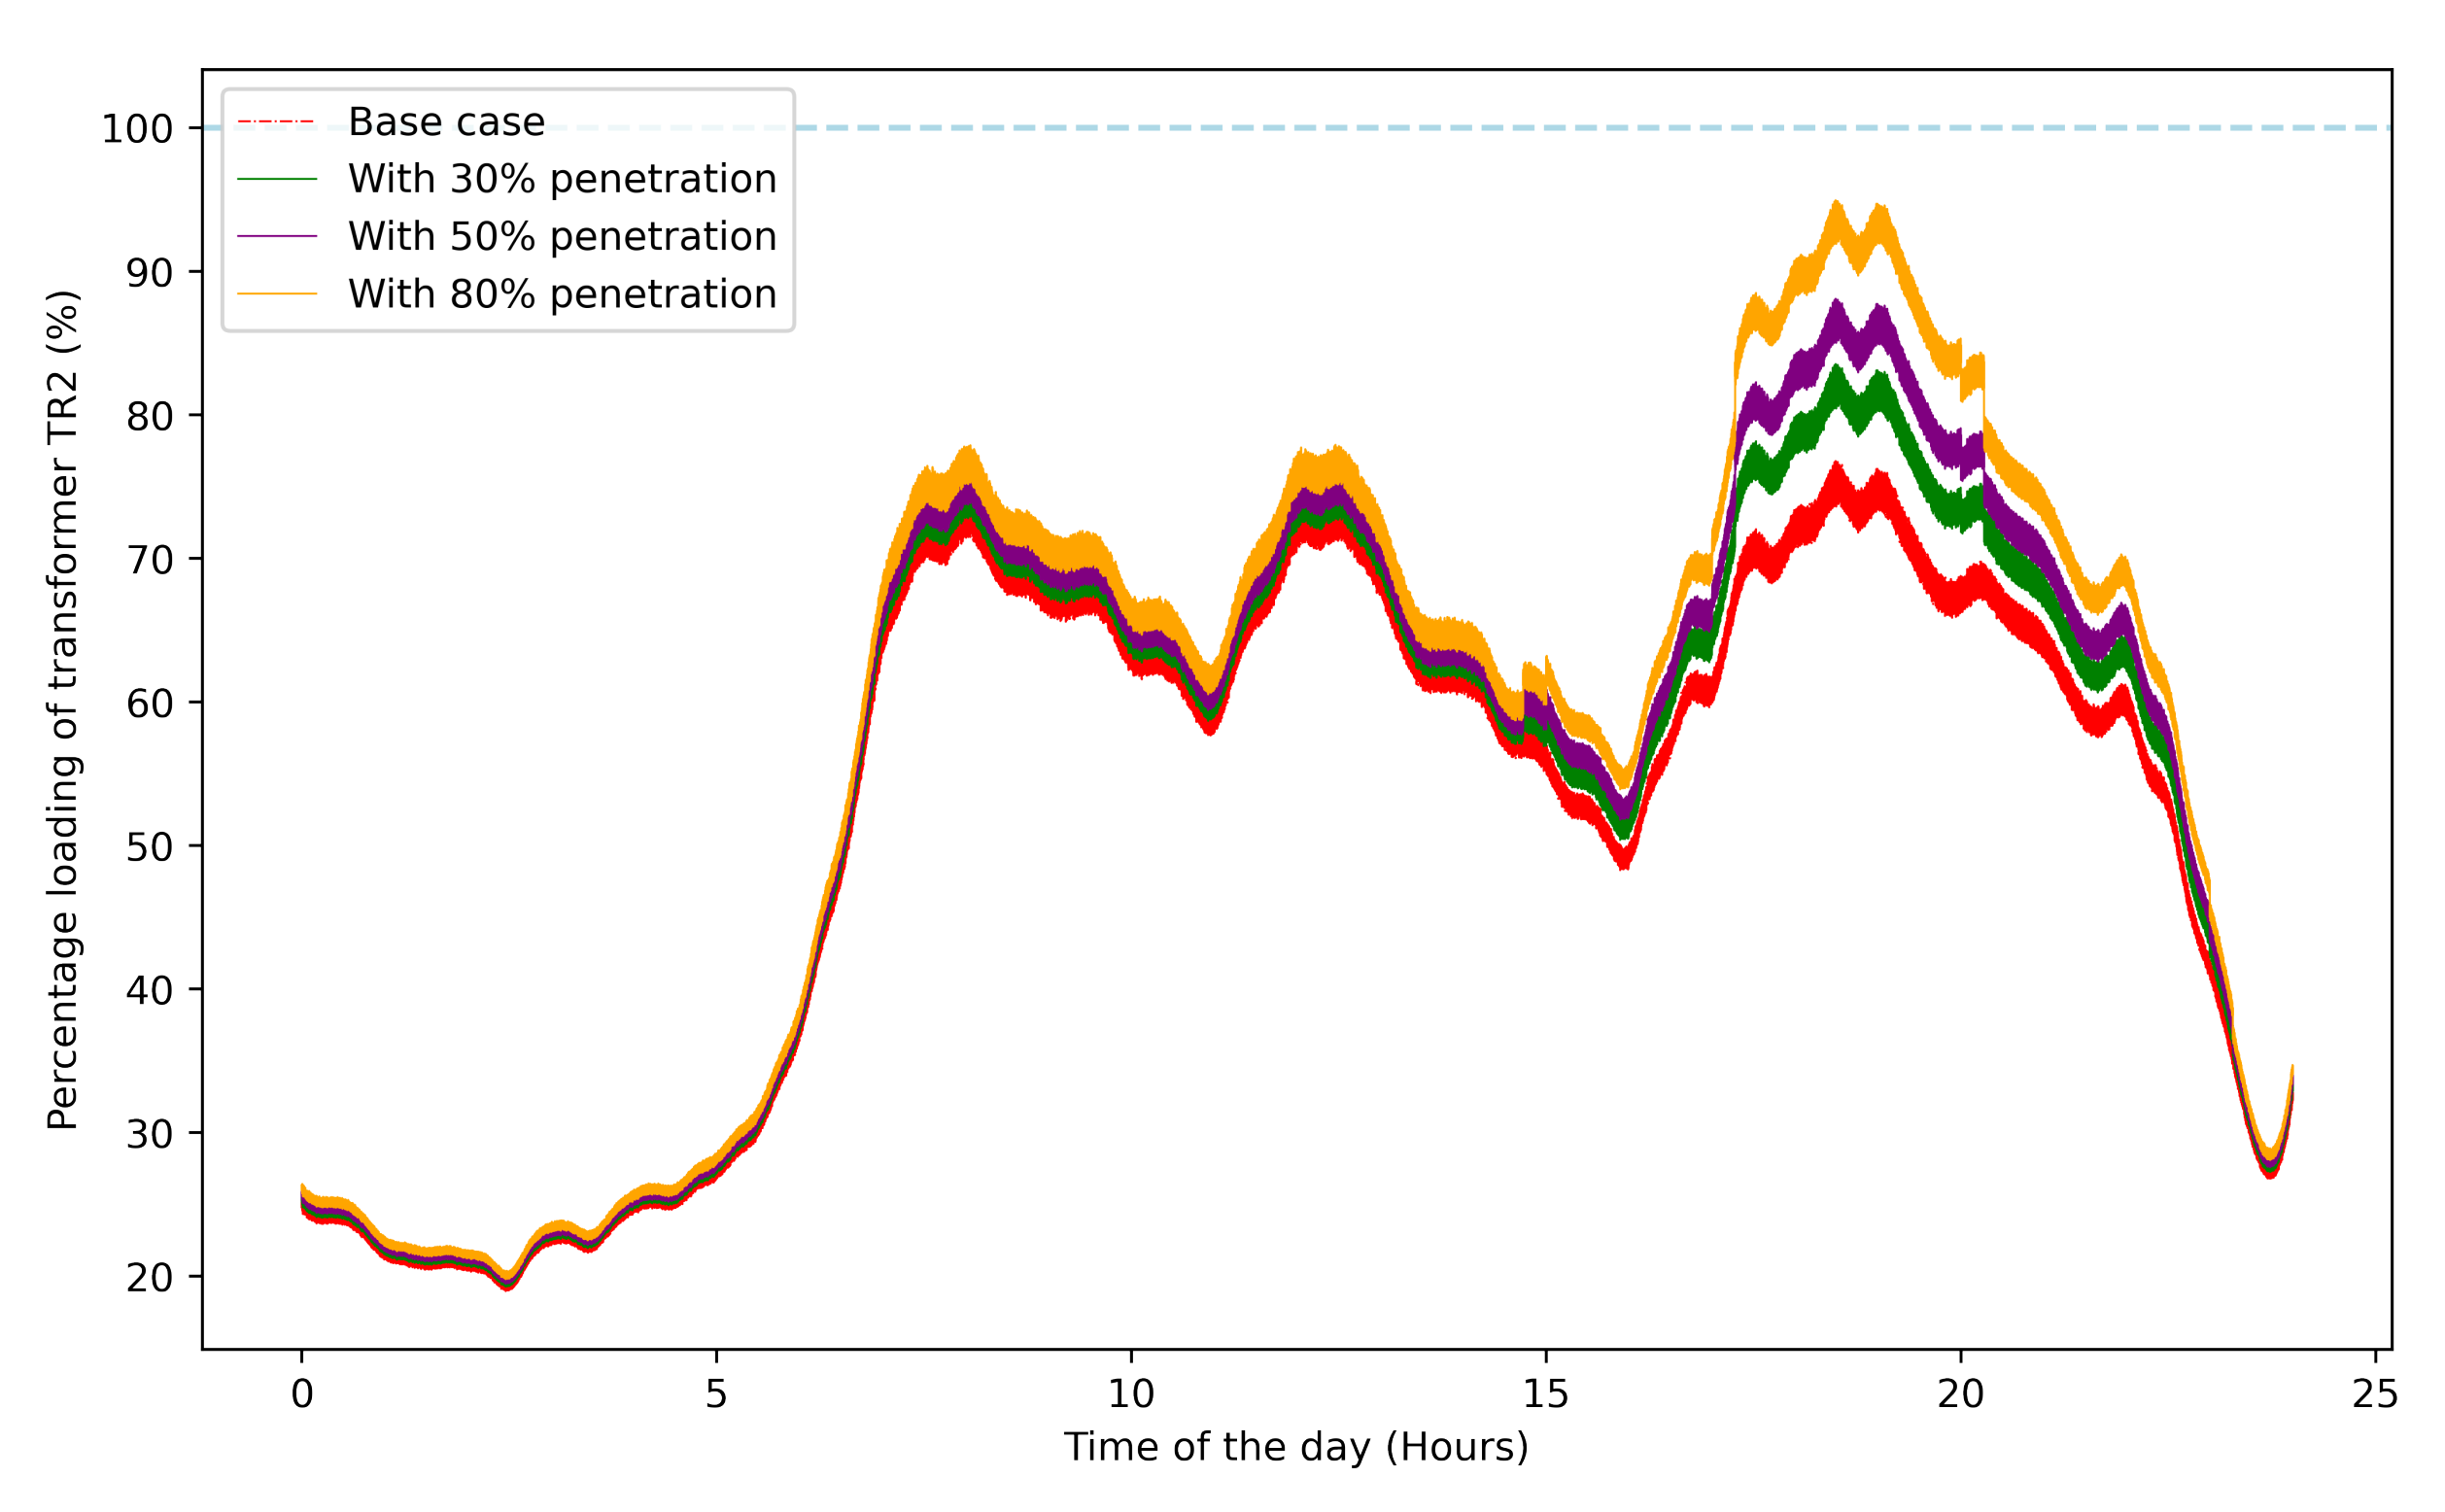
| Level of EV Penetration | Max. Loading of the Transformer TR1: Without SST | Max. Loading of the Transformer TR1: With SST | Max. Loading of the Transformer TR2: Without SST | Max. Loading of the Transformer TR2: With SST |
|---|---|---|---|---|
| 30% | 102.25% | 92.10% | 83.53% | 93.64% |
| 50% | 108.05% | 97.83% | 88.07% | 98.24% |
| 80% | 116.86% | 106.53% | 94.94% | 105.19% |
| Grid Parameters | 30% | 50% | 80% | |||
|---|---|---|---|---|---|---|
| Uncontrolled | Controlled | Uncontrolled | Controlled | Uncontrolled | Controlled | |
| Maximum loading of transformer TR1 (%) | 102.25 | 87.60 | 108.05 | 89.00 | 116.86 | 91.00 |
| Maximum loading of transformer TR2 (%) | 83.53 | 72.40 | 88.07 | 73.50 | 94.94 | 75.00 |
| Grid Parameters | 40% EV Penetration without SST | 40% EV Penetration with SST | 50% EV Penetration without SST | 50% EV Penetration with SST |
|---|---|---|---|---|
| Maximum Transformer TR1 Loading (%) | 87.93 | 64.7 | 107.57 | 57.5 |
| Maximum Transformer TR2 Loading (%) | 7.70 | 32.4 | 7.70 | 57.5 |
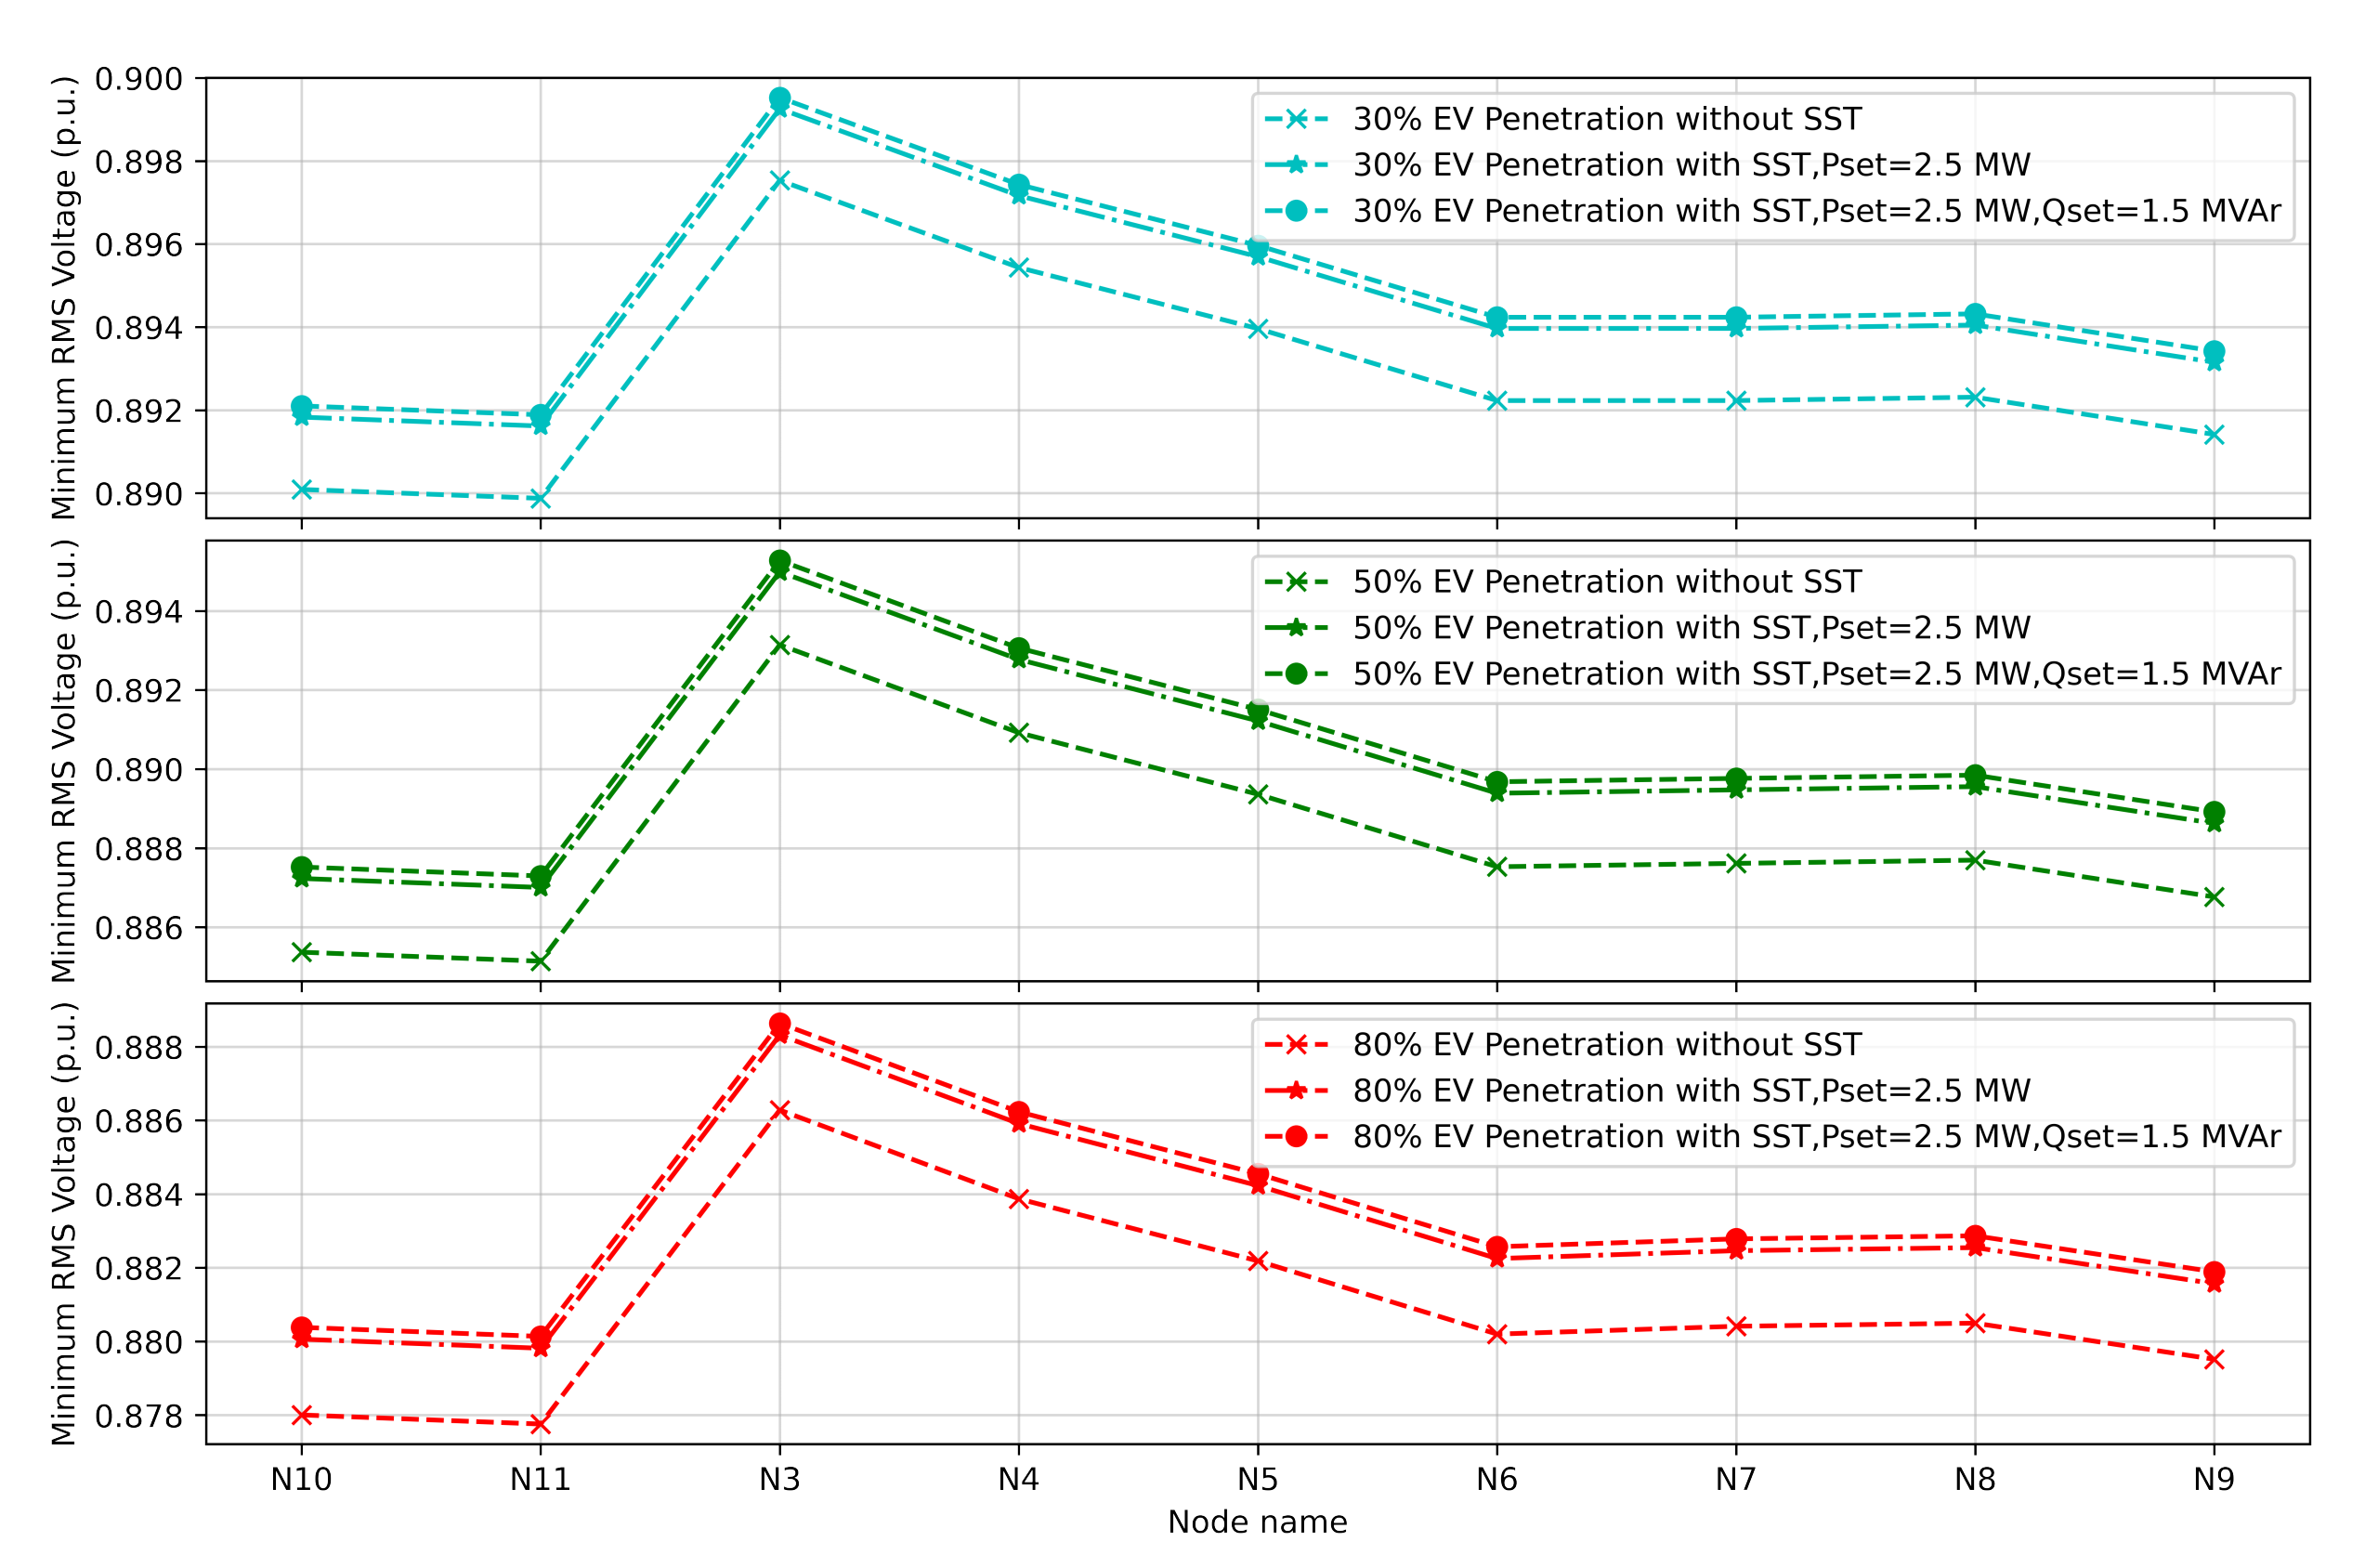
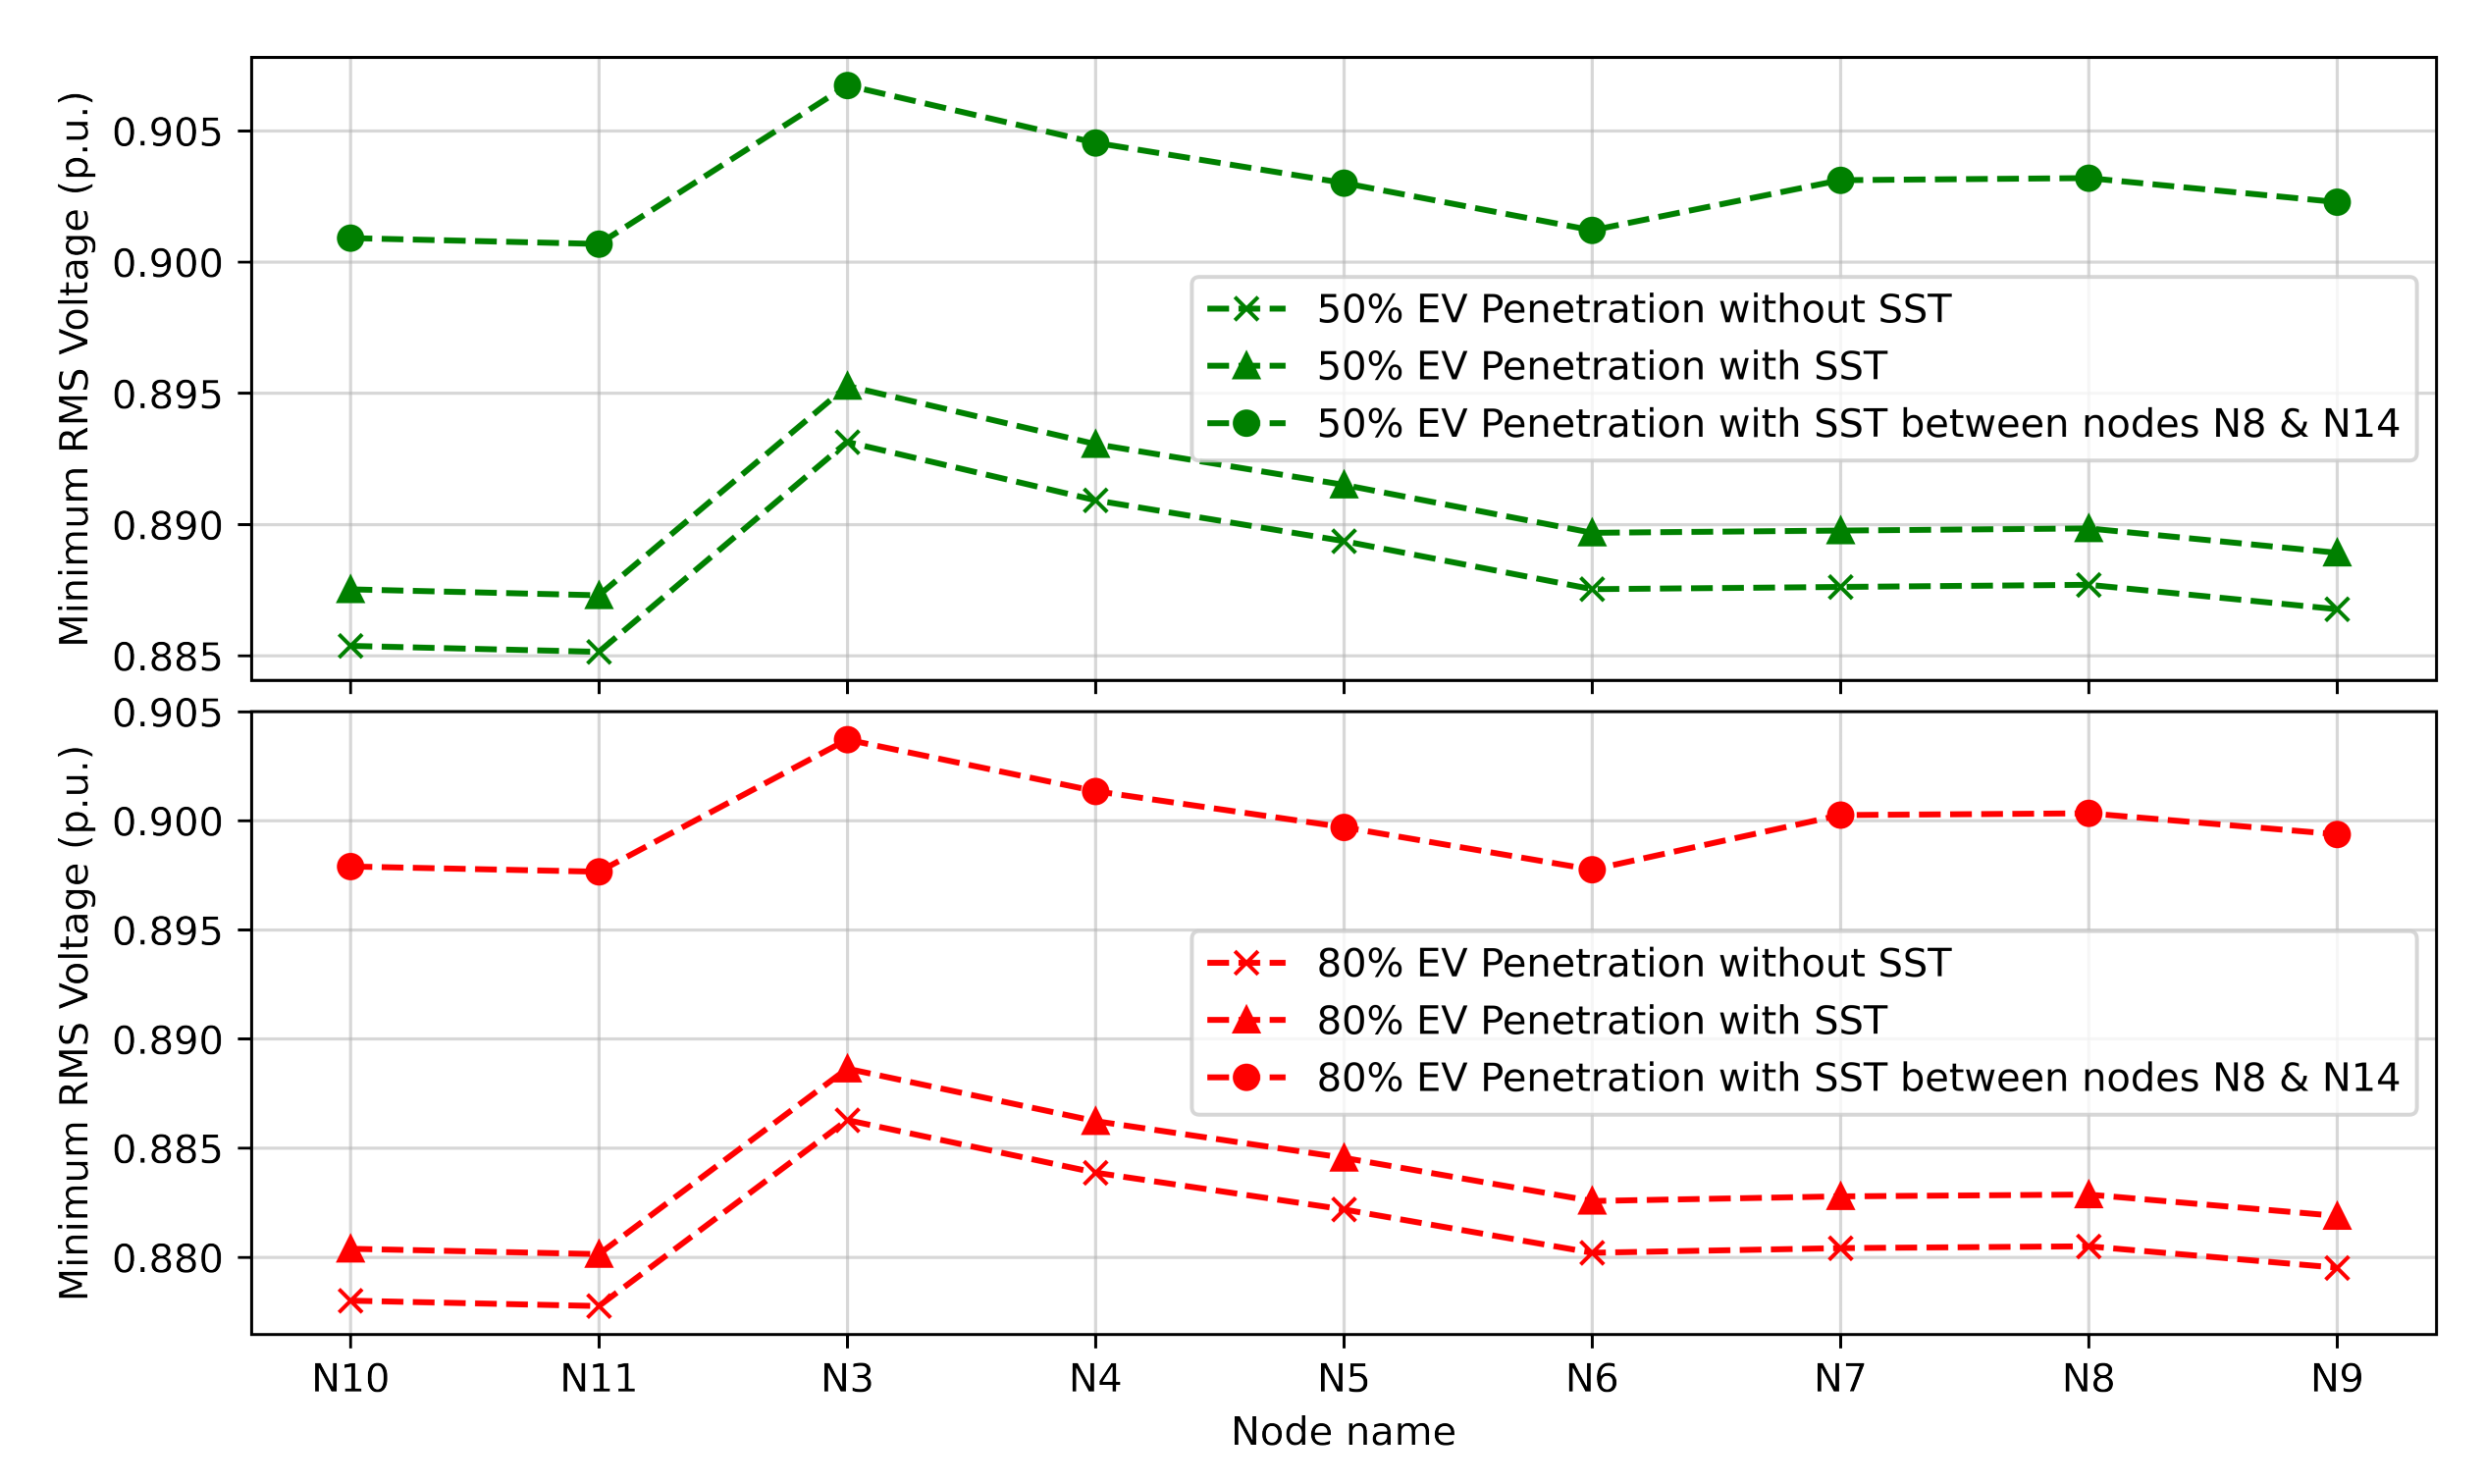
| Number of nodes with Vmin* <= 0.9 p.u. RMS voltage | 88 | 85 | 116 | 115 |
Publisher’s Note: MDPI stays neutral with regard to jurisdictional claims in published maps and institutional affiliations. |
© 2022 by the authors. Licensee MDPI, Basel, Switzerland. This article is an open access article distributed under the terms and conditions of the Creative Commons Attribution (CC BY) license (https://creativecommons.org/licenses/by/4.0/).
Share and Cite
Joglekar, C.; Mortimer, B.; Ponci, F.; Monti, A.; De Doncker, R.W. SST-Based Grid Reinforcement for Electromobility Integration in Distribution Grids. Energies 2022, 15, 3202. https://doi.org/10.3390/en15093202
Joglekar C, Mortimer B, Ponci F, Monti A, De Doncker RW. SST-Based Grid Reinforcement for Electromobility Integration in Distribution Grids. Energies. 2022; 15(9):3202. https://doi.org/10.3390/en15093202
Chicago/Turabian StyleJoglekar, Charukeshi, Benedict Mortimer, Ferdinanda Ponci, Antonello Monti, and Rik W. De Doncker. 2022. "SST-Based Grid Reinforcement for Electromobility Integration in Distribution Grids" Energies 15, no. 9: 3202. https://doi.org/10.3390/en15093202