1. Introduction
Characterized by high efficiency, high flexibility and a compact system, the supercritical carbon dioxide power cycle could, in the future, replace or partially replace the steam Rankine cycle to achieve efficient thermal power conversion [
1,
2,
3]. The thermodynamic critical point of CO
2 (critical temperature: 304.1 K; critical pressure: 7.38 Mpa) is low, non-toxic and inactive, which can lower the harsh requirements of the generator set for materials and make it possible to further improve the steam parameters, so as to raise the power generation efficiency by developing a supercritical carbon dioxide Brayton cycle generator [
4,
5,
6]. The great change in physical properties of water from subcritical to supercritical boosts a deterioration in the heat transfer [
7]. Few studies have been conducted on supercritical CO
2 coal-fired power generation systems, and most of them are only on the flow and heat transfer characteristics of CO
2 in the tube, which mainly use small tube diameters and pressures of around 10 MPa [
8]. Variny and Miroslav et al. [
9] proposed to replace the steam Rankine cycle with the supercritical CO
2 Brayton cycle in order to achieve higher efficiency at the same working fluid inlet parameters as the ultra-supercritical steam cycle.
Bea et al. [
10] studied the flow and heat transfer of carbon dioxide in a circular tube with a pressure of 7.75–8.12 MPa, a heat flux of 30–170 kW/m
2, a mass flux of 285–1200 kg/(m
2·s), and a tube diameter of 6.32 mm, finding that the Nusselt number would experience a significant decrease within a certain range before the fluid enters into the heat transfer deterioration.
Dong et al. [
11] studied the heat transfer of carbon dioxide in a circular tube flowing upward and downward, with experimental parameters covering ranges of P = 7.46–10.26 MPa, G = 208–874 kg/(m
2·s), q = 38–234 kW/m
2, a tube diameter of d = 4.5 mm, and Tb = 29–115 °C. At a suitable wall heat flux and low mass flux, the upward flow of CO
2 showed a significant peak in the wall temperature, but during the downward flow, the wall temperature increased monotonically along the flow direction and did not show a peak. The influence of buoyancy force and flow acceleration on heat transfer was investigated using empirical equations, but the flow acceleration exerted the greatest significant effect on heat transfer in the range of the tested parameters. They also investigated the effect of buoyancy force and flow acceleration on the heat transfer of supercritical pressurized fluid in a vertical circular tube, and concluded that the heat flux and mass flux have a significant effect on the distribution of the wall temperature.
Zhang et al. [
12] conducted an experimental study on the heat transfer characteristics of supercritical carbon dioxide in a vertical tube with a different mass flux. It showed that a distinct discrepancy exits in a different mass flux.
Chen et al. [
13] studied the flow and heat transfer phenomena of CO
2 in the supercritical region. Adopting the RSM turbulence model, Bovard et al. [
14] conducted a numerical simulation to study the heat transfer and turbulent flow of supercritical CO
2 in a circular tube. The results showed that increasing the mass flux leads to a decrease in buoyancy and flow acceleration, while an increase in pressure leads to a decrease in buoyancy and flow acceleration.
Liu et al. [
15] studied the pressure drop and heat transfer characteristics of supercritical carbon dioxide cooling in a circular tube at tube diameters of 4 mm, 7 mm, and 10.7 mm, respectively, and analyzed the variation characteristics of the pressure drop at different tube diameters, mass fluxes, inlet pressures and heat fluxes. It was found that the pressure drop varies proportionally to the mass flux at different inlet pressures as the Reynolds number increases, and inversely to the inlet pressure at the same mass flux.
At present, the existing theoretical and experimental research of supercritical CO
2 heat transfer is not sufficient to support the engineering design, because it mainly reflects a narrow range of experimental parameters, which focused on the near-critical pressure region of the critical pressure of 7.38 MPa, with a large difference from the actual operating pressure of 20~30 MPa [
16].
The experimental studies of supercritical CO
2 flow and heat transfer are conducted under uniform heating, while in actual engineering, on the cooling wall of a supercritical CO
2 boiler, its heating side is subjected to radiant heat from the flame, while the other side has its back to the flame, and is not subjected to direct radiation from the flame, such that the cooling tube in the furnace is not uniformly heated along its circumference [
17].
In summary, the study of the above high-parameter conditions is meant to provide data support for the future design of supercritical CO2-fired coal-fired generating units. In this paper, the vertical section cooling wall tube of a 1000 MW supercritical tower once-through boiler is studied and simulated using the RNG k-epsilon turbulence model to investigate the supercritical CO2 flow and heat transfer characteristics under high parametric operating conditions.
2. Physical Model and Solution
2.1. Physical Model and Boundary Conditions
The geometric model of the selected Y-tube is taken from a vertical section of the cooling wall of a 1000 MW supercritical tower once-through boiler, as shown in
Figure 1. The upper and lower vertical tube is connected by a Y-type tee transition connection, and the material of the cooling wall tube is T-23 steel; its physical parameters are shown in
Figure 2. The thermal properties of supercritical carbon dioxide were obtained by invoking the NIST database with REFPORP 9.1 software.
It is 69.225 m to 108.81 m in vertical height, and the elevation of the interface between the upper and lower rings is 90.7 m, as is expressed in
Figure 3. The pipe diameter of the upper vertical tube is φ44.5 × 7.33 mm, which is shown in
Figure 4, and the pitch is 60 mm, while the pipe diameter of the lower vertical tube is φ39.1 × 6.78 mm, as shown in
Figure 5.
The cooling wall vertical tube is based on an adiabatic half side, a half side with the heat exchange of flue gas, and heat flux (q = UDF) according to the local heat exchange formula; the extended tube length distribution is shown in
Figure 6.
2.2. Meshing and Solution Setup
The half side of the Y-tube is adiabatic, and the half side is subject to heat exchange from the flue gas; the heat flux is derived using Chen’s local conversion formula (expressed as q = UDF in the paper). The structured grid is generated in ICEM from the calculation domain, and the grid at the Y-type tee is refined; the axial grid density is sparse because the variation of the flow and heat transfer in the axial direction is not significant.
The velocity inlet and pressure outlet are used, and the RNG k-epsilon turbulence model is applied. Compared with the k-epsilon standard model, the k-epsilon RNG turbulence model has a wider application and higher accuracy. The thermal physical parameters of supercritical CO2 are obtained by retrieving NIST real-gas-model data in Fluent, the SIMPLEC algorithm is used for the pressure and velocity coupling, the QUICK discrete format is used for the momentum and energy equations, and the second-order windward format is used for the turbulent kinetic energy and turbulent dissipation equations.
The condition for the judgement of convergence is that the calculation is completed when the residuals of each control equation and turbulence equation are all lower than 10−4. If the residual can never be lower than 10−4, then when the residual basically does not change, we can calculate the mass flux at its outlet. If the mass flux of the inlet and outlet are the same, it is judged to be convergent.
2.3. Mathematical Model
In this paper, the RNG k-epsilon turbulence model is used, and the mathematical model includes the continuity equation, momentum equation, and energy equation.
The continuity equation is as follows:
The momentum equation is as follows:
where
contains another model-dependent source.
The energy equation is as follows:
where
is the turbulent diffusion flux of enthalpy.
The turbulent kinetic energy k equation is as follows:
The diffusion coefficient epsilon equation is as follows:
The local heat transfer coefficient h can be expressed as:
where
Tw is the inner wall temperature,
Tb is the bulk fluid temperature, and
is the inner wall heat flux.
2.4. Model Verification
The RNG k-epsilon turbulence model was used to compare the experimental data of Qu et al. [
18] with the data obtained from the simulation, and it can be seen from
Figure 7 that the data of the inner wall surface temperature in the simulation results deviate from the experimental data within 5%. As such, the model can simulate the flow and heat transfer of the supercritical fluid in the vertically rising tube very well, and the numerical model of the RNG k-epsilon turbulence used in this paper is feasible and reliable.
3. Simulation Results and Analysis
3.1. Effect of Different Heat Fluxes on the Flow and Heat Transfer
Shown in
Figure 8 and
Figure 9 are the temperature and velocity variation of supercritical CO
2 fluid along the tube, with the inlet pressure of 30.42 MPa, the mass flux of 2207 kg/(m
2·s), the inlet temperature of 718.8 K, and the heat flux of 39.8~71.2 kW/m
2.
After the Y-type tee, the enthalpy growth rate decreases and the rate of temperature rise slows down due to the decrease of the total heat absorption. When it passes through the Y-type tee structure, the temperature increases slightly. Before the Y-type tee, the density decreases with the increase of the temperature, but the increase rate becomes small gradually, such that the velocity increases slowly. When the Y-type tee structure is passed, the velocity increases significantly and then stabilizes. At about 21.5 m, the two tubes change into one, and the velocity increased rapidly because of the decrease of the total cross-sectional area.
When T
in > T
pc, under ultra-high parameter conditions (
p = 30.42 MPa,
G = 2207 kg/(m
2·s),
q = 39.8~71.2 kw/m
2), the pseudo-critical temperature of supercritical carbon dioxide is far away, such that there is no heat transfer deterioration with the increase of the heat flux. As shown in
Figure 10, when T
in > T
pc, the heat flux has little influence on the heat transfer coefficient. Only at the Y-type tee and the second change does the heat flux increase sharply due to the disturbance caused by the change of the pipe diameter, and then tends to be constant. However, the heat flux increases slightly with the increase of the heat flux.
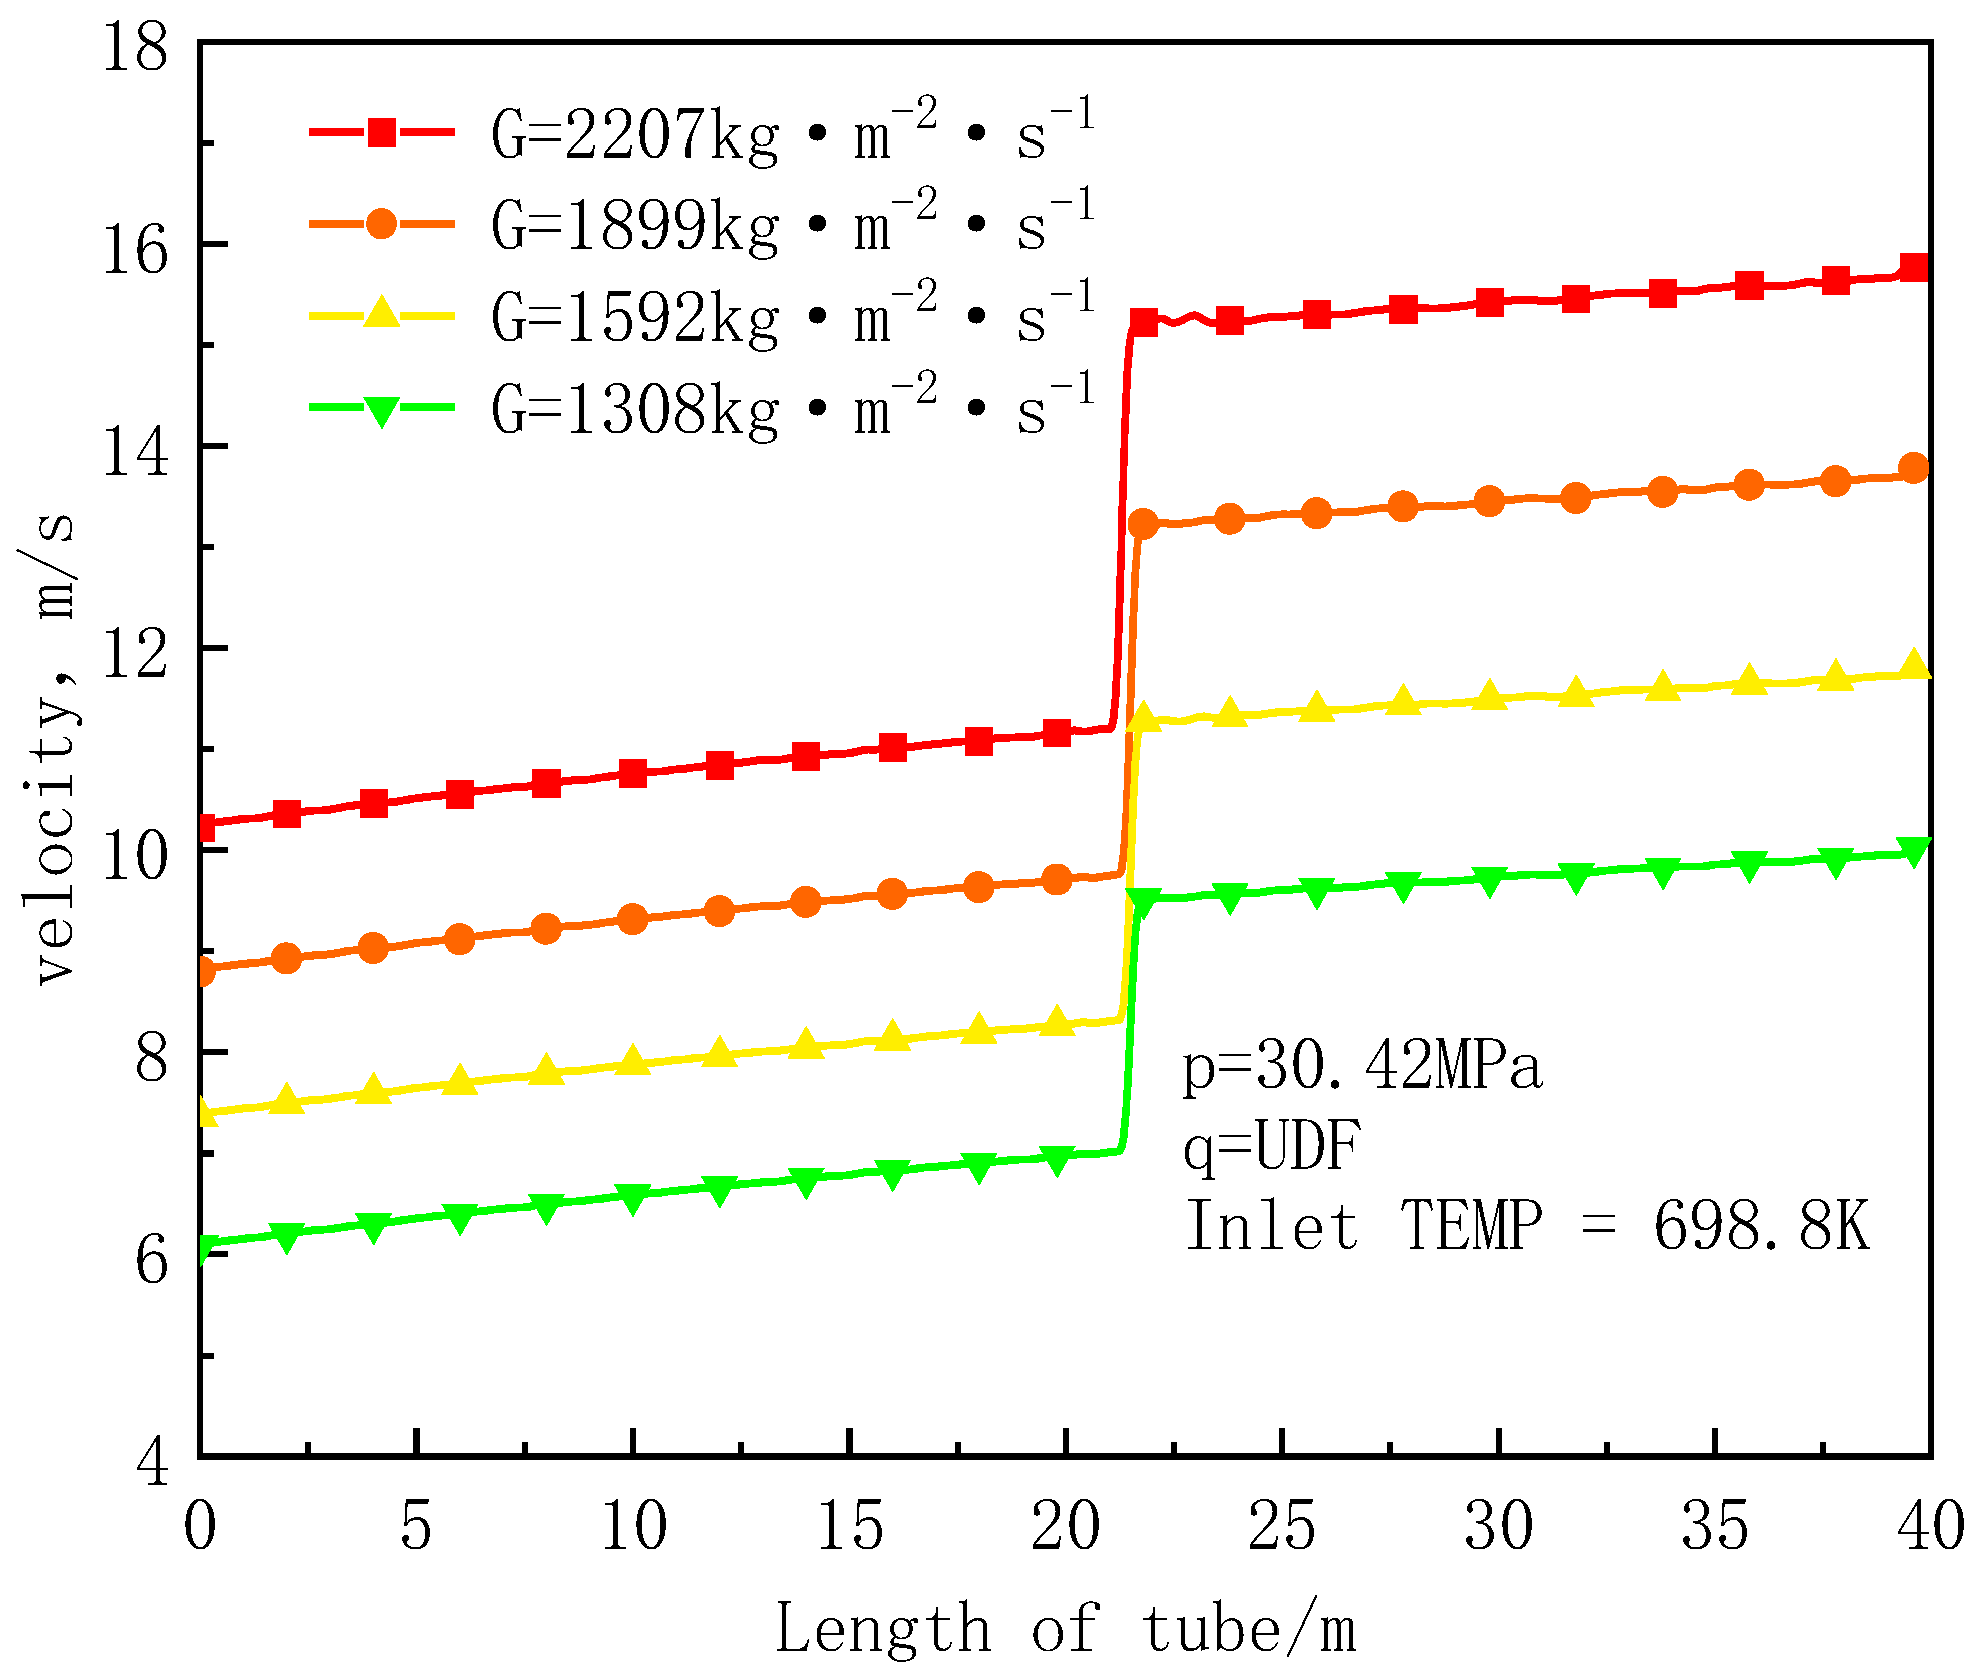
3.2. Effect of Different Mass Fluxes on Flow and Heat Transfer
In order to investigate the effect of mass flux on the flow and heat transfer, an analysis was carried out under an inlet pressure of 30.42 MPa, a heat flux (q = UDF) varying along the tube length, an inlet temperature of 718.8 K, and a mass flux of 1308~2207 kg/(m2·s).
Figure 11 and
Figure 12 show the temperature and velocity distribution of supercritical carbon dioxide fluid along the tube length. It can be seen from the figure that in the area far from the quasi-critical temperature is almost a normal heat transfer mode. The increase of mass flux will lead to a slow trend of the temperature rise. This is because the velocity is too fast for the heat to be absorbed by S-CO
2 well. When the velocity is reduced, it can absorb more heat, and the temperature rises faster. However, after the Y-type tee, the decrease of the cross-sectional area leads to a slower trend of the overall temperature rise.
When
Tin >
Tpc, under ultra-high parameter conditions (
p = 30.42 MPa,
T = 718.8 K, G = 1308~2207 kg/(m
2·s)), as the mass flux increases, the bottom layer of the laminar flow in the turbulent boundary layer becomes thinner, which increases the convective heat transfer coefficient between the fluid and the wall, thus increasing the convective heat transfer coefficient
h, as shown in
Figure 13.
3.3. Effect of Different Inlet Temperatures on the Flow and Heat Transfer
Figure 14 and
Figure 15 show the temperature and velocity distribution of supercritical carbon dioxide fluid along the tube, with an inlet pressure of 30.42 MPa, a mass flux of 2207 kg/(m
2·s), and an inlet temperature of 614.9 K~718.8 K.
Under other unchanged conditions, the higher the import temperature is, the higher the export temperature is. The temperature increases faster before passing through the Y-type tee, but the overall temperature change trend is consistent. This is because when the mainstream temperature is higher than the quasi-critical temperature, the physical properties of supercritical carbon dioxide fluid change gently, and the wall temperature increases monotonically along the tube.
It can be seen from the
Figure 16 that the convective heat transfer coefficient is basically maintained at a constant value, and the increase of the inlet temperature has a slight enhancement effect on the heat transfer. In the Y-type tee, due to the change of the pipe diameter, the disturbance enhances the heat transfer, and then tends to be stable. When
Tin >
Tpc, under ultra-high parameter conditions, the fluid temperature rises monotonously along the tube length without an obvious peak, which means that the heat transfer deterioration of supercritical carbon dioxide is closely related to the inlet temperature, and the heat transfer deterioration only occurs when
Tin <
Tpc.
3.4. Temperature and Velocity Distribution in the Vertical Cooling Wall Tube Section
The supercritical CO
2 in two tubes did not have a vortex at first, but the boundary conditions changed after the Y-type tee. When they integrated, a fluid and a vortex were generated.
Figure 17a–f shows the velocity cloud distribution of the cross-section at 21.19 m, 21.53 m, 21.55 m, 21.81 m, 22.32 m, and 23.34 m, respectively. From
Figure 17a–f, it can be seen that due to the viscous force, the vortex decreases continuously until it basically disappears at 23.34 m. According to the Lagrange theorem, when the mass force of the positive pressure fluid is potential, the vortex in the flow field will not produce or disappear. However, in the actual fluid flow field, a vortex can be produced and disappear in the fluid.
Figure 18a–f shows the temperature cloud distribution of the cross-section at 21.19 m, 21.53 m, 21.55 m, 21.81 m, 22.32 m, and 23.34 m, respectively. It can be seen from the temperature difference of the fluid in the tube that under the condition of a half-side being heated, the temperature measured in the heated side is significantly higher than that measured by the adiabatic half. Before the Y-type tee, the temperature change shows obvious directional gradient. When it passes through the Y-type tee, the temperature change also changes with the uneven distribution of the velocity, because of the disturbance of the secondary flow. However, when the velocity tends to be stable, the temperature change also tends to be stable.
4. Conclusions
In this paper, the flow and heat transfer of supercritical carbon dioxide in a half-heated, half-adiabatically vertical rising Y-tube under different operating conditions was numerically simulated and analytically discussed.
Under the high parameter conditions with a pressure of 30.42 MPa, a mass flux of 2207 kg/(m2·s), and a heat flux varying with tube length, the temperature of the working medium at the outlet of the cooling wall is 795.1 K. After passing through the Y-type tee, the enthalpy increase of supercritical carbon dioxide decreases, the temperature increase slows down, and the velocity increases rapidly at this time because of the reduction of the cross-sectional area.
The change of temperature and the heat transfer coefficient on the inner wall of the vertical cooling wall was analyzed. At 21.5 m, because the total heating area decreased, the wall heat absorption decreased, and the wall temperature decreased slightly. The decreasing trend of the heat transfer coefficient before the Y-type tee is obvious because the heat capacity per unit volume heat flux gradually decreases. After the Y-type tee, the local heat transfer enhancement is produced due to the small fluid viscosity, and the decrease of the cross-sectional area also leads to the increase of the heat transfer coefficient. Under the condition of a half side being heated, the temperature measured in the heated side is obviously higher than that in the other half that is adiabatic. When the disturbance occurs, the heat transfer is not uniform due to the change of velocity, and the temperature change tends to be stable with the stable velocity.
The heat flux increased from 39.8 kw/m2 to 71.2 kw/m2 under the condition of parameters higher than the quasi-critical temperature. The temperature of the working fluid was positively correlated with the heat flux, and the trend of the temperature increase slowed down after the Y-type tee. The inlet temperature increased from 614.9 K to 718.8 K, and the increase of the working fluid temperature was positively correlated with the inlet temperature. When the cross-sectional area decreased, the temperature rise slowed down. The mass flux increased from 1308 kg/(m2·s) to 2207 kg/(m2·s). The temperature of the working fluid was negatively correlated with the mass flux, but with the decrease of the cross-sectional area, the temperature rise trend slowed down.
The change of the convective heat transfer coefficient (a different inlet temperature, a different heat flux, and a different mass flux) of supercritical carbon dioxide under ultra-high parameter conditions was analyzed. In the vertical rising Y-tube, the increase of mass flux will lead to the increase of the convective heat transfer coefficient between the fluid and the wall, such that the convective heat transfer coefficient will increase, and the mass flux is positively correlated with the convective heat transfer coefficient h. The increase of the heat flux density and inlet temperature has little effect on the convective heat transfer coefficient. At a Y-type tee, the convective heat transfer coefficient increases instantly due to the change of the pipe diameter and the resulting fluid disturbance, and then tends to a stable value, which is slightly higher than the convective heat transfer coefficient in the lower tube.
The analysis of the numerical simulation results of supercritical carbon dioxide under high-parameter conditions, an actual operating pressure of 30.42 MPa, and half-side heated and half-side adiabatic conditions can provide certain theoretical support for the design of supercritical carbon dioxide coal-fired generating units in the future. It is hoped that the supercritical carbon dioxide Brayton cycle can achieve a higher thermal efficiency under the same working conditions of a supercritical boiler, which is of great significance.

