Article

Ozone Catalytic Oxidation for Gaseous Dimethyl Sulfide Removal by Using Vacuum-Ultra-Violet Lamp and Impregnated Activated Carbon

1
Research & Development Center, Asahikogyosha Co., Ltd., Chiba 275-0001, Japan
2
Graduate School of Science and Technology, Shizuoka University, Shizuoka 432-8561, Japan
3
Organization for Innovation and Social Collaboration, Shizuoka University, Shizuoka 432-8561, Japan
*
Author to whom correspondence should be addressed.
Energies 2022, 15(9), 3314; https://doi.org/10.3390/en15093314
Submission received: 5 April 2022 / Revised: 28 April 2022 / Accepted: 29 April 2022 / Published: 2 May 2022

Abstract

:
Gaseous sulfur compounds are emitted from many facilities, such as wastewater facilities or biomass power plants, due to the decay of organic compounds. Gaseous dimethyl sulfide removal by ozone catalytic oxidation was investigated in this study. A Vacuum-Ultra-Violet (VUV) xenon excimer lamp of 172 nm was used for ozone generation without NOx generation, and activated carbon impregnated with iodic acid and H2SO4 was utilized as a catalyst. Performance assessment of dimethyl sulfide removal ability was carried out by a dynamic adsorption experiment. Empty-Bed-Contact-Time (EBCT), superficial velocity, concentration of dimethyl sulfide, temperature and humidity were set at 0.48 s, 0.15 m/s, 3.0 ppm, 25 °C and 45%, respectively. Without ozone addition, the adsorption capacity of impregnated activated carbon was 0.01 kg/kg. When ozone of 7.5 ppm was added, the adsorption capacity of impregnated activated carbon was increased to 0.15 kg/kg. Methane sulfonic acid, a reaction product of dimethyl sulfide and ozone, was detected from the activated carbon. The results suggest that the VUV and activated carbon impregnated with iodic acid and H2SO4 are workable for ozone catalytic oxidation for gas treatments.

1. Introduction

To contribute to sustainable development goals (SDGs), waste treatment facilities or waste-to-energy plants are attracting much attention [1,2]. These facilities emit odor due to the decay of organic compounds [3,4,5], and these facilities are distributed based on geographical conditions or disaster risk [6]. Deodorization systems have been developed for conventional large-scale centralized systems, but these systems are not always suitable for small-scale distributed systems. Thus, a gas treatment technology suitable for small-scale systems is increasingly needed.
In general, nitrogen compounds and sulfur compounds are emitted from waste treatment facilities and waste-to-energy plants due to the decay of organic compounds [7]. In particular, nitrogen alkaline gases such as ammonia or trimethylamine, sulfur acid gases such as hydrogen sulfide or methane thiol, and sulfur neutral gases such as dimethyl sulfide (DMS, (CH3)2S) are the dominant materials [8]. However, ammonia and trimethylamine canbe removed by acid neutralization [9]. Hydrogen sulfide and methane thiol can be removed by alkaline neutralization [10] or catalytic oxidation by oxygen at room temperature [11]. Although dimethyl sulfide cannot be removed by neutralization [12] or catalytic oxidation by oxygen at room temperature [13,14], DMS is easily vaporized from the liquid phase due to its low boiling point of 37 °C [15]. Furthermore, the odor threshold concentration of DMS is very low: 0.0032 ppm [16]. Thus, oxidants are needed to remove dimethyl sulfide to prevent malodor pollution.
Therefore, DMS removal by ozone catalytic oxidation has been proposed by many researchers [17,18,19], as ozone can be generated by oxygen molecules in atmospheric air and electric power. These studies used expensive catalysts: ion-exchanged zeolite or metal-oxide. In addition, a Pressure-Swing-Adsorption (PSA) oxygen generator is needed for ozone generation by atmospheric discharge without NOx species [20]. To widen the spread of ozone, catalytic oxidation for gas treatment, inexpensive catalytic materials and a simple equipment ozonizer are needed.
In this study, granular activated carbon impregnated with iodic acid and inorganic acid was selected as a catalyst material. It is a cost-effective method for gas contaminant treatment [21,22]. Iodic acid is well known as an oxidant, and its reduction-oxidation potential is 1.195 eV [23]; iodic acid is reduced to iodide or iodine by oxidizing pollutants. It is well known that iodide can be oxidized to iodic acid by ozone [24,25,26]. Thus, iodic acid could be useful as an ozone oxidation catalyst. Inorganic acid was used for pH control.
A Vacuum-Ultra-Violet (VUV) xenon excimer lamp was used as an ozonizer in this paper. Oxygen molecules were decomposed using a 172 nm VUV, and ozone was generated [27]. NOx was not generated because a 172 nm VUV does not have adequate energy to excite nitrogen molecules [28]. An excimer lamp can generate ozone without the use of expensive equipment.
This paper reports on gaseous DMS removal by ozone catalytic oxidation using a xenon excimer lamp and activated carbon impregnated with iodic acid and inorganic acid for an economical deodorization technology.

2. Materials and Methods

2.1. Characteristics of Granular Activated Carbon Impregnated with Iodic Acid and Inorganic Acid

Granular activated carbon impregnated by iodic acid and inorganic acid (Suntecs, Gifu, Japan, Y-AC-I) was used in a series of experiments. In this paper, it is called impregnated activated carbon. Particle size distribution, bulk density and toluene adsorption capacity were measured according to JIS K 1474: 2014 [29], while the pH of impregnated activated carbon was measured according to JWWA A114 [30]. JIS K 1474: 2014 specifies the characterization protocols of activated carbon regulated by the Japanese Industrial Standards Committee. JWWA A114 specifies the characterization assessment protocols of activated carbon for the water supply as regulated by the Japan Water Works Supply.
Particle size was classified by sieve size. Bulk density was calculated by measuring the weight of impregnated activated carbon packed in a 200 mL container. Toluene adsorption capacity was calculated by measuring the weight difference between before and after toluene vapor adsorption by flowing 1/10 Toluene vapor to 10 g of impregnated activated carbon. The specimen for pH measurement was made of 3 g of impregnated activated carbon added to 300 mL of ion exchanged water and shaken for 30 min.
Granular activated carbon without impregnation (Suntecs, Gifu, Japan, Y-AC) was also used in a series of experiments in comparison with impregnated activated carbon, termed “activated carbon” in this paper.

2.2. Characteristics of VUV Xenon Excimer Lamp

The xenon excimer lamp (Ushio Inc., Tokyo, Japan, UXFL95-172F) was used in a series of experiments. Figure 1 shows the structural image of the excimer lamp. Xenon gas was enclosed in a quartz glass, and the electrodes were designated on both sides of the outer surface of the quartz glass. By applying pulsed high voltage using a (Ushio Inc., Tokyo, Japan, PXZ170I20-E) power supply, dielectric barrier discharge plasma was generated, and 172 nm VUV light emitted. Ozone was generated by irradiation of VUV light to the oxygen molecule.
Figure 2 shows the experimental set-up for characterization of the excimer lamp. The room dry-bulb temperature and relative humidity (RH) were 25 °C and 50%, respectively. The excimer lamp was stored in an SUS chamber, and gas (humidity controlled air or dry N2) of 1.5 L/min was flowed to the SUS chamber while energizing the excimer lamp. N2 gas was used for measuring the emission spectra of the excimer lamp. Discharge power was controlled by transmitting ON/OFF signal to power supply.
The waveform of discharge voltage and the corresponding discharge current and discharge power were measured by a high-voltage probe (Tektronix, Beaverton, OR, USA, P6015A), a current probe (Tektronix, Beaverton, OR, USA, P6021) and a digital oscilloscope (Tektronix, Beaverton, OR, USA, TDS2024B). Room air was flown to the SUS chamber when measuring the discharge characteristics.
The emission spectra of the VUV region and UV–IR region emitted by the excimer lamp were measured using a VUV spectrometer (Ocean optics, Dunedin, FL, USA, MAYA2000PRO) and a UV spectrometer (ASEQ Instruments, Vancouver, Canada, LR1-B), respectively. The N2 gas was flowed to SUS chamber, avoiding oxygen molecule absorption with a VUV light.
By lighting the excimer lamp, joule heating loss occurred. The surface temperature of the excimer lamp was measured by an infrared camera (FLIR systems, Wilsonville, OR, USA, FLIR C3). The emissivity parameter of the thermometer was set at 0.95, as the emissivity of glass is about 0.95 in an infrared region [31]. Ozone concentration was measured by an ozone monitor (Ebara jitsugyo, Tokyo, Japan, EG-3000B).
NOx concentration of flowing room air and 100% output power of the excimer lamp was measured by the ion chromatography method according to ISO 11564: 1998. Sampling gas was collected in a vacuum flask, and NOx was oxidized by absorption liquid, which contained H2SO4 and H2O2. The HNO3 concentration of absorption liquid was measured by ion chromatography (Thermo Fisher Scientific, Waltham, MA, USA, ICS-1100), and the NOx concentration of gas was calculated.

2.3. Performance Assessment of Ozone Catalytic Oxidation

2.3.1. Optimizing the Ozone Addition Amount

Characterization of ozone catalytic oxidation was conducted using the dynamic adsorption experiment. The experimental set-up for dynamic adsorption was as specified in Figure 2 and Section 2.2. A mixture of ozone gas and DMS gas was flowed to the impregnated activated carbon. Ozone was generated by driving the excimer lamp, and room air of 2.1 L/min was flowed to the SUS chamber. Ozone concentration was controlled by discharge power. DMS was generated by flowing dry air of 0.2 L/min to the gas permeator (Gastec, Tokyo, Japan, PD-1B-2).
Flow rate, temperature, RH and DMS concentration of the mixed gas were set to 2.3 L/min, 25 °C, 45% and 3.0 ppm, respectively. Impregnated activated carbon was packed into a U-shaped glass tube with an 18 mm diameter. Packing length was set to 72 mm. Superficial velocity was defined as air flow rate over cross-section of glass tube, and its value was 0.15 m/s. Empty-Bed-Contact-Time (EBCT) was defined as packing length over superficial velocity, and its value was 0.48 s.
Breakthrough time dependence on ozone addition amount was measured, and ozone amount optimization was investigated. t B [h] is the time to outlet DMS concentration increase to c B [ppm] (generally, c B is set to 5% of inlet concentration [32]). In this study, c B was set at 5% of inlet DMS concentration, and t B was 5% breakthrough time. O3/DMS is defined as ozone concentration over DMS concentration after mixing gas, and O3/DMS varied from 0 to 4 in this study. DMS concentration was measured using a gas detection tube (Gastec, Tokyo, Japan, No. 53). During DMS measurements, ozone generation was stopped to prevent interference.

2.3.2. Dynamic Adsorption Experiment

Adsorption capacity and adsorption rate constant are important parameters in continuous adsorption processes such as deodorization equipment processes [33]. Adsorption capacity is defined as the mass of the adsorbate that can be captured by the adsorbent unit mass. Adsorption capacity q a (kg/kg) was calculated by Equation (1) [34]. T = 25 (°C). M = 62 (g/mol) is the molecular weight of the adsorbate (DMS). c i = 3 (ppm) is the inlet concentration of the adsorbate (DMS). ρ b (kg/m3) is the bulk density of the adsorbent (impregnated activated carbon of this is 540 kg/m3, activated carbon of this is 480 kg/m3). t c = 0.48 (s) is EBCT. t 50 (h) is time for outlet DMS concentration to increase to 50% of inlet DMS concentration, referred to as 50% breakthrough time.
Adsorption rate constant k a (s−1) is the time for EBCT to capture an adsorbate. According to the Wheeler-Jonas equation, the adsorption rate constant is calculated by Equation (2) [35]. The experiment set-up is as specified in Section 2.3.1.
q a = 4.39 × 10 2 273 + T M c i t 50 ρ b t c
k a = 1 t c   ln ( c i c B c B ) 1 t B t 50
Outlet DMS concentration was measured using a gas detector tube (Gastec, Tokyo, Japan, No. 53). The odor threshold concentration of DMS and ozone were 0.0032 ppm and 0.003 ppm, respectively [16]. Ozone could be removed by impregnated activated carbon to accomplish deodorization. Outlet ozone concentration was also measured using a gas detector tube (Gastec, Tokyo, Japan, 18 L).
Table 1 shows the major oxidation products of DMS and its boiling points [36]. Generally, high boiling point material adsorbs more adsorbents [37]. In oxidation products, Sulfur dioxide (SO2) could be detected at the outlet of the impregnated activated carbon due to its low boiling point. SO2 concentration was measured using a gas detector tube (Gastec, Tokyo, Japan, 5Lb). Other oxidation products could be stored in impregnated activated carbon due to the high boiling points.
During DMS and SO2 measurement, ozone generation was stopped to prevent interference. It was confirmed that DMS did not interfere with ozone measurement.

2.3.3. Activated Carbon Analysis

Methanesulfonic acid (MSA) and H2SO4 can be the major oxidation products of DMS [38]. After the dynamic adsorption experiment, 3 g of adsorbent was added to 100 mL of ion exchanged water. This specimen was shaken for 30 min. MSA and H2SO4 concentrations of the specimen were measured by ion chromatography (Thermo Fisher Scientific, Waltham, MA, USA, ICS-1100). The pH of the specimens was also measured.

2.3.4. DMS Desorption Experiment

Adsorbed material is desorbed by flowing clean air to the adsorbent [39]. Material captured by physical adsorption is mainly desorbed; however, chemically adsorbed material is less desorbed. The ratio of physical adsorption and chemical adsorption can be roughly estimated by calculating the desorption amount. After the dynamic adsorption experiment, air was flowed to the adsorbent without generating DMS, and the ozone outlet concentration of DMS was measured. Desorption ratio is defined as desorption amount over adsorption amount. The experimental set-up was as specified in Section 2.2.

3. Results and Discussions

3.1. Characteristics of Granular Impregnated Activated Carbon

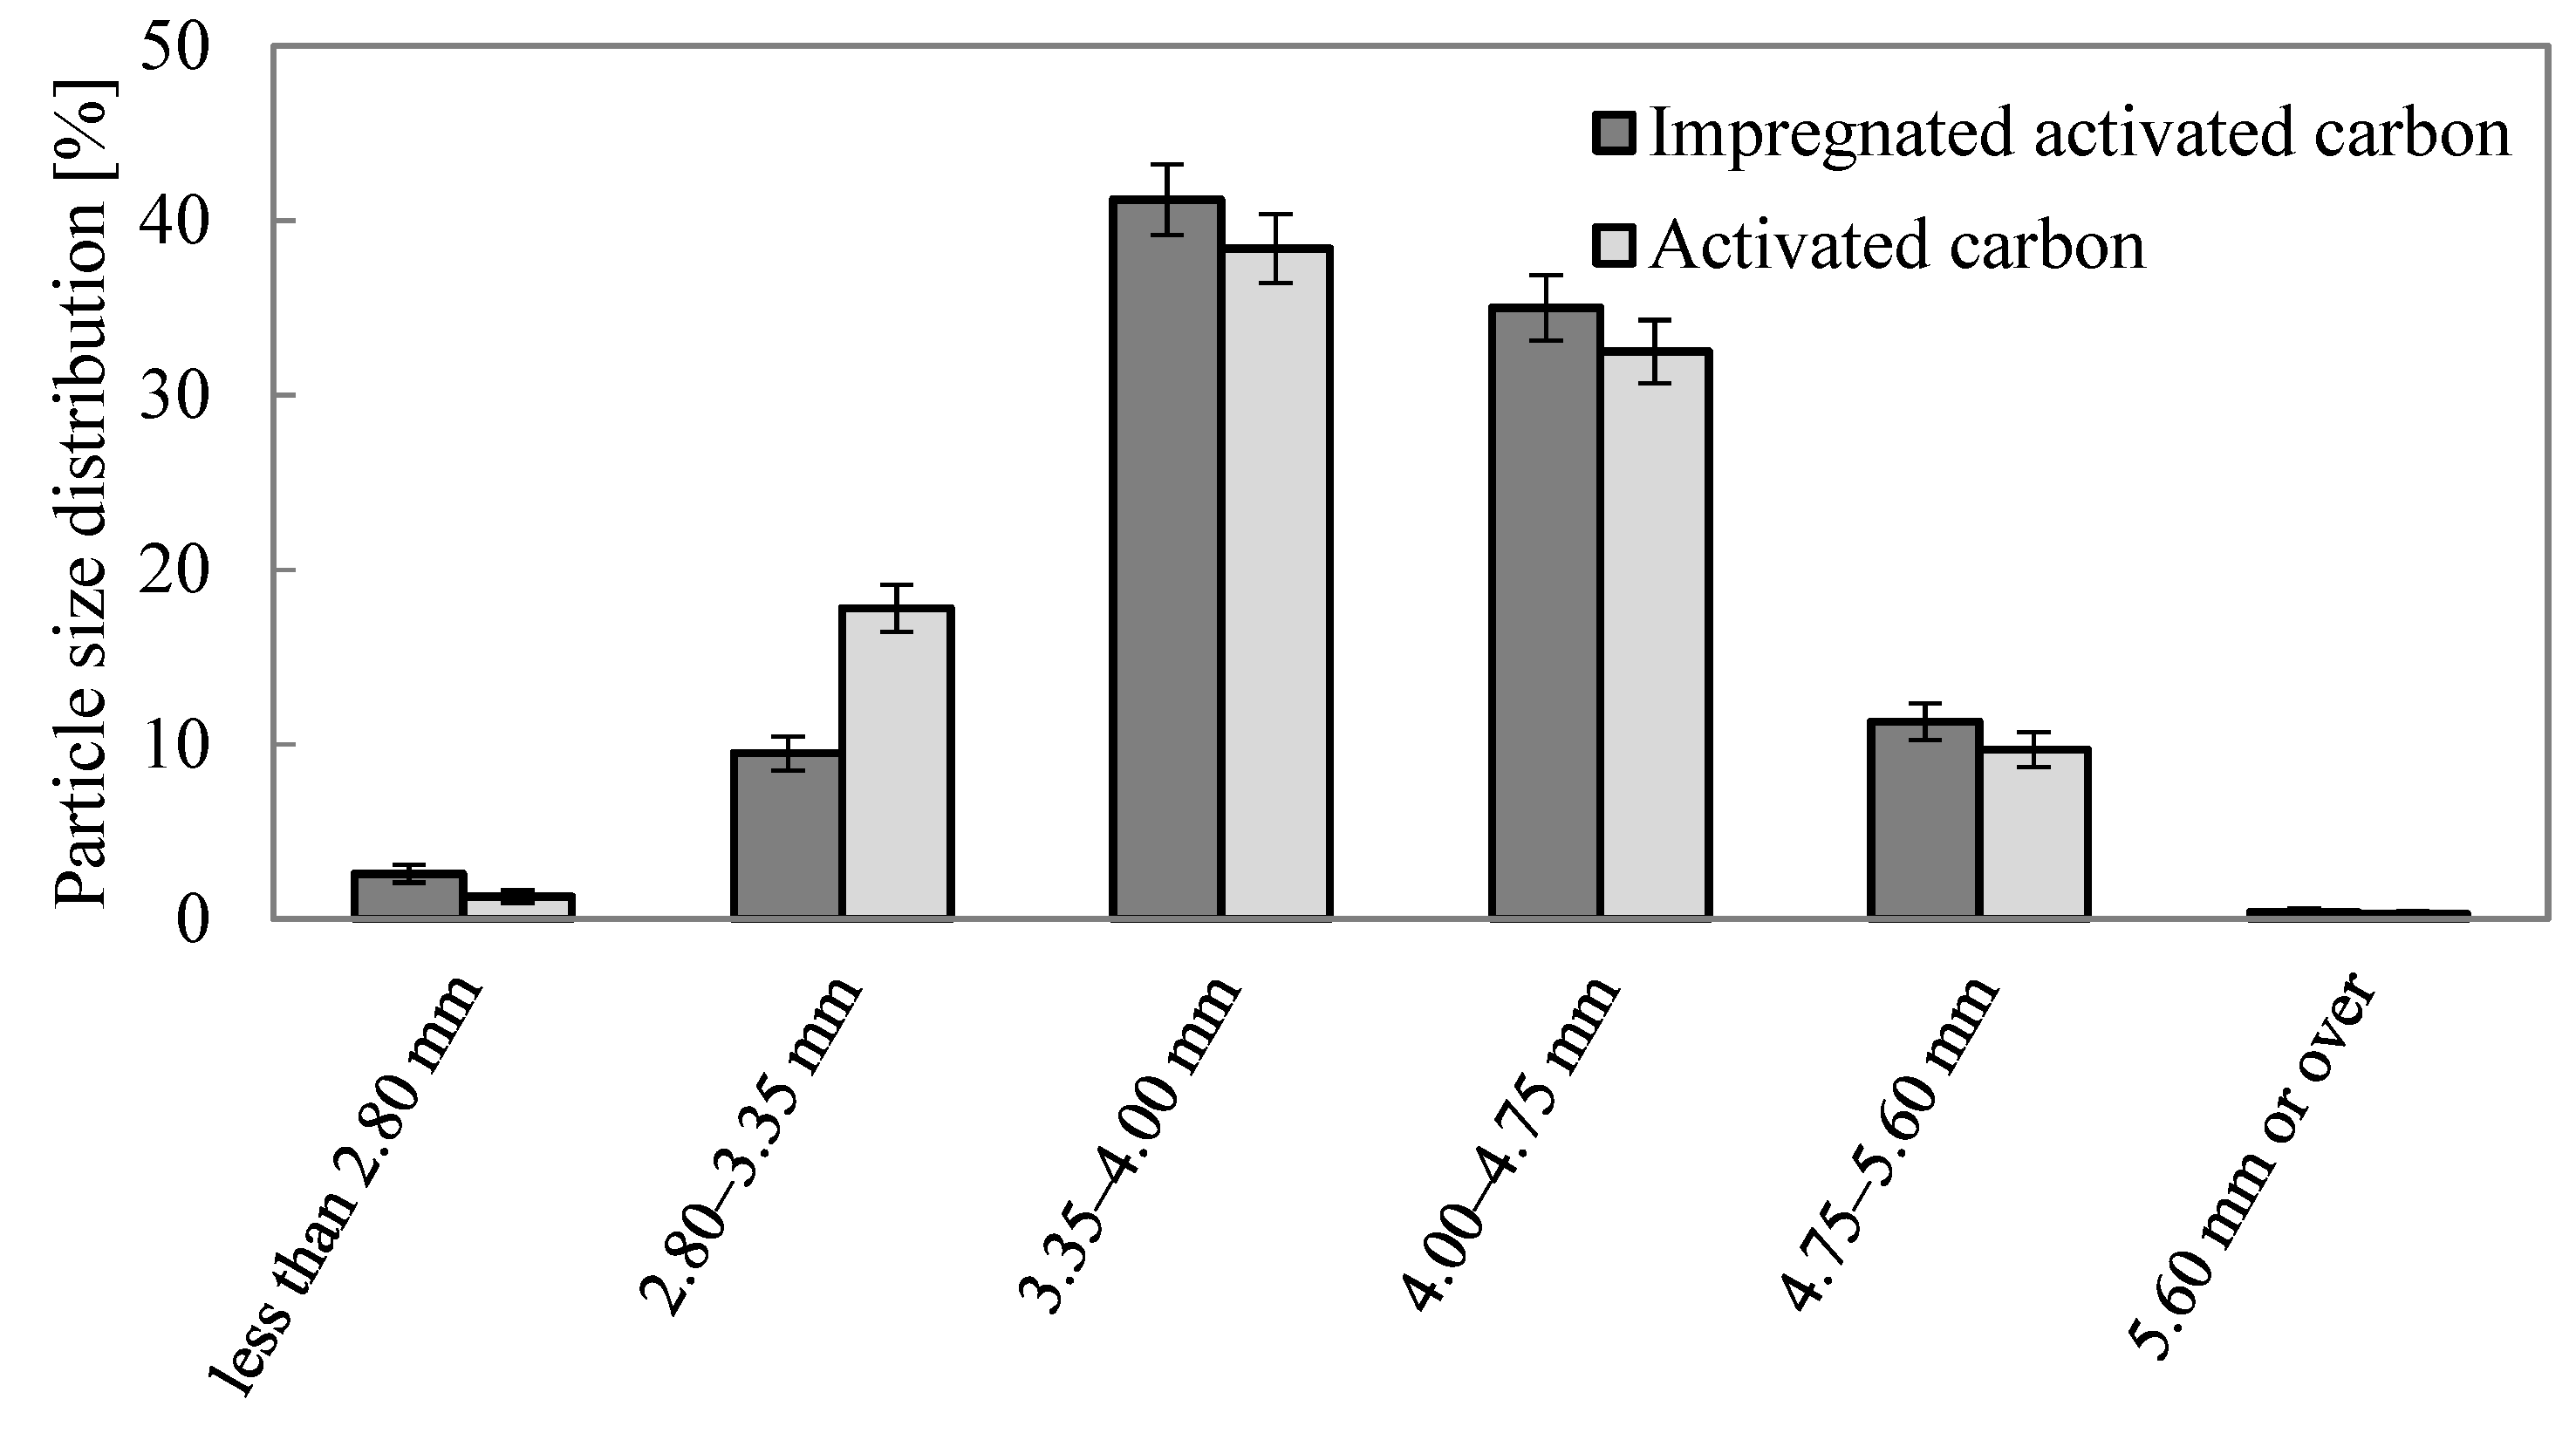
Figure 3 shows the particle size distributions of impregnated activated carbon and activated carbon, and Table 2 shows the bulk density, toluene adsorption capacity and pH. For both impregnated activated carbon and activated carbon, particles sizes were 2.80–5.60 mm. These particles sizes are typically values for gas treatment [40]. Bulk density was increased and toluene adsorption capacity was decreased by impregnation. This might be due to the impregnation materials infiltrating the pores [41]. The pH of activated carbon was alkali due to the impurity of the metals [42]. The pH was decreased by impregnation due to acid dissociation.

3.2. Characteristics of Excimer Lamp

Figure 4 shows the waveforms of the discharge voltage, corresponding discharge current and discharge power when room air was flowed to the SUS chamber, with an ON/OFF signal of duty ratio of 30% and frequency of 10 Hz transmitted to the power supply. Figure 4a shows the waveforms of one-shot pulse. Discharge voltage, the corresponding discharge current and discharge power were −3.6 kV, −2.2 A and 3.5 kW, respectively. Power consumption of one-shot pulse was calculated by integration of the discharge power, and its value was 187 μJ. Figure 4b shows the repetitions of pulsed discharge. Pulse frequency was 70 kHz. Figure 4c shows the controlled output of the power supply by the ON/OFF signal.
In plasma physics, estimation of the order of gas pressure is important [43]. Gas pressure enclosed in the lamp could be estimated using the Paschen curve [44]. In this study, discharge voltage was 3.6 kV, and electrode distance was 1 cm. Gas pressure was estimated at about 5–20 kPa.
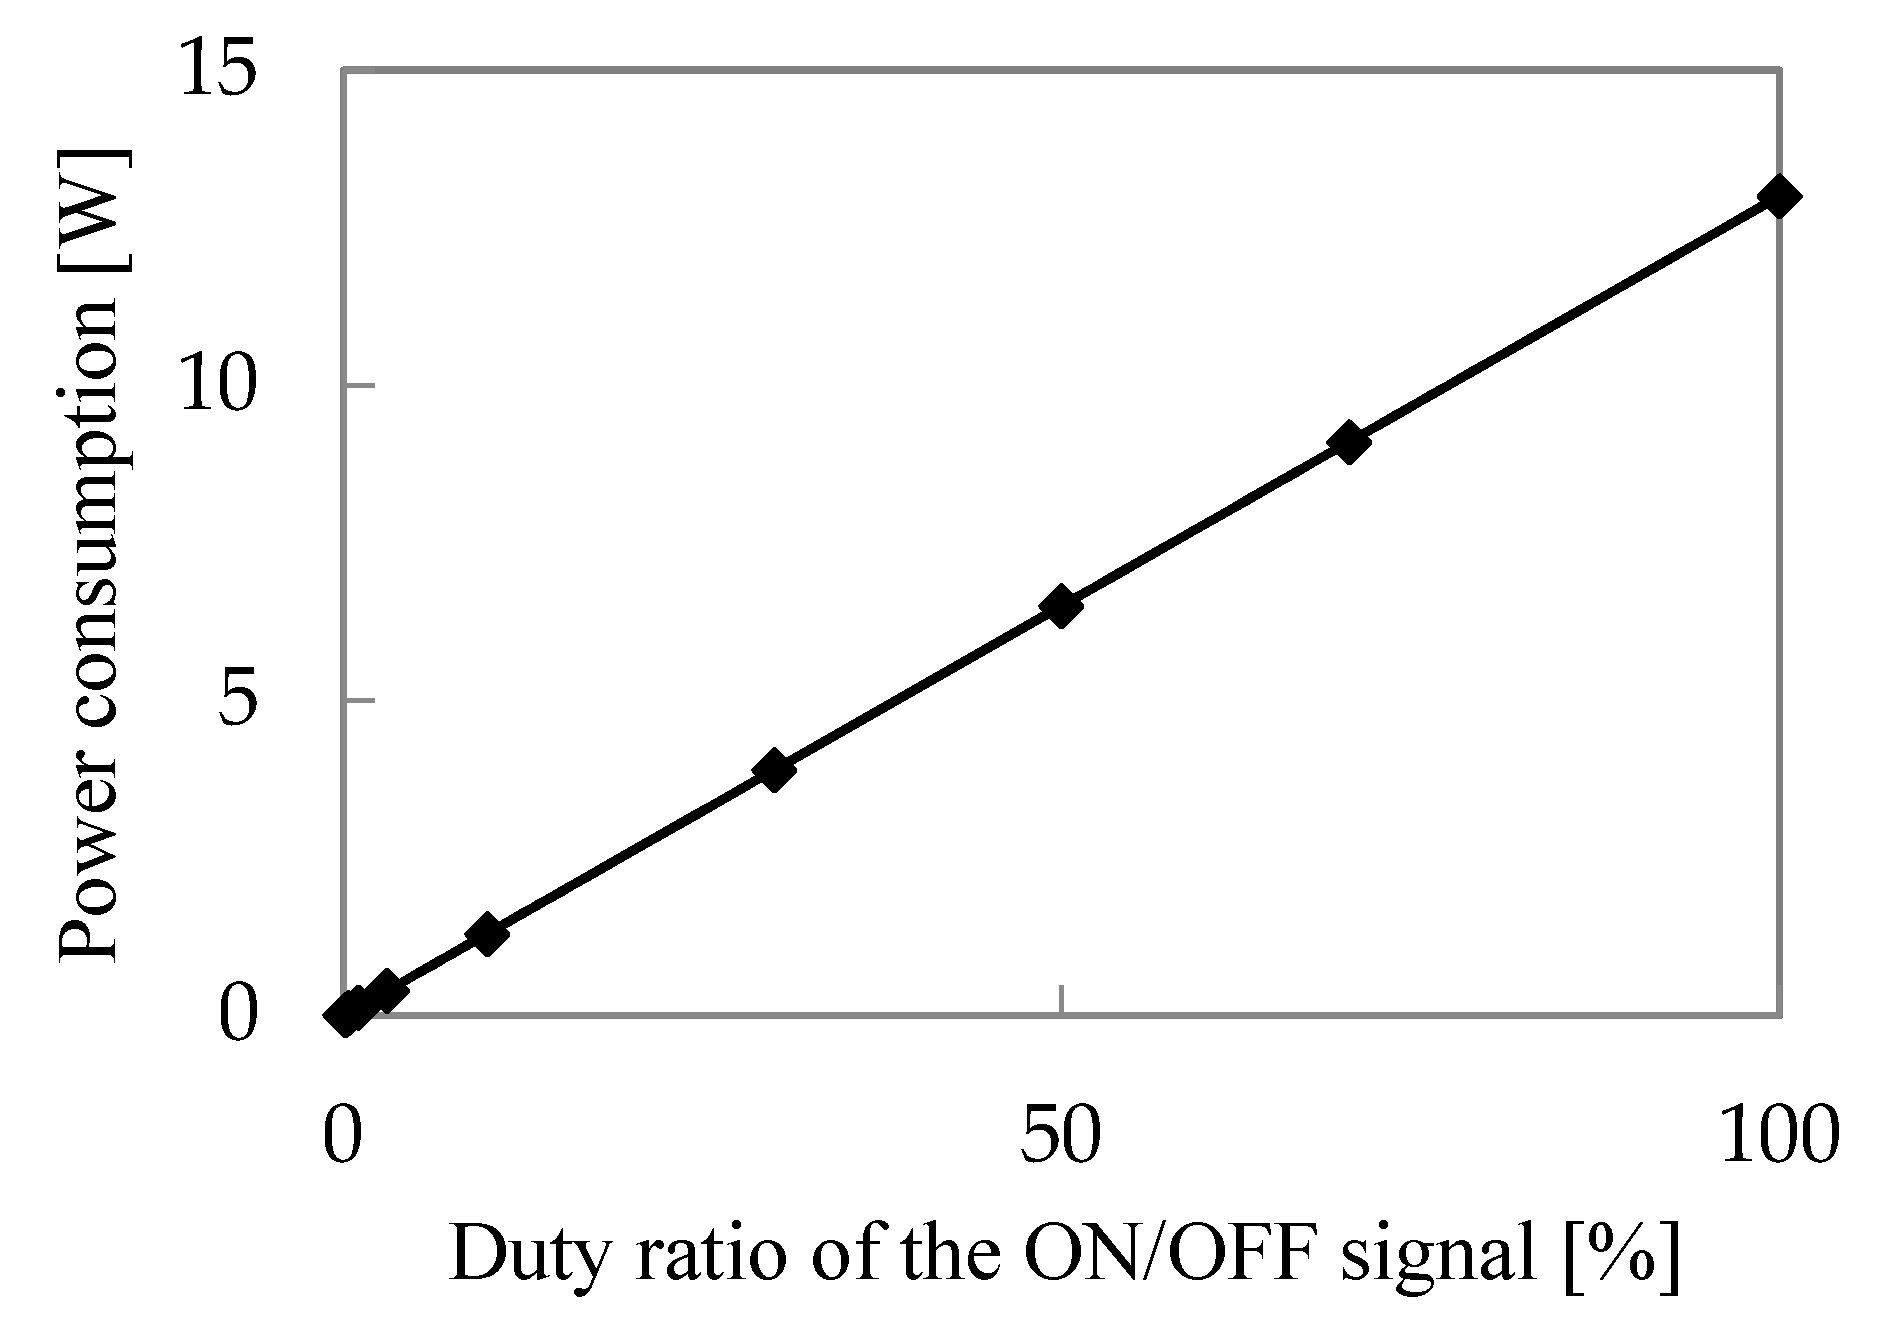
Figure 5 shows the power consumption of the excimer lamp proportional to the duty ratio of the ON/OFF signal. When the duty ratio was 100%, power consumption was 13 W (187 μJ times 70 kHz). When controlling the plasma power by varying the discharge voltage, it is difficult to adjust due to the non-linear characteristics [45]. However, plasma energy could be linearly controlled by the ON/OFF duty ratio.
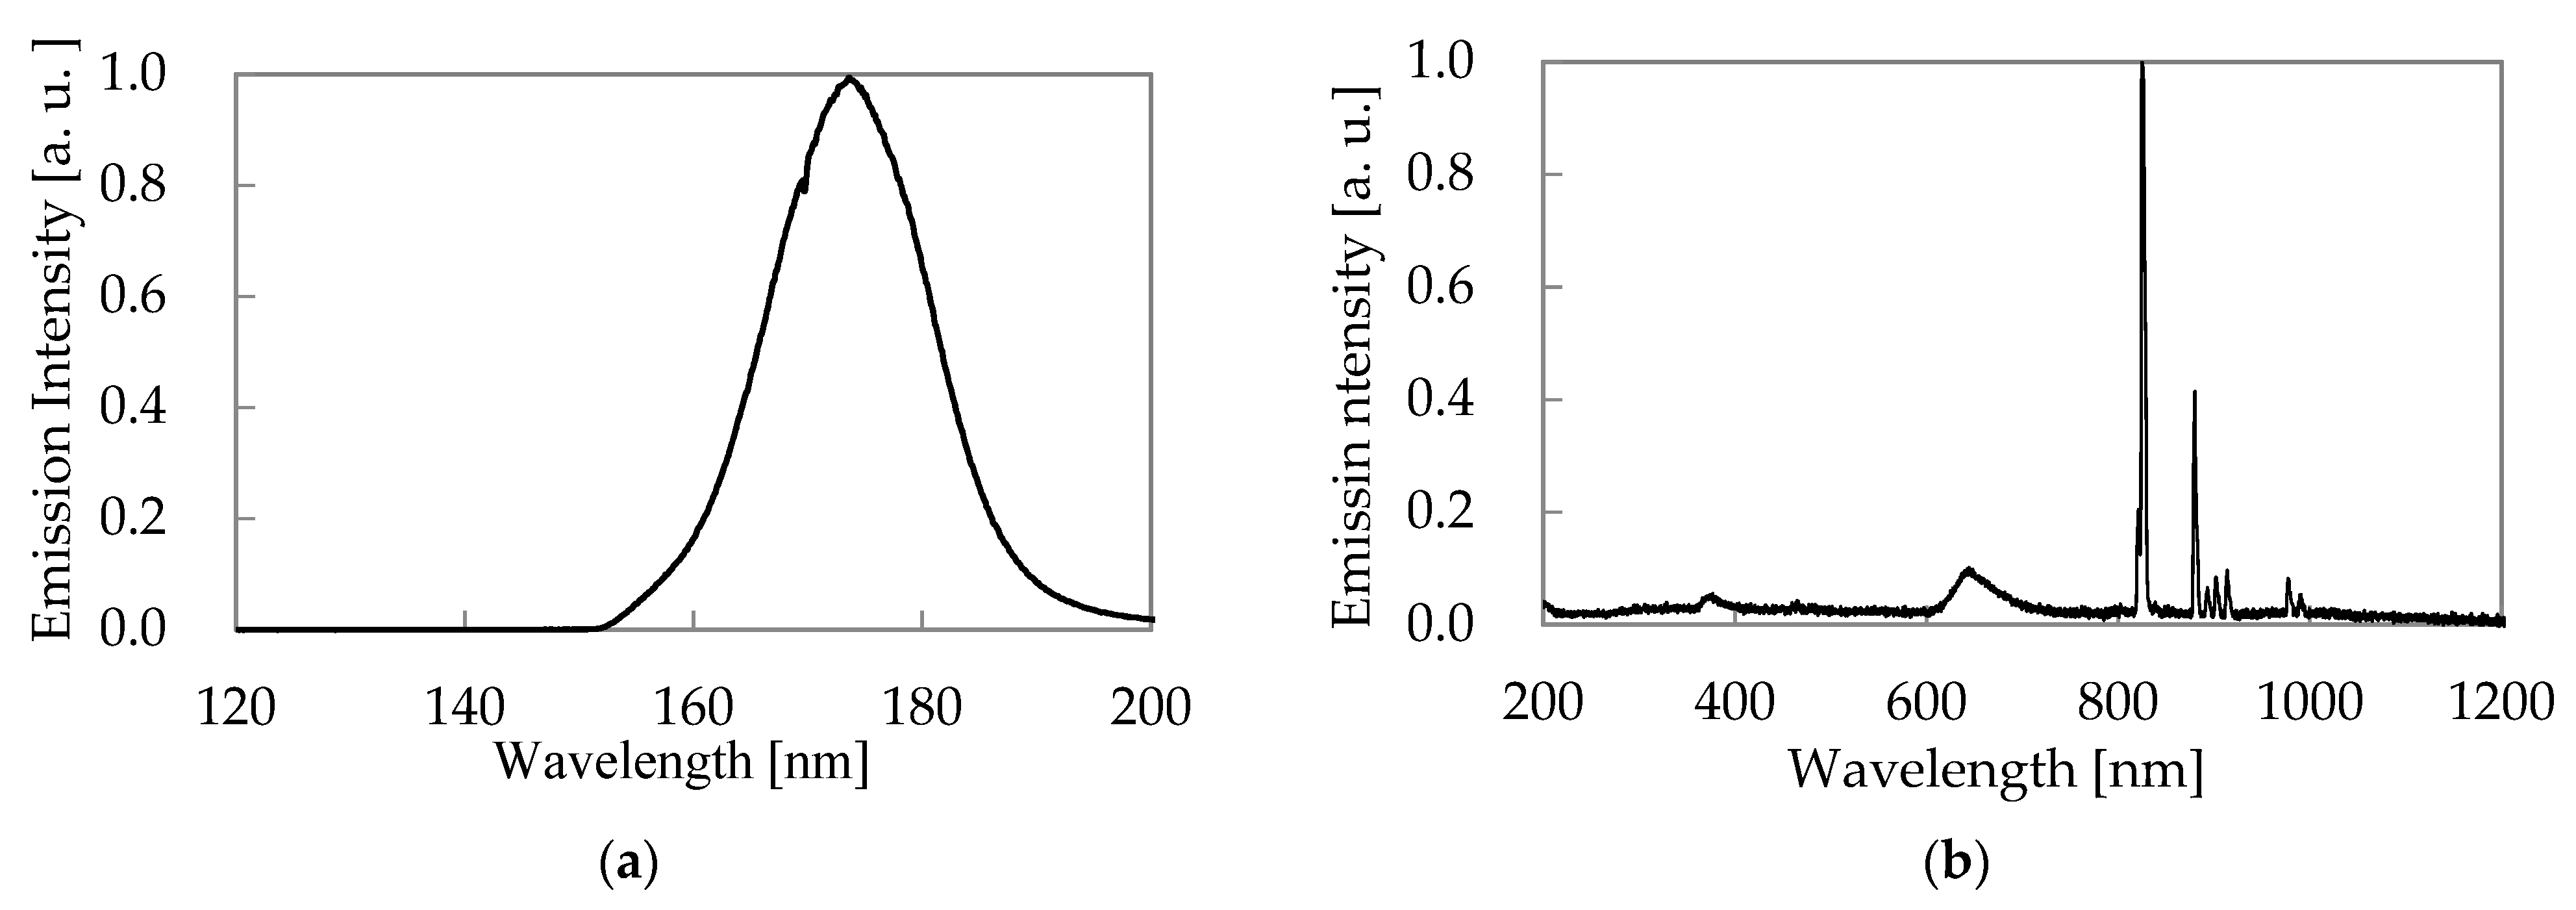
Figure 6 shows the emission spectra of the excimer lamp when N2 gas was flowed to the SUS chamber and the duty ratio of the ON/OFF signal was 100%. Figure 6a shows the VUV region emission spectra. For the light emission of the peak wavelength of 172 nm, a full width at a half height of 16 nm was observed. This characteristic VUV light is emitted from the second continuum of the xenon excimer [46]. The first continuum peak and second continuum peak are about same order of value when the gas pressure is about 5–20 kPa [47], although the first continuum of the xenon excimer peak at 152 nm was not detected. This could be due to the VUV adsorption by quartz glass [48] or nitrogen molecules [49].
VUV light emission is generated by the following process in Equations (3)–(5) [50]. The Xenon atom was excited by the electrons in plasma. The excited xenon atom and ground state xenon atoms generated the xenon excimer ( Xe 2 * ) by a three-body reaction. The light emission of 172 nm occurred by dissociation of the xenon excimer to the xenon atoms. Figure 6b shows the UV–IR emission spectra. Light emissions of 823 nm, 828 nm, 882 nm, 985 nm, 905 nm, 916 nm, 980 nm and 992 nm by 6p–6s transition of xenon atoms were observed [51].
  Xe   + e   Xe *
  Xe * + 2 Xe   Xe 2 * + Xe
  Xe 2 *   2 X e + h ν   ( 172   nm )
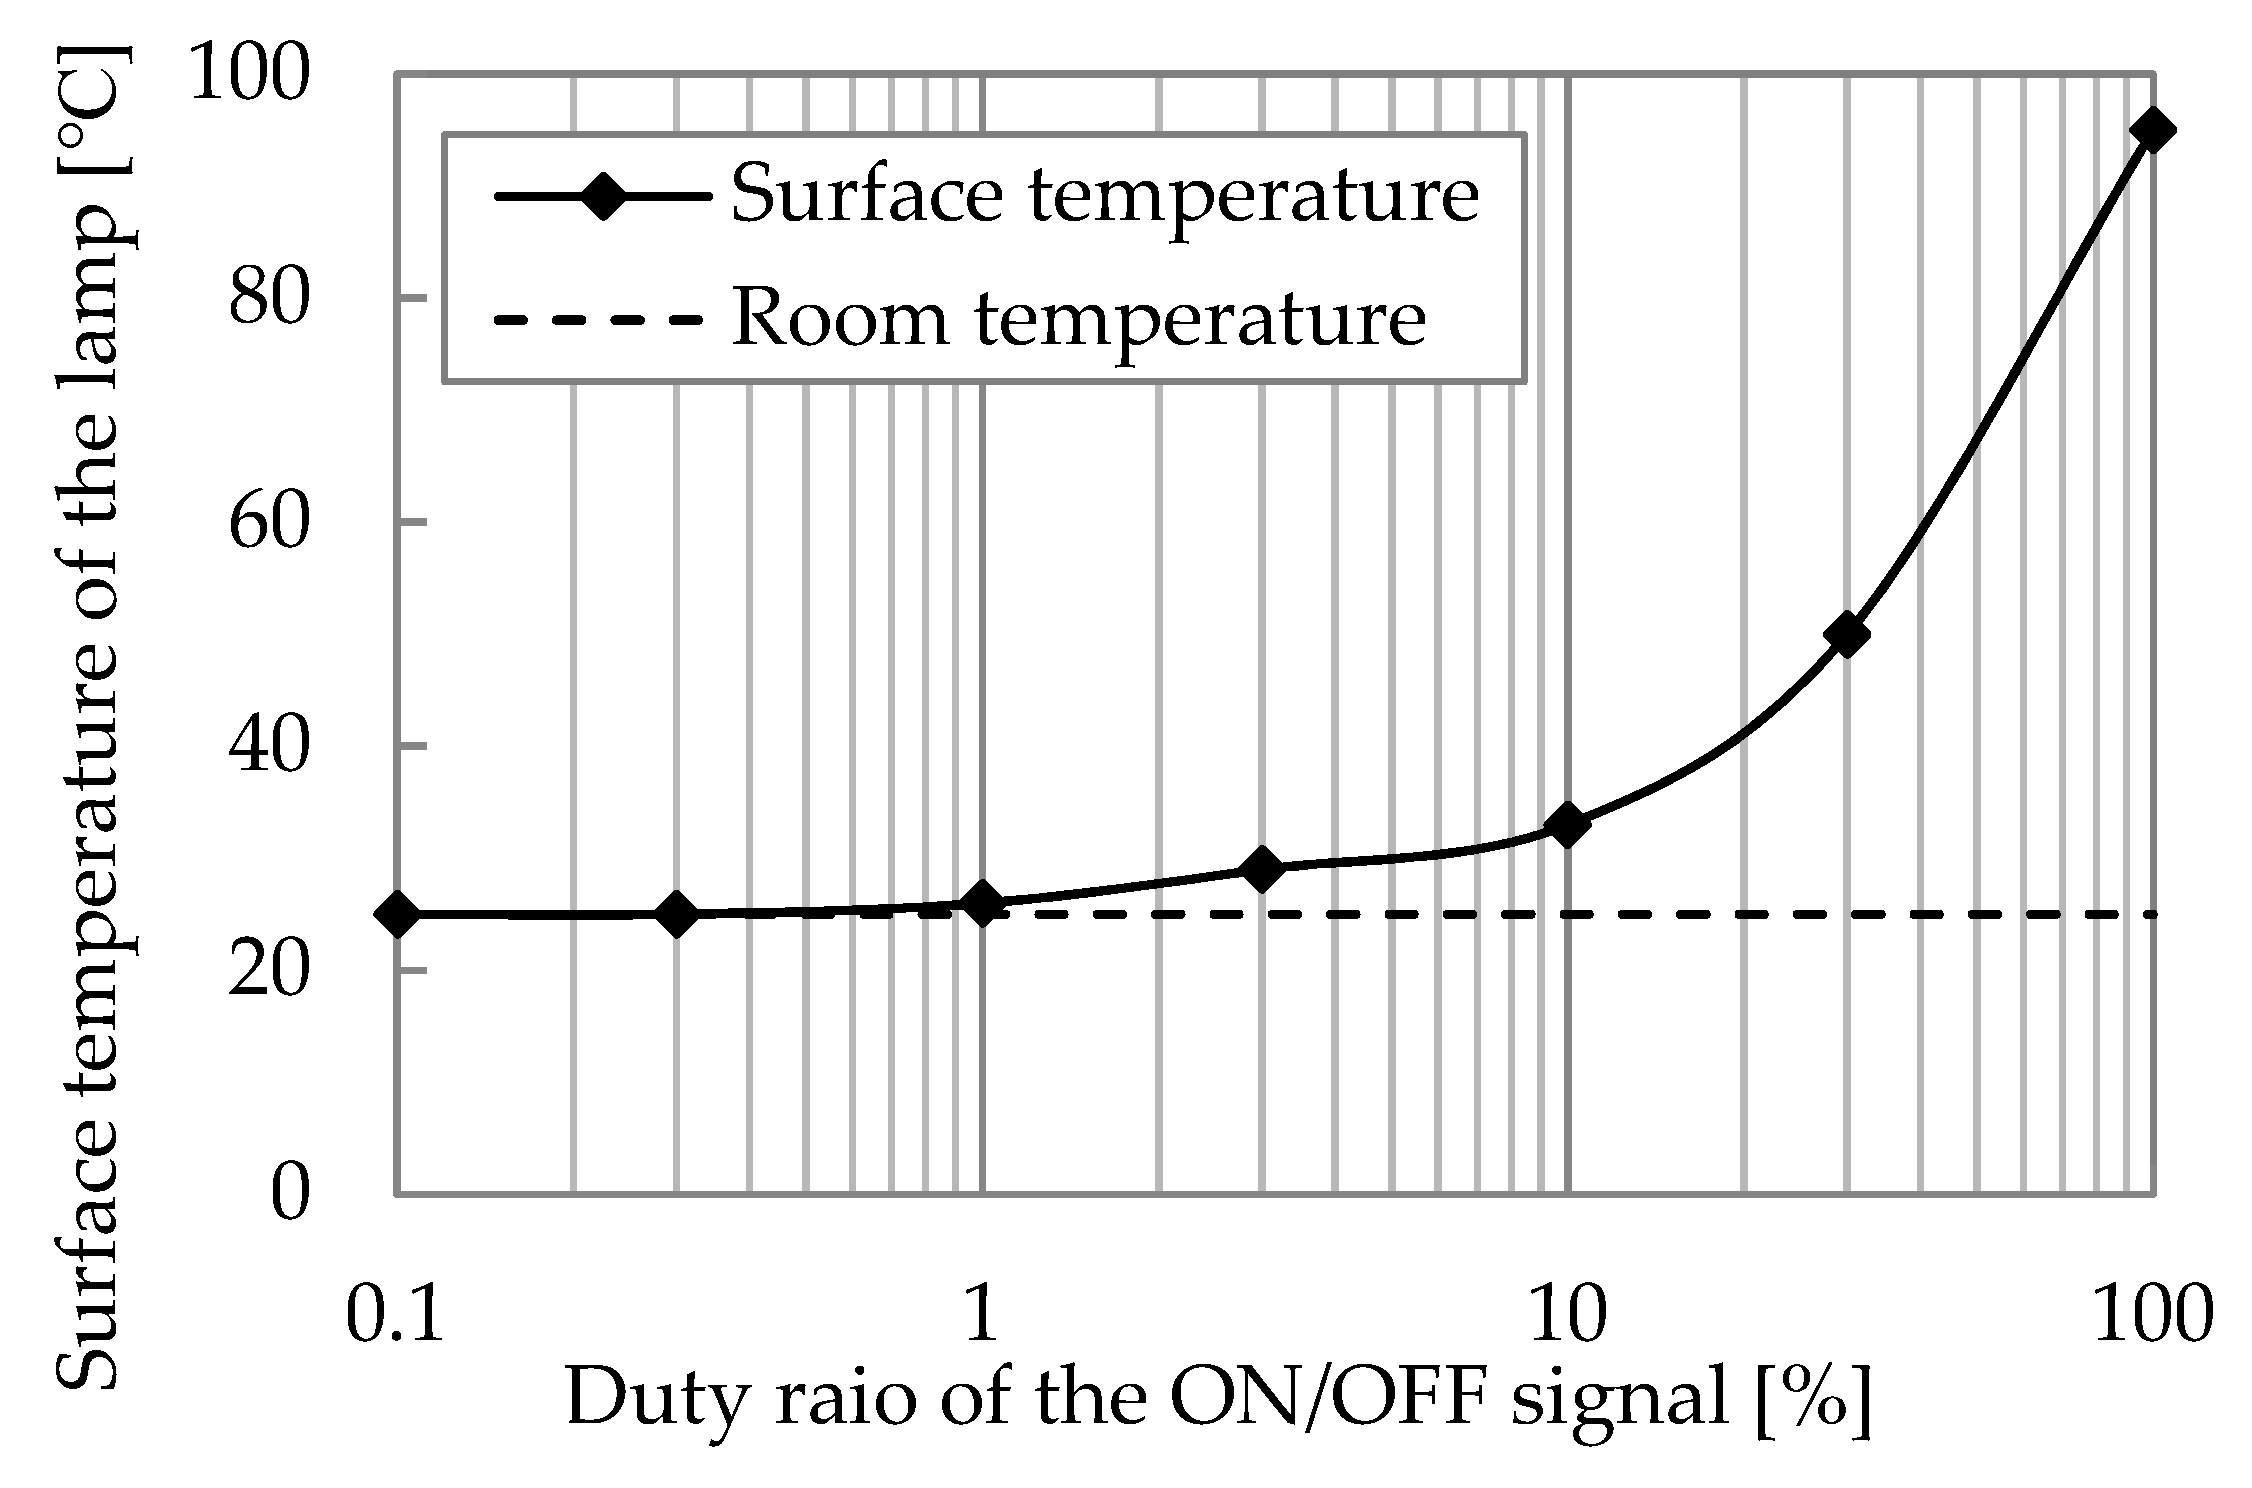
Figure 7 shows the dependence of the surface temperature of the excimer lamp on the duty ratio of the ON/OFF signal when room air was flowed to the SUS chamber. When the duty ratio was 1% and less, the surface temperature was nearly equal to the room temperature. When the duty ratio was 100%, the surface temperature was up to 95 °C. The surface area of excimer lamp was about 7.3 × 10 3   m 2 (size: 115 mm × 20 mm × 10 mm), and the temperature difference between the surface and environment was 70 °C at a power consumption of 13 W. The heat transfer coefficient could be calculated as power consumption divided by the product of the temperature difference and surface, are and its value was 25 W/(m2 °C). When considering the heat transfer coefficient, heat was diffused by natural convection [52].
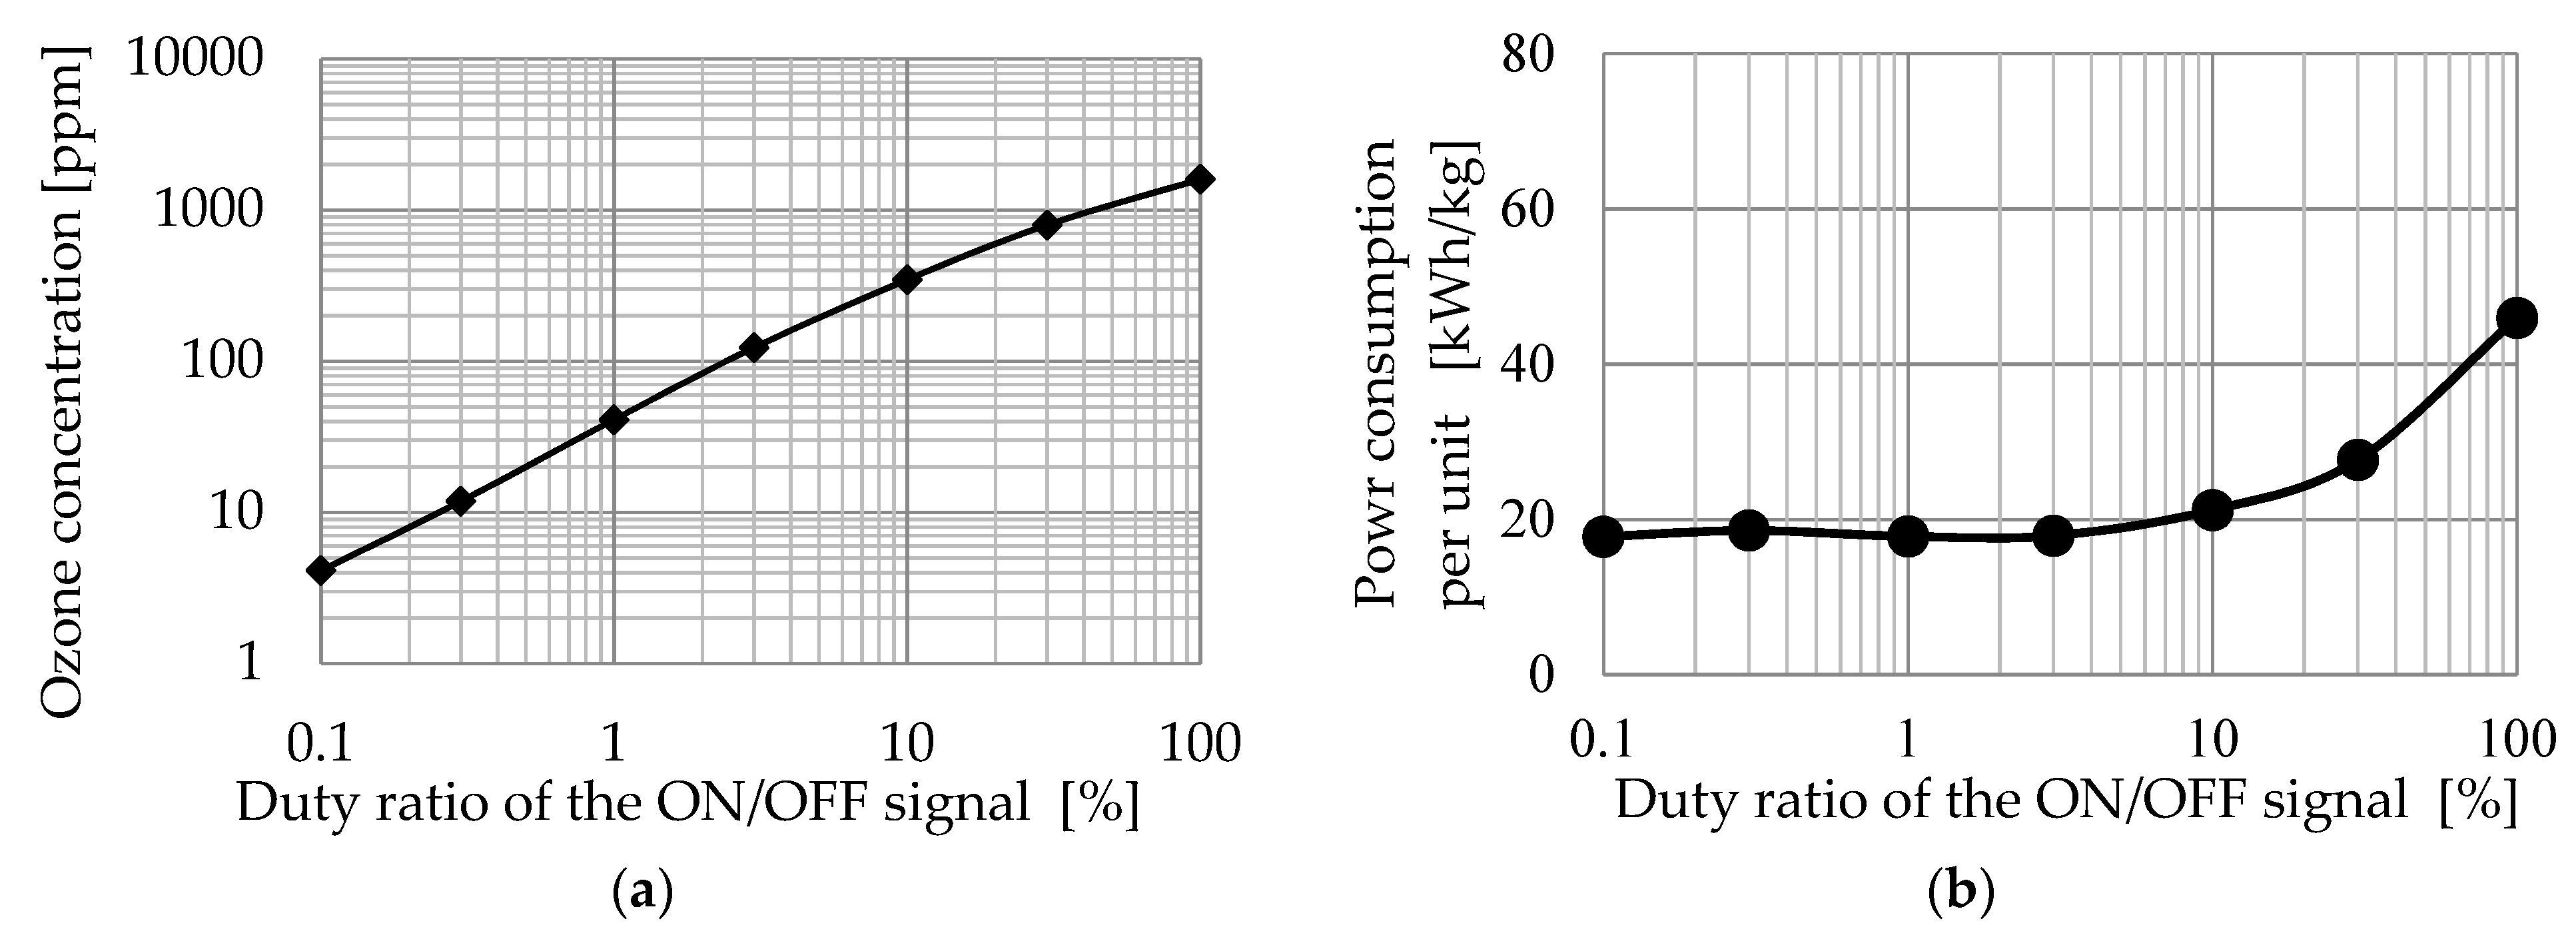
Figure 8 shows the dependence of the ozone generation characteristics on the duty ratio when the room air was flowed. Figure 8a shows the ozone concentration versus duty ratio. By increasing the duty ratio, the ozone concentration was increased. When the duty ratios were 1% and 100%, the ozone concentrations were 41 ppm and 1600 ppm, respectively. Saturation behavior of ozone concentration was observed above 3% of the duty ratio. Saturation phenomena occurred due to the ozone decomposition by VUV adsorption and the self-decomposition described below. In order to improve ozone generation efficiency at high energy consumption, it was necessary to increase the flow rate. Because the heat transfer coefficient could be increased by forced convection, ozone concentration would be decreased by increasing the flow rate.
Ozone generation by VUV irradiation to air occurs by the following process in Equations (6)–(8) [53]. The oxygen molecule is decomposed to singlet oxygen O ( D 1 ) and triplet oxygen O ( P 3 ) by VUV irradiation. Singlet oxygen is transited to triplet oxygen by collision with neutral molecules M. Triplet oxygen, oxygen molecules and neutral molecules generate ozone by a three-body reaction.
Energy consumption per unit of ozone generation was calculated by Equation (9) [54]. η   ( kWh / kg ) is the energy consumption per unit of ozone generation, Q (L/min) is flow rate of air, C o z o n e   ( ppm ) is ozone concentration and P (W) is power consumption of the excimer lamp. Figure 8b shows the energy consumption per unit of ozone generation versus duty ratio when room air was flowed. Energy consumption per unit was increased by increasing the duty ratio when it was 3% or greater. When the duty ratios were 1% and 100%, the energy consumption per unit was 18 kWh/kg and 46 kWh/kg, respectively.
When a high duty ratio signal was applied, an increase in power consumption per unit could occur by following processes. When a high duty ratio signal was applied, thermal decomposition of ozone was accelerated in accordance with Equation (10). Furthermore, with a higher ozone concentration, decomposition occurred by VUV irradiation and collision with triplet oxygen, as specified in Equations (11) and (12) [55].
O 2 + h ν   ( 172   nm )     O ( D 1 ) + O ( P 3 )
O ( D 1 ) + M     O ( P 3 ) + M
O ( P 3 ) + O 2 +   M     O 3 + M
η   [ g / kWh ] = 35.1 273 + T × Q C o z o n e P
O 3 + M O 2 + O ( P 3 ) + M
O 3 + h ν   ( 172   nm )   O 2 + O  
O 3 + O ( P 3 )   O 2
By flowing room air at a flow rate of 1.5 L/min (25 °C, 50%) and generating ozone of 1600 ppm by lighting the excimer lamp, NOx was not detected (less than 5 ppm). NOx concentration per ozone concentration was less than 0.32%. Generally, when generating ozone by atmospheric air discharge without PSA, NOx per ozone would be around 10% [56]. The mechanism of the excimer lamp that does not generate NOx is described as below. The first reason is that nitrogen molecules do not absorb VUV light of 150 nm and longer wavelengths [48], and quartz glass does not transmit VUV light of 150 nm and shorter wavelengths [49]. The second reason is that if NOx was generated slightly, NOx could be converted to nitrogen molecules by photochemical reactions in accordance with Equations (13)–(16) [57]. NO2 could be decomposed to NO and nitrogen atoms N by VUV irradiation. NO could be decomposed by nitrogen atoms and triplet oxygen by VUV irradiation. Nitrogen atoms and neutral molecules could generate nitrogen molecules by a three-body reaction. Nitrogen atoms and NO could generate nitrogen molecules. Thus, an excimer lamp could generate NOx free ozone, without expensive equipment such as a PSA oxygen generator.
NO 2 + h ν   ( 172   nm )   NO + N ( S 4 )
NO + h ν   ( 172   nm )   N ( S 4 ) + O ( P 3 )
N ( S 4 ) + N ( S 4 ) + M     N 2 + M
N ( S 4 ) + NO     N 2 + O ( P 3 )
Energy consumption per unit of atmospheric oxygen discharge using a PSA oxygen generator, electrolysis and a low-pressure mercury lamp is about 10 kWh/kg, 60 kWh/kg and 550 kWh/kg, respectively [58]. For the energy consumption per unit of xenon excimer lamp, 18 kWh/kg has a high efficiency next to the atmospheric oxygen discharge. Conventionally, excimer lamps have been applied for photochemical surface treatment [59]. Excimer lamps could also be applied for ozone generation for distributed small-scale systems, due to their high ozone generation efficiency and not requiring expensive systems such as PSA oxygen generators.

3.3. Performance Assessment of Ozone Catalytic Oxidation

3.3.1. Optimizing the Ozone Addition Amount

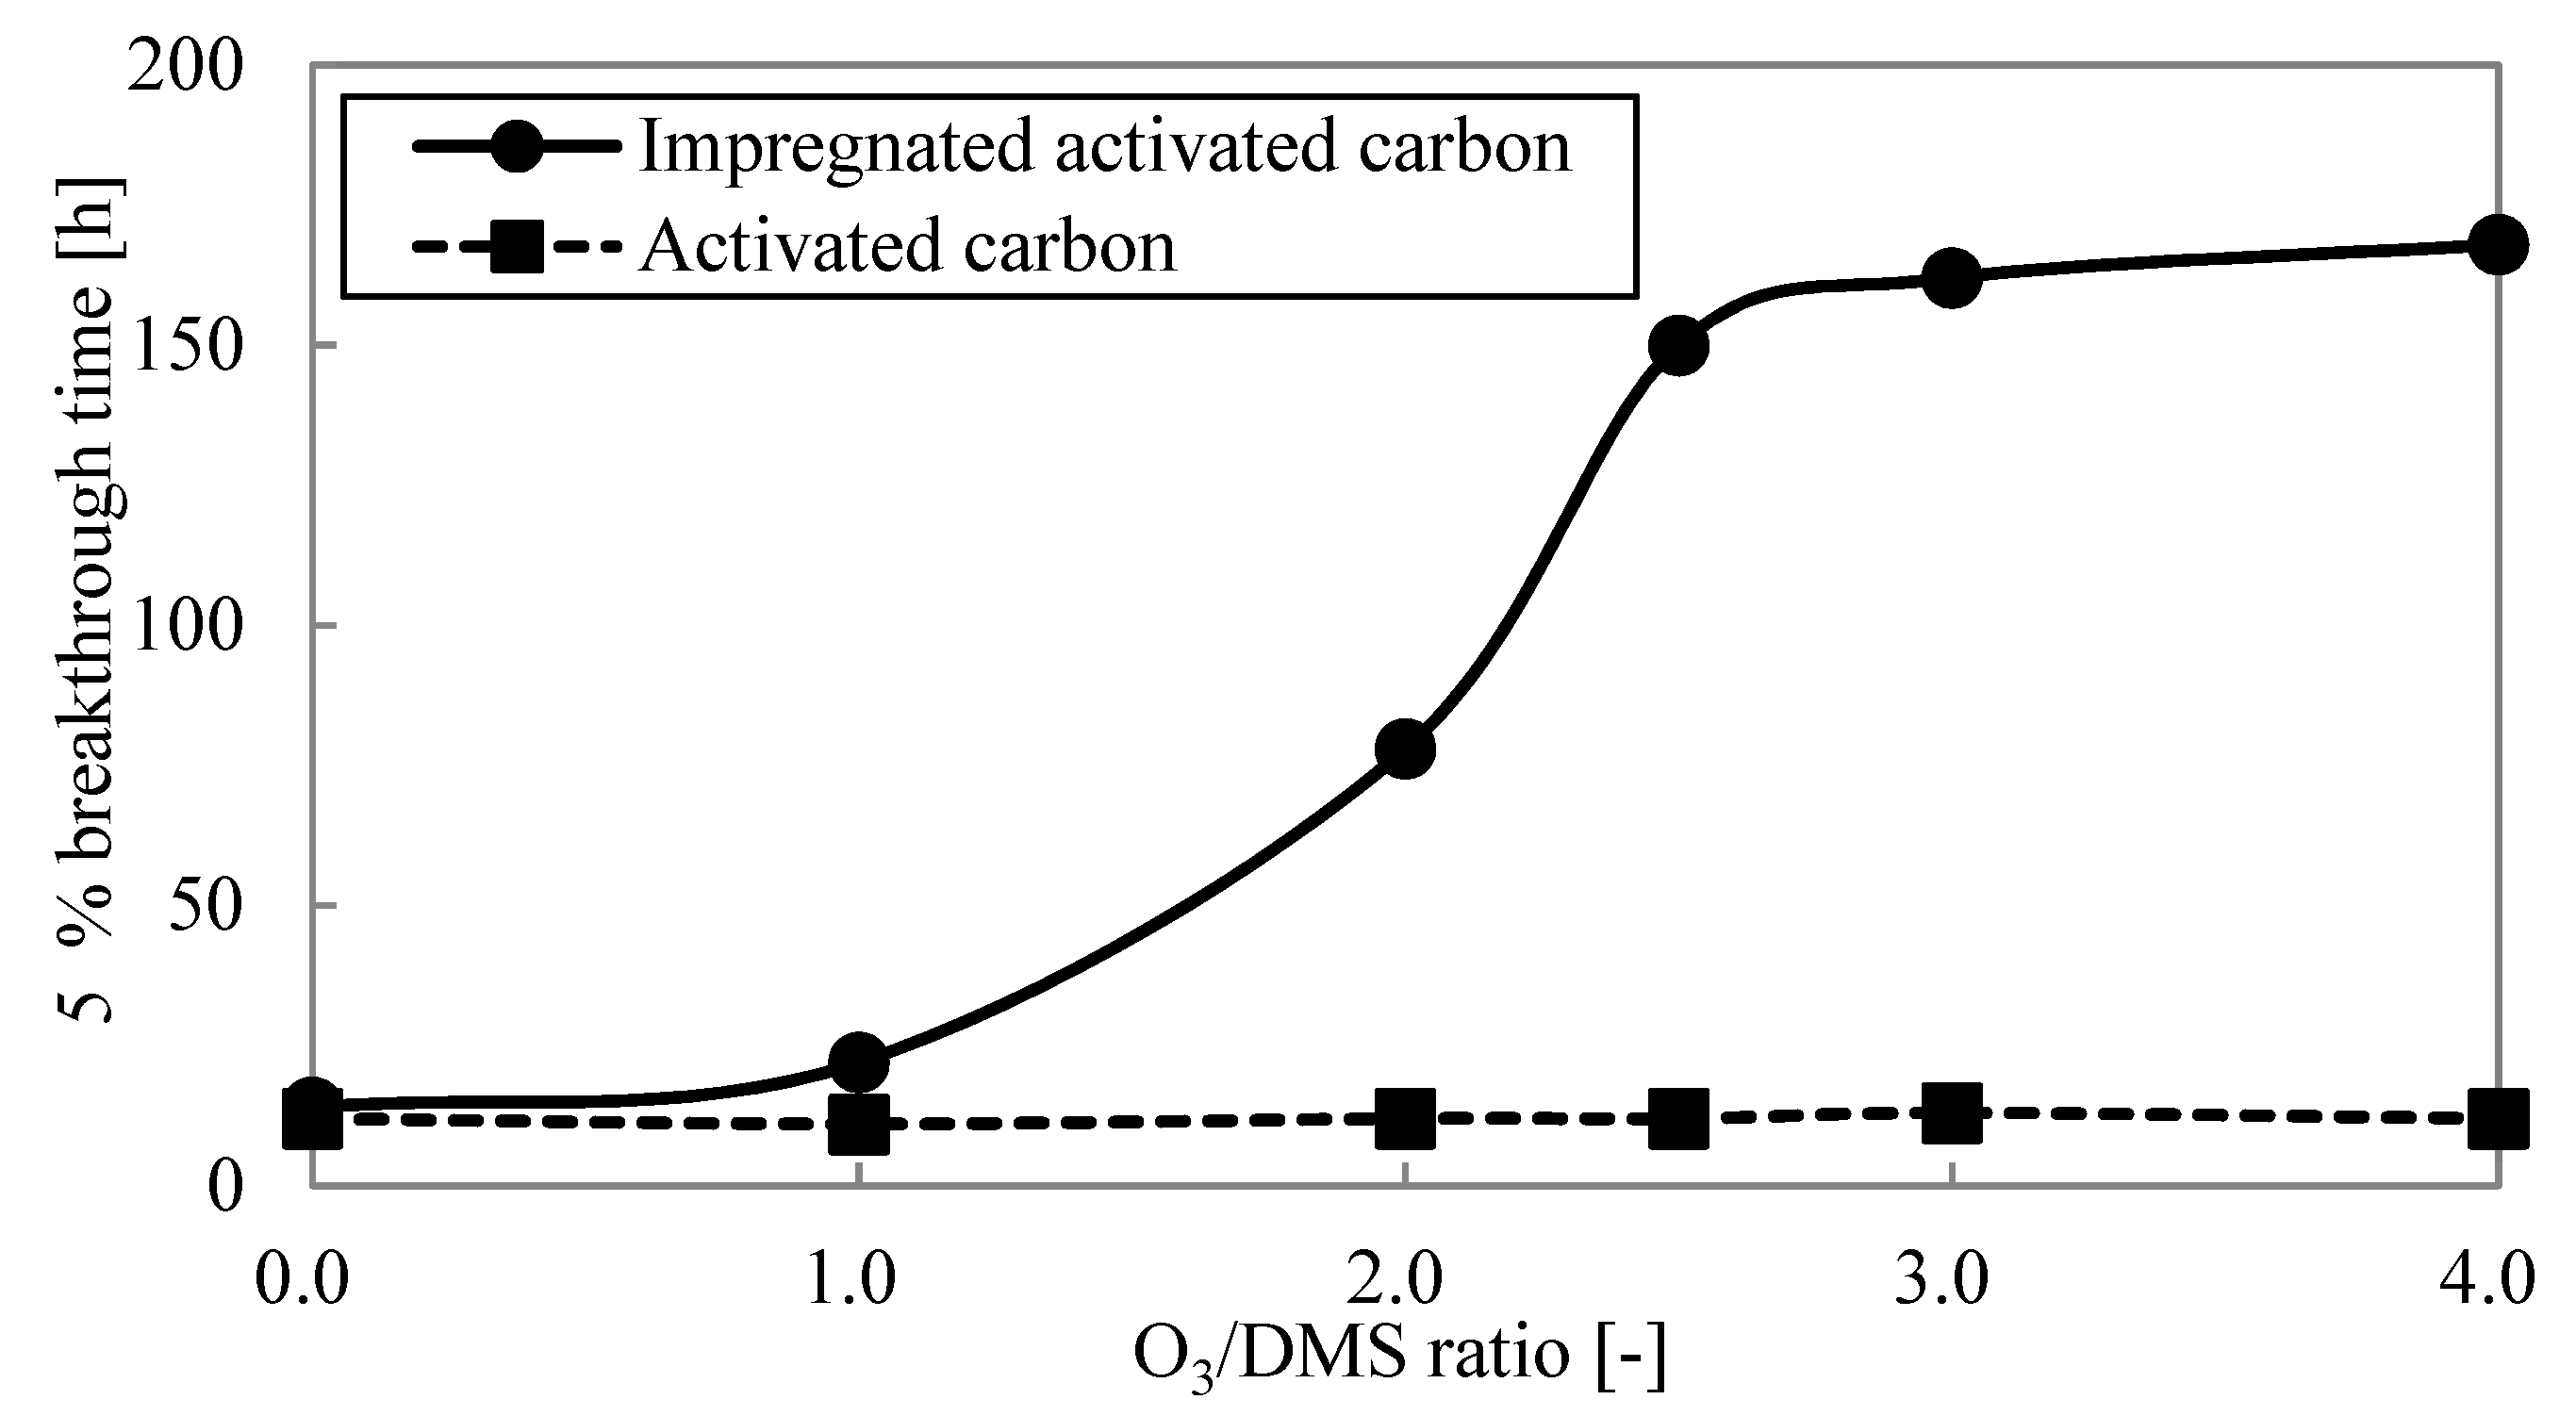
Figure 9 shows dependence of 5% breakthrough time on O3/DMS. For activated carbon at 5% breakthrough, time was not changed by varying O3/DMS. On the other hand, by increasing O3/DMS, the 5% breakthrough time of impregnated activated carbon increased. However, when O3/DMS was more than 2.5, 5% breakthrough time was saturated. This saturation phenomena shows that the O3/DMS of 2.5 was optimal. These results show that impregnated activated carbon could be useful for ozone catalytic oxidation.

3.3.2. Dynamic Adsorption Experiment

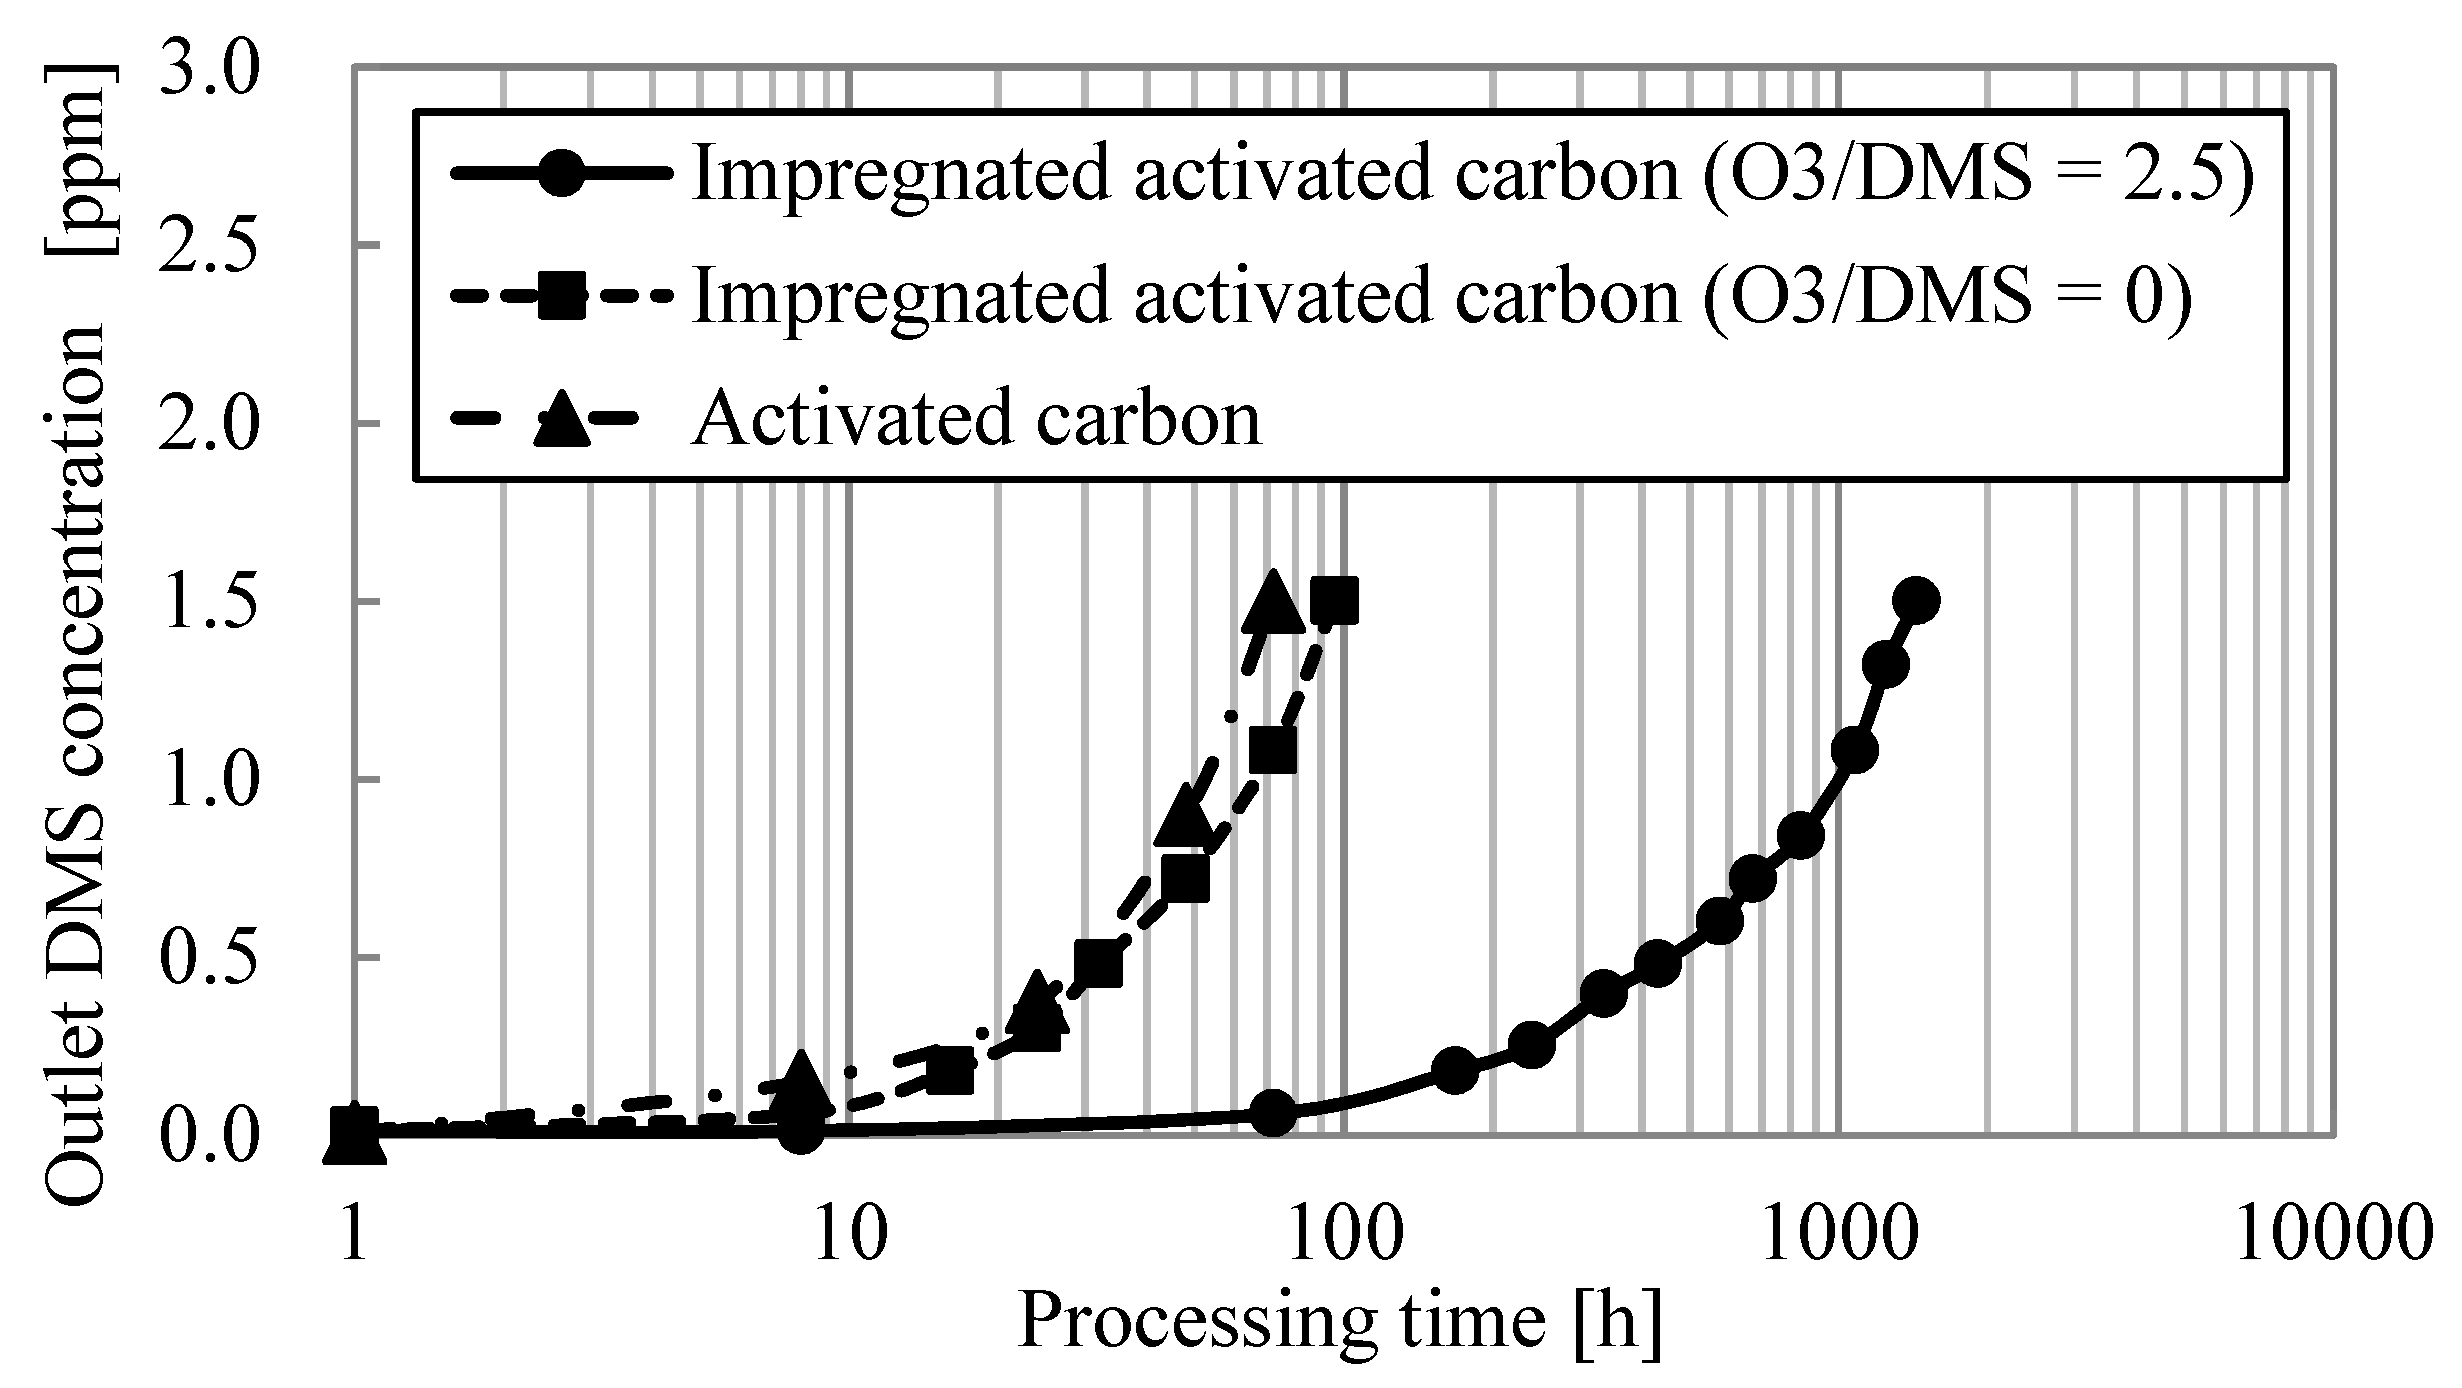
Dynamic adsorption experiments were carried out when the adsorbent was activated carbon at 0 O3/DMS and impregnated activated carbon at 0 and 2.5 O3/DMS. Figure 10 shows the time variation of the outlet DMS concentration in the dynamic adsorption experiments, and Table 3 shows the 5% and 50% breakthrough times. Table 4 shows the calculated values of adsorption capacity and adsorption rate constant using values from Table 3 and Equations (1) and (2).
The adsorption capacity of impregnated activated carbon at 2.5 O3/DMS was 15 times that of impregnated activated carbon at 0 O3/DMS. These results show impregnated activated carbon could act as a catalyst of ozone oxidation. The adsorption rate constant was not changed by varying O3/DMS. These results show that the DMS oxidation did not affect the adsorption rate.
The adsorption process is shown below [60] and includes (1) diffusion in the fluid film; (2) diffusion in the fine pores of the adsorbent; (3) adsorption to the surface of the adsorbent; (4) diffusion in the surface of adsorbent. Generally, (1) and (2) are the rate of determining the processes of adsorption. Thus, DMS oxidation would occur on the surface of the impregnated activated carbon.
By comparing result of impregnated activated carbon at 0 O3/DMS and the result of activated carbon at 0 O3/DMS, it can be seen that the adsorption capacity of impregnated activated carbon was higher than that of activated carbon. This is due to DMS oxidation by iodic acid. The adsorption rate constant of impregnated activated carbon and that of activated carbon were almost the same. This result shows impregnation was not affected by fluid film or fine pore diffusion rates.
Figure 11 shows outlet gas concentrations of SO2 and ozone, when the impregnated activated carbon was packed and the O3/DMS was 2.5. Comparing Figure 10 and Figure 11, ozone and DMS had the same tendency. At a processing time of 1000 h, the concentration of ozone and DMS were 1.7 ppm and 1.0 ppm, respectively. By increasing O3/DMS to more than 2.5, the impregnated activated carbon was broken earlier due to the high ozone concentration, thus reconfirming that 2.5 O3/DMS is the optimal value. SO2 was not detected (less than 0.1 ppm). In addition, SO2 was not detected when impregnated activated carbon or activated carbon was packed at 0 O3/DMS.

3.3.3. Analysis of Impregnated Activated Carbon

Table 5 shows MSA and H2SO4 concentrations and pH of the specimen in 3 g of adsorbent after dynamic adsorption experiment added 100 mL of ion exchanged water. MSA was detected from the impregnated activated carbon after processing 2.5 O3/DMS. The oxidation processes of DMS are as shown in Equation (17) [36]. H2SO4 was detected from impregnated activated carbon before the adsorption experiment. This result shows that H2SO4 was used for inorganic acid on the impregnated activated carbon.
The pH of impregnated activated carbon at 0 O3/DMS was increased to pH 2.7, as compared to before adsorption, which was pH 2.3. This is due to the hydrogen ion consumption by the oxidation reaction of iodic acid. The oxidation reaction in the acidic solution is shown in Equation (18) [61]. IO3- is a dissociated iodic acid, E0 is the standard oxidation potential of an iodic acid. Inversely, the pH of impregnated activated carbon at 2.5 O3/DMS decreased to pH 2.0 as compared to before adsorption. This is due to the acid dissociation of MSA and iodine oxidation by ozone.
In addition, the oxidation reaction of iodic acid in neutral or basic solution is shown in Equation (19) [61]. This shows that the oxidation potential of iodic acid decreased by increasing the pH. Thus, H2SO4 plays an important role in ozone catalytic oxidation.
( CH 3 ) 2 S   ( DMS ) O 3 ( CH 3 ) 2 SO   ( DMSO ) OH ˙ CH 3 SO 2 H   ( MSIA ) O 3 CH 3 SO 3 H   ( MSA )
2 IO 3 + 12 H + + 10 e I 2 + 6 H 2 O        E 0 = 1.195   V
IO 3 + 2 H 2 O + 6 e I + 6 OH        E 0 = 0.26   V

3.3.4. DMS Desorption Experiment

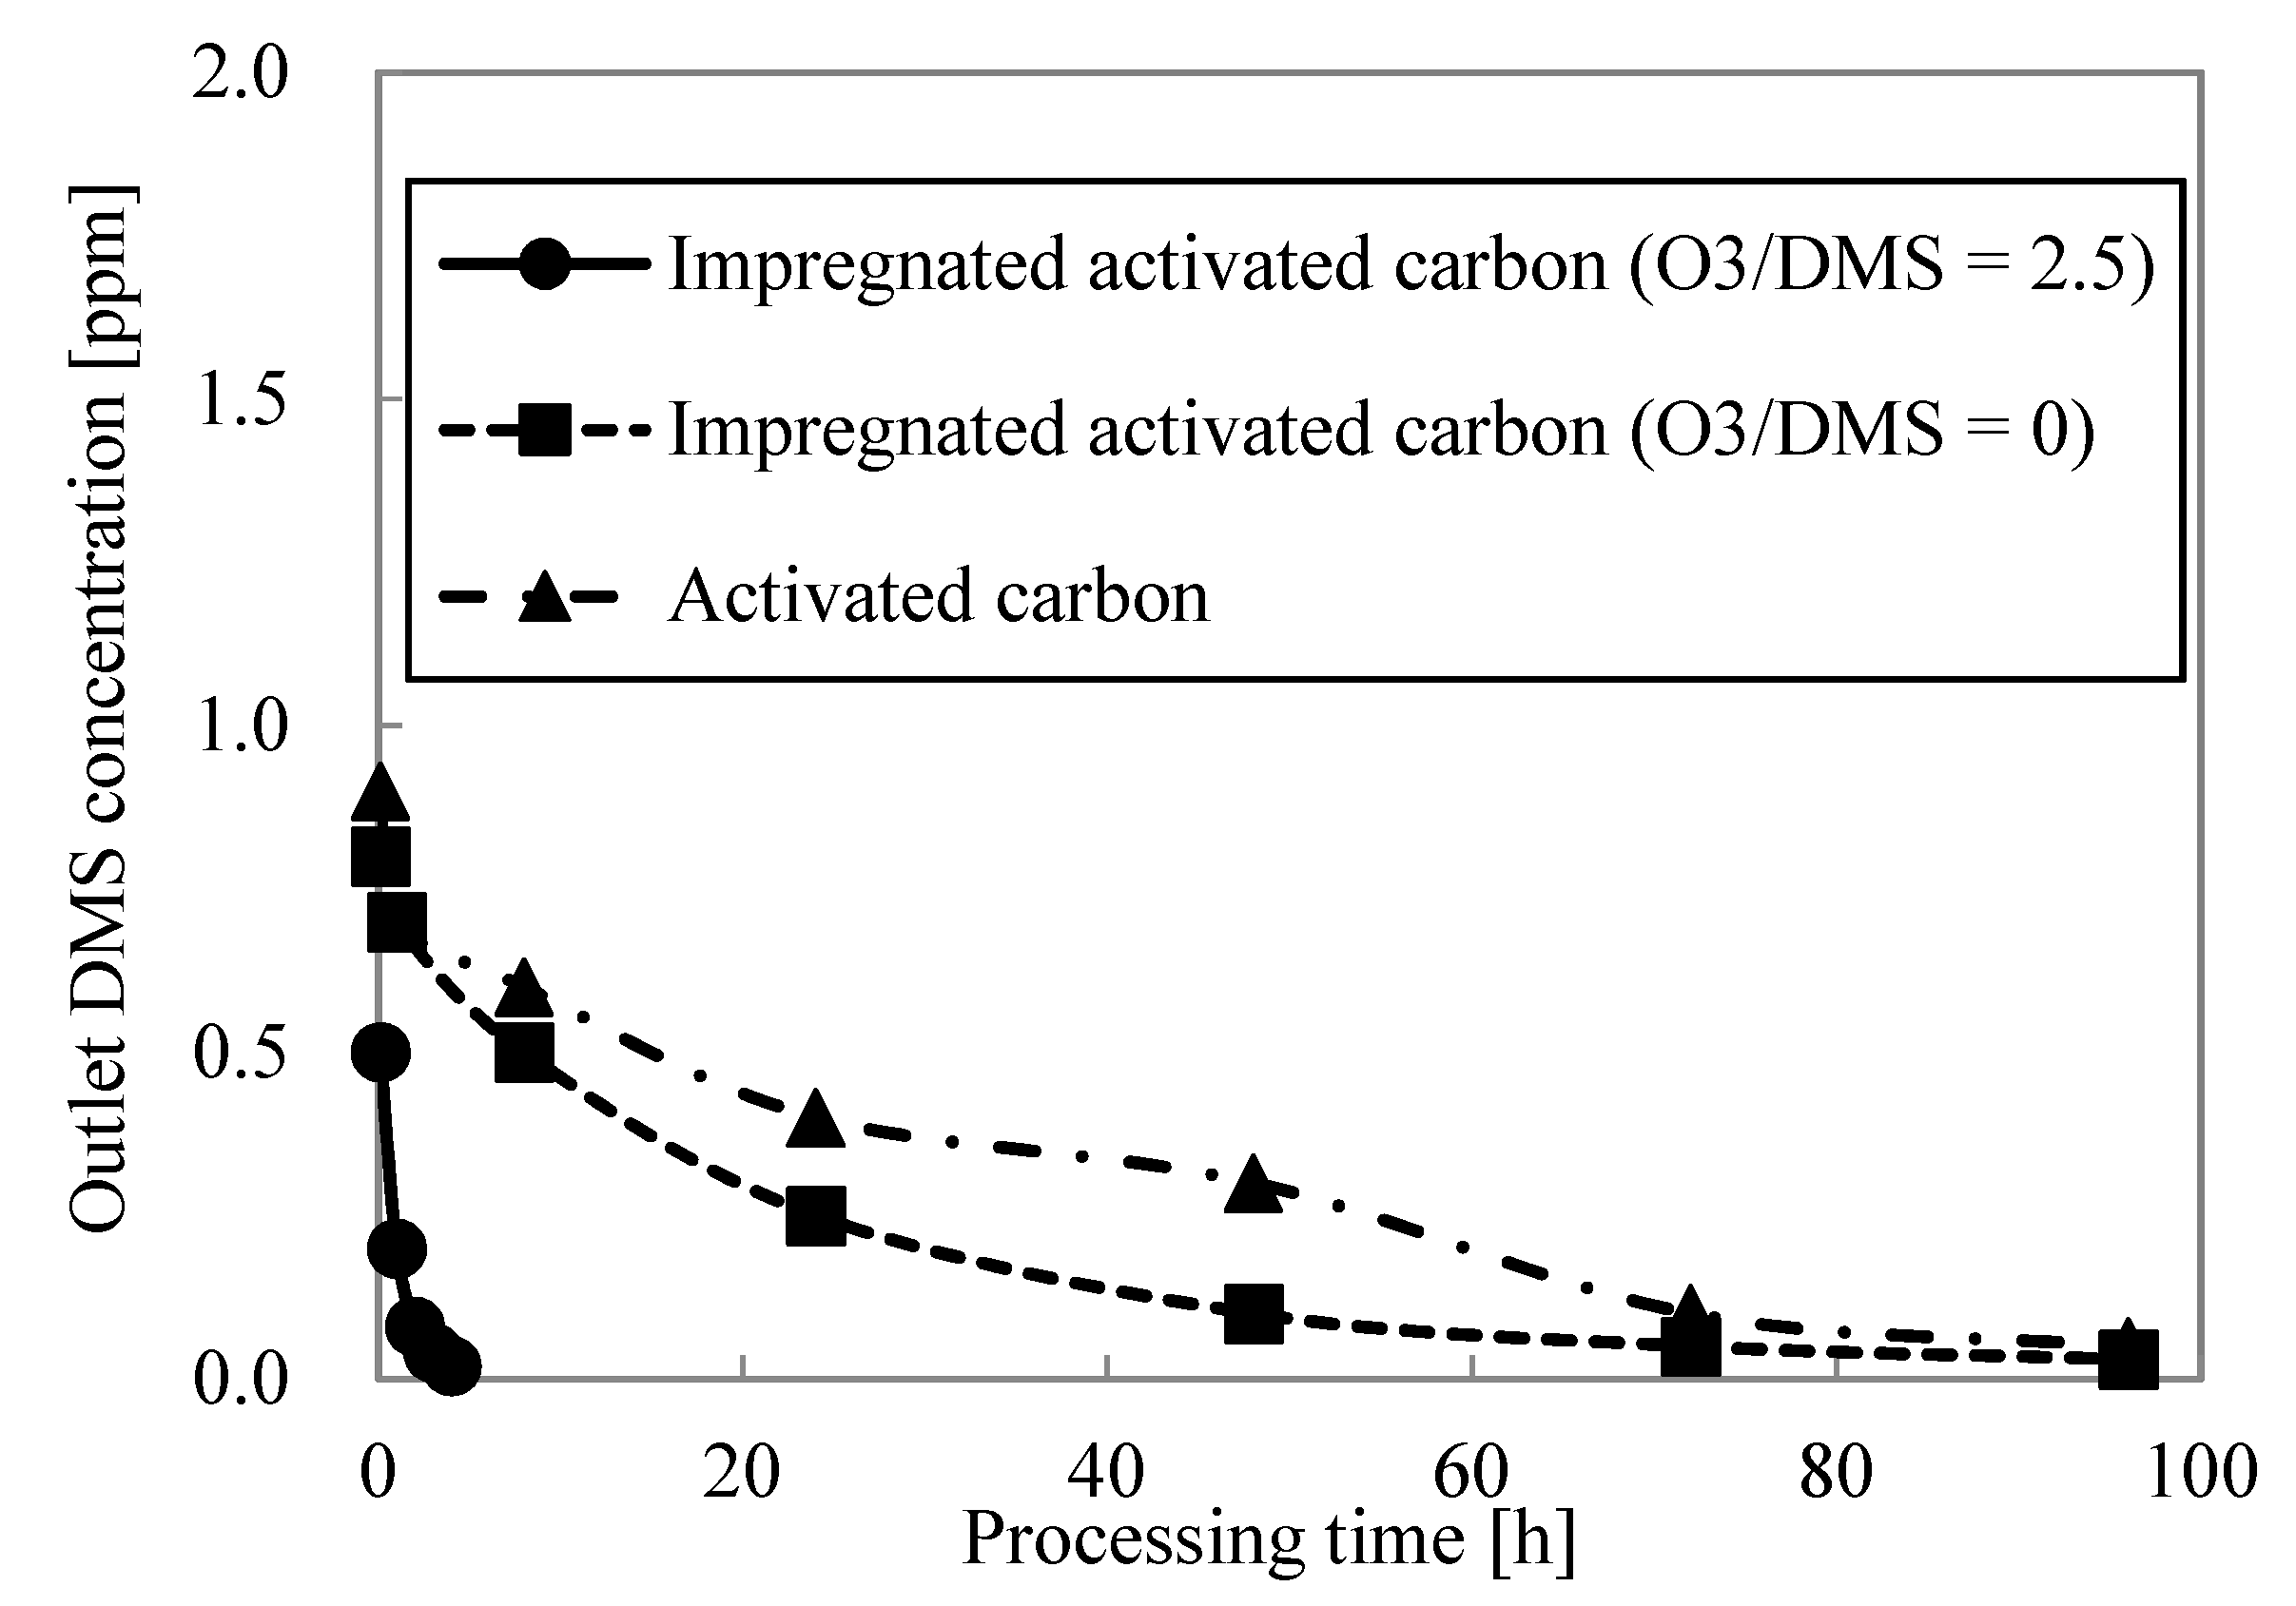
Figure 12 shows outlet DMS concentrations of adsorbents after the adsorption experiment by air flowed without generation of DMS and ozone. The DMS desorption amount in the desorption experiment Q d (mg) is calculated by the time integration of outlet DMS concentration in the desorption experiment, as shown in Equation (20).
In addition, the DMS adsorption amount in the dynamic adsorption experiment Q a (mg) is calculated by the time integration of inlet DMS concentration minus the outlet, as shown in Equation (21). c o ( t ) (ppm) and G (L/min) are the flow rate and time variation of the outlet DMS concentration, respectively. The desorption ratio is defined as Q d over Q d .
Table 6 shows the desorption ratios of each adsorbent. The desorption ratio of impregnated activated carbon at 0 O3/DMS was about half that of activated carbon at 0 O3/DMS. DMS adsorption using activated carbon occurred in part due to physical adsorption [62]. Thus, both physical and chemical adsorption contributed to the DMS gas removal by impregnated activated carbon without ozone generation. The desorption ratio of impregnated activated carbon at 2.5 O3/DMS was only 1/1000 times that of activated carbon at 0 O3/DMS. Thus, DMS gas removal by impregnated activated carbon at 2.5 O3/DMS was caused in part by the chemical adsorption.
Q d = 0.731 273 + T × GM 0 d t   c o ( t )   [ mg ]
Q a = 0.731 273 + T × GM 0 t 50 d t   ( c i c o ( t ) )   [ mg ]

4. Conclusions

In this study, the removal of gaseous dimethyl sulfide by ozone catalytic oxidation using a Vacuum-Ultra-Violet xenon excimer lamp and activated carbon impregnated with iodic acid and H2SO4 was investigated. The following conclusions were obtained from the series of conducted experiments.
(1)
The xenon excimer lamp’s energy consumption per unit of ozone generation was 18 kWh/kg. Its ozone generation efficiency was high compared to the atmospheric oxygen discharge. NOx generation ratio over ozone generation was less than 0.32%, confirming that the xenon excimer lamp could generate ozone without NOx generation.
(2)
The 5% breakthrough time was measured with varying ozone concentrations in the dynamic adsorption experiment, confirming that impregnated activated carbon could be utilized as a catalyst. The value of ozone concentration over dimethyl sulfide concentration was optimized to 2.5 by measuring the 5% breakthrough time in the dynamic adsorption experiment.
(3)
Adsorption capacity and adsorption rate constant were calculated by conducting dynamic dimethyl sulfide adsorption experiments. The adsorption capacity of impregnated activated carbon at 0 and 2.5 O3/DMS was 0.01 kg/kg and 0.15 kg/kg, respectively. Adsorption capacity was increased by ozone addition due to the ozone catalytic oxidation. The adsorption rate constant of impregnated activated carbon at 0 and 2.5 O3/DMS was 3.1 s−1 and 3.0 s−1, respectively. Adsorption rate constant did not change with ozone addition. This shows that dimethyl sulfide oxidation could be formed on the surface of impregnated activated carbon but does not determine processes, the fluid film or fine pore diffusions.
(4)
By analyzing the impregnated activated carbon after the dynamic adsorption experiment at 2.5 O3/DMS, methane sulfonic acid was detected. However, when O3/DMS was 0, methane sulfonic acid was generated in very small amounts. The pH of impregnated activated carbon before the adsorption experiment was 2.3. The pH of impregnated activated carbon after the adsorption of O3/DMS at 0 and 2.5 was 2.0 and 2.7, respectively. This pH increment may have occurred because of iodic acid reduction, and a pH decrease may be due to methane sulfonic acid generation and iodic acid oxidation by ozone. These result show the effects on the pH of impregnated activated carbon by H2SO4 could be due to ozone catalytic oxidation.
(5)
Dimethyl sulfide desorption occurred by flowing clean air to the impregnated activated carbon after the adsorption experiment. The desorption ratio of impregnated activated carbon at 0 and 2.5 O3/DMS was 0.067 and 0.00015, respectively. Dimethyl sulfide removal by ozone catalytic oxidation occurred because of chemical adsorption not physical adsorption.
A series of experiments were conducted confirming that ozone catalytic oxidation by xenon excimer lamp and activated carbon impregnated with iodic acid and H2SO4 could be utilized for gas treatment. However, there is a need to conduct not only macroscopic experiments but also microscopic experiments to gain a deeper understanding of the phenomenon on the surface of the impregnated activated carbon.

Author Contributions

Conceptualization, Y.M., E.M. and K.S.; methodology, Y.M.; formal analysis, E.M. and K.S.; investigation, Y.M., A.G.Y., J.K., M.G.B., E.M. and K.S.; writing—original draft preparation, Y.M.; All authors have read and agreed to the published version of the manuscript.

Funding

This research received no external funding.

Institutional Review Board Statement

Not applicable.

Informed Consent Statement

Not applicable.

Data Availability Statement

Not applicable.

Conflicts of Interest

The authors declare no conflict of interest.

References

  1. Dada, O.; Mbohwa, C. Energy from waste: A possible way of meeting goal 7 of the sustainable dSevelopment goals. Mater. Today Proc. 2018, 5, 10577–10584. [Google Scholar] [CrossRef]
  2. Malyan, S.K.; Kumar, S.S.; Fagodiya, R.K.; Ghosh, P.; Kumar, A.; Singh, R.; Singh, L. Biochar for environmental sustainability in the energy-water-agroecosystem nexus. Renew. Sustain. Energy Rev. 2021, 149, 111379. [Google Scholar] [CrossRef]
  3. Hairston, D. Sweeting the smell; silencing the complaints. Chem. Eng. J. 1995, 102, 65–66. [Google Scholar]
  4. Garber, W.F. Odors and their control in sewers and treatment facilities. Water Sci. Technol. 1980, 12, 657–664. [Google Scholar]
  5. Freiberg, A.; Scharfe, J.; Murta, V.C.; Seidler, A. The Use of Biomass for Electricity Generation: A Scoping Review of Health Effects on Humans in Residential and Occupational Settings. Int. J. Environ. Res. Public Health 2018, 15, 354. [Google Scholar] [CrossRef] [PubMed] [Green Version]
  6. Biggs, C.; Ryan, C.; Wiseman, J.; Larsen, K. Distributed Water Systems: A networked and localised approach for sustainable water services. In Victorian Eco-Innovation Lab Distributed Systems Briefing Paper 2009, No. 2; Victorian Eco-Innovation Lab (VEIL): Melbourne, Australia, 2009. [Google Scholar]
  7. Bonnin, C.; Laborie, A.; Paillard, H. Odor nuisances created by sludge treatment: Problems and solutions. Water Sci. Technol. 1990, 22, 65–74. [Google Scholar] [CrossRef]
  8. Sivret, E.C.; Wang, B.; Parcsi, G.; Stuetz, R.M. Prioritisation of odorants emitted from sewers using odour activity values. Water Res. 2016, 88, 308–321. [Google Scholar] [CrossRef]
  9. Hanson, R. Scrubbing out odour nuisance. Water Waste Treat. 2002, 45, 28–30. [Google Scholar]
  10. Robbins, T.L.; Manley, R. Odor preventation and control in process plants. Chem. Eng. J. 2002, 109, 50–55. [Google Scholar]
  11. Yao, Y.-Y.; Chen, W.-X.; Lu, S.-S. Preparation and Deodorizing Performance of a Novel Air-Purifying Material. J. Appl. Polym. Sci. 2006, 102, 4378–4382. [Google Scholar] [CrossRef]
  12. Basu, S.; Gu, Z.C.; Shilinsky, K.A. Application of Packed Scrubbers for Air Emissions Control in Municipal Wastewater Treatment Plants. Environ. Prog. 1998, 17, 9–18. [Google Scholar] [CrossRef]
  13. Shin, C.; Kim, K.; Choi, B. Deodorization Technology at Industrial Facilities Using Impregnated Activated Carbon Fiber. J. Chem. Eng. Jpn. 2001, 34, 401–406. [Google Scholar] [CrossRef]
  14. Fenske, B.J.; Empie, H.J.; Heedick, G. Reduction of Odorous Emissions from Kraft Pulp Mills Using Green Liquor Dregs. In Proceedings of the TAPPI 2005 Engineering, Pulping & Environmental Conference, Philadelphia, PA, USA, 28–31 August 2000; Volume 2000, pp. 145–161. [Google Scholar]
  15. National Library of Medicine. PubChem CID 1068: Dimethyl Sulfide; National Library of Medicine: Bethesda, MD, USA, 2004.
  16. Ministry of the Environment, Government of Japan. Odor Measurement Review; Ministry of the Environment: Tokyo, Japan, 2003; pp. 122–123.
  17. Hwang, C.-L.; Tai, N.-H. Vapor phase oxidation of dimethyl sulfide with ozone over ion-exchanged zeolites. Appl. Catal. A Gen. 2011, 391, 251–256. [Google Scholar] [CrossRef]
  18. Soni, K.C.; Shekar, S.C.; Singh, B.; Gopi, T. Catalytic activity of FeZrO2 nanoparticles for dimethyl sulfide oxidation. J. Colloid Interface Sci. 2015, 446, 226–236. [Google Scholar] [CrossRef] [PubMed]
  19. Endalkachew, S.D.; Devulapelli, V.G. Vapor phase oxidation of dimethyl sulfide with ozone over V2O5/TiO2 catalyst. Appl. Catal. B 2008, 84, 408–419. [Google Scholar]
  20. Supawat, W.; Chantaraporn, P. Field analysis of PSA O2-ozone production process for water recycling. J. Water Environ. Technol. 2020, 34, 223–231. [Google Scholar]
  21. Li, X.; Liu, X.; Lin, C.; Qi, C.; Zhang, H.; Ma, J. Enhanced activation of periodate by iodine-doped granular activated carbon for organic contaminant degradation. Chemosphere 2017, 181, 609–618. [Google Scholar] [CrossRef] [PubMed]
  22. Rimington, D.; Brown, G. Ventilation and the control of odours in sewage treatment industry. Water Serv. 1987, 91, 64–66. [Google Scholar]
  23. Mohamad, F. Specialty Polymers: Materials and Applications; IK International Publishing House Pvt. Ltd.: Delhi, India, 2013; p. 39. [Google Scholar]
  24. Williams, S.; Campos, M.F.; Midey, A.J.; Arnold, S.T.; Morris, R.A.; Viggiano, A.A. Negative ion chemistry of ozone in the gas phase. J. Phys. Chem. A 2002, 106, 997–1003. [Google Scholar] [CrossRef]
  25. Sunder, S.; Vikis, A.C. Raman spectra of iodine oxyacids produced by the gas-phase reaction of iodine with ozone in the presence of water vapour. Can. J. Spectrosc. 1987, 32, 45–48. [Google Scholar]
  26. Biedermann, G.; Lendeus, R. Preparation of iodic acid by ozonization. Acta Chem. Scand. Ser. A 1984, 38, 825–827. [Google Scholar] [CrossRef]
  27. Kasahara, T.; Shoji, S.; Mizuno, J. Surface Modification of Polyethylene Terephtalate (PET) by 172-nm Excimer Lamp. Trans. Jpn. Inst. Electron. Packag. 2012, 5, 47–54. [Google Scholar] [CrossRef] [Green Version]
  28. Kling, R.; Roth, M.; Paravia, M. High Efficient Ozone Production with Excimer Lamps. In Proceedings of the Conference record of 20th IOA and 6th IUVA, Paris, France, 22–25 May 2011. [Google Scholar]
  29. JIS K 1474: 2014; Test Method for Activated Carbon. Japan Industrial Standard Committee: Tokyo, Japan, 2014.
  30. JWWA A114: 2006; Test Method for Activated Carbon. Japan Water Works Association: Tokyo, Japan, 2006.
  31. Thermophysical Properties Database System, Fused SiO2 Bulk: Spectral Emissivity; IAEA: Vienna, Austria, 2006.
  32. Rychter, K.W.; Smolinski, A. A study of dynamic adsorption of propylene and ethylene emitted from the process of coal self-heating. Sci. Rep. 2019, 9, 18277. [Google Scholar] [CrossRef] [Green Version]
  33. Lodewyckx, P.; Wood, G.O.; Ryu, S.K. The Wheeler-Jonas equation: A versatile tool for the prediction of carbon bed breakthrough time. Carbon 2004, 42, 1351–1355. [Google Scholar] [CrossRef]
  34. Hori, H.; Tanaka, I.; Akiyama, T. Breakthrough Time on Activated Carbon Fluidized Bed Adsorbers. JAPCA 1988, 38, 269–271. [Google Scholar] [CrossRef]
  35. Abiko, H.; Furuse, M.; Takano, T. Application of Wheeler–Jonas equation and relative breakthrough time (RBT) in activated carbon beds of respirator gas filters. Air Qual. Atmos. Health 2020, 13, 1057–1063. [Google Scholar] [CrossRef]
  36. Chen, Q.; Sherwen, T.; Evans, M.; Alexander, B. DMS oxidation and sulfur aerosol formation in the marine troposphere: A focus on reactive halogen and multiphase chemistry. Atmos. Chem. Phys. 2018, 18, 13617–13637. [Google Scholar] [CrossRef] [Green Version]
  37. Li, L.; Sun, Z.; Li, H.; Keener, T.C. Effects of activated carbon surface properties on the adsorption of volatile organic compounds. J. Air Waste Manag. Assoc. 2012, 62, 1196–1202. [Google Scholar] [CrossRef]
  38. Bardouki, H.; Mihalopoulos, N.; Zetzsch, C. Oxidation of dimethylsulfoxide (DMSO) by OH radicals in aqueous medium. J. Aerosol. Sci. 2001, 32, S291–S292. [Google Scholar] [CrossRef]
  39. Scholl, S.; Kajszika, H.; Mersmann, A. Adsorption and desorption kinetics in activated carbon. Gas Sep. Purif. 1993, 7, 207–212. [Google Scholar] [CrossRef]
  40. Ou, H.; Fang, M.; Chou, M.; Chang, H.; Shiao, T. Long-term evaluation of activated carbon as an adsorbent for biogas desulfurization. J. Air Waste Manag. Assoc. 2020, 70, 641–648. [Google Scholar] [CrossRef] [PubMed]
  41. Lohwacharin, J.; Maliwan, T.; Osawa, H.; Takizawa, S. Effects of Ferrihydrite-Impregnated Powdered Activated Carbon on Phosphate Removal and Biofouling of Ultrafiltration Membrane. Water 2021, 13, 1178. [Google Scholar] [CrossRef]
  42. Fijołek, L.; Swietlik, J.; Frankowski, M. The influence of active carbon contaminants on the ozonation mechanism interpretation. Sci. Rep. 2021, 11, 9934. [Google Scholar] [CrossRef] [PubMed]
  43. Samir, T.; Liu, Y.; Zhao, L. Study on Effect of Neutral Gas Pressure on Plasma Characteristics in Capacitive RF Argon Glow Discharges at Low Pressure by Fluid Modeling. IEEE Trans. Plasma Phys. 2018, 46, 1738–1746. [Google Scholar] [CrossRef]
  44. Wittenberg, H.H. Gas Tube Design: From Tube Design; Radio Corporation of America: New York, NY, USA, 1962; pp. 792–817. [Google Scholar]
  45. Sanduloviciu, M.; Leu, C.B.G. Self-organization phenomena in current carrying plasmas related to the non-linearity of the current versus voltage characteristic. Phys. Lett. A 1995, 208, 136–142. [Google Scholar] [CrossRef]
  46. Salvermoser, M.; Murnick, D.E. Efficient stable; corona discharge 172nm xenon excimer light source. J. Appl. Phys. 2003, 94, 3722–3731. [Google Scholar] [CrossRef]
  47. Yoshida, Y.; Tanaka, M.; Yukimura, K. Pressure Dependence of Emission Intensity of Rare-gas Excimer Light. T. IEE Jpn. C 1996, 116, 1119–1125. [Google Scholar]
  48. Schreiber, A.; Kuhn, B.; Arnold, E.; Schilling, F.J.; Witzke, H.D. Radiation Resistance of Quartz Glass for VUV Discharge Lamps. In Proceedings of the 10th International Symposium on the Science and Technology of Light Sources, LS10; CRC Press: Boca Raton, FL, USA, 2004. [Google Scholar]
  49. Wu, Y.J.; Wu, C.Y.R.; Chou, S.L.; Lin, M.Y.; Lu, H.C.; Lo, J.I.; Cheng, B.M. Spectra and Photolysis of pure nitrogen and methane dispersed in solid nitrogen with vacuum–ultraviolet light. Astrophys. J. 2012, 746, 175. [Google Scholar] [CrossRef]
  50. Morimoto, Y.; Sumitomo, T.; Yoshioka, M.; Takemura, T. Recent progress on UV lamps for industries. In Proceedings of the Conference Record of the 2004 IEEE Industry Applications Conference, 39th IAS Annual Meeting, Seattle, WA, USA, 3–7 October 2004; Volume 39, pp. 1008–1015. [Google Scholar]
  51. Tanaka, M.; Sasaki, S.; Katayama, M. The Near Infrared Emission Band Observed in Electron Irradiated Xe and Xe in Other Rare Gases. Bull. Chem. Soc. Jpn. 1985, 58, 429–432. [Google Scholar] [CrossRef] [Green Version]
  52. Sunkhatme, S.P. A Textbook on Heat Transfer, 4th ed.; University Press (India) Private Limited: Telangana, India, 2005. [Google Scholar]
  53. McKenney, D.J.; Laidler, K.J. Elementary processes in the decomposition of ozone. Can. J. Chem. 1962, 40, 539–544. [Google Scholar] [CrossRef]
  54. Zhang, X.; Lee, B.J.; Im, H.G.; Cha, M.S. Ozone Production With Dielectric Barrier Discharge: Effects of Power Source and Humidity. IEEE Trans. Plasma Sci. 2016, 44, 2288–2296. [Google Scholar] [CrossRef]
  55. Salvermoser, M.; Murnick, D.E.; Kogelschatz, U. Influence of water vapor on photochemical ozone generation with efficient 172 nm xenon excimer lamps. Ozone Sci. Eng 2008, 30, 228–237. [Google Scholar] [CrossRef]
  56. Braun, D.; Kuchler, U.; Pietsch, G. Behaviour of NOx in air-fed ozonizers. Pure Appl. Chem. 1988, 60, 741–746. [Google Scholar] [CrossRef]
  57. Tsuji, M.; Kawahara, M.; Noda, K.; Senda, M.; Sako, H.; Kamo, N.; Kawahara, T.; Sozan, K.; Kamarudin, N. Photochemical removal of NO2 by using 172-nm Xe2 excimer lamp in N2 or air at atmospheric pressure. J. Hazard. Mater. 2009, 162, 1025–1033. [Google Scholar] [CrossRef] [PubMed]
  58. Yamabe, C. Ozone generation. J. Plasma Fusion Res. 1998, 74, 134–139. [Google Scholar]
  59. Sosnin, E.A. Areas in which vacuum ultraviolet excilamps are used. J. Opt. Technol. 2012, 79, 659–666. [Google Scholar] [CrossRef]
  60. Marin, P.; Borba, C.E.; Módenes, A.N.; Espinoza-Quiñones, F.R.; De Oliveira, S.P.D.; Kroumov, A.D. Determination of the mass transfer limiting step of dye adsorption onto commercial adsorbent by using mathematical models. Environ. Technol. 2014, 35, 2356–2364. [Google Scholar] [CrossRef]
  61. Parsons, R.; Salzberg, H.W. Handbook of Electrochemical Constants; Butterworths Scientific Publications: Oxford, UK, 1959; pp. 69–73. [Google Scholar]
  62. Li, W.; Hun, Z.; Sun, D. Preparation of sludge-based activated carbon for adsorption of dimethyl sulfide and dimethyl disulfide during sludge aerobic composting. Chemosphere 2021, 279, 130924. [Google Scholar] [CrossRef]
Figure 1. The structure of the xenon excimer lamp.
Energies 15 03314 g001
Figure 2. The schematic image of the experimental setup for characterization of the excimer lamp.
Energies 15 03314 g002
Figure 3. The particle size distribution of impregnated activated carbon.
Energies 15 03314 g003
Figure 4. The waveforms of the discharge voltage, corresponding discharge current and discharge power: (a) 500 ns/div; (b) 5 μs/div; (c) 25 ms/div.
Energies 15 03314 g004
Figure 5. The dependence of the power consumption of the excimer lamp on the duty ratio of the ON/OFF signal.
Energies 15 03314 g005
Figure 6. The emission spectra of the excimer lamp: (a) VUV region; (b) UV–IR region.
Energies 15 03314 g006
Figure 7. The dependence of the surface temperature of the excimer lamp on the duty ratio of the ON/OFF signal.
Energies 15 03314 g007
Figure 8. The dependence of the ozone generation characteristics on the duty ratio of the ON/OFF signal: (a) ozone concentration; (b) power consumption per unit.
Energies 15 03314 g008
Figure 9. The dependence of 5% breakthrough time on O3/DMS.
Energies 15 03314 g009
Figure 10. The time variation of outlet DMS concentration.
Energies 15 03314 g010
Figure 11. The time variations of outlet ozone and SO2 concentration of impregnated activated carbon at O3/DMS of 2.5.
Energies 15 03314 g011
Figure 12. The time variations of outlet DMS concentration of adsorbents after adsorption experiment by air flowing without generation of DMS and ozone.
Energies 15 03314 g012
Table 1. DMS and its major oxidation products and boiling points.
MaterialsBoiling Point (°C)
Dimethyl sulfide (DMS)—(CH3)2S37
Dimethyl sulfoxide (DMSO)—(CH3)2SO189
Methane sulfinic acid (MSIA)—CH3SO2H256
Methane sulfonic acid (MSA)—CH3SO3H167
Sulfur dioxide—SO2−10
Sulfuric acid—H2SO4337
Table 2. Characteristics of impregnated activated carbon and activated carbon.
CharacteristicsImpregnated
Activated Carbon
Activated Carbon
Bulk density (kg/m3)540480
Toluene adsorption capacity (kg/kg)0.2170.259
pH (-)2.49.7
Table 3. The 5% and 50% breakthrough times of dynamic adsorption experiments.
Adsorbents5% Breakthrough
Time (h)
50% Breakthrough
Time (h)
Activated carbon
(O3/DMS = 0)
1272
Impregnated activated carbon
(O3/DMS = 0)
1496
Impregnated activated carbon
(O3/DMS = 2.5)
1501440
Table 4. The calculated values of adsorption capacity and adsorption rate constant.
AdsorbentsAdsorption
Capacity (kg/kg)
Adsorption Rate
Constant (s−1)
Activated carbon
(O3/DMS = 0)
0.00863.2
Impregnated activated carbon
(O3/DMS = 0)
0.0103.1
Impregnated activated carbon
(O3/DMS = 2.5)
0.153.0
Table 5. MSA concentration and pH of ion exchanged water with adsorbent.
AdsorbentsMSA (mg/L)H2SO4 (mg/L)pH (−)
Activated carbon
(before adsorption)
<0.10.29.7
Activated carbon
(O3/DMS = 0)
0.10.29.7
Impregnated activated carbon
(before adsorption)
<0.13402.3
Impregnated activated carbon
(O3/DMS = 0)
0.33402.0
Impregnated activated carbon
(O3/DMS = 2.5)
5203502.7
Table 6. Desorption ratio of each adsorbents.
AdsorbentsAdsorption Amount (mg)Desorption Amount (mg)Desorption Ratio (−)
Activated carbon(O3/DMS = 0)7.6570.13
Impregnated activated carbon(O3/DMS = 0)5.0760.067
Impregnated activated carbon(O3/DMS = 2.5)0.1611000.00015
Publisher’s Note: MDPI stays neutral with regard to jurisdictional claims in published maps and institutional affiliations.