Article

Impact of Reservoir Heterogeneity on Diluted Geothermal Brine Reinjection

by
Jacquelin E. Cobos
1,† and
Erik G. Søgaard
2,*,†
1
Department of Mechanical and Electrical Engineering, University of Southern Denmark, 6400 Sønderborg, Denmark
2
Department of Chemistry and Bioscience, Aalborg University, 6700 Esbjerg, Denmark
*
Author to whom correspondence should be addressed.
These authors contributed equally to this work.
Energies 2022, 15(9), 3321; https://doi.org/10.3390/en15093321
Submission received: 25 February 2022 / Revised: 20 April 2022 / Accepted: 28 April 2022 / Published: 2 May 2022
(This article belongs to the Special Issue Brine in Geothermal Energy Systems)

Abstract

:
Many geothermal plants have been shut down due to reinjection problems with the heat-depleted brine. In Denmark, only one out of three plants that extract heat from a geothermal fluid distributed to the district heating system is still working. In general, the large salinity of heat-depleted geothermal brines can be used to produce electricity with the help of turbines and generators through an osmotic power unit known as a SaltPower plant. Harnessing more energy out of the reinjection of geothermal brines is feasible without compromising the overall reservoir assurance when the iron is kept under control. This study is an attempt to determine the feasibility of the reinjection of a diluted geothermal brine with ethylenediaminetetraacetic acid (EDTA) into homogeneous and heterogeneous sandstone rocks. The results from the coreflooding experiments show an improvement in the rock properties both in porosity and permeability for homogeneous and heterogeneous rocks. EDTA not only avoids the precipitation of Fe(III) oxides inside the porous media but can also be used for scale removal and matrix acidizing in geothermal reservoirs.

1. Introduction

The exploration of clean and renewable energy has increased in recent years to tackle climate change. SaltPower, osmotic power, or salinity gradient energy has gained tremendous attention because of different advantages such as (a) energy harnessing 24 h a day, (b) production is not affected by wind speed or solar radiation, and (c) being easy to scale-up [1]. This relatively new energy conversion technology is based on the osmotic gradients resulting from the mixing of dilute and concentrated salt solutions [2,3,4].
Pressure retarded osmosis (PRO) is the most common process to harness the “green energy” coming from the osmotic gradient between fluids of different salinity. In the PRO process, osmotic forces transport water molecules through a semipermeable membrane from the feed solution, water with very low total dissolved solids (TDS), to a high concentrated draw solution. The diffusion of water from the feed to the draw solution leads to build-up pressure and volume expansion that can be converted into electricity by a turbine and a generator [2,5]. The usage of fresh water and seawater as feed and draw solutions is the most often discussed PRO process [6,7]. However, the low energy density and the relatively high energetic operation costs make that PRO process not profitable [3,8]. For instance, a pilot plant built by Statkraft in Norway only generated less than 5 kW/m2 by the PRO process, which in turn makes the energy production less cost-effective [8].
Higher power densities can be obtained by a combination of high flux and high pressure. Madsen et al. [9] demonstrated that the PRO process with hypersaline fluids can be operated at pressures up to 70 bar, which in turn could produce profitable power densities. The synergy between osmotic power production and geothermal heat mining can lead to a significant reduction in power generation costs. This is because the osmotic power production could cover the energy used for the internal processes at the geothermal plants [1].
In previous works [10,11], it was demonstrated that the reinjection of diluted geothermal brine coming from a geothermal plant that feeds the produced energy (heat) into the district heating (DH) network is feasible. Nonetheless, iron should be kept under control to avoid the oxidation and precipitation of iron as Fe(III) oxides that compromise the overall reservoir assurance. Chelating agents (e.g., citric acid) are a good alternative to keep iron in solution and to improve the rock properties [11]. An ongoing microcalorimetric assessment showed that EDTA (ethylenediaminetetraacetic acid) added to two times diluted Thisted brine (2D*TB) forms stronger complexes than other chelating agents. Thus, it seems to be the best complexing agent for the reinjection of diluted geothermal brine into a reservoir.
The present research aimed to determine the feasibility of re-injecting half-diluted Thisted brine with EDTA (2D*TBEDTA) into homogeneous and heterogeneous core plugs. Most of the studies in the geothermal sector simplified the reservoirs as homogeneous with 100% connectivity and net to gross (N/G) that is the volume of rock with enough permeability to produce hydrocarbons [12]. However, the oil sector has shown that connectivity and N/G parameters influence the fluid flow patterns [13,14,15]. This work fills that major gap and provides relevant insights into what would happen if diluted geothermal brine coming from osmotic power production with EDTA is reinjected into homogeneous or heterogeneous geothermal reservoirs.

2. Materials and Methods
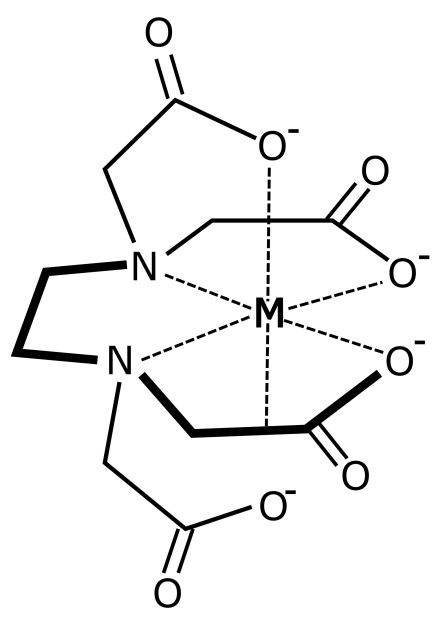
2.1. Brines

A brine collected from the Thisted geothermal energy plant in Denmark was used in this study. The geothermal brine was filtered through a 2.7 μ m glass microfibre and a 0.22 μ m filter.
Table 1 presents the properties of half-diluted Thisted geothermal brine with EDTA (2D*TBEDTA). EDTA is a chelating agent capable of complexing with metal atoms (M) to form five interlocking chelate rings [16] and therefore keep the cations in solution. Figure 1 shows the EDTA structure. As observed, EDTA is a hexadentate agent since it has six coordination positions made of four oxygen donor atoms from the carboxyl groups and two nitrogen donor atoms [17].
An Optima 8000, Inductively Coupled Plasma-Optical Emission Spectrometer (ICP-OES) from PerkinElmer instruments and an 800 Series Ion Chromatography (IC) instrument from Metrohm were used to determine the ionic composition of the geothermal fluid. The other properties (electrical conductivity, salinity, and pH) displayed in Table 1 were measured using a PC 2700 m from Eutech instruments. On the other hand, density was quantified using a DMA 35 Anton Paar density meter. As recommended in a previous work [11], iron can be kept in solution in the geothermal fluid by adding 1.5 mole of the chelating agent per mole of iron (Fe), which results in a concentration of 2.4 mmol per liter. The ionic strength (Ic) was determined through Equation (1) using the ICP and IC results presented in Table 1. In the mentioned equation, Ic is the ionic strength, ci is the molar concentration, and zi is the charge number of the i’te ion.
I c = 1 2 c i z i 2

2.2. Rock Sample

In this study, different sandstone samples were used for the core flooding experiments. Each rock type is briefly described as follows:
Berea. Homogeneous rock material normally used as a reference formation rock. It contains quartz, kaolinite, and k-feldspar [11]. Other minerals such as mica, illite, ankerite, siderite, chlorite, and calcite can also be present in the rock material [18].
Bandera Brown. Heterogeneous rock made of quartz, feldspar, kaolinite, illite, chlorite, and plagioclase. This rock contains a very low concentration of kaolinite (0.7%) [19].
Parker Sandstone. Heterogeneous rock made of quartz, kaolinite, illite, and muscovite [20].
The mineralogical compositions of the different sandstone types were determined through a PANalytical X-ray powder diffraction instrument (XRD). Particles with a size of <100 μ m from crushed core plugs were used for the XRD analysis.

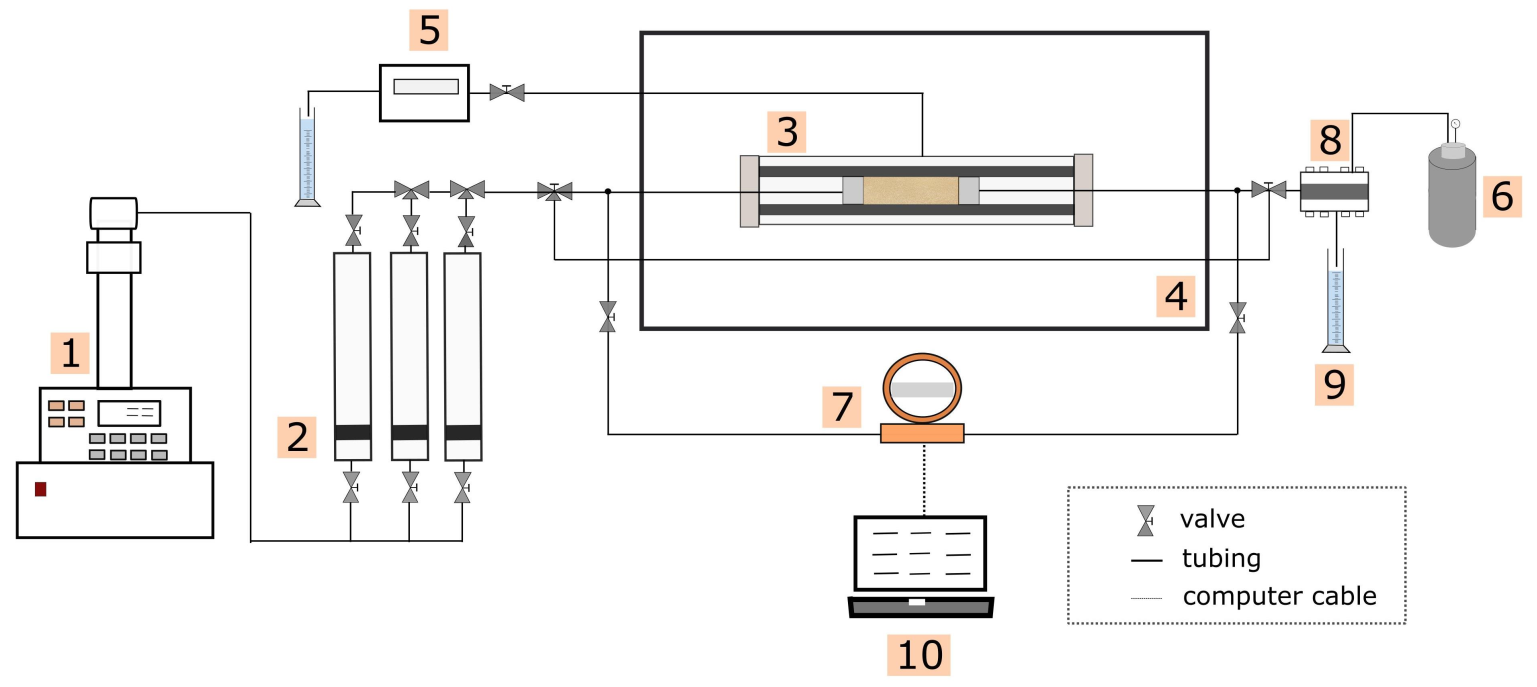
2.3. Core Flooding Apparatus and Procedure

Before the core flooding experiments, the plugs were washed gently with tap water to remove loose particles. After drying the cores for 2 weeks in a heating cabinet at 65 C, dry weight and dimensions were measured using a Mitutoyo’s absolute Digimatic Caliper. The cores were thereafter vacuum evacuated with Thisted geothermal brine (TB) for 24 h and weighed again. The absolute brine permeability was determined by measuring the pressure drop across the core plugs at flow rates ranging from 50 to 200 mL/h, and calculated through Darcy’s law (Equation (2)) [21]. In this equation, k is the brine permeability, Q is the volumetric flow rate, and μ is the brine viscosity corrected at relevant brine salinity and temperature through the CREWES Fluid Property Calculator [22], A is the cross-sectional area, and Δ P is the pressure drop (Pinlet− Poutlet).
k = Q μ L A Δ P
In addition to the brine permeability, the initial porosity and air permeability of the rock samples were determined by an AP-608 Automated Permeameter-Porosimeter from Coretest systems. The physical properties of the Berea (B), Bandera Brown (BR), and Parker (PR) sandstone core plugs are presented in Table 2. Notice that the numbers beside the rock’s acronyms indicate the sample identification. The terms l, d, PV, ϕ , kgas, and kklink indicate length, diameter, pore volume, porosity, gas permeability, and Klinkenberg-corrected permeability [23], respectively.
Fully brine-saturated Berea, Bandera Brown, and Parker sandstone core plugs were placed in a Hassler-type core holder kept in an oven at 50 C. A Teledyne ISCO D-Series pump was used to inject diluted geothermal brine with 2D*TBEDTA into the sandstone core plugs at a constant rate of 2 mL/min for about 8 h. An Aplisens pressure transmitter was employed to measure the inlet/outlet pressures. Note that the confining pressure was kept 10 bars above the injection pressure to ensure the flow along the core plugs. Moreover, a back pressure of 10 bar (145 psia) was also applied to avoid any backflow. Every hour effluent samples in each experiment were collected to determine changes in brine composition, pH, and density. A simplified illustration of the laboratory set-up is presented in Figure 2.
Duplicate core flooding tests were performed on 2 Berea, 2 Bandera Brown, and 2 Parker sandstone core plugs. The tests have the following sequence:
  • B-18 and B-19 flooded with 2D*TBEDTA;
  • BR-4 and BR-6 flooded with 2D*TBEDTA;
  • PR-3 and PR-6 flooded with 2D*TBEDTA.

3. Results and Discussion

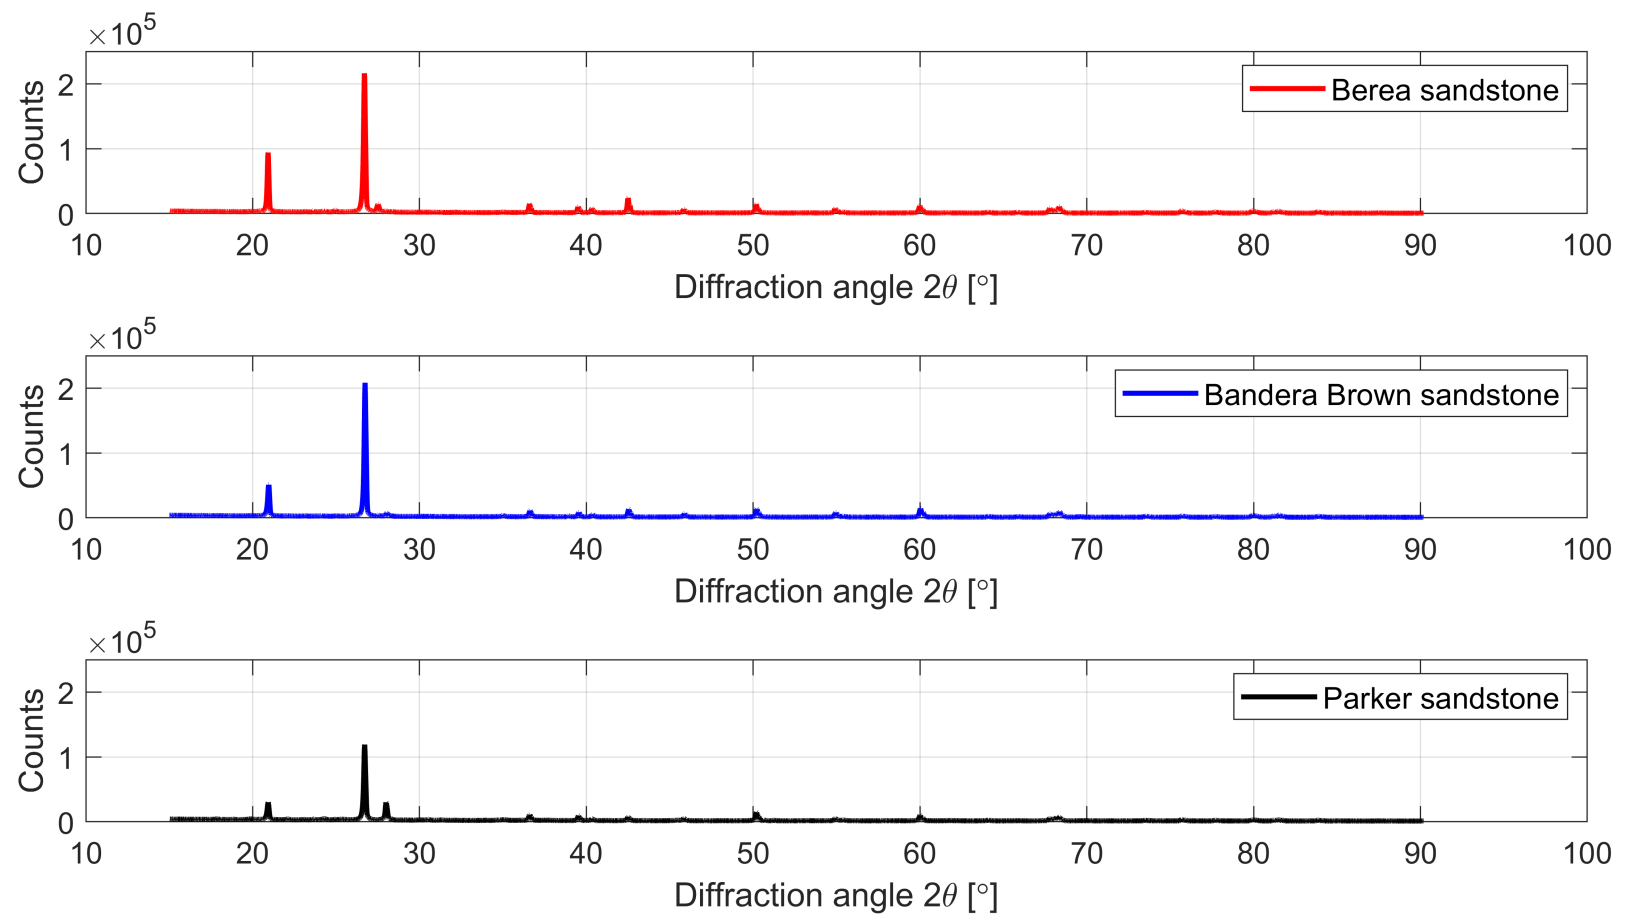
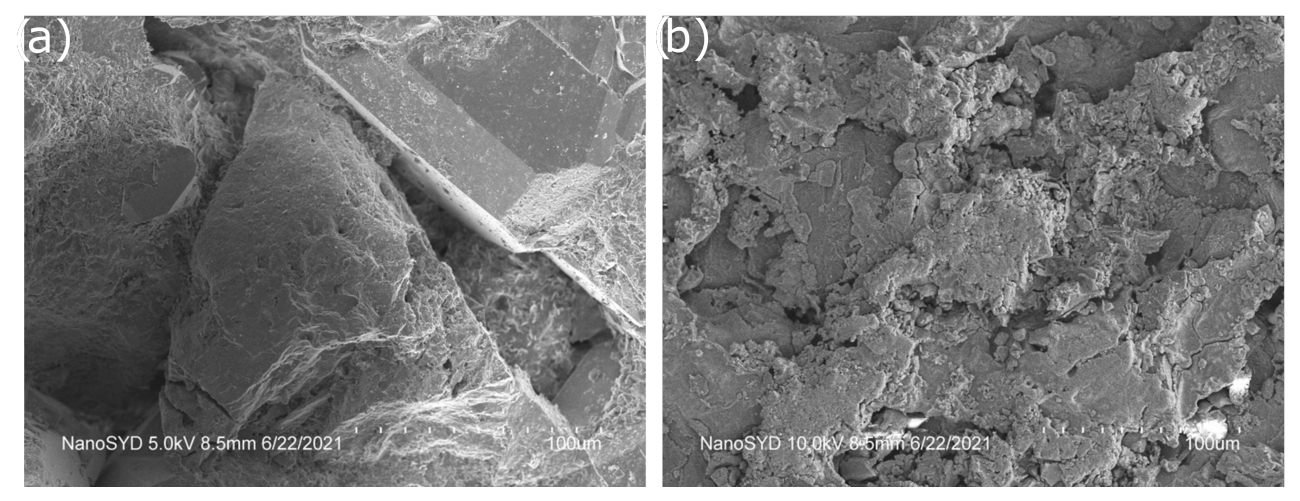
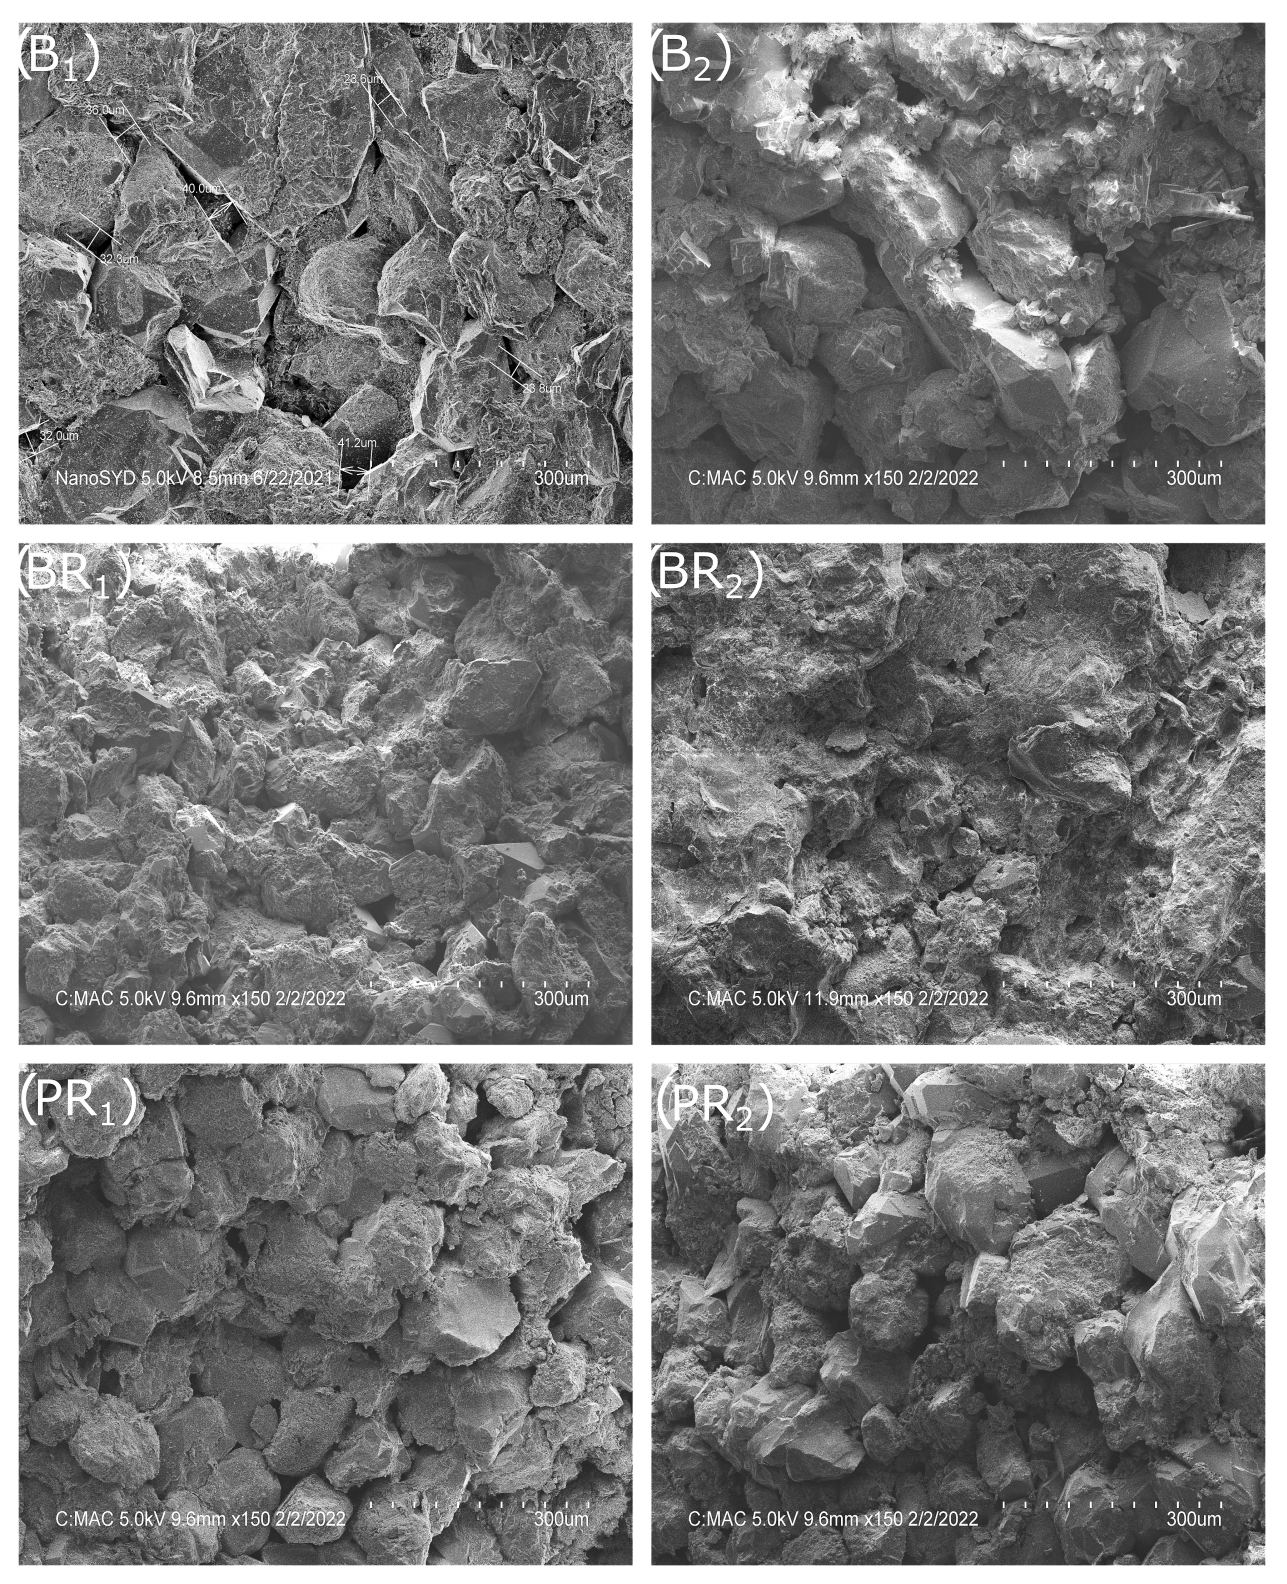
3.1. Chemical and Mineralogical Composition of the Rock Material

The X-ray powder diffraction (XRD) pattern for Berea, Bandera Brown, and Parker sandstones is shown in Figure 3. Those patterns were identified using the software from the PANalytical X-ray powder diffraction instrument (XRD).
The identified minerals for the sandstone rocks used in this study are presented in Table 3. The rock materials are predominantly composed of quartz, clay minerals (kaolinite, illite), muscovite, and albite. Based on the XRD experiments the sandstone rocks are composed of silicon (Si), aluminum (Al), sodium (Na), magnesium (Mg), and iron (Fe). This is in line with different studies reported in the literature [24,25,26].

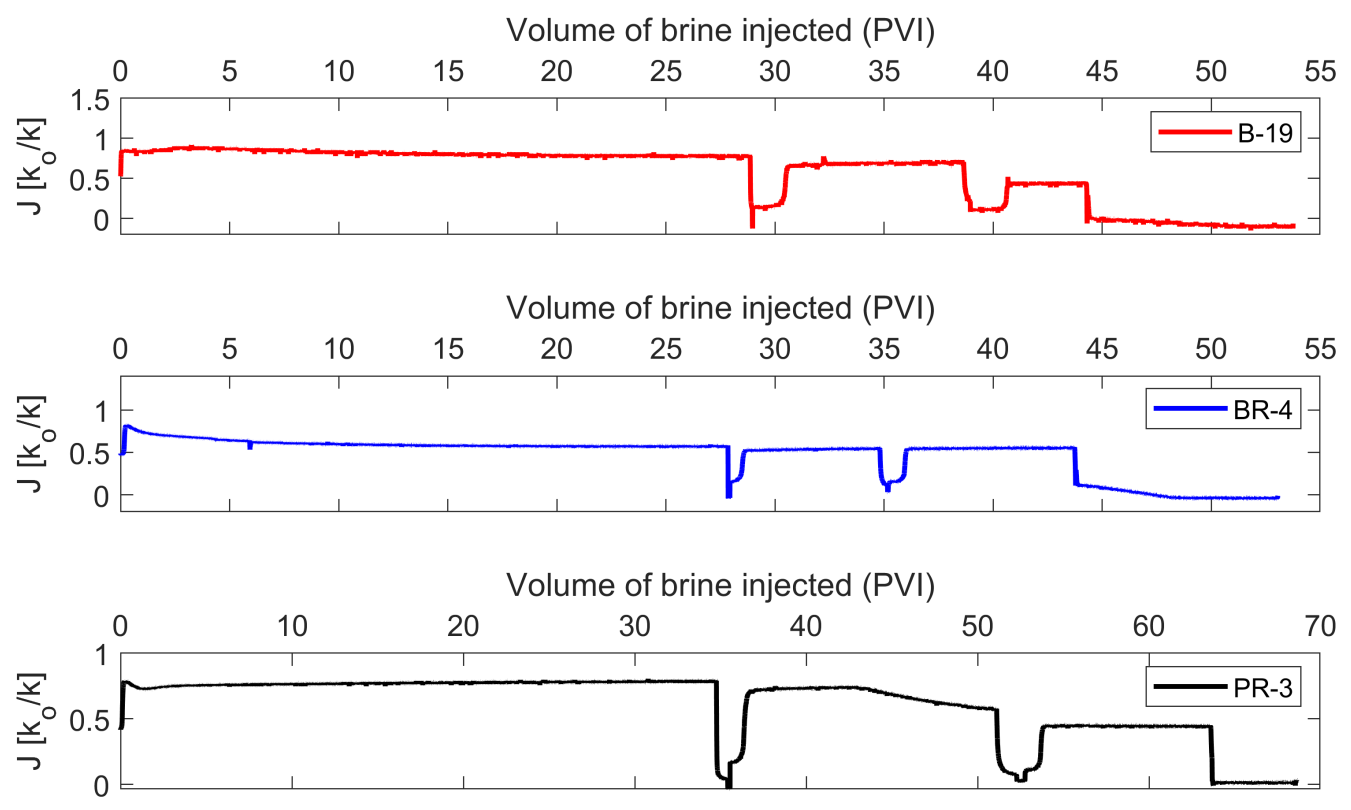
3.2. Brine Permeability Flow Test

Half diluted Thisted brine with EDTA (2D*TBEDTA) was injected in forward and backward directions into Berea, Bandera Brown, and Parker sandstone core plugs. Each injection was performed twice for duplication purposes.
As presented in previous works [10,11], the medium permeability of the core plugs can be described by a dimensionless impedance function (Equation (3)). In the impedance function, J ( t D ) indicates the impedance value at time ( t D ), Δ P ( t D ) is the differential pressure, q is the flow rate, k 0 is the initial permeability to brine, and k ( t D ) corresponds to the current permeability at time t D [27].
J ( t D ) = Δ P ( t D ) q ( t D ) q ( 0 ) Δ P ( 0 ) = k 0 k ( t D )
The impedance history for B-19, BR-4, and PR-3 core plugs is presented in Figure 4. The diluted geothermal brine with EDTA (2D*TBEDTA) was injected in the forward and reverse directions. As observed in Figure 4, there are three jumps in the impedance history. The first two jumps in the forward flow direction correspond to a discontinuity in the injection since the ISCO D-Series pump was stopped for 30 min and 1 h 30 min, respectively. This was done in order to simulate what would happen if a geothermal plant is shut down for a short period of time or there are technical issues. The last discontinuity corresponds to the injection of 2D*TBEDTA in the opposite direction (reverse). As observed, the addition of EDTA to the diluted geothermal fluid gives impedance values lower than 1 (J < 1) in the different sections for all the rocks. This indicates that the permeability of the homogeneous (Berea), and heterogeneous (Bandera Brown and Parker) rocks has been improved even though the flow was not continuous. The differential pressure decreased considerably for all the rocks when the fluid flow was reversed. This permeability restoration was also observed in previous works [10,11].
The permeability to 2D*TBEDTA for each homogeneous and heterogeneous core plugs is presented in Table 4. Those values were calculated at the stabilized pressure drop in each zone. In this table, k0 represents the initial brine permeability, kB1 the brine permeability at Section 1, kB2 the brine permeability at Section 2, and kB3 the brine permeability at Section 3. On average the permeability of the Berea sandstone core plugs was incremented by 30% in the first zone, 35% in the second section, and 61% in the third zone. Both heterogeneous sandstone rocks (Bandera Brown and Parker) also showed a permeability increment. In this sense, the Bandera Brown core plugs obtained an increment of 38% in the first zone and 43% in the second and third zones. The Parker core plugs obtained an increment of 41% in the first zone, 49% in the second, and 56% in the third zone. Those results not only confirm the efficiency of EDTA to keep Fe(II) in solution (avoiding its precipitation within the porous medium) but also the improvement of the overall permeability for both homogeneous and heterogeneous sandstone rocks. A discontinuity in the fluid injection also results in a higher permeability for all the rocks. This improvement is higher if the fluid flow is stopped for longer periods (>1 h 30 min). Thus, 2D*TBEDTA could potentially avoid the very common injectivity issues in sandstone reservoirs when the geothermal plants are shut down for short or longer periods of time (e.g., summer or for technical issues).
Figure 5 displays the porosity values before and after the core flooding experiments, which were determined by the AP-608 Automated Permeameter-Porosimeter. As observed in the figure, the porosity was slightly increased in all the rocks. The Berea sandstone core plugs have a permeability increment of about 4–9%, the Bandera Brown cores of 7–8%, and the Parker cores of 5–10%. Those results also support the advantage of the injection of half-diluted brine with EDTA in a geothermal reservoir.

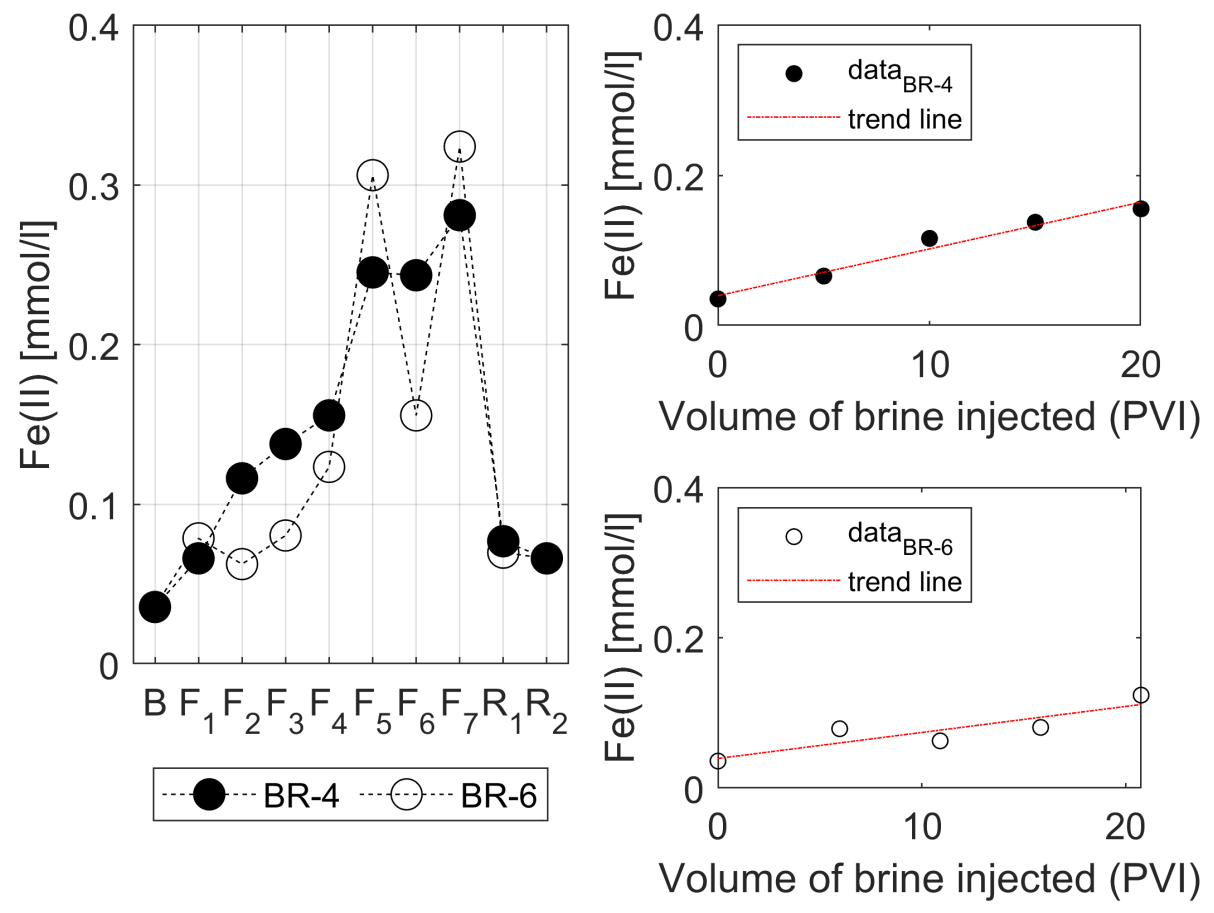
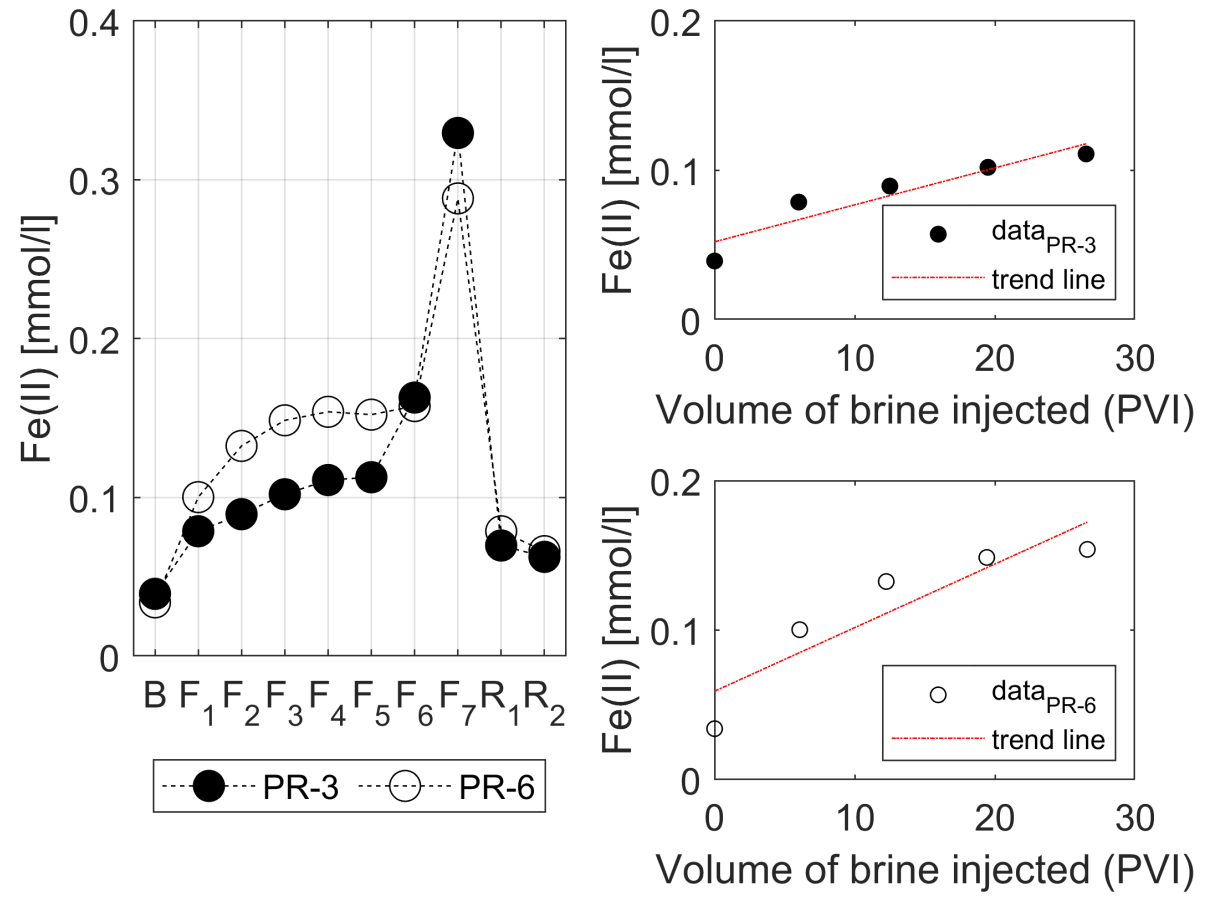
3.3. Water Chemistry

The changes in the main ionic species (Ca2+, Mg2+, and Na+) concentration and pH variations during the injection of 2D*TBEDTA into Berea, Bandera Brown, and Parker sandstone cores are shown in Figure 6. It is observed in the figure that the concentration of the divalent cations (Ca2+ and Mg2+) for Berea and Bandera Brown core plugs increases gradually during the first pores volume and then it decreases. On the other hand, the changes in the concentration of those cations are minor for Parker sandstone. Those changes in the Ca2+ and Mg2+ concentration could be related to the mineralogical composition of the sandstone rocks. As reported by Shehata and Nasr-El-Din [26], Berea and Bandera Brown are composed of small tracers of calcite (CaCO3) and dolomite (CaMg(CO3)2). Rosenbrand et al. [18] also reported the presence of siderite (FeCO3) and ankerite [Ca(Fe, Mg)(CO3)2)] minerals in Berea sandstone. Parker sandstone does not contain calcite or dolomite but has a small amount of illite, non-expanding clay minerals with (K,H)(Al,Mg,Fe)2(Si,Al)4O10[(OH)2,(xH2O)] repeated units [28]. EDTA could have been complexed with the divalent cations (Ca2+ and Mg2+) and transport them away from the mineral surface into the bulk solution. As observed, this dissolution process reaches a maximum of about 5PVI. Then, the available amount of carbonate cement decreases because 2D*TBEDTA might have already formed wider flow paths. Figure 6 shows that minor changes in the Na+ concentration also occurred for Berea and Bandera Brown sandstone rocks.
The pH measurements presented in Figure 6 support the dissolution during the forward injection of 2D*TBEDTA. As observed in the figure, pH increased for all the rocks during the first 5 PVI. Thereafter, it decreased slowly in sections 1, 2, and 3. Notice that when the flow was reversed (opposite direction) at about 40 PVI, the injection brine keeps its original pH value (around 3.4). According to Fredd and Fogler [29], the calcite dissolution in the presence of chelating agents is highly dependent upon the solution pH and type of chelating agent. The EDTA dissociation follows the reactions presented in Equations (4)–(7), where HmY−n represents the chelating agent, m the number of acidic protons, and n goes from 1 to 4.
H 4 Y H 3 Y + H +
H 3 Y H 2 Y 2 + H +
H 2 Y 2 H Y 3 + H +
H Y 3 Y 4 + H +
As pH increases from 2.5 to 13, EDTA deprotonates from H2Y−2 to Y−4. In this intermediate pH range, both chelation and acid dissolution contribute to the total reaction. On the other hand, the reaction is controlled by chelation at the high pH side. The rate of the chelation process is much lower than the acid dissolution [29,30]. The following equations (Equations (8)–(10)) show the overall EDTA surface reactions with calcite. Those reactions explain the calcite dissolution that might occur in the porous media when 2D*TBEDTA was injected into the core plugs.
H 2 Y 2 + CaCO 3 Ca Y 2 + H 2 O + CO 2
H Y 3 + CaCO 3 Ca Y 2 + HCO 3
Y 4 + CaCO 3 Ca Y 2 + CO 3 2
Figure 7 shows the distribution of the calcium species as function of pH obtained by “Spana” software. As observed, Ca2+ concentration decreases as pH increases since Ca(HEDTA) and Ca(EDTA)2− complexes are being formed. It was noted in Figure 6 that pH increased from 3.4 to about 6.2, which indicates that calcium is in the form of Ca(EDTA)2− complex for all the rocks.
As observed in Table 1, the original Thisted brine has an iron concentration of 1.6 mmol/L that was reduced remarkably to 0.05 mmol/L by adding EDTA. Figure 8 displays the Fe(II) changes by the injection of 2D*TBEDTA through B-18 and B-19 core plugs. It is noted that the concentration of Fe(II) in solution is increasing and reaches a maximum of 0.8 mmol/L in the forward injection of 2D*TBEDTA into B-18 and B-19 core plugs. The injection in the reverse direction gives almost the same iron concentration. Those results suggest the dissolution of iron-bearing carbonate cement (siderite and ankerite) in the Berea sandstone core plugs.
The Fe(II) changes by the injection of 2D*TBEDTA through BR-4 and BR-6 core plugs (heterogeneous sandstone rocks) is presented in Figure 9. As observed, the Fe(II) concentration also increases during the forward brine injection, reaching a maximum of 0.3 mmol/L. On the other hand, the concentration in the reverse direction is relatively small (0.07 mmol/L) and almost constant with no more iron for complexing.
The injection of 2D*TBEDTA through the heterogeneous PR-3 and PR-6 sandstone core plugs gives the Fe(II) changes shown in Figure 10. The changes in the iron concentration for those rocks are also increasing during the forward injection, reaching a maximum of 0.3 mmol/L. Notice that a longer discontinuity in the injection (1 h 30 min) resulted in a higher Fe(II) concentration. This could be because EDTA had more time to chelate with the iron from the rocks, which was transported by the injection fluid afterward. The Parker sandstone core plugs also showed a similar constant concentration (0.07 mmol/L) as the Bandera Brown cores in the reverse injection.
As observed in Figure 8, Figure 9 and Figure 10, the dissolution of iron-bearing carbonate cement in all the rocks follows a linear trend, which has an equation of the following form (Equation (11)). Notice that the linear regression was applied to the continuous injection without taking into account the effluents collected after the first (30 min) and second (1 h 30 min) discontinuities.
y = b ( x ) + c
Table 5 presents the results from the trend line applied to the continuous forward injection of 2D*TBEDTA. As observed, the Fe(II) concentration is directly proportional to the pore volumes injected into the homogeneous and heterogeneous core plugs. The linear equations for the homogeneous rocks (Berea sandstone) are similar, indicating that EDTA causes the same effect within the porous media. The heterogeneous rocks attain equations similar to each other but approximately ten times smaller than for the homogeneous rocks. This could be related to the permeability contrast that affects the fluid flow through the porous medium. 2D*TBEDTA might have flowed through the most permeable zones first, leaving the less permeable zones untouched. Cobos et al. [11] showed that the maximum iron concentration in the forward injection of half-diluted Sønderborg geothermal brine with citric acid (2D*SBcitric) in Berea sandstone was approximately 1 mmol/L. This value is much higher than the iron concentrations for all the cores used in this work. This shows that effectively EDTA causes a less aggressive dissolution, which is more balanced and more evenly distributed along the flow path.
As presented in previous works [10,11], the major issue with the injection of a half-diluted geothermal brine coming from SaltPower electricity generation is the precipitation of iron oxides, which is lesser than for the injection of the 100% saturated geothermal brine. An FE-SEM Hitachi S-4800 scanning electron microscopy apparatus was used to visualize the iron precipitation in the porous media. Figure 11 shows the scanning electron microscopy (SEM) graphs of a Berea sandstone rock before and after the injection of Thisted Brine (TB). One can clearly observe the iron precipitation inside the porous medium after the fluid injection.
As proposed in a previous work [11], the iron precipitation issue could be avoided by the addition of citric acid (iron control agent used in oil field treatments [31]). In the present study, EDTA is used not only for iron control but also for scale removal and matrix acidizing in geothermal reservoirs. This is because EDTA dissolves (entirely or partially) minerals containing Fe, Ca, Mg, and Al [32]. Figure 12 displays the SEM graph for Berea (B), Bandera Brown (BR), and Parker sandstone rocks. The sub-index 1 indicates the original pore space and 2 after the injection of half-diluted geothermal brine with EDTA (2D*TBEDTA). As observed, wider and larger pores are the result of the injection of 2D*TBEDTA. EDTA is an alternative to mineral acid treatments for different scale removals, such as calcium carbonate and calcium sulfate. Strong mineral acids (e.g., HCl) tend to dissolve aggressively the contacted minerals in the first entry zone while leaving some parts of the wellbore untreated [33]. This is undesirable since the stimulation fluid should penetrate deep inside the formation to bypass the damaged zone, creating channels that connect the undamaged part of the reservoir and the wellbore. Moreover, chelating agents are good candidates for scale removal due to their low corrosive nature [30].
It is believed that the usage of EDTA would decrease very much after some time since the rock properties have been improved as observed in Figure 12. In order to test that hypothesis, three core plugs (B18EDTA, BR4EDTA, PR6EDTA) were flooded again with 2D*TB without the chelating agent. The impedance change for 2D*TB injection into Berea, Bandera Brown, and Parker core plugs flooded previously with EDTA is presented in Figure 4. The impedance values shown in Figure 13 for all the rocks are less than 1, which indicates that 2D*TB has better injectivity. In this sense, the average permeability to 2D*TB is 45.3 mD for Berea sandstone (B-19), 23.8 mD for Bandera Brown (BR-6), and 12.8 mD for Parker (PR-6) sandstones. As noted in Table 4, the original brine permeabilities for those core plugs are much smaller. Consequently, the properties of the cores flooded previously with EDTA were indeed improved.

4. Conclusions

This work investigates a plausible usage of ethylenediaminetetraacetic acid (EDTA) for the reinjection of diluted geothermal brine to avoid injectivity issues and as a stimulation fluid. In the study, homogeneous and heterogeneous rocks were flooded with diluted geothermal brine coming from the geothermal plant in Thisted, Denmark, in which EDTA was added to the injection fluid. Based on the experimental results in this study, the overall conclusions are summarized.
  • Core flooding experiments indicated that half-diluted Thisted brine with EDTA (2D*TBEDTA) improves the injectivity in all types of sandstone rocks (homogeneous and heterogeneous). This enhancement is even higher if the fluid injection is stopped for a while.
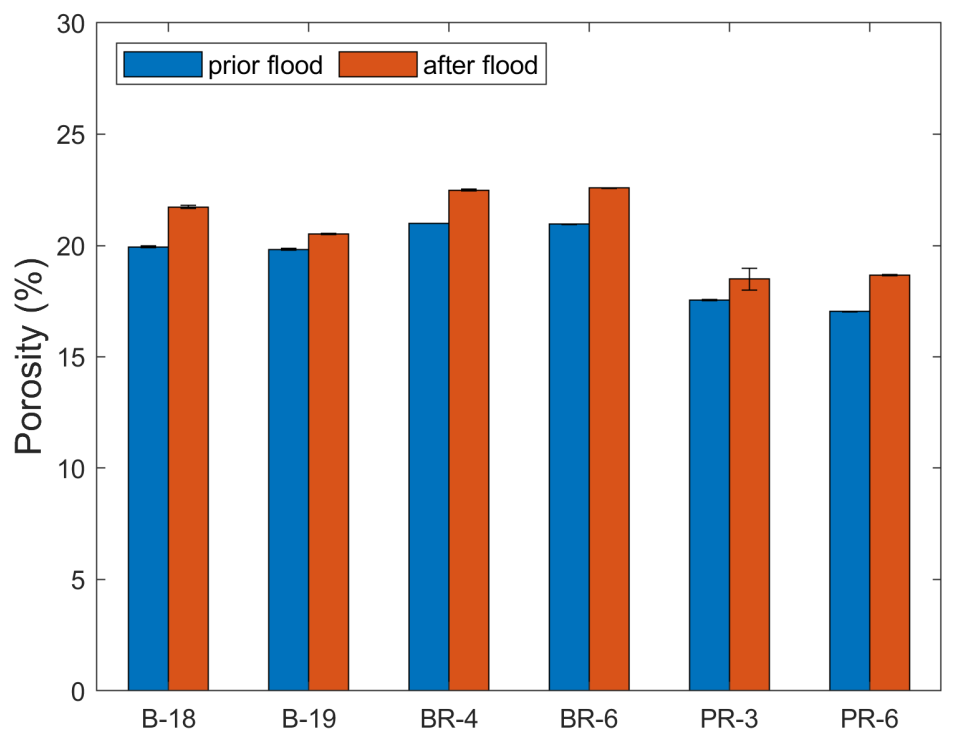
  • The addition of EDTA to half-diluted geothermal brine coming from the SaltPower electricity generation unit could avoid not only iron precipitation inside the porous media but also as standalone stimulation fluids for scale removal and matrix acidizing in geothermal reservoirs. Flow test experiments indicated an improvement in the rock properties (porosity) when 2D*TBEDTA was flooded through Berea, Bandera Brown, and Parker sandstone core plugs. The injection of 2D*TBEDTA could be used to increase the permeability in reinjection wells that have been clogged by precipitated salts instead of building a new one.
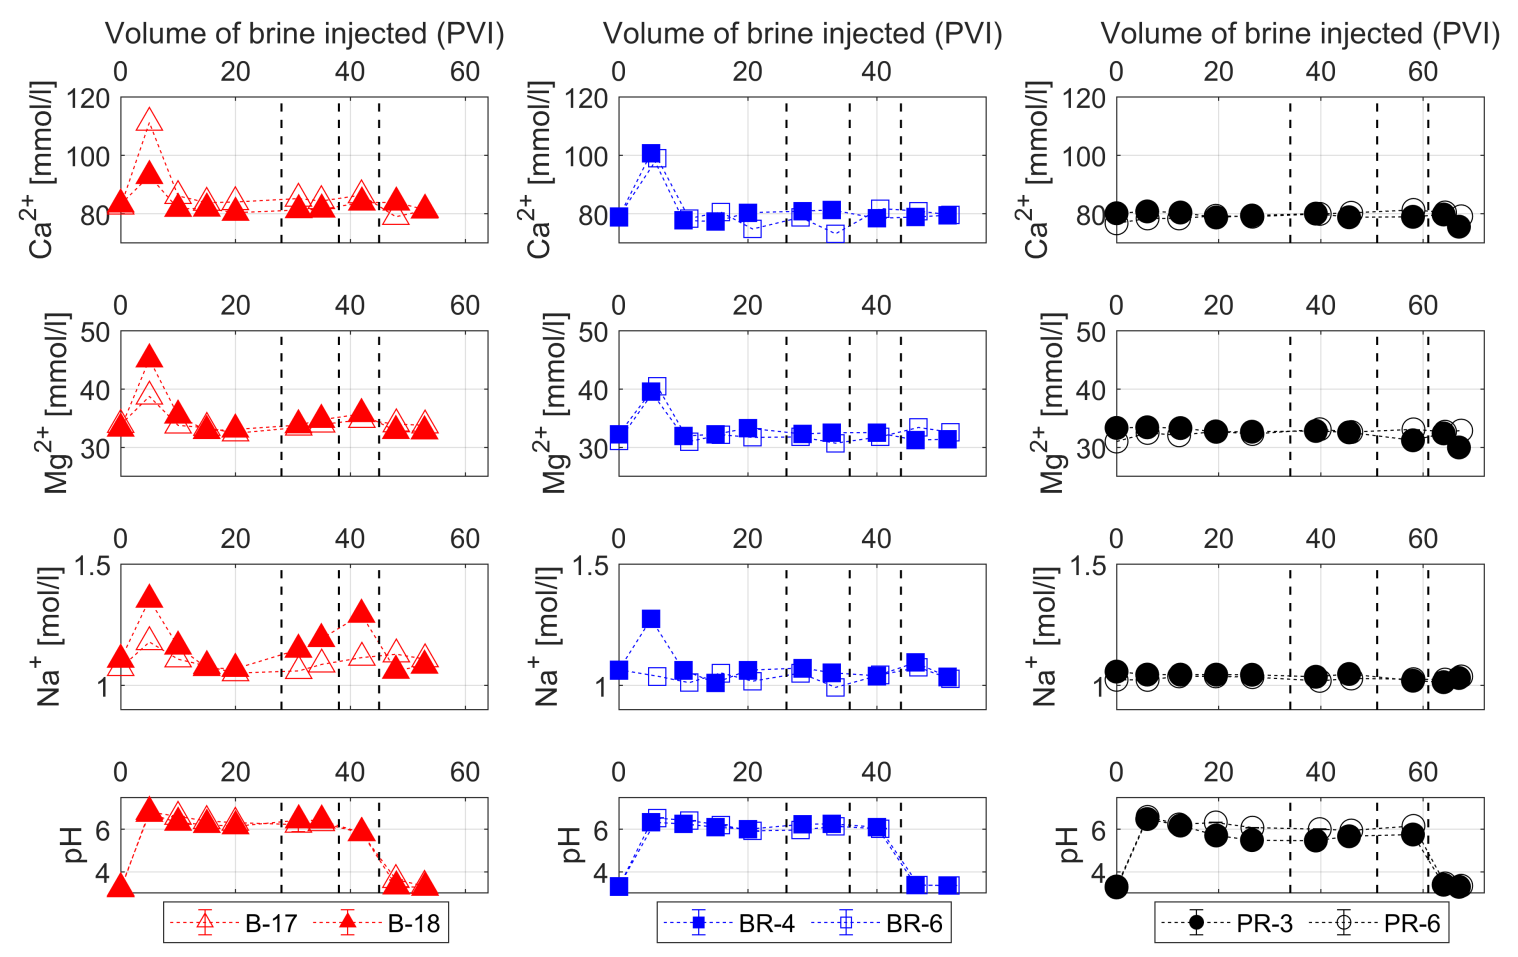
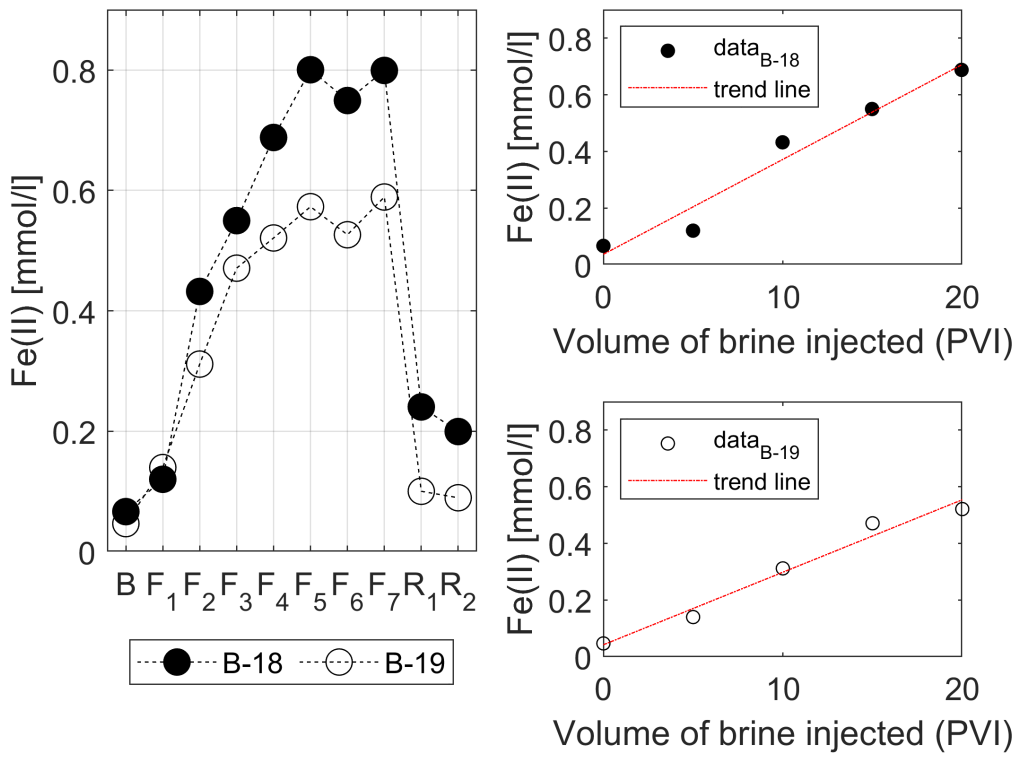
  • The injection of 2D*TBEDTA causes the dissolution of carbonate cement in both homogeneous and heterogeneous rocks throughout the complexation of EDTA with divalent cations (Ca2+ and Mg2+) and their transport away from the mineral surface into the bulk solution. This process reaches a maximum at about 5PVI and then it decreases due to the formation of wider flow paths.
  • The additional flooding experiments in which half-diluted geothermal brine without EDTA (2D*TB) was injected through the homogeneous and heterogeneous rocks show that the usage of EDTA can be decreased after some time due to the resulting increase of permeability and porosity in the heat reservoir. The reinjection of a half-diluted geothermal brine with EDTA could be a good choice to overcome the scaling problems in the reinjection wells.

Author Contributions

J.E.C.: conceptualization, data curation, formal analysis, investigation, methodology, software, validation, visualization, writing—original draft. E.G.S.: conceptualization, validation, writing—review and editing. All authors have read and agreed to the published version of the manuscript.

Funding

The financial assistance to acquire the TAM IV equipment was offered by Fabrikant Mads Clausens Fond and 402 Esbjerg Seminariefond.

Institutional Review Board Statement

Not applicable.

Informed Consent Statement

Not applicable.

Data Availability Statement

The raw coreflooding and microcalorimetry data are available.

Acknowledgments

We thank Søren Højmose Damgaard, driftschef for Thisted Varmeforsyning, for providing the geothermal brine used in the coreflooding experiments presented in this work. We also want to acknowledge Arkadiusz J. Goszczak for his help with the scanning electron microscopy analysis.

Conflicts of Interest

The authors declare no conflict of interest.

References

  1. Madsen, H.; Bruun Hansen, T.; Nakao, T.; Goda, S.; Søgaard, E. Combined geothermal heat and pressure retarded osmosis as a new green power system. Energy Convers. Manag. 2020, 226, 113504. [Google Scholar] [CrossRef]
  2. Yip, N.Y.; Brogioli, D.; Hamelers, H.V.M.; Nijmeijer, K. Salinity gradients for sustainable energy: Primer, progress, and prospects. Environ. Sci. Technol. 2016, 50, 12072–12094. [Google Scholar] [CrossRef] [PubMed]
  3. Straub, A.P.; Deshmukh, A.; Elimelech, M. Pressure-retarded osmosis for power generation from salinity gradients: Is it viable? Energy Environ. Sci. 2016, 9, 31–48. [Google Scholar] [CrossRef]
  4. Madsen, H.T.; Søndergaard Nissen, S.; Søgaard, E.G. Theoretical framework for energy analysis of hypersaline pressure retarded osmosis. Chem. Eng. Sci. 2016, 139, 211–220. [Google Scholar] [CrossRef]
  5. Skilhagen, S.; Dugstad, J.; Aaberg, R. Osmotic power—Power production based on the osmotic pressure difference between waters with varying salt gradients. Desalination 2008, 220, 476–482. [Google Scholar] [CrossRef]
  6. Achilli, A.; Cath, T.Y.; Childress, A.E. Power generation with pressure retarded osmosis: An experimental and theoretical investigation. J. Membr. Sci. 2009, 343, 42–52. [Google Scholar] [CrossRef]
  7. Yip, N.Y.; Elimelech, M. Performance limiting effects in power generation from salinity gradients by pressure retarded osmosis. Environ. Sci. Technol. 2011, 45, 10273–10282. [Google Scholar] [CrossRef]
  8. Altaee, A.; Sharif, A. Pressure retarded osmosis: Advancement in the process applications for power generation and desalination. Desalination 2015, 356, 31–46. [Google Scholar] [CrossRef]
  9. Madsen, H.; Nissen, S.; Muff, J.; Søgaard, E. Pressure retarded osmosis from hypersaline solutions: Investigating commercial FO membranes at high pressures. Desalination 2017, 420, 183–190. [Google Scholar] [CrossRef]
  10. Cobos, J.; Søgaard, E. Study of geothermal brine reinjection by microcalorimetry and core flooding experiments. Geothermics 2020, 87. [Google Scholar] [CrossRef]
  11. Cobos, J.; Søgaard, E. Systematic study of geothermal brine reinjection for SaltPower generation purposes: Citric acid as a potential iron control agent. Geothermics 2021, 95, 102116. [Google Scholar] [CrossRef]
  12. Crooijmans, R.; Willems, C.; Nick, H.; Bruhn, D. The influence of facies heterogeneity on the doublet performance in low-enthalpy geothermal sedimentary reservoirs. Geothermics 2016, 64, 209–219. [Google Scholar] [CrossRef] [Green Version]
  13. Hovadik, J.M.; Larue, D.K. Static characterizations of reservoirs: Refining the concepts of connectivity and continuity. Pet. Geosci. 2007, 13, 195–211. [Google Scholar] [CrossRef]
  14. Nicolaides, C.; Jha, B.; Cueto-Felgueroso, L.; Juanes, R. Impact of viscous fingering and permeability heterogeneity on fluid mixing in porous media. Water Resour. Res. 2015, 51, 2634–2647. [Google Scholar] [CrossRef]
  15. Alqahtani, F.M.; Dahouk, M.M.; Whitson, C.H.; Chuparova, E. Impact of Fluid Heterogeneity on Tight Unconventional Well GOR Performance. In Proceedings of the SPE/AAPG/SEG Unconventional Resources Technology Conference, Virtual, 20–22 July 2020. [Google Scholar] [CrossRef]
  16. Prete, P.; Fiorentino, A.; Rizzo, L.; Proto, A.; Cucciniello, R. Review of aminopolycarboxylic acids–based metal complexes application to water and wastewater treatment by (photo-)Fenton process at neutral pH. Curr. Opin. Green Sustain. Chem. 2021, 28, 100451. [Google Scholar] [CrossRef]
  17. Stumm, W. Chemistry of the Solid-Water Interface: Processes at the Mineral-Water and Particle-Water Interface in Natural Systems; John Wiley & Sons: Hoboken, NJ, USA, 1992. [Google Scholar]
  18. Rosenbrand, E.; Kjøller, C.; Fabricius, J.; Kets, F.; Fabricius, I. Different effects of temperature and salinity on permeability reduction by fines migration in Berea sandstone. Geothermics 2015, 53, 225–235. [Google Scholar] [CrossRef]
  19. Kamal, M.S.; Mahmoud, M.; Hanfi, M.; Elkatatny, S.; Hussein, I. Clay minerals damage quantification in sandstone rocks using core flooding and NMR. J. Pet. Explor. Prod. Technol. 2019, 9, 593–603. [Google Scholar] [CrossRef] [Green Version]
  20. Gamal, H.; Elkatatny, S.; Adebayo, A. Influence of mud filtrate on the pore system of different sandstone rocks. J. Pet. Sci. Eng. 2021, 202, 108595. [Google Scholar] [CrossRef]
  21. Hubbert, M. Darcy’s law and the field equations of the flow of underground fluids. Int. Assoc. Sci. Hydrol. Bull. 1957, 2, 23–59. [Google Scholar] [CrossRef] [Green Version]
  22. University of Calgary. Crewes Properties Calculator. 2022. Available online: https://www.crewes.org/ (accessed on 13 January 2022).
  23. Klinkenberg, L.J. The permeability of porous media to liquids and gases. Drill. Prod. Pract. 1941, 108, 200–213. [Google Scholar] [CrossRef]
  24. Dawson, G.; Pearce, J.; Biddle, D.; Golding, S. Experimental mineral dissolution in Berea Sandstone reacted with CO2 or SO2-CO2 in NaCl brine under CO2 sequestration conditions. Chem. Geol. 2015, 399, 87–97. [Google Scholar] [CrossRef] [Green Version]
  25. Cerasi, P.; Kjøller, C.; Sigalas, L.; Bhuiyan, D.; Frykman, P. Mechanical Effect of CO2 Flooding of a Sandstone Specimen. Energy Procedia 2016, 86, 361–370. [Google Scholar] [CrossRef] [Green Version]
  26. Shehata, A.; Nasr-El-Din, H. The role of sandstone mineralogy and rock quality in the performance of low-salinity waterflooding. SPE Reserv. Eval. Eng. 2016, 20. [Google Scholar] [CrossRef]
  27. Oliveira, M.A.; Vaz Alexandre, S.L.; Fernando, D.S.; Yulong, Y.; Zhenjiang, Y.; Pavel, B. Slow migration of mobilised fines during flow in reservoir rocks: Laboratory study. J. Pet. Sci. Eng. 2014, 122, 534–541. [Google Scholar] [CrossRef]
  28. Selley, R. Sedimentary Rocks | Mineralogy and Classification. In Encyclopedia of Geology; Selley, R.C., Cocks, L., Plimer, I.R., Eds.; Elsevier: Oxford, UK, 2005; pp. 25–37. [Google Scholar] [CrossRef]
  29. Fredd, C.N.; Fogler, H.S. Influence of transport and reaction on wormhole formation in porous media. AIChE J. 1998, 44, 1933–1949. [Google Scholar] [CrossRef] [Green Version]
  30. Mahmoud, M.; Nasr-El-Din, H. Modeling flow of chelating agents during stimulation of carbonate reservoirs. Arab. J. Sci. Eng. 2014, 39, 9239–9248. [Google Scholar] [CrossRef]
  31. Alkhaldi, M.; Nasr-El-Din, H.; Sarma, H. Application of citric acid in acid stimulation treatments. In Proceedings of the Canadian International Petroleum Conference, Calgary, AB, Canada, 16–18 June 2009; p. 16. [Google Scholar]
  32. Portier, S.; André, L. Review on Chemical Stimulation Techniques in Oil Industry and Applications to Geothermal Systems. 2007. Available online: http://engine.brgm.fr/Deliverables/Period2/ENGINE_D28_WP4_ChemicalStimulation_DHMA_052007.pdf (accessed on 27 April 2022).
  33. Moghadasi, J.; Müller-Steinhagen, H.; Jamialahmadi, M.; Sharif, A. Chemical stimulation for EGS: The use of chelating agents at high pH for the simultaneous dissolution of calcium carbonate, silicas, and silicates. In Proceedings of the World Geothermal Congress 2010, Bali, Indonesia, 25–30 April 2010; p. 11. [Google Scholar]
Figure 1. Chemical structure of ethylenediaminetetraacetic acid (EDTA) added to half-diluted Thisted brine.
Energies 15 03321 g001
Figure 2. Simplified test set-up: 1—ISCO syringe pump, 2—stainless steel pistons, 3—Hassler-type core holder with core, 4—oven, 5—pump, 6—nitrogen cylinder and manometer, 7—pressure transmitter, 8—back pressure regulator, 9—effluent collector, 10—computer.
Energies 15 03321 g002
Figure 3. Results of X-ray power diffraction (XRD) analysis of Berea, Bandera Brown, and Parker sandstone materials.
Energies 15 03321 g003
Figure 4. The impedance change for 2D*TBEDTA into Berea (red line), Bandera Brown (blue line), and Parker (black line) sandstones.
Energies 15 03321 g004
Figure 5. Measured porosity of the cores before and after the core flooding experiments. Blue bars show the initial values and the red bars indicate the measurements after the core flooding experiments.
Energies 15 03321 g005
Figure 6. Ionic concentration and pH changes in the effluents collected during the flooding test with 2D*TBEDTA. In this plot B-17 and B-18 are homogeneous rocks (Berea sandstone); BR-4, BR-6, PR-3, and PR-6 are heterogeneous rocks (Bandera Brown and Parker sandstones).
Energies 15 03321 g006
Figure 7. Distribution diagram of calcium species as a function of pH. Drawn using Spana software, Royal Institute of Technology, Sweden.
Energies 15 03321 g007
Figure 8. Fe(II) concentration in Berea core plugs flooded with 2D*TBEDTA and trend lines.
Energies 15 03321 g008
Figure 9. Fe(II) concentration in Bandera Brown core plugs flooded with 2D*TBEDTA and trend lines.
Energies 15 03321 g009
Figure 10. Fe(II) concentration in Parker core plugs flooded with 2D*TBEDTA and trend lines.
Energies 15 03321 g010
Figure 11. Scanning electron microscopy graphs of Berea sandstone: (a) original, (b) after TB injection.
Energies 15 03321 g011
Figure 12. Scanning electron microscopy graphs for homogeneous and heterogeneous sandstone rocks. In this graph, B: Berea, BR: Bandera Brown, and PR: Parker sandstones.
Energies 15 03321 g012
Figure 13. The impedance change for 2D*TB into core plugs flooded previously with EDTA. Berea (green line), Bandera Brown (purple line), and Parker (orange line) sandstones.
Energies 15 03321 g013
Table 1. Ionic composition in mmol/L and intrinsic properties of diluted Thisted geothermal brine with EDTA (2D*TBEDTA) used in the experiments. Ionic strength Ic in mmol/L, density ( ρ ) in g/cm3, pH, and viscosity ( μ ) in cP.
Ionic CompositionIntrinsic Properties
K+Mg2+Na+Sr2+Ca2+ClFe(II) I c ρ pH μ
2D*TBEDTA11.733.21106.81.882.51437.30.051.511.063.190.87
Table 2. Core data for the homogeneous (Berea) and heterogeneous (Bandera Brown and Parker) sandstone rocks used in the experiments.
Core
id.
l
(cm)
d
(cm)
PV
(mL)
ϕ
%
kgas
(MD)
kklink
(MD)
B-187.643.8015.5717.9026.2324.19
B-197.643.8015.7118.0924.4922.51
BR-47.643.8017.4220.2221.007.36
BR-67.643.8017.4520.2220.957.68
PR-37.643.8014.0316.1217.547.67
PR-67.643.8013.7615.8017.045.19
Table 3. Mineralogical composition of Berea, Bandera Brown, and Parker sandstones.
BereaBandera BrownParker
MineralConcentration  (wt%)MineralConcentration  (wt%)MineralConcentration  (wt%)
Albite14.1Albite3.2Albite7.2
Kaolinite25.8Kaolinite3.7Kaolinite8.0
Quartz60.1Illite3.9Illite2.7
--Quartz80.2Quartz73.3
--Muscovite8.9Muscovite8.7
Table 4. Brine permeabilities for Berea, Bandera Brown, and Parker plugs flooded with two times diluted Thisted brine with EDTA (2D*TBEDTA).
Samplek0 (mD)kB1 (mD)kB2 (mD)kB3 (mD)
B-1828.247.646.1-
B-1935.042.850.780.7
BR-415.425.827.927.4
BR-615.624.126.927.3
PR-311.715.119.626.3
PR-69.720.922.722.8
Table 5. Linear regression model for core plugs flooded with 2D*TBEDTA.
IonEquationR2
B-18 y = 0.034 x + 0.037 0.96
B-19 y = 0.026 x + 0.042 0.97
BR-4 y = 0.006 x + 0.040 0.96
BR-6 y = 0.003 x + 0.039 0.78
PR-3 y = 0.002 x + 0.052 0.87
PR-6 y = 0.004 x + 0.059 0.83
Publisher’s Note: MDPI stays neutral with regard to jurisdictional claims in published maps and institutional affiliations.

