Abstract
The European Union’s Green Deal emphasises the importance of improving the efficiency of the energy sector in its countries, which is why the issues involved are relevant in both scientific and practical terms. The article sets out the hypothesis that conveying the state of the economic efficiency of energy development by grades does not reflect the real situation. Instead of ranks, it is proposed to form homogeneous groups of some countries based on non-linear data normalisation instead of today’s universally used linearisation. Grouping the euro area countries in the European Union on the basis of the value of the cost-effectiveness indicator for the energy development of their industrial sector confirmed the appropriateness of the proposed method-ology. In this way, three groups of countries were formed according to the level of cost-effectiveness achieved. The proposed methodology for grouping countries is universal and can be used for international comparisons of any kind.
1. Introduction
The world is facing an ever-increasing environmental problem. The economic development of the countries is accompanied by the ever-increasing use of natural resources, leading to undesirable climate change. They increase the risk of the environment, human health, and well-being [1]. The European Green Deal responds to these negative trends [2]. Its objective is economic growth in a sustainable way, i.e., combining economic, social, and environmental development with each other. It is a new growth strategy that anticipates people’s well-being on the basis of modern, resource-efficient economic development. The aim is to fully prevent greenhouse gas emissions into the atmosphere by 2050 and to decouple economic growth from the use of unregenerated natural resources [3]. This strategy highlights the importance of the country’s energy sector and sets out appropriate directions for its transformation: decarbonisation, clean and technologically modern energy, addressing energy shortages, building energy service infrastructure, etc. All this presupposes the need for innovation and technological breakthrough in the energy sector.
Improving the efficiency of this sector has been discussed for a long time. As early as 2006, the European Commission identified it as one of the main objectives of the EU’s energy policy [4]. The constant increase in energy consumption has become a major challenge and it is therefore the efficiency of energy development that becomes the most important challenge. This means that economic growth must take place in a context of decreasing energy consumption [5].
The Green Deal strategy distinguishes among countries’ economies with the greatest impact on climate change-industry, agriculture, transport, and other services, i.e., services related to human activities [6]. An industry characterised by the use of energy-intensive technologies (steel, chemicals, cement, etc.) plays a special role here, affecting even a few key value chains (European Commission). This means that improving the cost-effectiveness of the energy development of this sector is becoming a particularly important challenge.
The interaction between energy consumption and economic development in the countries has been widely explored since the 1950s [7,8,9,10]. The EU Commission publishes an annual communication on energy efficiency. It contains an action plan to control and reduce energy demand, and to regulate the demand–supply ratio in order to reduce primary energy consumption. Again, emphasis is placed on improving the competitiveness of the sector at the expense of more energy efficiency. An ambitious target has been set to reduce its consumption by 32.5% at the EU level by 2030 [3].
In general, efficiency is understood to mean achieving the highest possible result with available resources [11]. The information provided by international statistical bases shows significant differences in both GDP and energy development in the industrial sector. This statement is valid not only for the industrial sector (e.g., GDP and medical sector) [12]. In accordance with standard practice, they are reflected in grades or ratings that make it possible to compare the position of one party vis-à-vis another. Even a superficial analysis shows that such a presentation of the situation does not adequately reflect the reality. For example, in Ireland, which is ranked first, GDP in the industrial sector is 2.5 times higher than that of the second-placed Germany; Italy’s analogous GDP is only 1.002 times more than Slovenia and 1.002 times than France (for Slovenia). In the meantime, their ranks are 8, 9, and 10 respectively. Germany and Cyprus have a GDP ratio of 5.29 for the industrial sector and 9.5 for grades, etc., which is similar to energy development. Finland’s leading industry GDP is 1.3 times higher than Slovakia’s second position. There are only 1.03 (24 and 5 grades) differences in GDP between Australia and Slovenia and 1.01 (15 and 16) times in Lithuania and Luxembourg. Finland and Malta have a GDP ratio of 4, and rank 19, etc. The question is whether and how the adequacy of international ratings can be improved. One possible way is to convey the situation not by grade, but by grouping, i.e., by dividing countries into homogeneous groups on the basis of the values of the indicator in question. At first sight, this can be done quite simply on the basis of the current procedure for the division of the statistical population into intervals. A deeper analysis shows that such an approach is too simplistic, since it is a linear division in its essence. Several values differing significantly by this path can form a separate group and thus distort the division of the whole into intervals. On the contrary, there may be almost overlapping values between different groups of indicators. All this can be avoided if we rely on a non-linear grouping of data.
The purpose of the article is therefore to determine the cost-effectiveness of the energy development of the industrial sector of the countries concerned and to group them on the basis of the proposed original methodology. Its essence is that in place of ranks, homogenous groups of countries are formed using non-linear, non-linear data normalization, not today. This is, in principle, a new approach that has not been analysed in literature sources, which makes it possible to convey a more adequate picture of the reality.
The subject of the research is the euro area countries of the European Union. The reason for their choice is that this group includes both developed and developing countries with the same currency.
In addition to the introduction, the article consists of literature review, research methodology, empirical research, and discussion of the results obtained. The literature review discusses the phenomenon of efficiency, as well as existing ways of grouping data, and identifies their shortcomings. The research methodology provides the procedure for determining the cost-effectiveness of the development of the industrial sector in the countries as well as the methodology for the non-linear grouping of the statistical population. The empirical part of the article shows in particular the inadequacy of the comparison between the parties in terms of grades, as well as the results of grouping the countries according to the economic adequacy of the energy development of their industrial sector in a linear and non-linear manner. The discussion discusses the new possibilities offered by the results obtained in the article.
2. Literature Review
Before examining the feasibility of measuring the cost-effectiveness of the energy development of the industrial sector in the countries, the concept of economic energy development and its cost-effectiveness should be discussed first.
The modern concept of economic development is examined on the basis of three interrelated criteria: changes, growth, and improvement. It is a broad concept that includes positive changes in economic indicators and the structural changes it has brought about, which determine people’s well-being and quality of life.
Similarly to economic development, energy development is a positive development in its consumption. On the other hand, this is the quantitative side of development. The qualitative side can only be judged by comparing it with the economic results obtained. They are reflected in an indicator of the cost-effectiveness of energy development.
In general, efficiency is understood to mean achieving the highest possible result with available resources. This concept is described in very different ways (Table 1).

Table 1.
Description of the concept of efficiency [13].
Other definitions of effectiveness can be accepted in the literature, but they do not differ in substance from those in Table 1 [8,13,23]. In all cases, efficiency is understood as the result of using available, limited resources. It can be measured by gross or net result indicators and multifactor or partial results [24,25], which is important to understand with regards to the links with the connected results, such as economic growth [26,27,28] and country competitiveness increase due to the efficient energy use [29].
Literature sources distinguish different types of efficiency [30,31,32,33]. This depends to a large extent on who uses the concept of efficiency (economists, engineers, politicians, business consultants, managers, etc.). In this way, its different concepts—economic, technical, financial, etc., are formulated [13].
In the context of the Green Deal, energy efficiency is important. It can be determined by analogy as the ratio of industrial GDP to its energy consumption.
Literature sources offer several ways of grouping data. In one case, the number of ranges is known and in the other, not. When known, the range h shall be determined as follows [34,35]:
where : the highest value of the indicator under consideration; —the smallest; and k = number of buckets.
In the second case, first of all, the number of intervals must be determined. This can be done in two ways:
where N is the number of statistical units.
The range h will be determined as follows:
The size of the ranges may also be uneven if they are designed to investigate a particular phenomenon, such as the division of undertakings according to the number of employees, breakdown of the population into groups by work resources, etc.
In all these cases, we have a linear division into groups, i.e., the size of all ranges is the same. As stated above, such a breakdown gives only an approximate picture of the current situation.
3. Test Methodology
The purpose of the analysis of the interaction between economic development and energy consumption is to determine its cost-effectiveness. It can be calculated by means of an indicator reflecting the ratio between the economic result and the amount of energy consumed for that purpose:
where -j means the cost-effectiveness factor for the energy development of the industrial sector of the country during the reference period; -j—indicator of the economic development of the industrial sector of the country; and —indicator of the energy development of the industrial sector of the country.
Determination of the indicator of the economic development of the domestic industrial sector. In the literature, countries’ economic development is viewed in different ways, but it is mostly based on gross domestic product per capita (GDP) [36,37,38]. This is due to a number of reasons. It is complex, i.e., reflects the value at market prices of all finished goods and services over a given period; the calculation is based on a sufficiently uniform methodology and allows comparisons among countries; it is publicly and widely disseminated in various statistical publications and is therefore easily accessible; and most importantly, it is integrated into all socio-economic systems of indicators of economic development.
Countries’ GDP depends to a large extent on the economic development of their industrial sectors. This is evidenced by the results of a correlation analysis between the energy development of the industrial sector in the EU and their GDP. The value of the coefficient r representing this relationship is 0.53.
For further calculations, the country’s industrial sector’s economic development indicator Equation (6) will be based on gross domestic product generated by industry per capita.
Determination of the country’s industrial sector energy development indicator. The green growth indicator system measures it in terms of energy consumption as a percent of total energy consumption [39,40]. By its very essence, like other indicators of this framework, it is designed to monitor progress in green growth, in order to support its policy-making and inform the general public about the state of play.
Non-linear subdivision of the statistical population into subgroups. On the basis of the proposed methodology, the statistical population under consideration may be divided into the desired number of subgroups. In a specific case, it will be divided into three sub-groups and, according to Equation (5), it will be divided into five groups.
The dividing of data sets into subgroups is carried out on the basis of nonlinear normalisation of their values, i.e., their transformation into a dimensionless scale. For this purpose, it is offered to apply functional dependences between actual values and their estimation on a dimensionless scale.
As such a functional dependence, it is proposed to use the dependence of the form [41,42,43]:
where Y is the numerical value of the criterion on the dimensionless scale; F(X′) is a functional dependence; and X′ is a numerical value on the intermediate scale.
Dependence Equation (7) refers to the asymptotic distribution of random values of the average values in the sample that has a piecewise monotonic form with refractive points with values: Y = 0.37 and Y = 0.63.
The values on the scale X are related to the scale Y by the dependence: X′ = −ln (−lnY). For example, Y′ = −ln (−ln 0.63) = 1.772398 ≈ 0.77 and Y′ = −ln (−ln 0.37) = 0.005 ≈ 0.
The graph-analytical model of grouping of objects of estimation on 3 grades is presented in Figure 1.
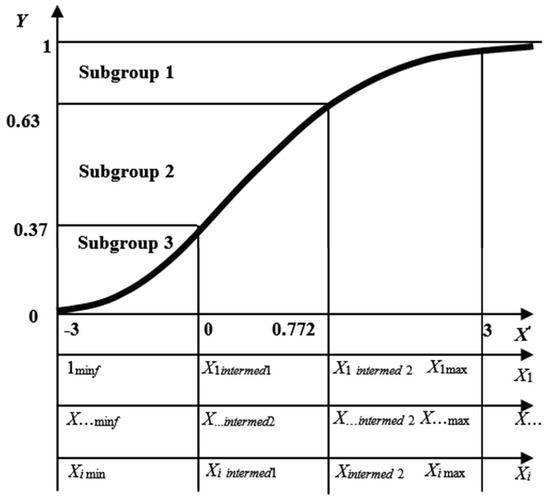
Figure 1.
Graph-analytical model of grouping evaluation objects into 3 subgroups (Source: compiled by the author).
The application of the graph-analytical model for the subset of the dataset consists of the following stages:
- Determination of the minimum (Ximin) and maximum (Ximax) values of the data set.
- Determination of the intermediate value of the data set (XiIntermed). It is GROUPED into three subgroups, there will be two intermediate values. Intermediate values correspond to equal parts of dividing the segment (Ximin—Ximax) into 3 equal parts.
Alignment of the partial scale of the dataset Xi with the intermediate scale X′. It is proposed to apply the method of dividing segments into equal proportions. The formula is as follows:
where:
where: Xileft—value on the Xi scale in the interval to the left; Xiright—value on the scale in the interval to the right; Xiactual—the actual value on the Xi scale; X′iright—value on the intermediate scale in the corresponding interval on the right; and X′ileft—value on the intermediate scale in the corresponding interval on the left. Similarly, calculations are carried out with a different number of ranges, e.g., five.
The technique is universal, as it allows you to change the number of subgroups. To do this, it is necessary to transform the intermediate scale.
On the basis of the methodology set out above, a grouping of the countries of the European Union according to the cost-effectiveness of the energy development of their industrial sector was carried out.
4. Empirical Study
The results of the calculation of the cost-effectiveness of the industrial sector in the euro area countries in the European Union are based on Equation (6) (Table 2).
Table 2.
Cost-effectiveness of the energy development of the industrial sector in the euro area countries in the European Union in 2018 (source: compiled by authors based on OECD).
Table 2 shows that in this case, too, the grades convey a rather distorted picture. For example, Estonia and Belgium rank 9 out of 10, while the indicator’s values differ by just 0.02%. The following indicator for Slovenia (grade 11) is already 12% different from Belgium. This reaffirms the need to convey the current situation to complex groups of countries rather than grades.
Once the cost-effectiveness of the energy development of the industrial sector has been established (Table 2), they can be divided according to the principle of linear and non-linear grouping. The calculations were made on the basis of Equations (4) and (5). The results of the calculations are given in Table 3.
Table 3.
Grouping of euro area countries in the European Union according to the cost-effectiveness of the energy development of the industrial sector (source: drawn up by the author).
According to Table 3, all the countries concerned can be divided into both three and five groups (Table 4).
Table 4.
Grouping of countries in the euro area of the European Union according to the energy development efficiency of the industrial sector (source: drawn up by the author).
Table 3 allows all the countries concerned to be divided into three groups on the basis of both linear and non-linear grouping (Table 4).
Table 4 shows that the results of the linear grouping of countries differ. This can be quantified in the following way:
where —the extent of the discrepancies in terms of the number of countries in group j; —the extent of the discrepancy according to the composition of the parties within the group; —number of mismatches in the group of countries j; —total number of countries in group j; —number of mismatches in the group of countries j; and —total number of countries in group j.
The results of the calculations based on Equations (10) and (11) are given in Table 5.
Table 5.
Differences between countries in linear and non-linear grouping as a percentage.
Table 5 shows that the division of the statistical population into a larger number of groups, i.e., the division by adjustment, increases the differences compared to the linear division. This reaffirms the flexibility of non-linear distribution.
5. Discussion
The results obtained in the article open a new direction for research. One of them is linked to the fact that a country’s GDP should not grow at the expense of increasing energy consumption. This will also be driven by the ever-increasing prices of energy resources. In the context of green growth, this growth must, on the contrary, take place as consumption decreases thanks to the wider application of clean, modern technologies. Thus, the cost-effectiveness of energy development needs to be judged by assessing changes in its consumption. It is no coincidence that the interaction among countries’ economic and energy development is analysed by many literary sources in the context of the Kuznetz curve [5,43,44,45].
Another direction for possible studies is a different approach to the assessment of cost-effectiveness, which is based not on the 1-year, last-year situation, but on the change over time. In this case, it will become clear whether they were positive or negative. It will be possible to compare, for example, the percentage of GDP growth over the period considered and the extent to which electricity consumption has changed, increased or decreased. Such an analysis would contribute to a much more accurate analysis of the interaction between the economic and energy development of the countries.
The methodology proposed in the article is universal. This means that its application can be developed both horizontally and vertically. Horizontally, to compare and analyse both the countries of the European Union and the countries and regions of other regions of the world. The vertical direction means that the proposed methodology allows the analysis of both other sectors of the economy and other, e.g., alternative, energy sources.
6. Conclusions
The Green Growth Strategy was developed in response to the ecological challenges of global development in Europe. It has an important role to play in energy development, as it has a significant impact on the climate generation. In this context, there is a problem of cost-effectiveness of energy development. Its status is provided by the international statistical bases. The situation of the parties vis-à-vis each other is usually expressed in grades. A deeper analysis of the ranking shows that such a presentation of the situation is approximate, since countries with practically identical values for the indicator reflecting energy development are given different ranks. It follows that the current situation needs to be translated into homogeneous groups of countries rather than grades. On the other hand, there is a problem of adequate division of countries into groups. Today, this is done linearly, i.e., the formation of equal-size ranges. This mechanical breakdown of countries complicates the formation of homogeneous groups. The solution is the non-linear division of countries into groups, where different size ranges are formed. Grouping the euro area countries in the European Union according to the cost-effectiveness of their industrial sector confirmed the relevance of the practical application of this methodology.
Energy today plays a growing role both in the economy and in the social and ecological development of countries. It is the basis for economic development. This can be seen from the sensitivity of countries to changes in energy prices. On the other hand, its quantitative development alone has a negative impact on other important areas of life in countries, in particular ecology. Energy is the biggest source of pollution. This means that the energy development of countries must not take place by increasing their production but by developing energy-saving technologies, innovative innovations, etc.
The determination of the state of energy development at a certain point in time (last year) reflects the current situation incompletely, since it does not assess the context, i.e., it does not assess the duration of the positive/negative changes. So, in addition to the determination of the condition at the particular time, changes and trends in them must be assessed. This will provide a much more accurate picture of the current situation.
The EU’s Green Growth Strategy foresees that economic growth cannot take place at the expense of increasing energy consumption. This changes the approach to the essence of cost-effectiveness, which must be judged depending on how it takes into account social and environmental development. Research and assessment of the interaction between economic and energy development should be based not on the situation at a given time, but on a certain period of time. Only then the trends in both economic and energy development will be highlighted, thus making the analysis of their interaction more valid.
Author Contributions
Data curation, R.T. and Y.B.; Methodology, R.G.; Resources, M.L.; Writing—review & editing, J.P. All authors have read and agreed to the published version of the manuscript.
Funding
This research received no external funding.
Conflicts of Interest
The authors declare no conflict of interest.
References
- European Environment Agency. Knowledge for transition to a sustainable Europe. In The European Environment–State and Outlook 2020; EEA: Copenhagen, Denmark, 2019. [Google Scholar]
- Shevchenko, H.; Petrushenko, M.; Burkynskyi, B.; Khumarova, N. SDGs and the ability to manage change within the European green deal: The case of Ukraine. Probl. Perspect. Manag. 2021, 19, 53–67. [Google Scholar] [CrossRef]
- European Commission. Communication from the Commission. The European Green Deal; EEA: Copenhagen, Denmark, 2019. [Google Scholar]
- European Commission. Comunication from the Commission—Action Plan for Energy Efficiency: Realising the Potential. In The European Green Deal; EEA: Copenhagen, Denmark, 2006. [Google Scholar]
- Alam, M.M.; Murad, M.W.; Noman, A.H.M.; Ozturk, I. Relationships among carbon emmissions, economic growth, energy consumption and population growth:Testing Environmental Kuznets Curve hypothesis for Brasil, China, India and Indonesia. Ecol. Indic. 2016, 70, 466–479. [Google Scholar] [CrossRef]
- European Commission. A New Industrial Strategy for Europe. COM/2020/102 Final; EEA: Copenhagen, Denmark, 2020. [Google Scholar]
- Toman, M.T.; Jemelkova, B. Energy and Economic Development: An Assessment of the State of Knowledge. Energy J. Int. Assoc. Energy Econ. 2003, 24, 93–112. [Google Scholar] [CrossRef]
- Manzoor, Q.-A. Impact of Employees Motivation on Organizational Effectiveness. EJBM 2012, 3, 36–44. Available online: www.iiste.org (accessed on 25 November 2021). [CrossRef]
- Carmona, M.; Feria, J.; Golpe, A.A.; Iglesias, J. Energy consumption in the US reconsidered. Evidence across sources and economic sectors. Renew. Sustain. Energ. Rev. 2017, 77, 1055–1068. [Google Scholar] [CrossRef]
- Deineko, L.; Sychevskiy, M.; Tsyplitska, O.; Grebeniuk, N.; Deineko, O. Increasing resource efficiency in the industrial complex ensuring environmental human rights. Environ. Econ. 2021, 12, 124–139. [Google Scholar] [CrossRef]
- Nastisin, L.; Gavurova, B.; Bacik, R.; Svetozarovova, N.; Fedorko, R. Sustainable performance of players in the global aviation industry in the light of multi-factor analysis of online reputation. Int. J. Entrep. Knowl. 2021, 9, 1–9. [Google Scholar] [CrossRef]
- Čabinová, V.; Gallo, P.; Pártlová, P.; Dobrovič, J.; Stoch, M. Evaluating Business Performance and Efficiency in the Medical Tourism: A Multi-criteria Approach. J. Tour. Serv. 2021, 22, 198–221. [Google Scholar] [CrossRef]
- Škėlaitė, B.; Mačiulytė-Šniukienė, A. Gamybinių įmonių veiklos efektyvumo vertinimo teoriniai aspektai ir modelis. Lietuvos jaunųjų mokslininkų konferencija “Mokslas-Lietuvos ateitis”. Verslas XXI amžiuje, 22nd Conference (13 February 2019 in Vilnius) for Young Researchers “Economics and Management”. vvf.2019.008. Vilnius: VGTU. Available online: http://jmk.vvf.vgtu.lt (accessed on 10 September 2021).
- Bagdanavičius, J.; Stankevičius, P.; Lukoševičius, V. Ekonomikos Terminai Ir Savokos: (Mokomasis Žodynas); Vilniaus Pedagoginis Universitetas: Vilnius, Lithuania, 1999. [Google Scholar]
- Jackson, M. The stability and efficiency of directed communication networks. Rev. Econ. Des. 2000, 5, 251–277. [Google Scholar]
- Black, J.; Hashimzade, N.; Myles, G.D. A Dictionary of Economics; Oxford University Press: Oxford, UK, 2009; Available online: http://www.oxfordreference.com/view/10.1093/acref/9780199237043.001.0001/acref-9780199237043 (accessed on 14 September 2021).
- Dhiren, N. Review: The Social Psychology of Organizations. 2009. Available online: http://sites.idc.ac.il/dice/files/activity2.pdf (accessed on 25 November 2021).
- Roghanian, P.; Rasli, A.; Gheysari, H. Productivity Through Effectiveness and Efficiency in the Banking Industry. Procedia Soc. Behav. Sci. 2012, 40, 550–556. [Google Scholar] [CrossRef]
- Grossman, M. Efficiency: Economics and Organizational Analysis. Available online: https://www.britannica.com/topic/efficiency-economics-and-organizational-analysis (accessed on 20 November 2021).
- AGPC. On Efficiency and Effectiveness: Some Definitions. Productivity Commission Staff Research Note. 2013. Available online: www.pc.gov.au (accessed on 6 April 2015).
- Zinkevičiūtė, V.; Vasilis Vasiliauskas, A. Gamybos Logistika, Gamybos Vadyba: Vadovėlis; S. Jokužio Leidykla-Spaustuvė: Klaipėda, Lithuania, 2013. [Google Scholar]
- Sharma, D. Organizational Commitment and Organizational Effectiveness; Institute of Professional Studies: Delhi, India, 2016. [Google Scholar]
- Drucker, P. Managing for Business Effectiveness. Harvard: Harvard Business Review. 1963. Available online: https://hbr.org/1963/05/managing-for-business-effectiveness (accessed on 17 January 2020).
- Bilan, Y.; Mishchuk, H.; Roshchyk, I.; Kmecova, I. Analysis of Intellectual Potential and its Impact on the Social and Economic Development of European Countries. Int. J. Cancer 2020, 1, 22–38. [Google Scholar] [CrossRef]
- Jurickova, E.; Pilik, M.; Kwarteng, M.A. Efficiency measurement of National Innovation Systems of the European Union countries: DEA Model Application. J. Int. Stud. 2019, 12, 286–299. [Google Scholar] [CrossRef]
- Carrillo, M. Measuring and ranking R&D performance at the country level. Econ. Sociol. 2019, 12, 100–114. [Google Scholar] [CrossRef]
- Derun, I.; Mysaka, H. Contemporary drivers of business growth: Evidence from US public companies. J. Int. Stud. 2021, 14, 39–55. [Google Scholar] [CrossRef]
- Oliinyk, O.; Bilan, Y.; Mishchuk, H. Knowledge Management and Economic Growth: The Assessment of Links and Determinants of Regulation. Cent. Eur. Manag. J. 2021, 29, 20–39. [Google Scholar] [CrossRef]
- Tvaronavičienė, M.; Prakapienė, D.; Garškaitė-Milvydienė, K.; Prakapas, R.; Nawrot, Ł. Energy Efficiency in the Long-Run in the Selected European Countries. Econ. Sociol. 2018, 11, 245–254. [Google Scholar] [CrossRef]
- Kukhta, K.O.; Dorogan, L.O. A DEA—Analysis as method of estimation of efficiency of production is on agricultural enterprises. Econ. AIC 2015, 10, 93–104. [Google Scholar]
- Zofio, J.L.; Pastor, J.T.; Aparicio, J. The directional profit efficiency measure: On why profit inefficiency is either technical or allocative. J. Prod. Anal. 2013, 40, 257–266. [Google Scholar] [CrossRef]
- Suseata, A.; Adams, D.C.; Carter, D.R.; Gonzalez-Benecke, C.; Dwivedi, P. Technical, allocative, and total profit efficiency of loblolly pine forests under changing climatic conditions. For. Policy Econ. 2016, 72, 106–114. [Google Scholar] [CrossRef]
- Polyakov, M.; Khanin, I.; Bilozubenko, V.; Korneyev, M.; Shevchenko, G. Factors of uneven progress of the European Union countries towards a circular economy. Probl. Perspect. Manag. 2021, 19, 332–344. [Google Scholar] [CrossRef]
- Tarka, D.; Olszewska, A.M. Elementy Statystyki. Opis Statystyczny; Oficyna Wydawnicza Politechniki Białostockiej: Białystok, Poland, 2018. [Google Scholar]
- Bąk, I.; Markowicz, I.; Mojsiewicz, M.; Wawrzyniak, K. Statystyka w Zadaniach (część I); Wydawnictwa Naukowo Techniczne: Warszawa, Poland, 2002. [Google Scholar]
- Brizga, J.; Mishchuk, Z.; Golubovska-Onisimova, A. Sustainable consumption and production governance in countries in transition. J. Clean. Prod. 2014, 63, 45–53. [Google Scholar] [CrossRef]
- Kozyreva, O.; Sagaidak-Nikituk, R.; Demchenko, N. Analysis of the Socio-Economic Development of Ukrainian Regions. Balt. J. Econ. Stud. 2017, 3, 51–58. [Google Scholar] [CrossRef][Green Version]
- Jędrzejczak-Gas, J.; Barska, A. Assessment of the Economic Development of Polish Regions in the Context of the Implementation of the Concept of Sustainable Development—Taxonomic Analysis. Eur. J. Sustain. Dev. 2019, 8, 222–233. [Google Scholar] [CrossRef]
- OECD. Towards Green Growth: Monitoring Progress—OECD Indicators. In OECD Green Growth Studies; OECD Publishing: Paris, Franch, 2011; Available online: https://www.oecd.org/greengrowth/48224574.pdf (accessed on 6 May 2020).
- OECD. Green Growth Indicators 2017. In OECD Green Growth Studies; OECD Publishing: Paris, Franch, 2017. [Google Scholar] [CrossRef]
- Trisch, R.; Gorbenko, E.; Dotsenko, N.; Kim, N.; Kiporenko, A. Development of qulimetric approaches to the processes of quality management system at enterprises according to international standards of the ISO 9000 series. East. Eur. J. Enterp. Technol. 2016, 413, 63–67. [Google Scholar]
- Ginevičius, R.; Trishch, R.; Remeikienė, R.; Gasparėnienė, L. Complex evaluation of the negative variations in the development of Lithuanian municipalities. Transform. Bus. Econ. 2021, 20, 635–653. [Google Scholar]
- Al-Mulali, U.; Ozturk, I.; Solarin, S.A. Investigating the environmental Kuznets curve hypothesis in seven regions: Thhe role of renewable energy. Ecol. Indic. 2016, 67, 267–282. [Google Scholar] [CrossRef]
- Altintaş, H.; Kassouri, Y. Is the environmental Kuznets Curve in Europe related to the per-capita ecological footprint or CO2 emissions? Ecol. Indic. 2020, 113, 106187. [Google Scholar] [CrossRef]
- Shahbaz, M.; Sinha, A. Environmental Kuznets curve for CO2 emissions: A literature survey. J. Econ. Stud. 2019, 46, 106–168. [Google Scholar] [CrossRef]

Publisher’s Note: MDPI stays neutral with regard to jurisdictional claims in published maps and institutional affiliations. |
© 2022 by the authors. Licensee MDPI, Basel, Switzerland. This article is an open access article distributed under the terms and conditions of the Creative Commons Attribution (CC BY) license (https://creativecommons.org/licenses/by/4.0/).