
Characteristics of Wind Resources and Post-Project Evaluation of Wind Farms in Coastal Areas of Zhejiang


Abstract
:1. Introduction
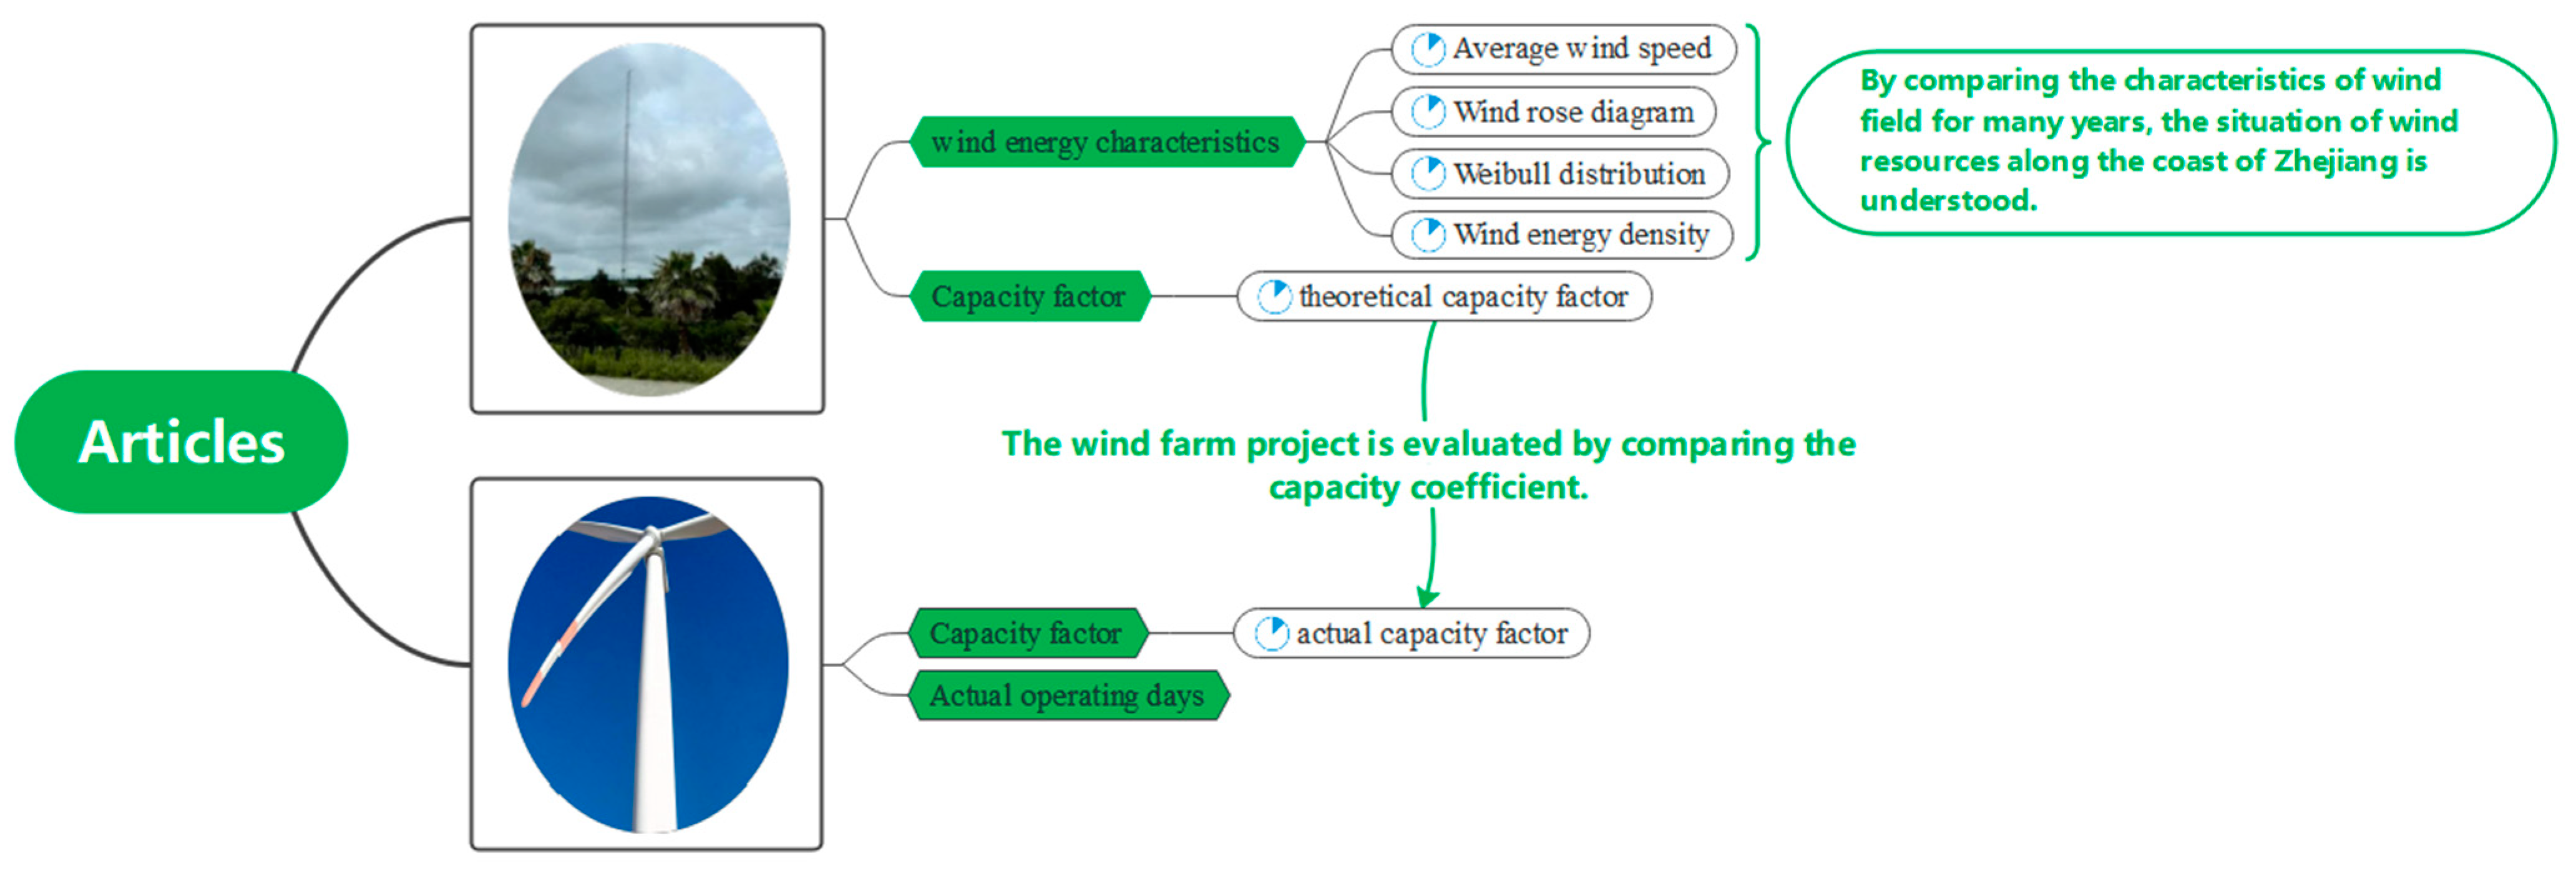
2. Analysis Method
2.1. Average Wind Speed
2.2. Weibull Distribution
2.3. Wind Power Density
2.4. Predicted Power Generation and Capacity Factor
3. Location Description
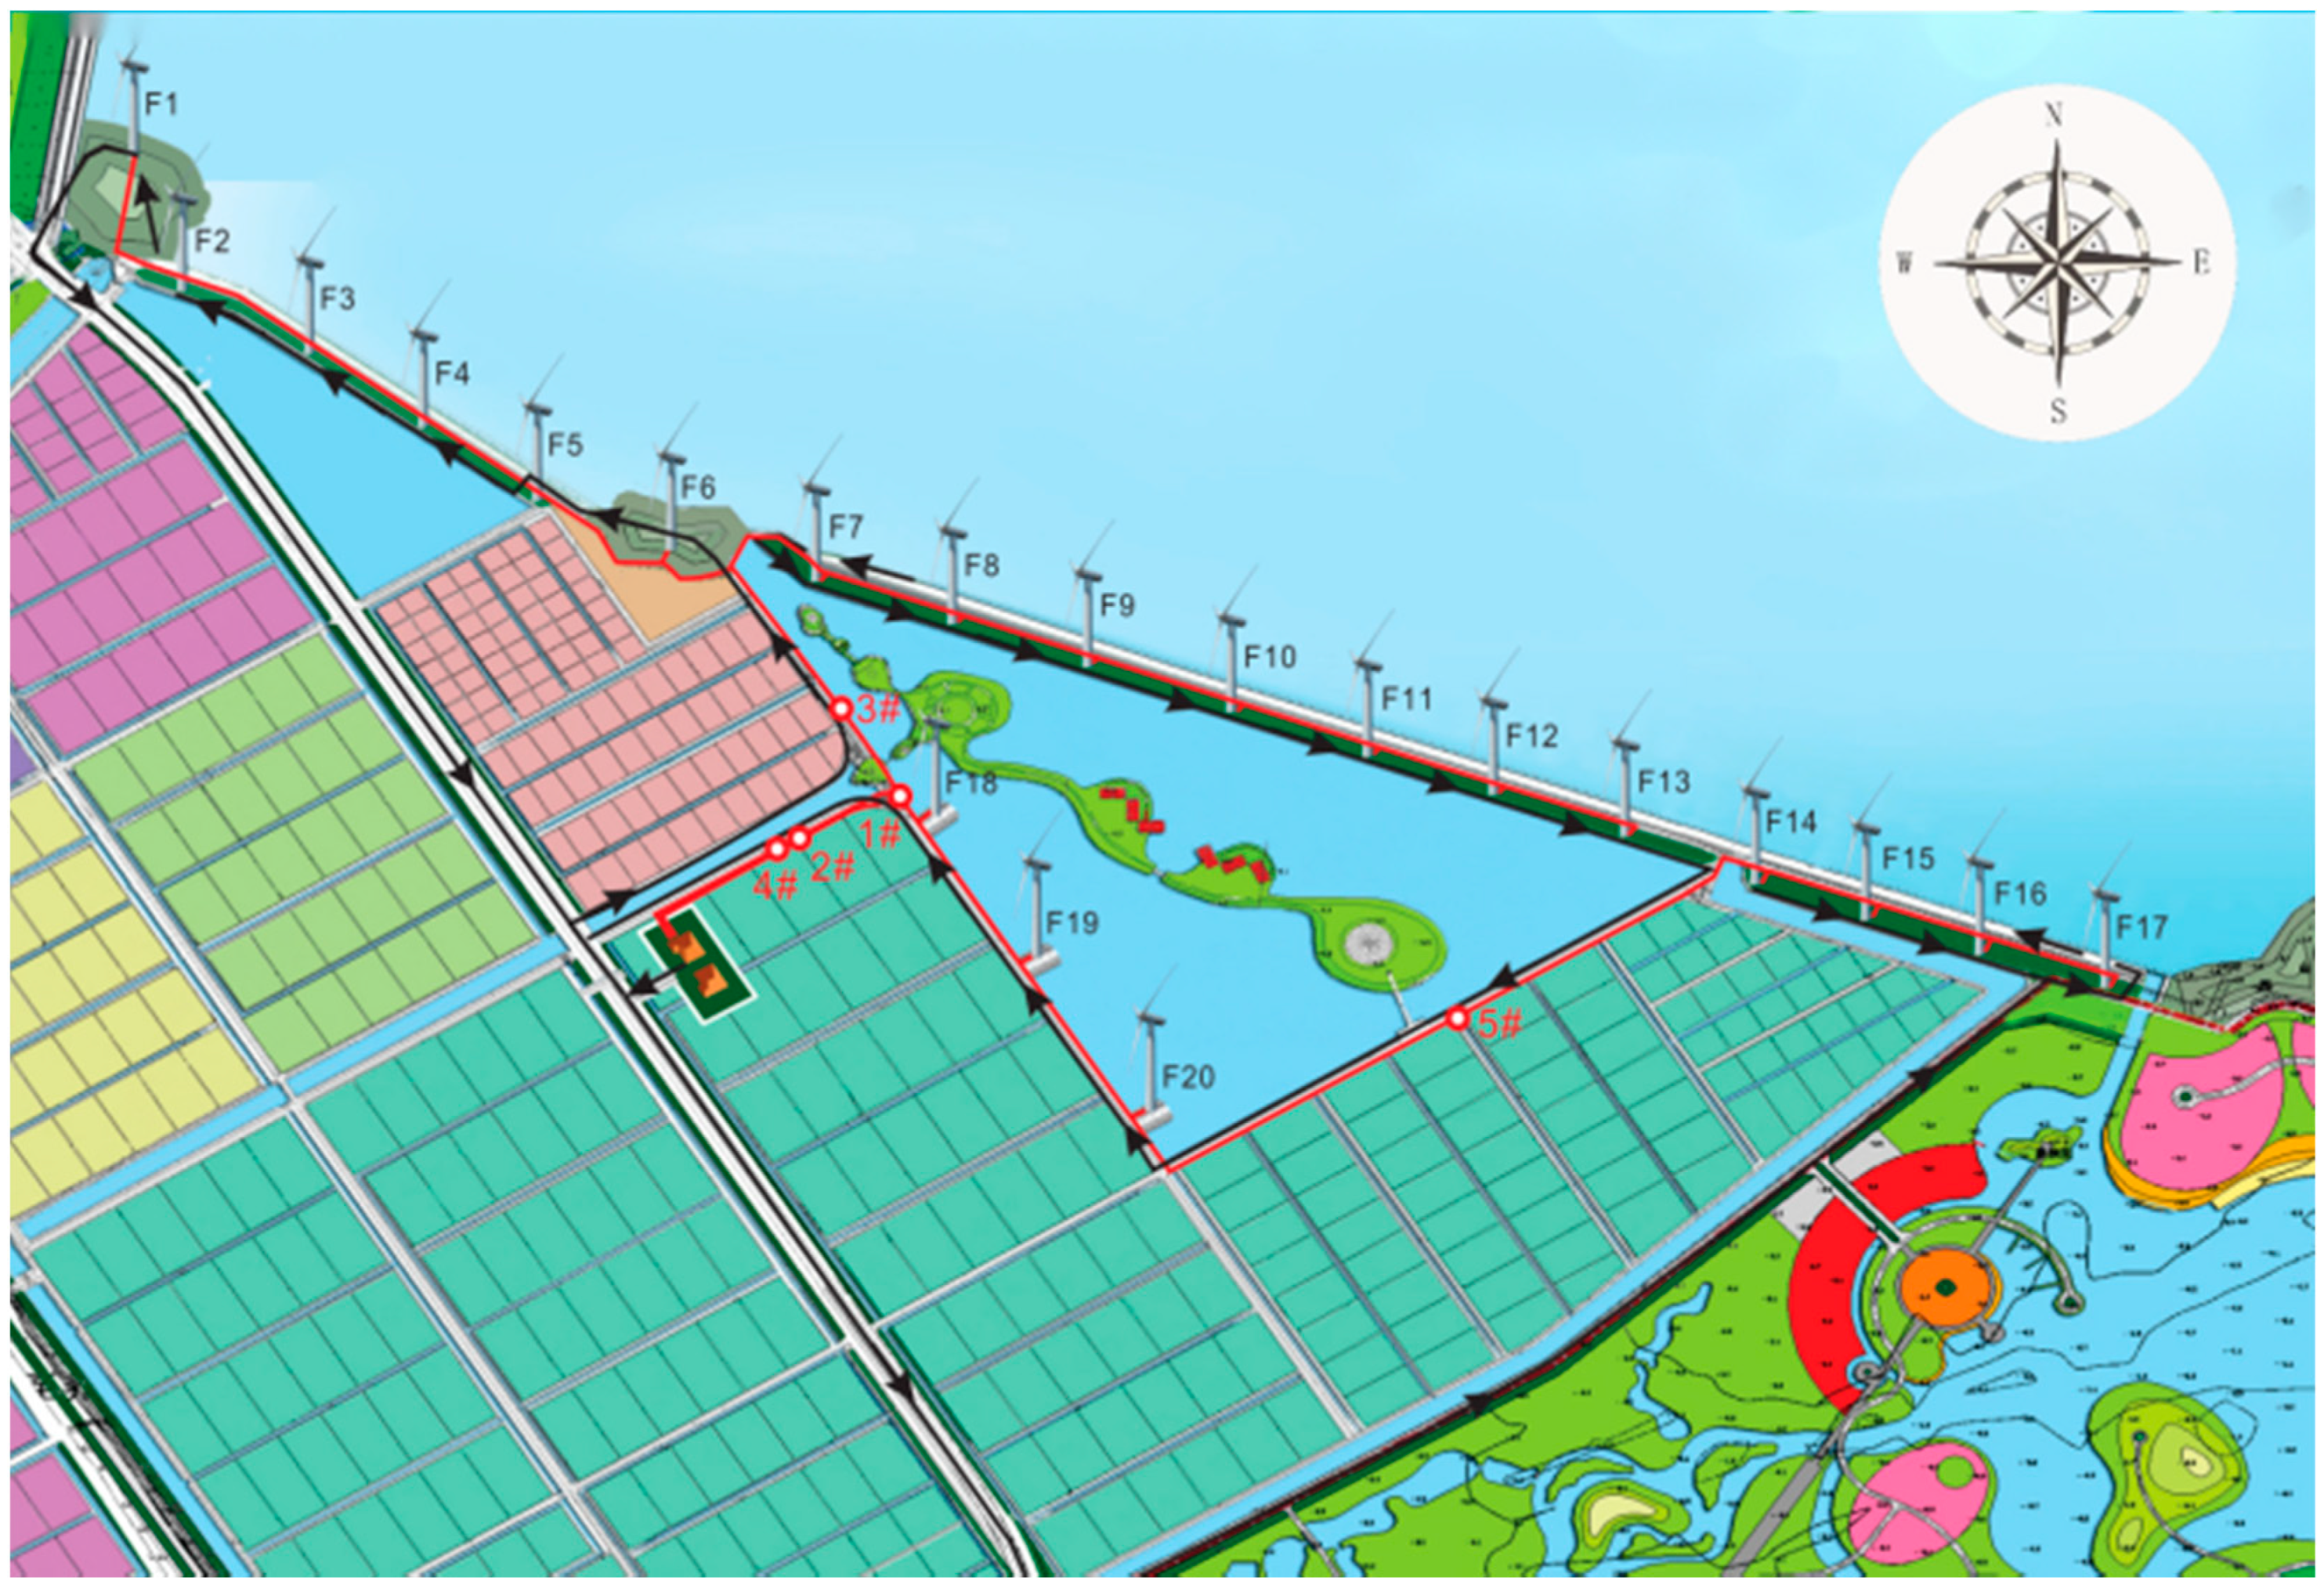
3.1. Research Site
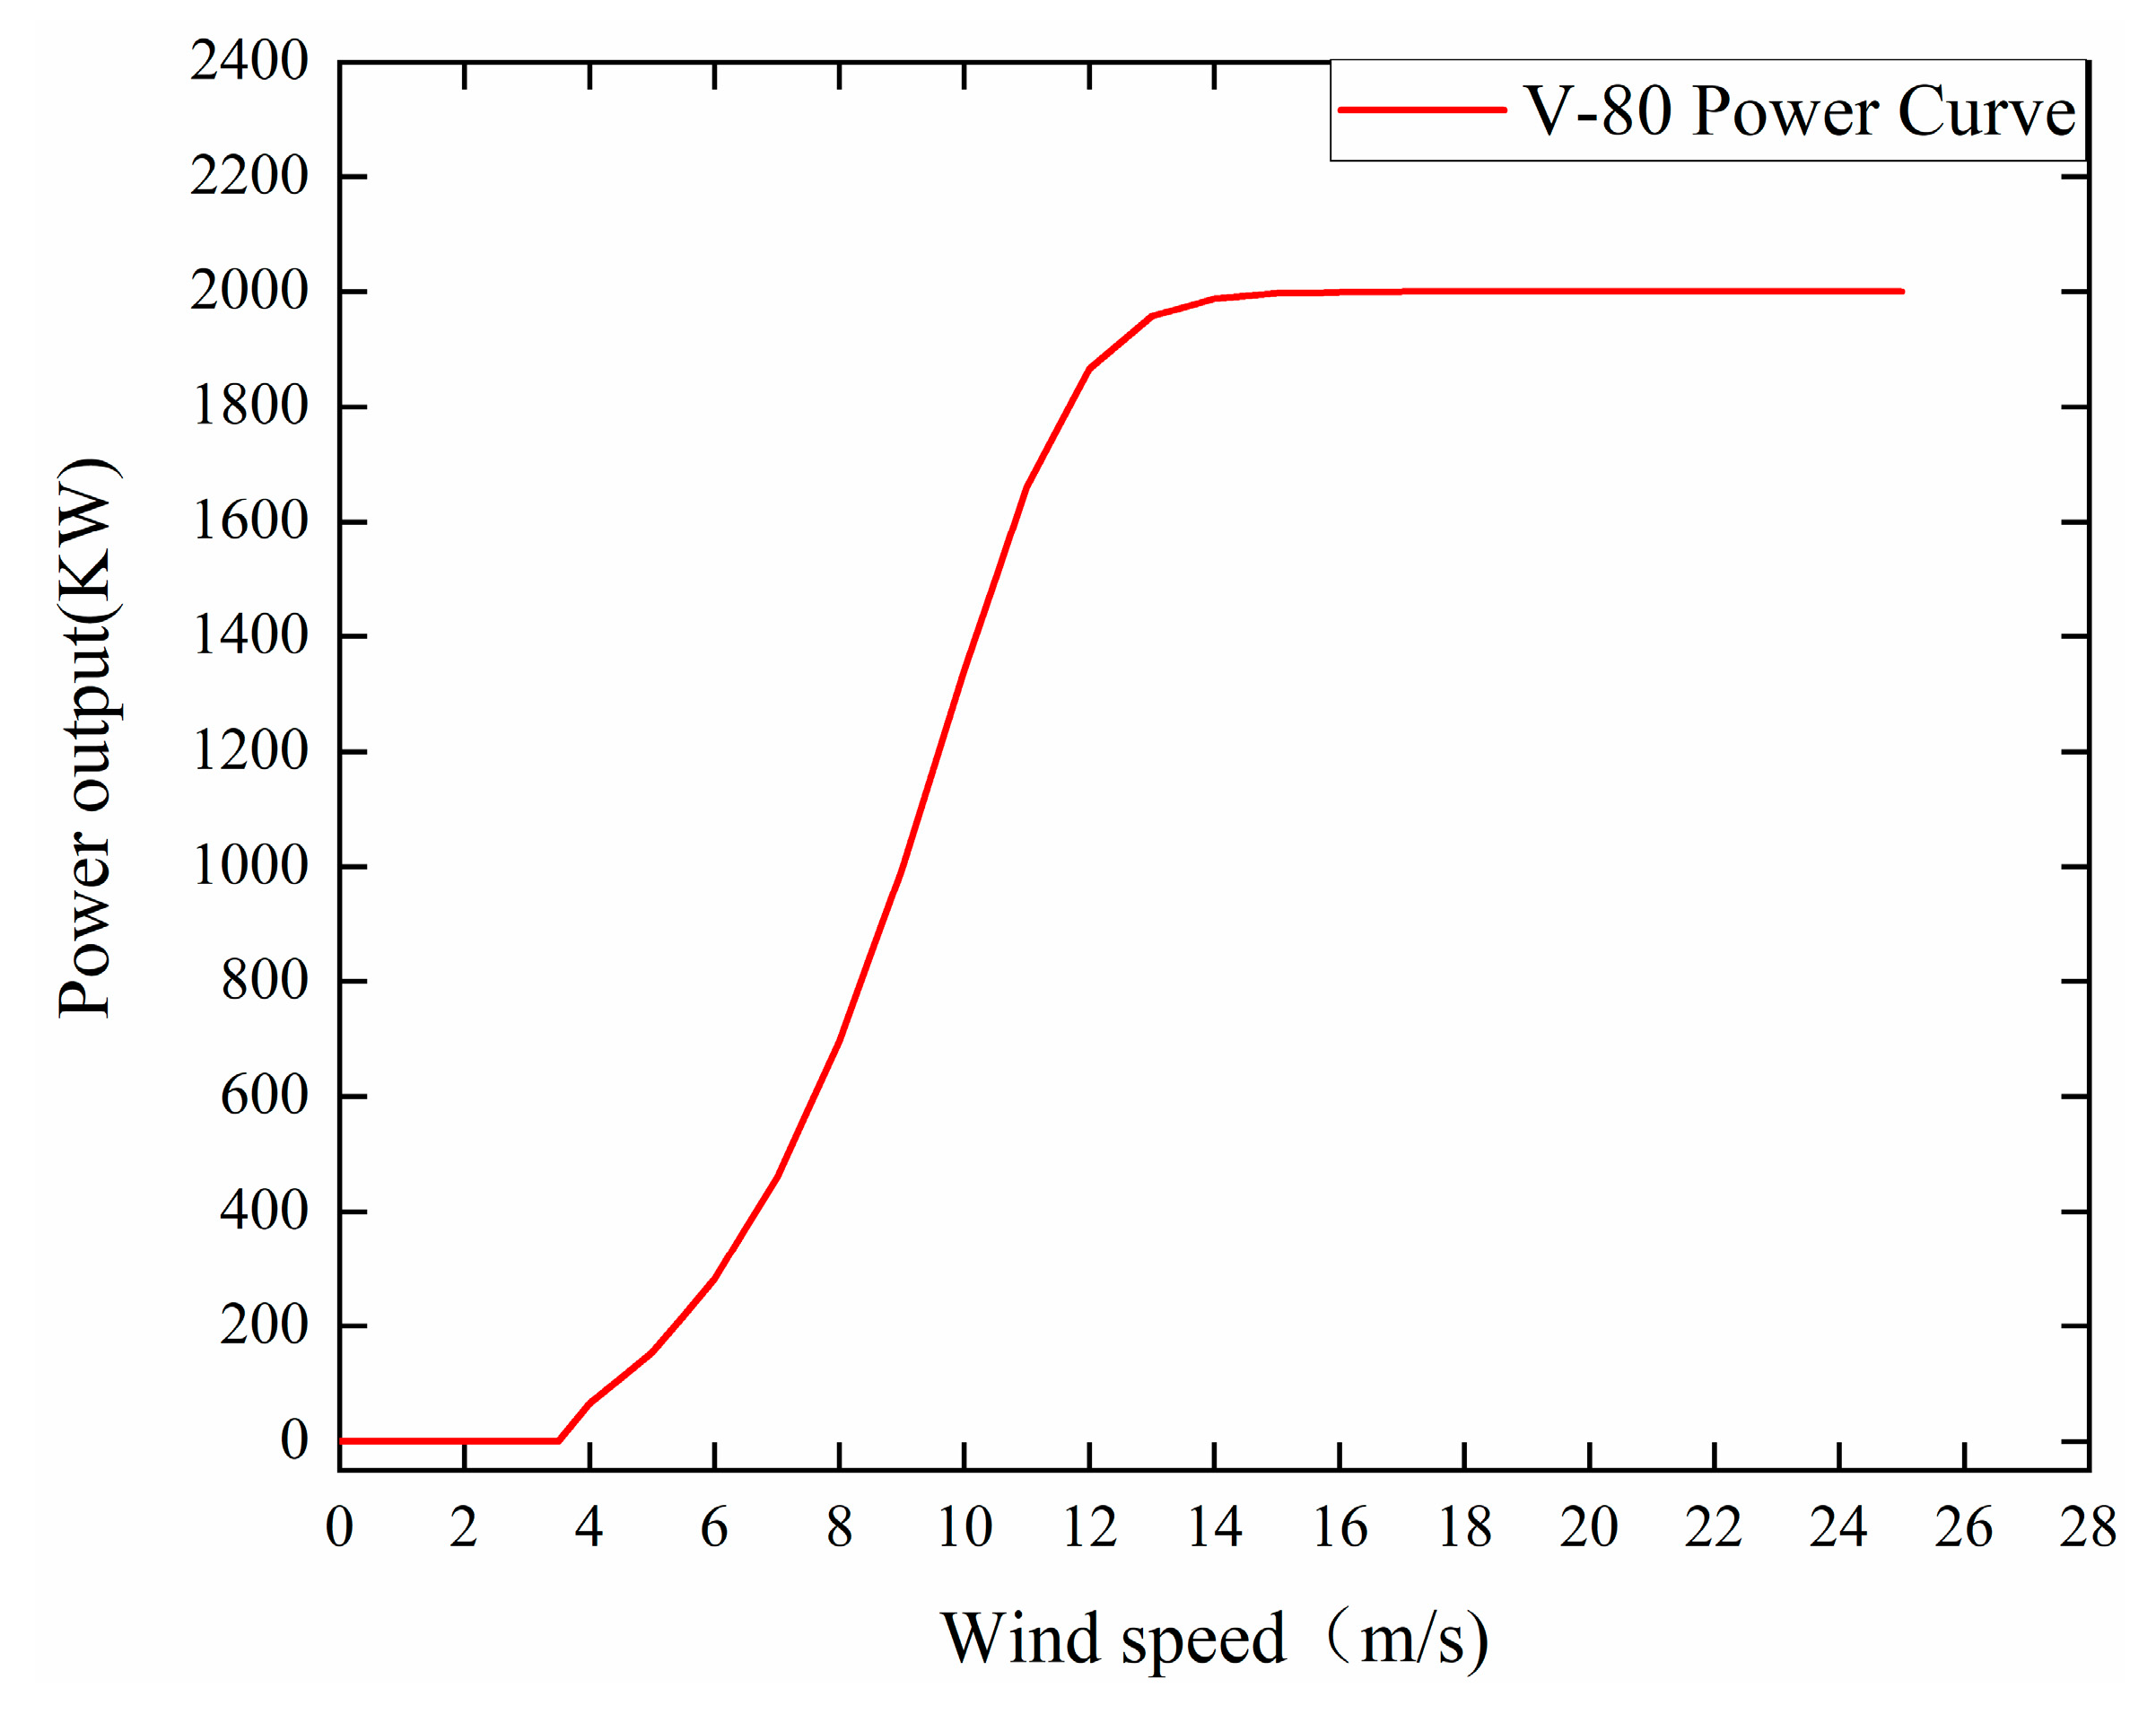
3.2. Equipment
4. Data Analysis
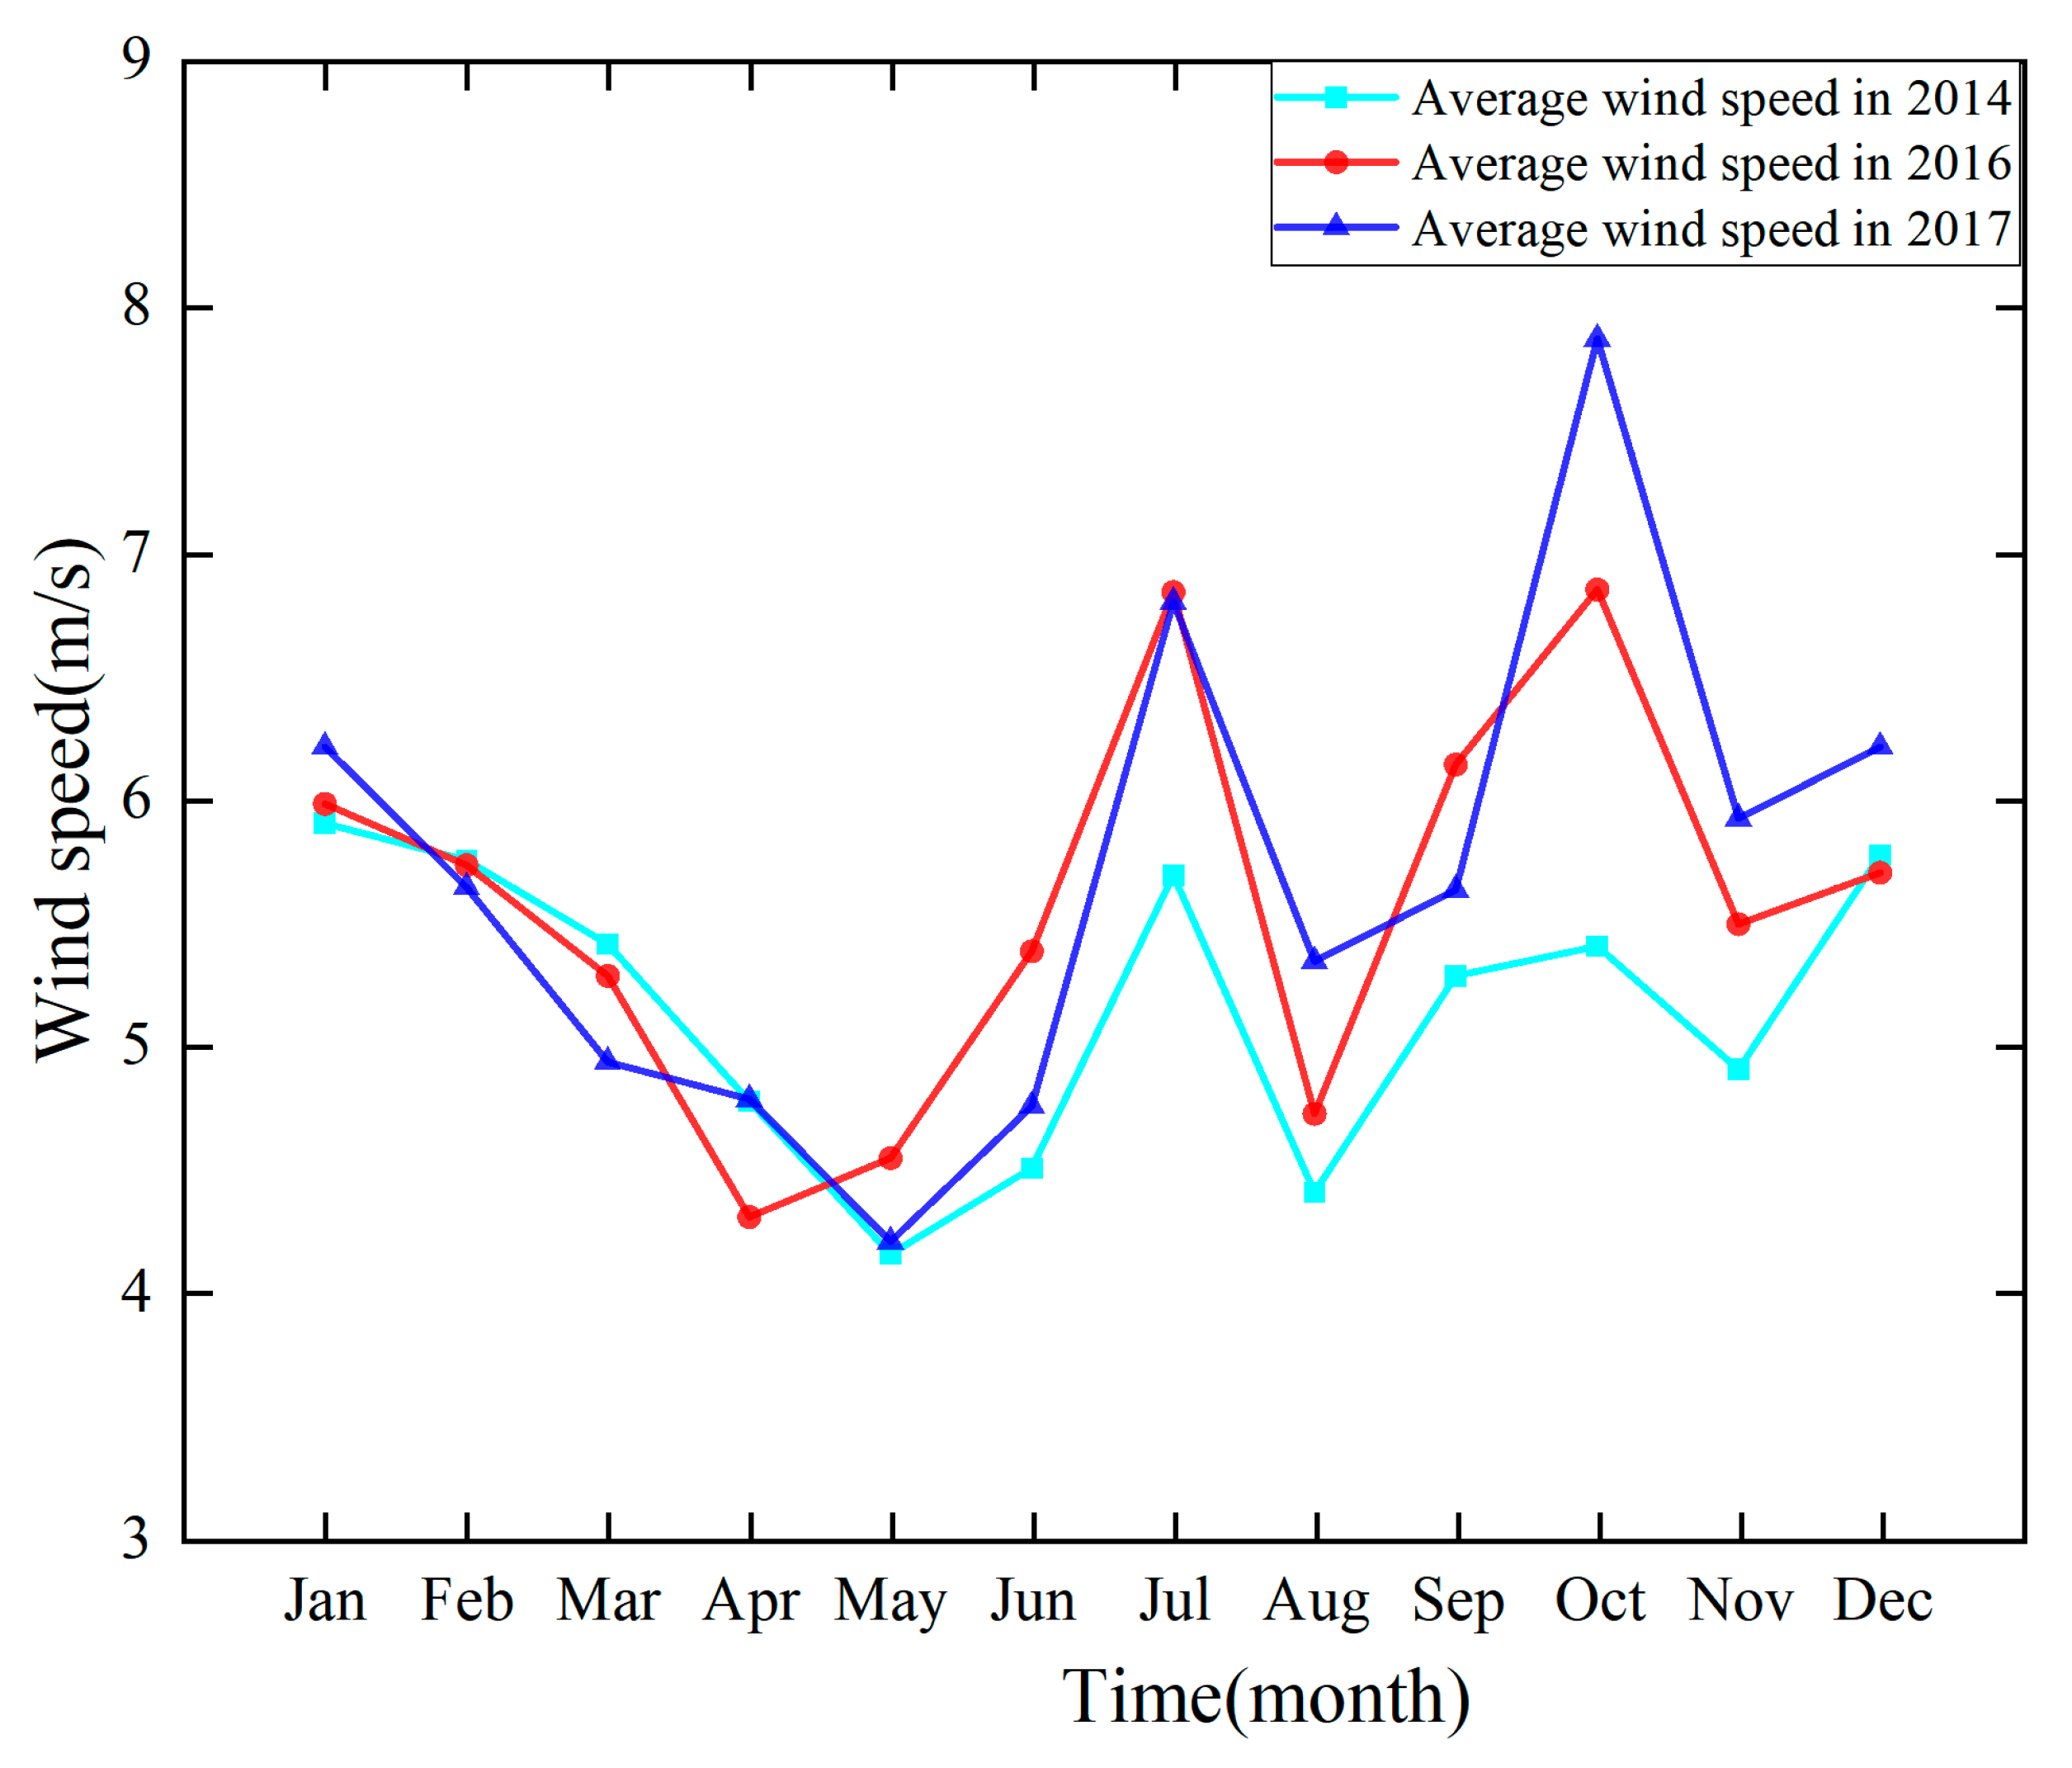
4.1. Average Wind Speed
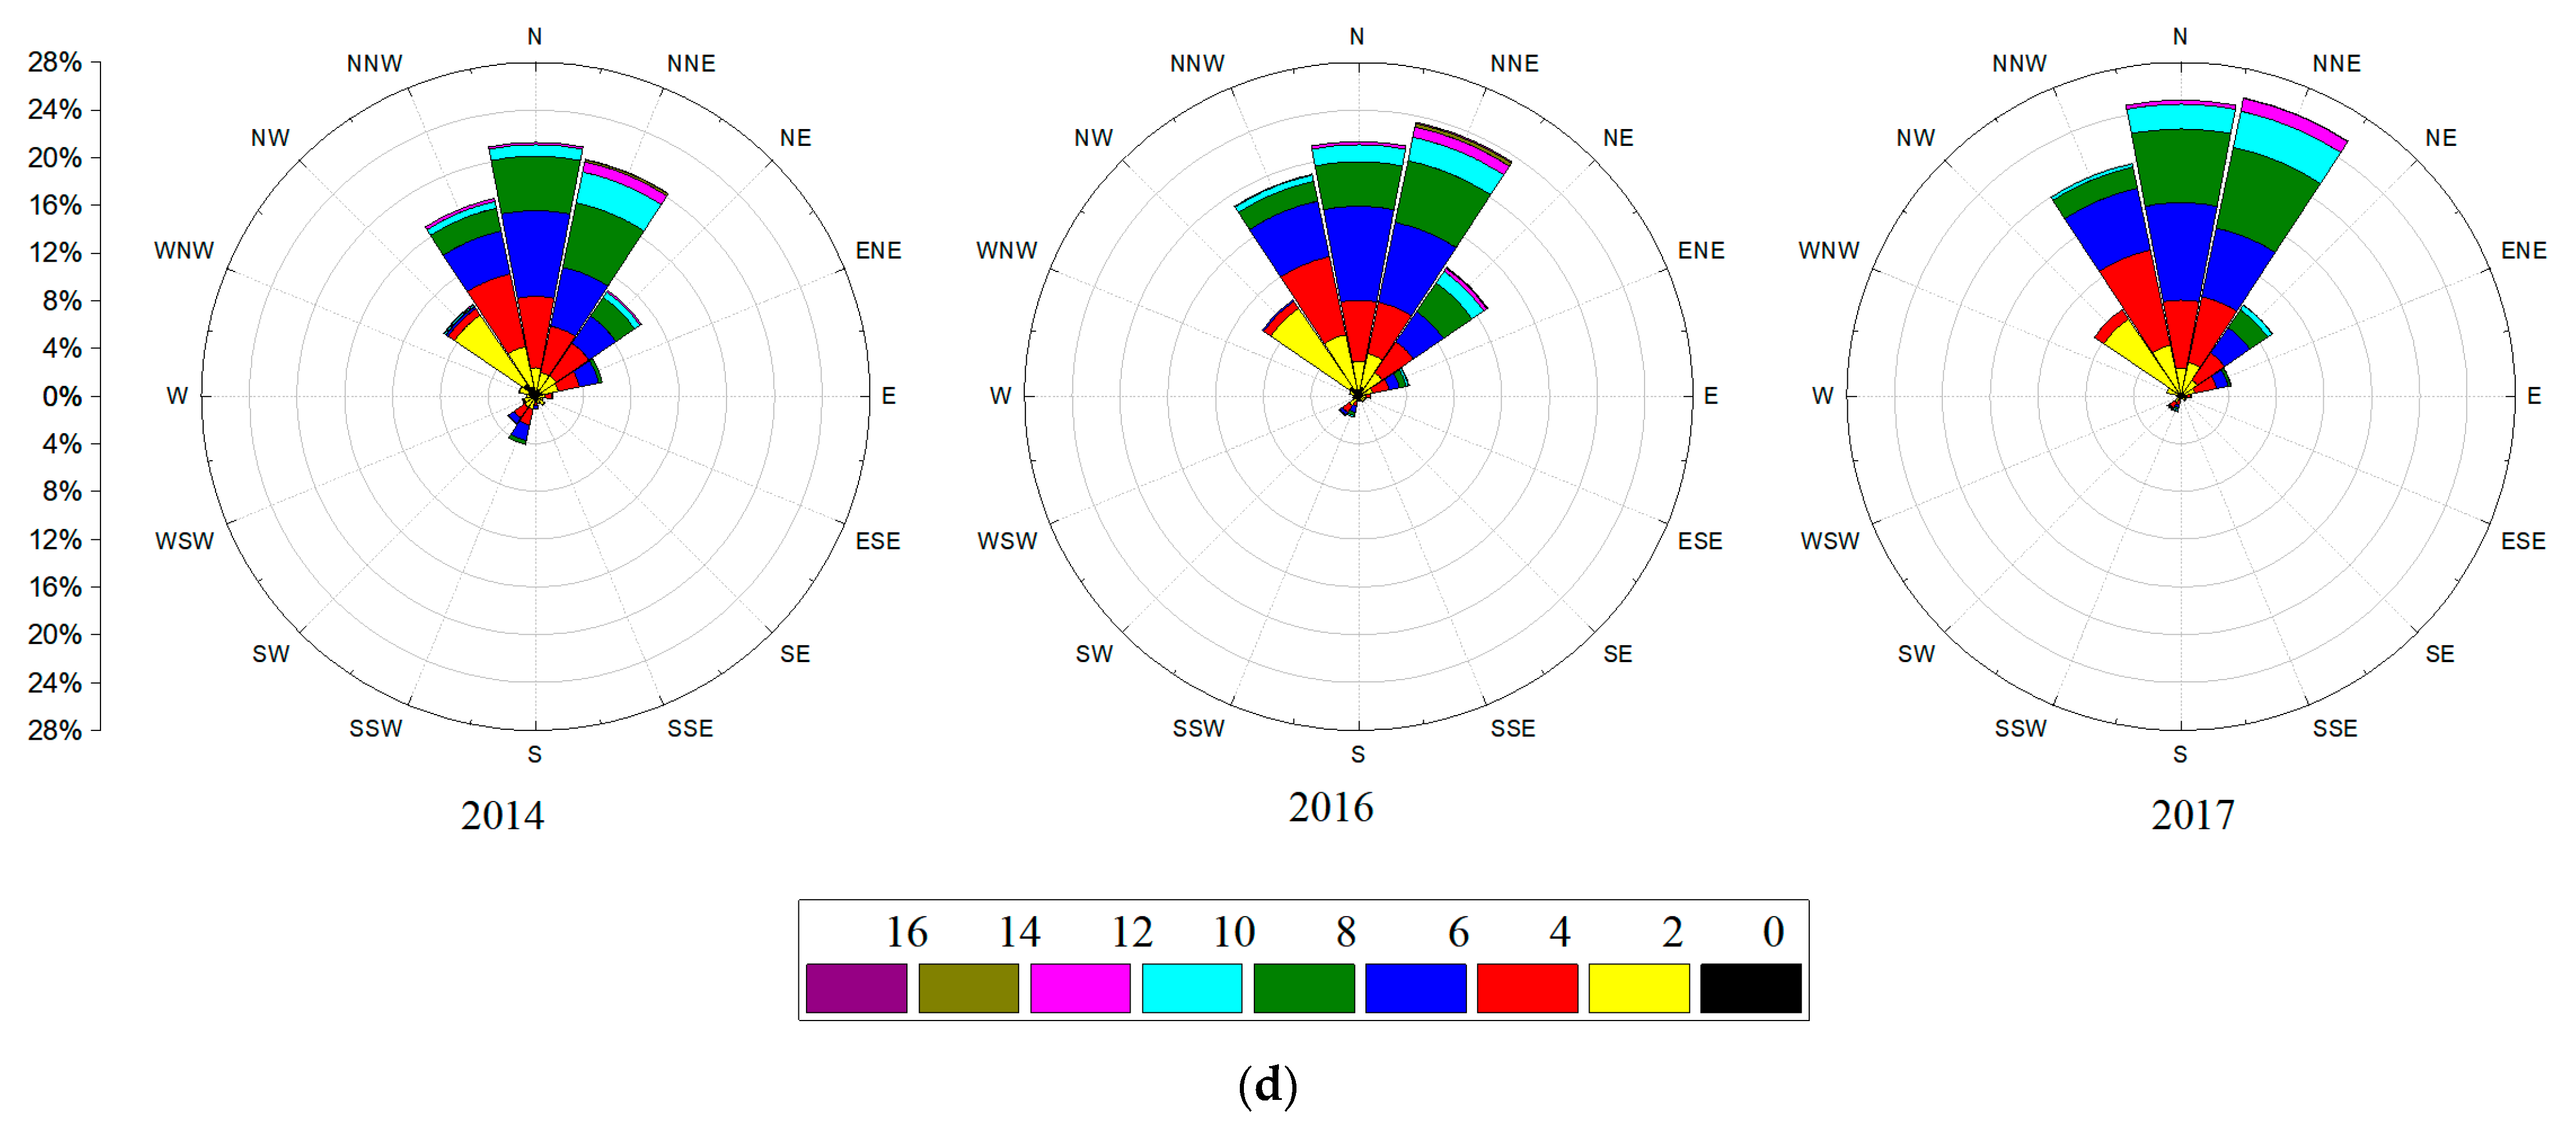
4.2. Wind Rose Diagram
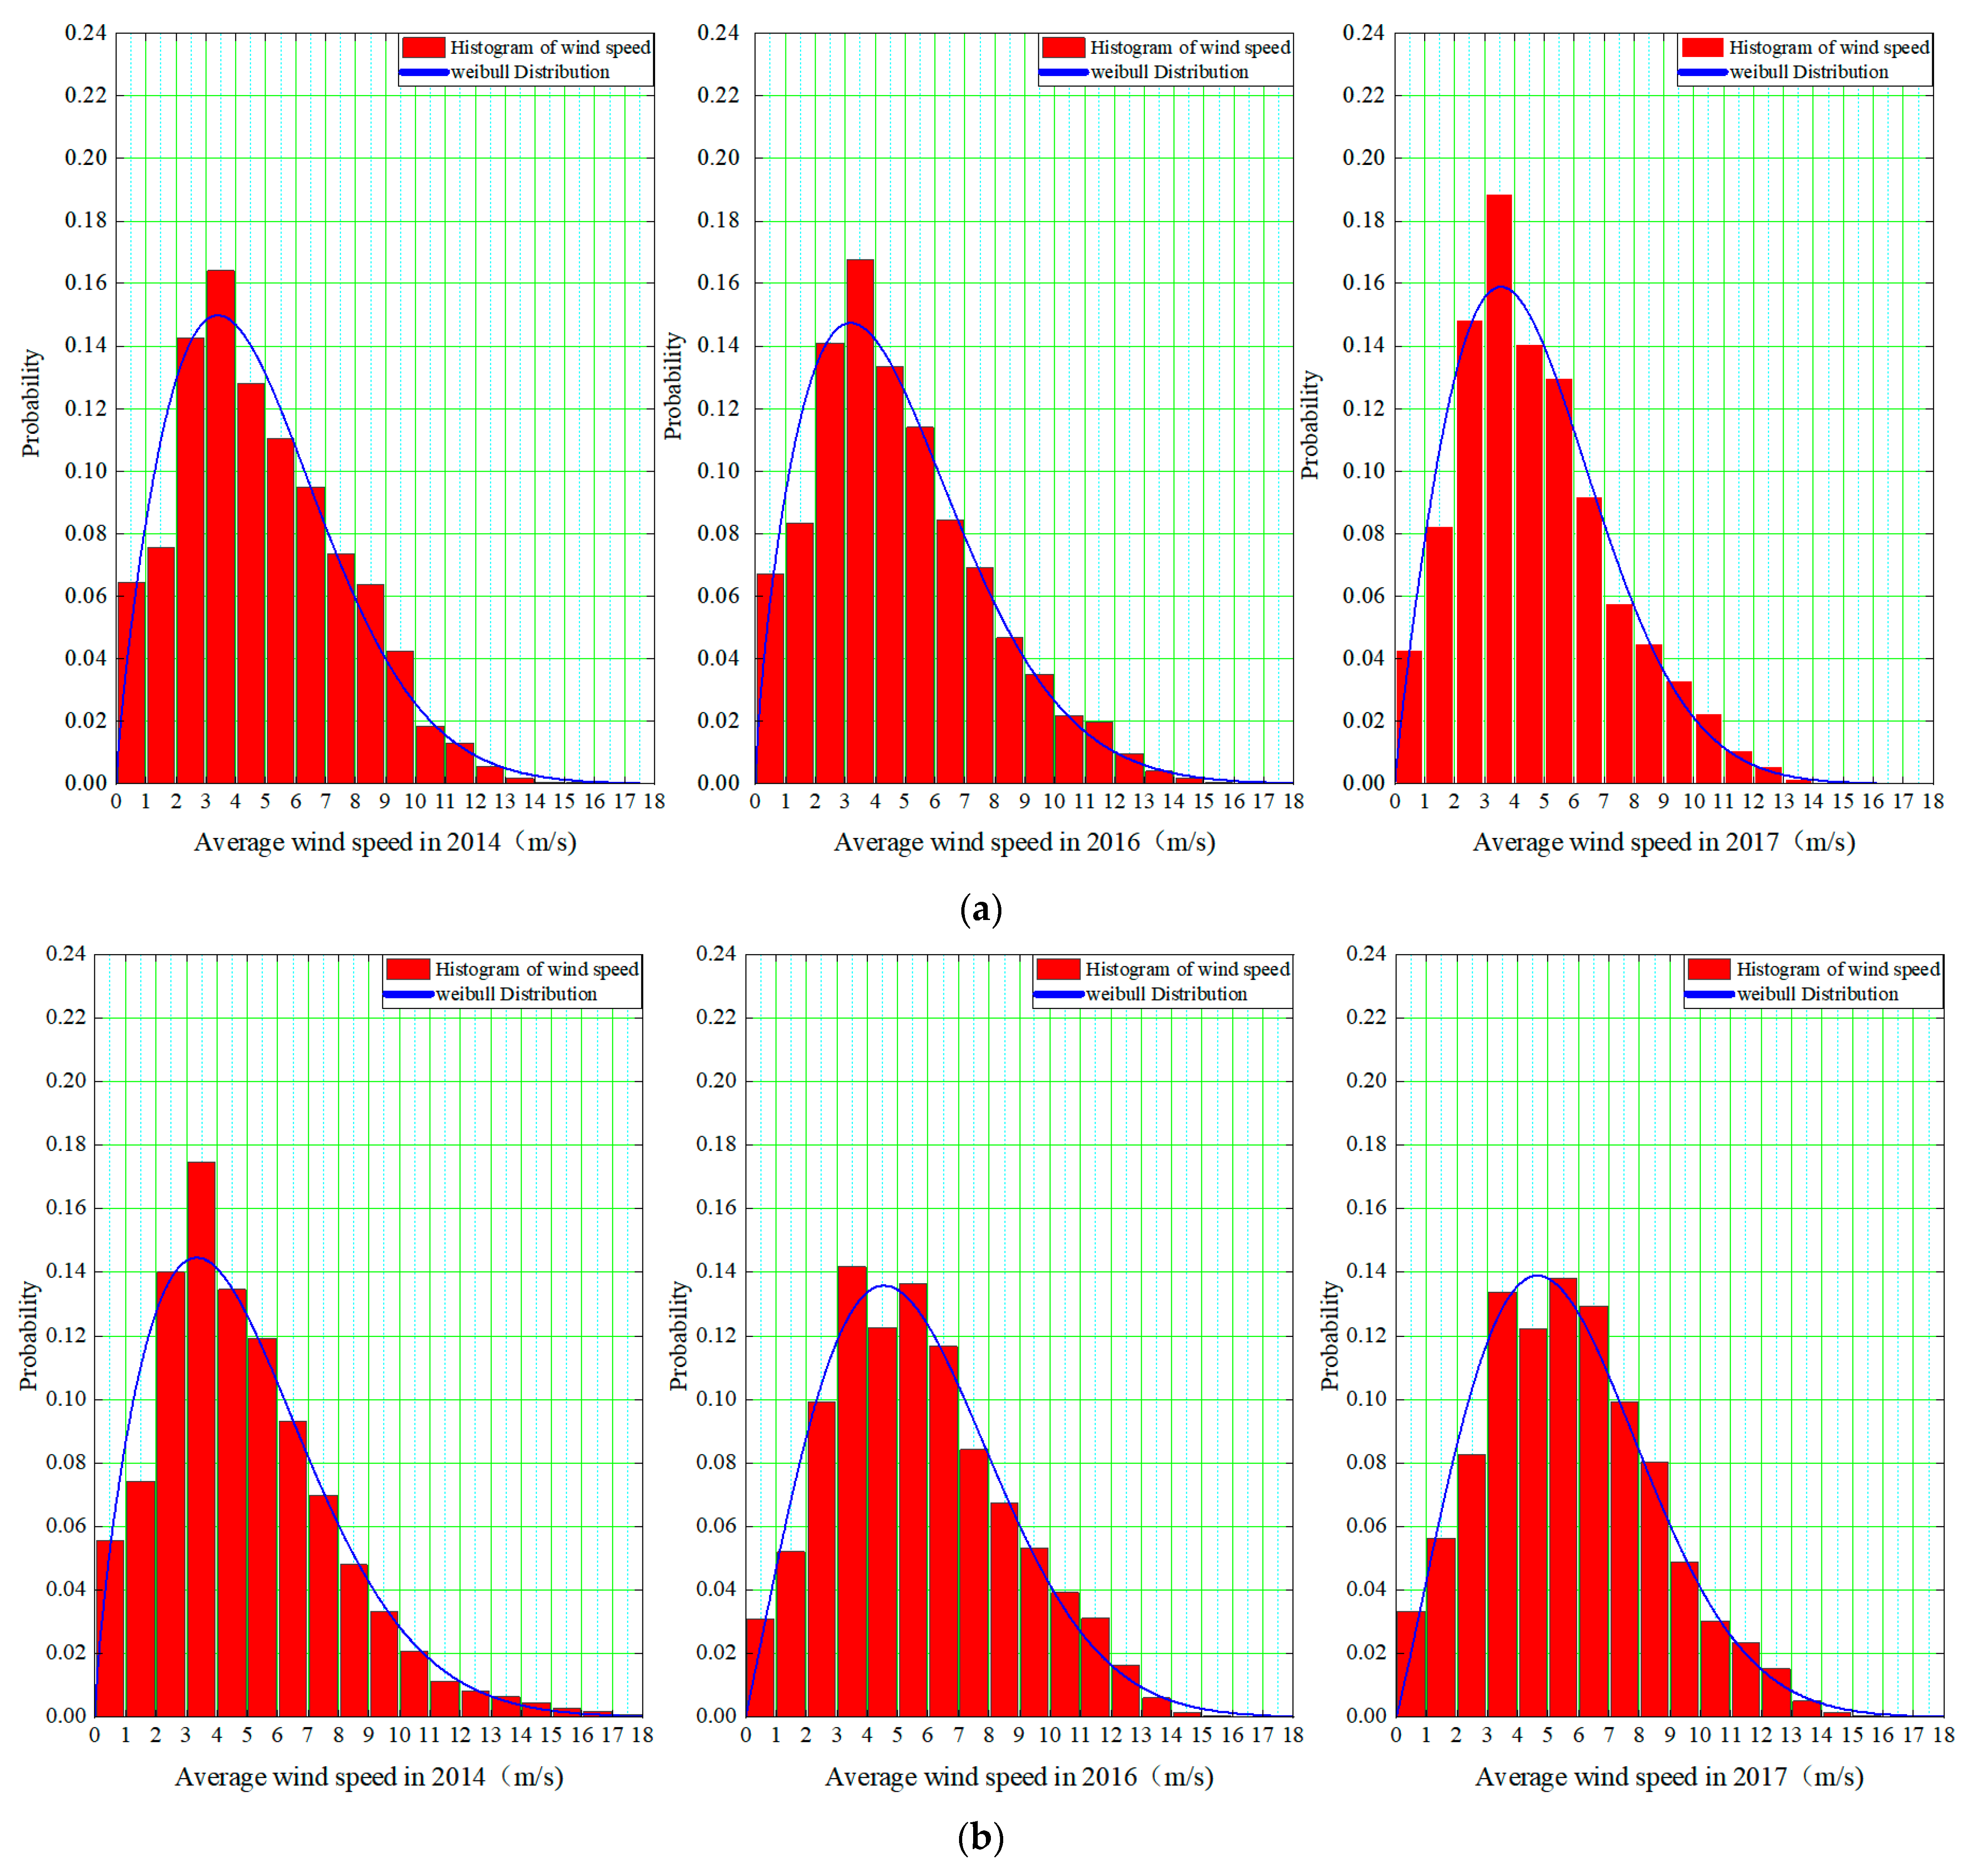
4.3. Weibull Parameters and Frequency Histogram
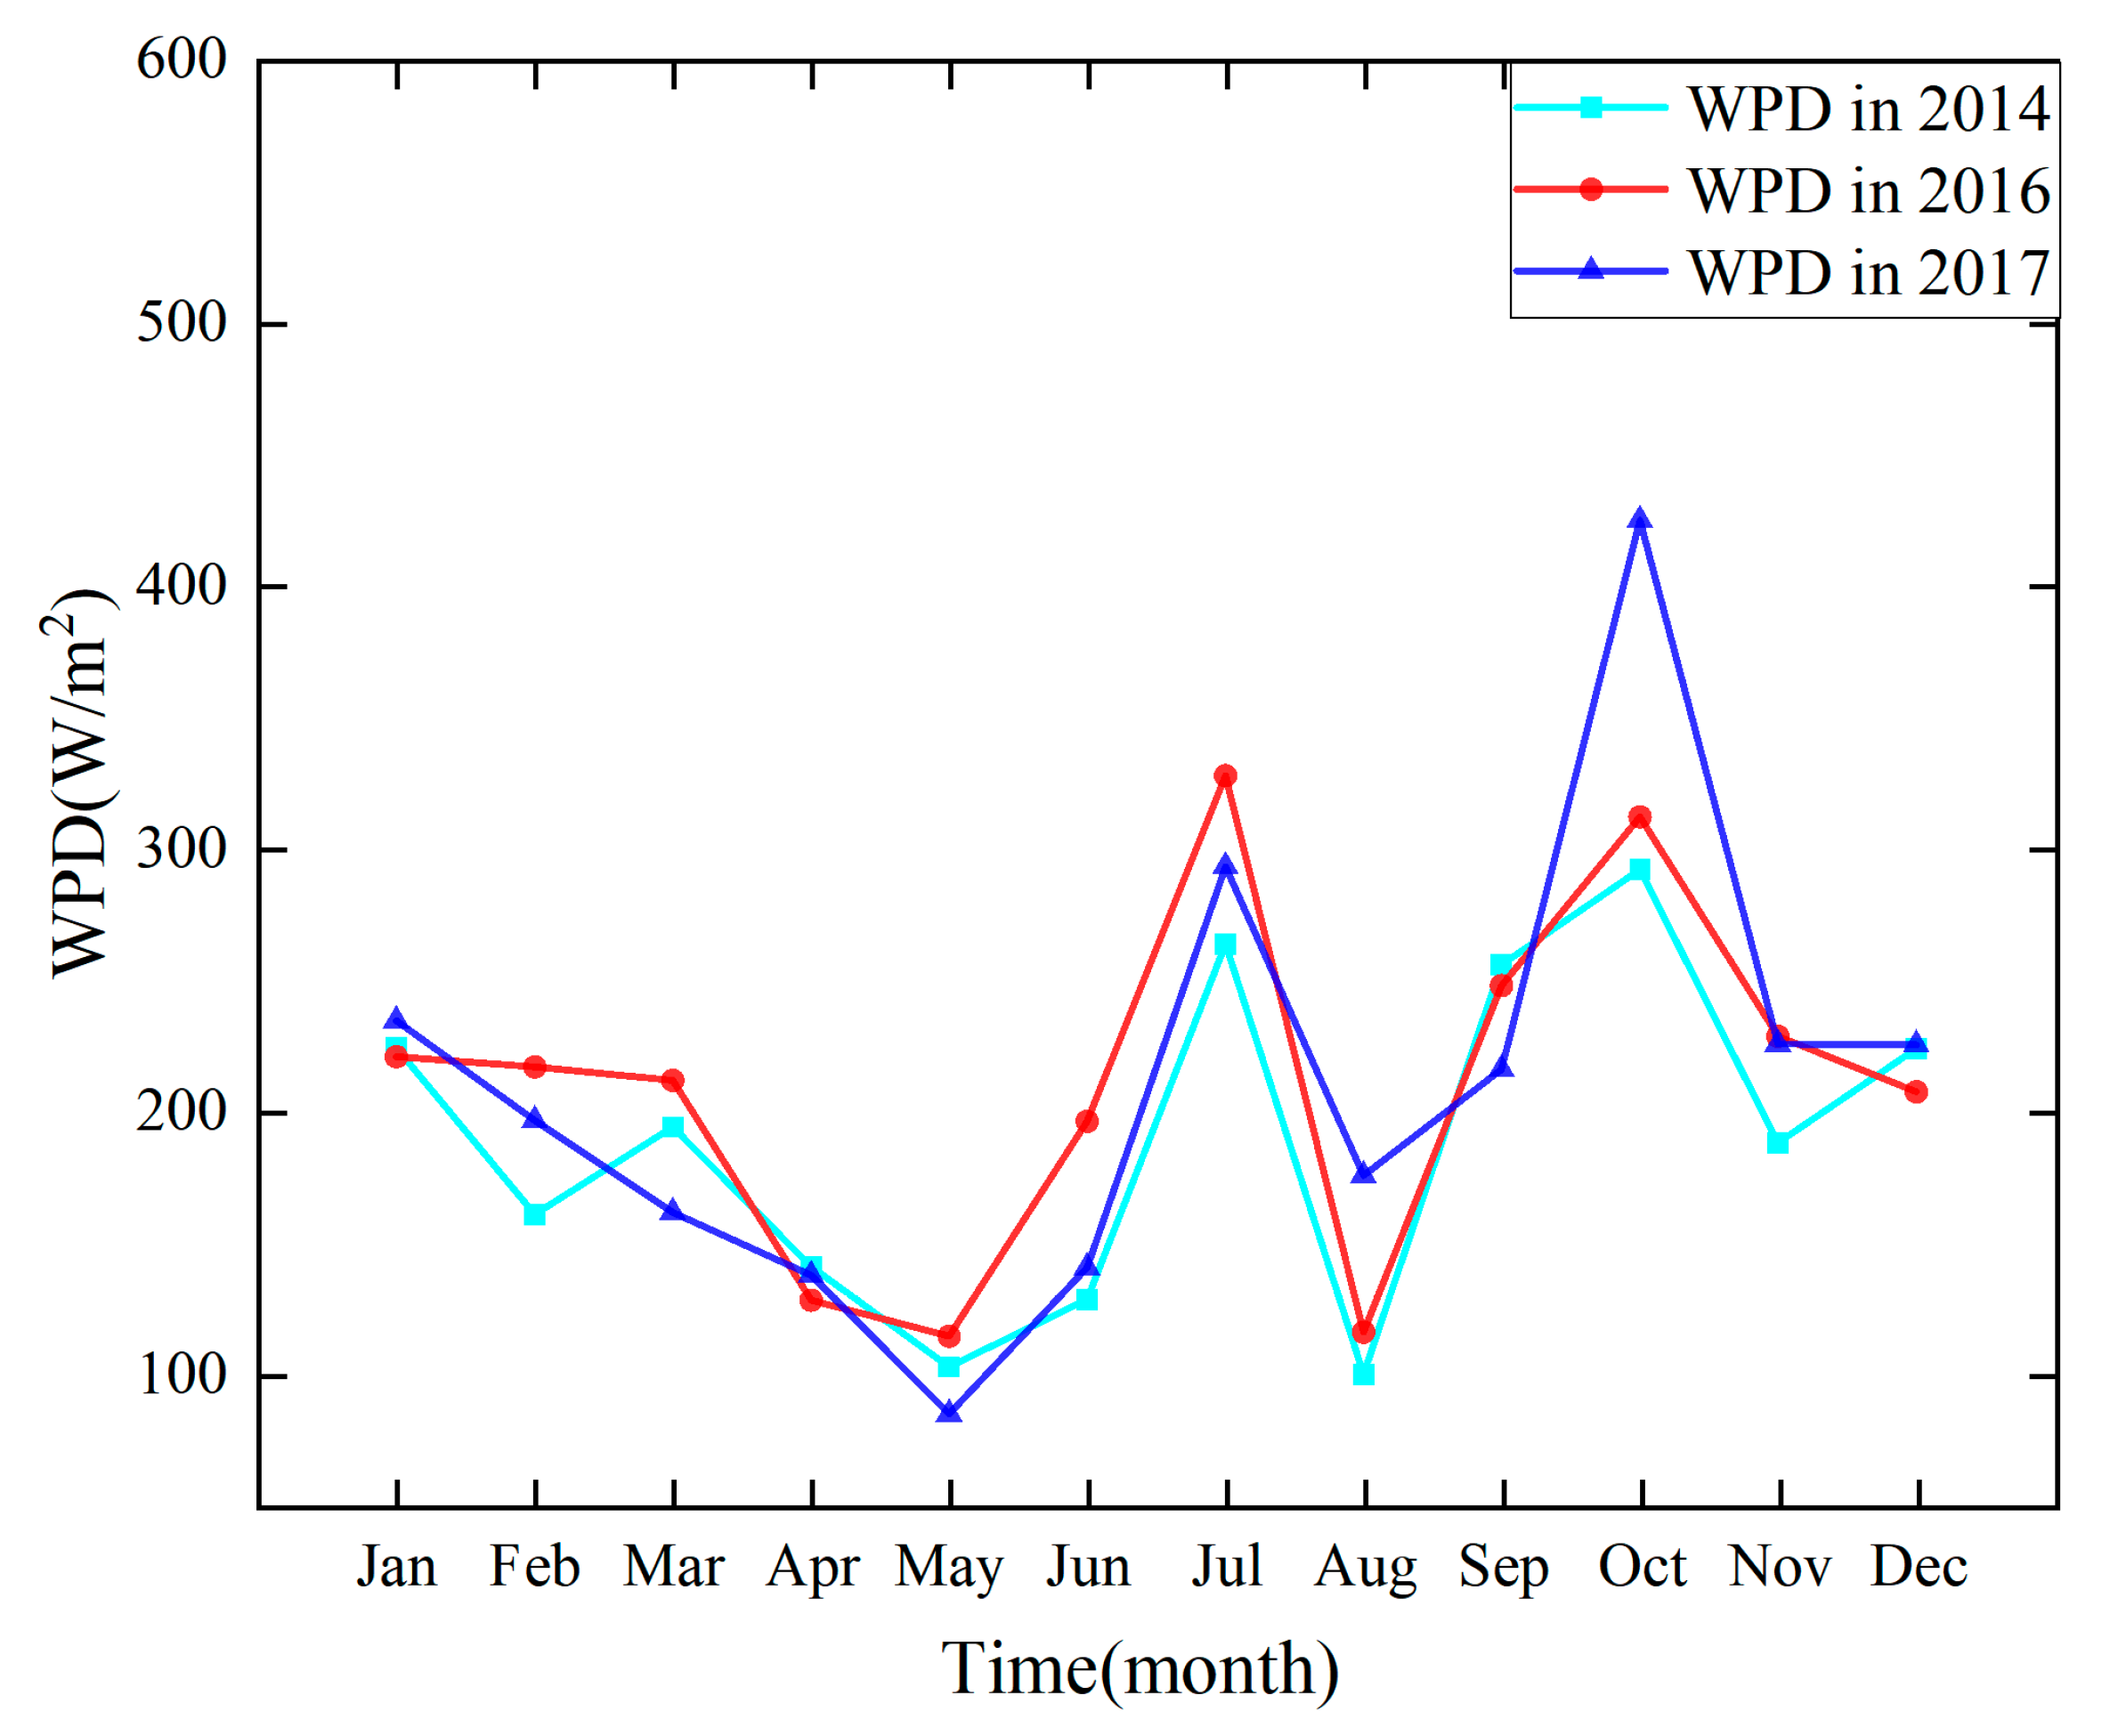
4.4. Wind Energy Density
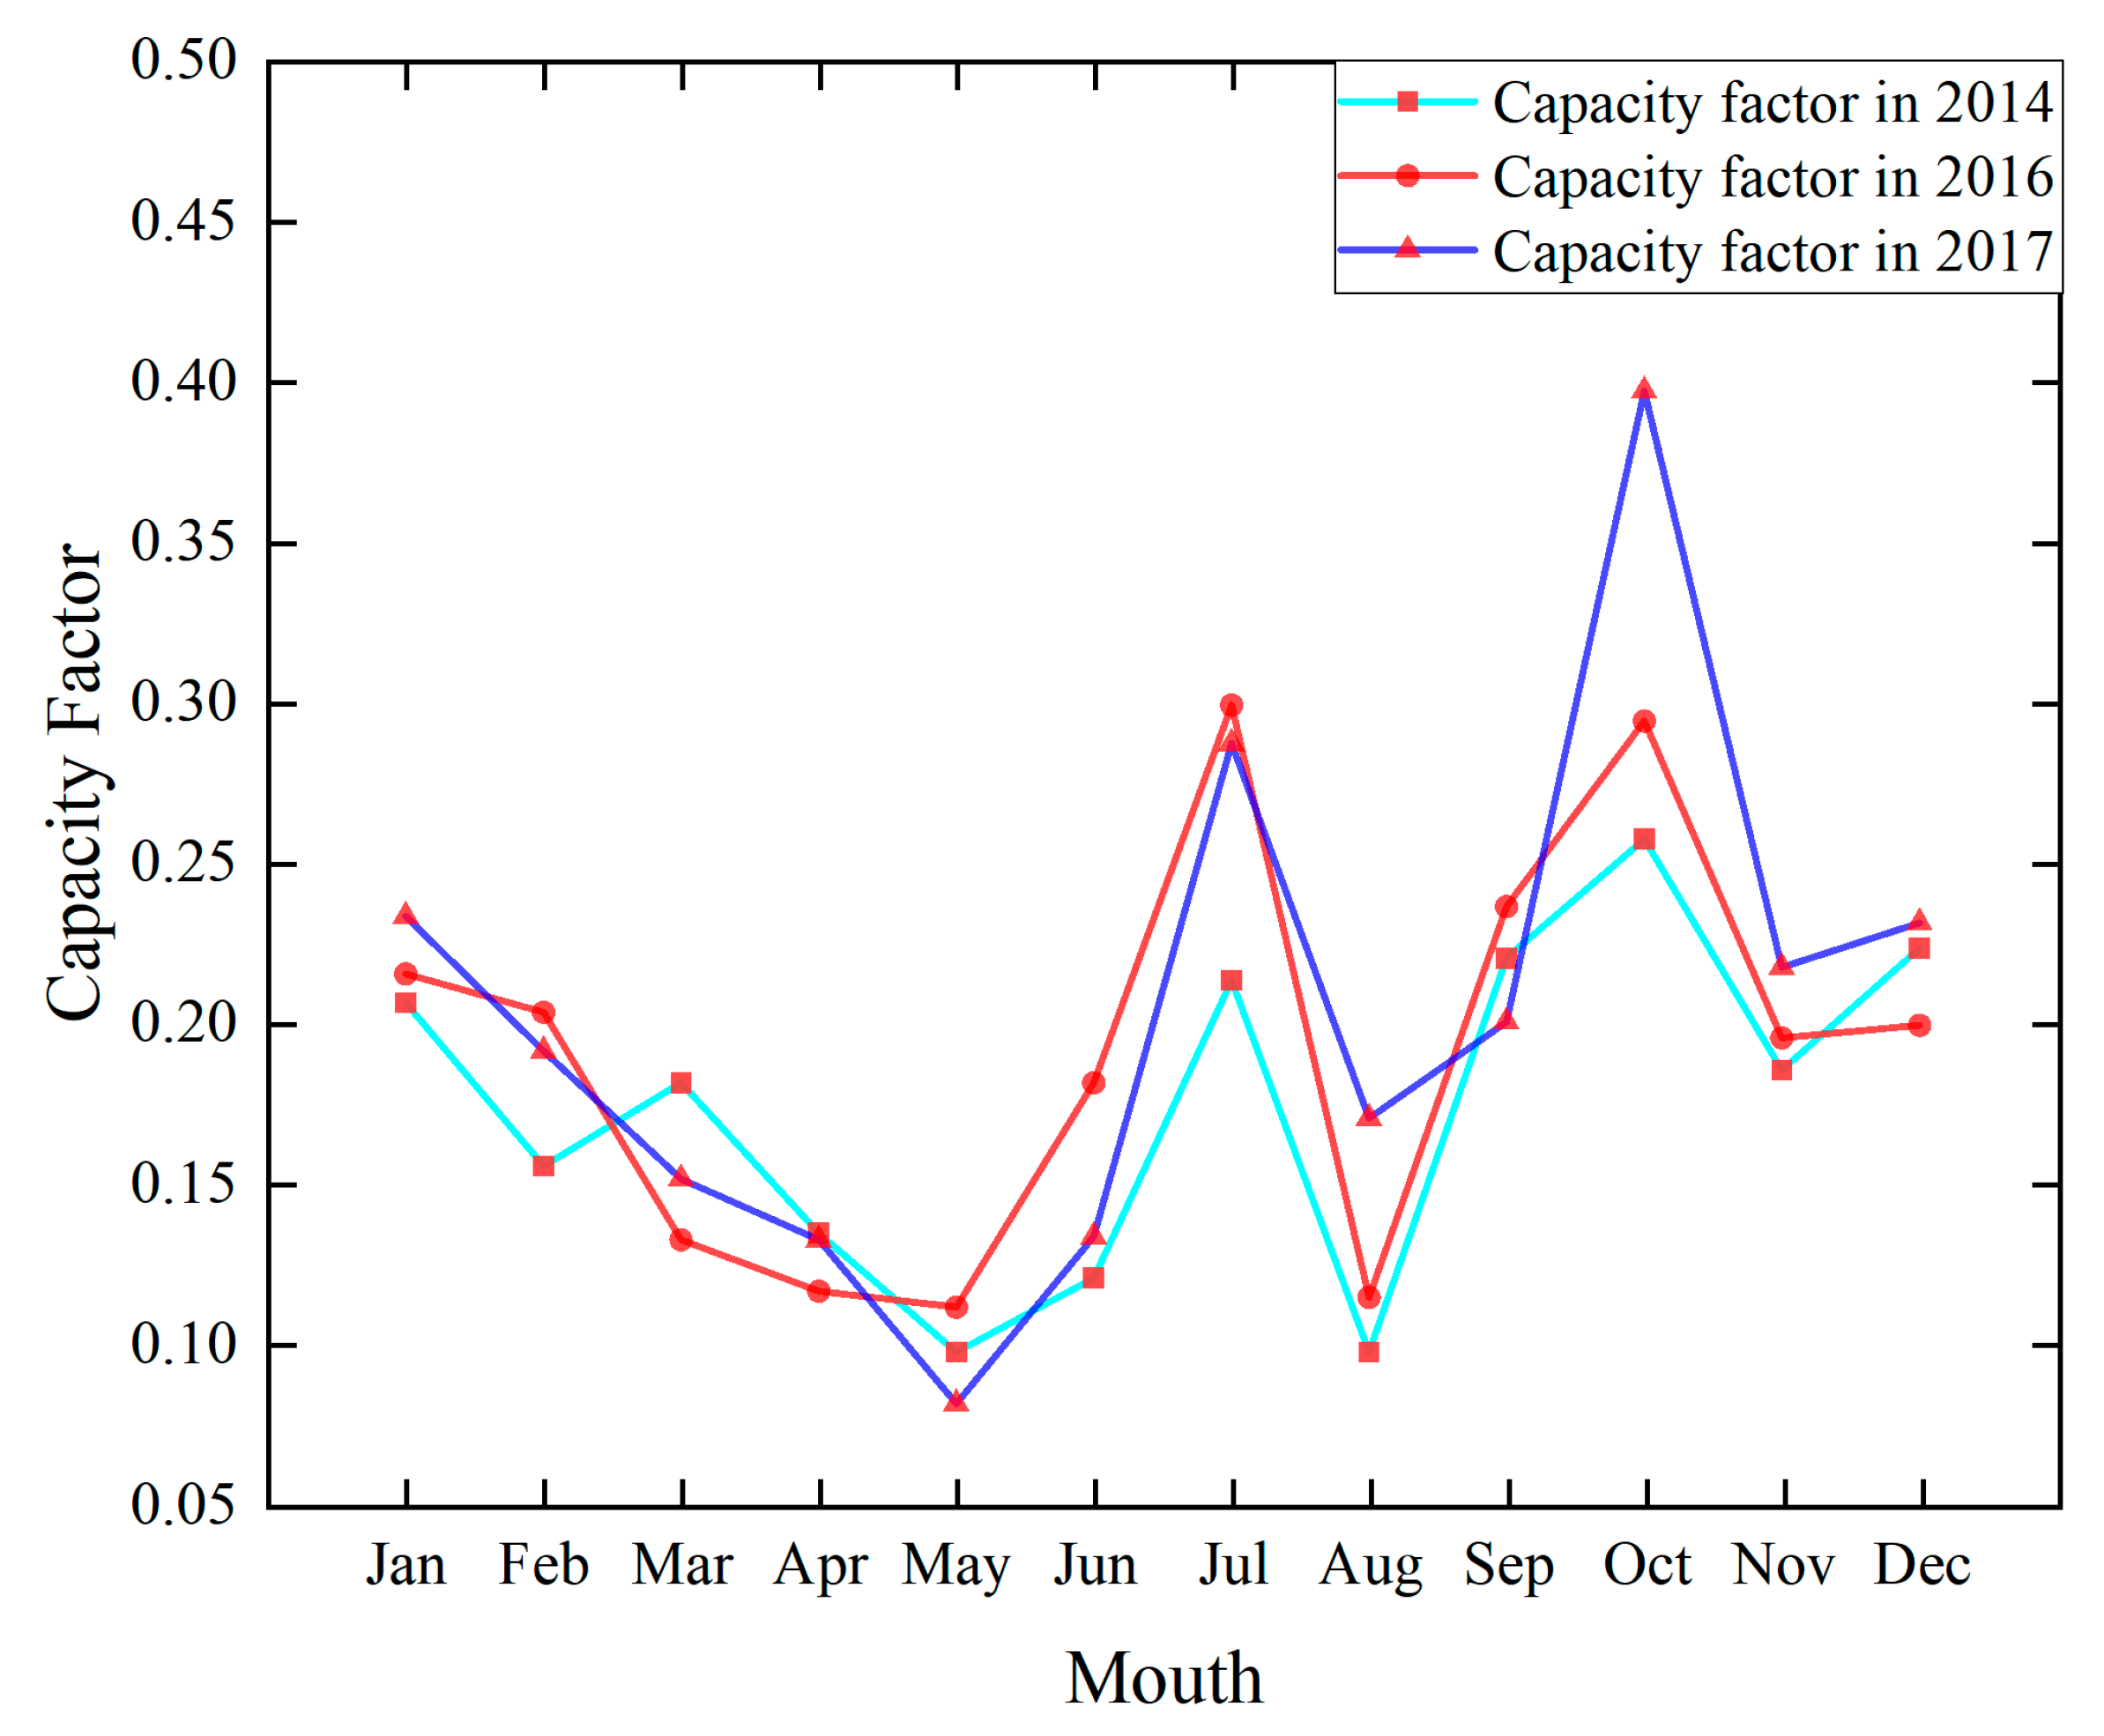
4.5. Capacity Factor
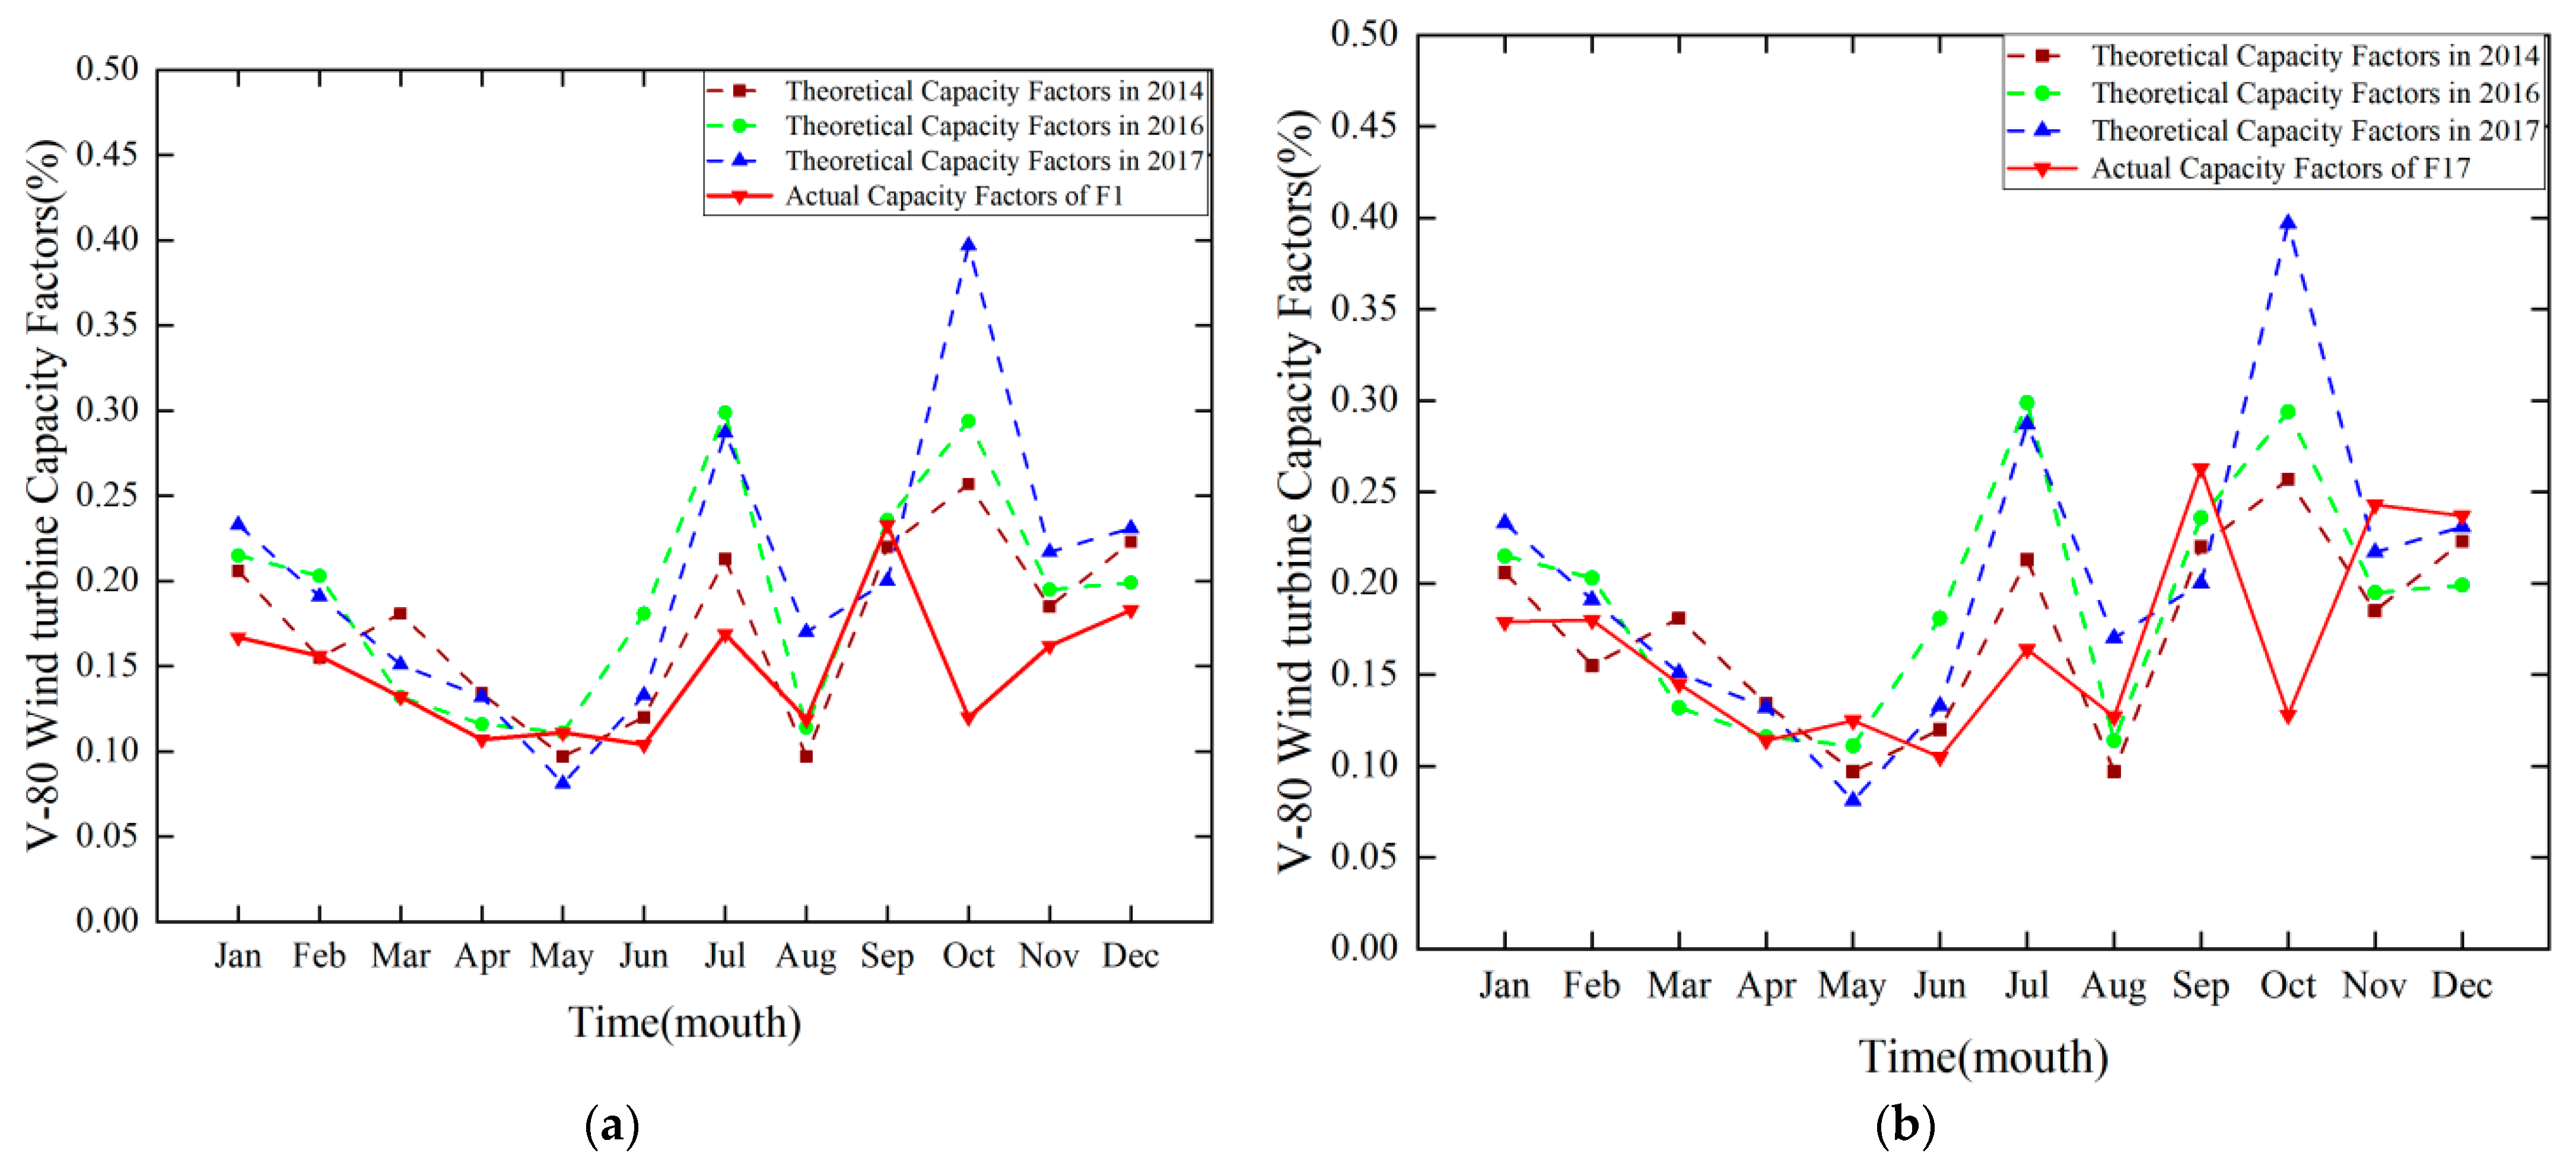
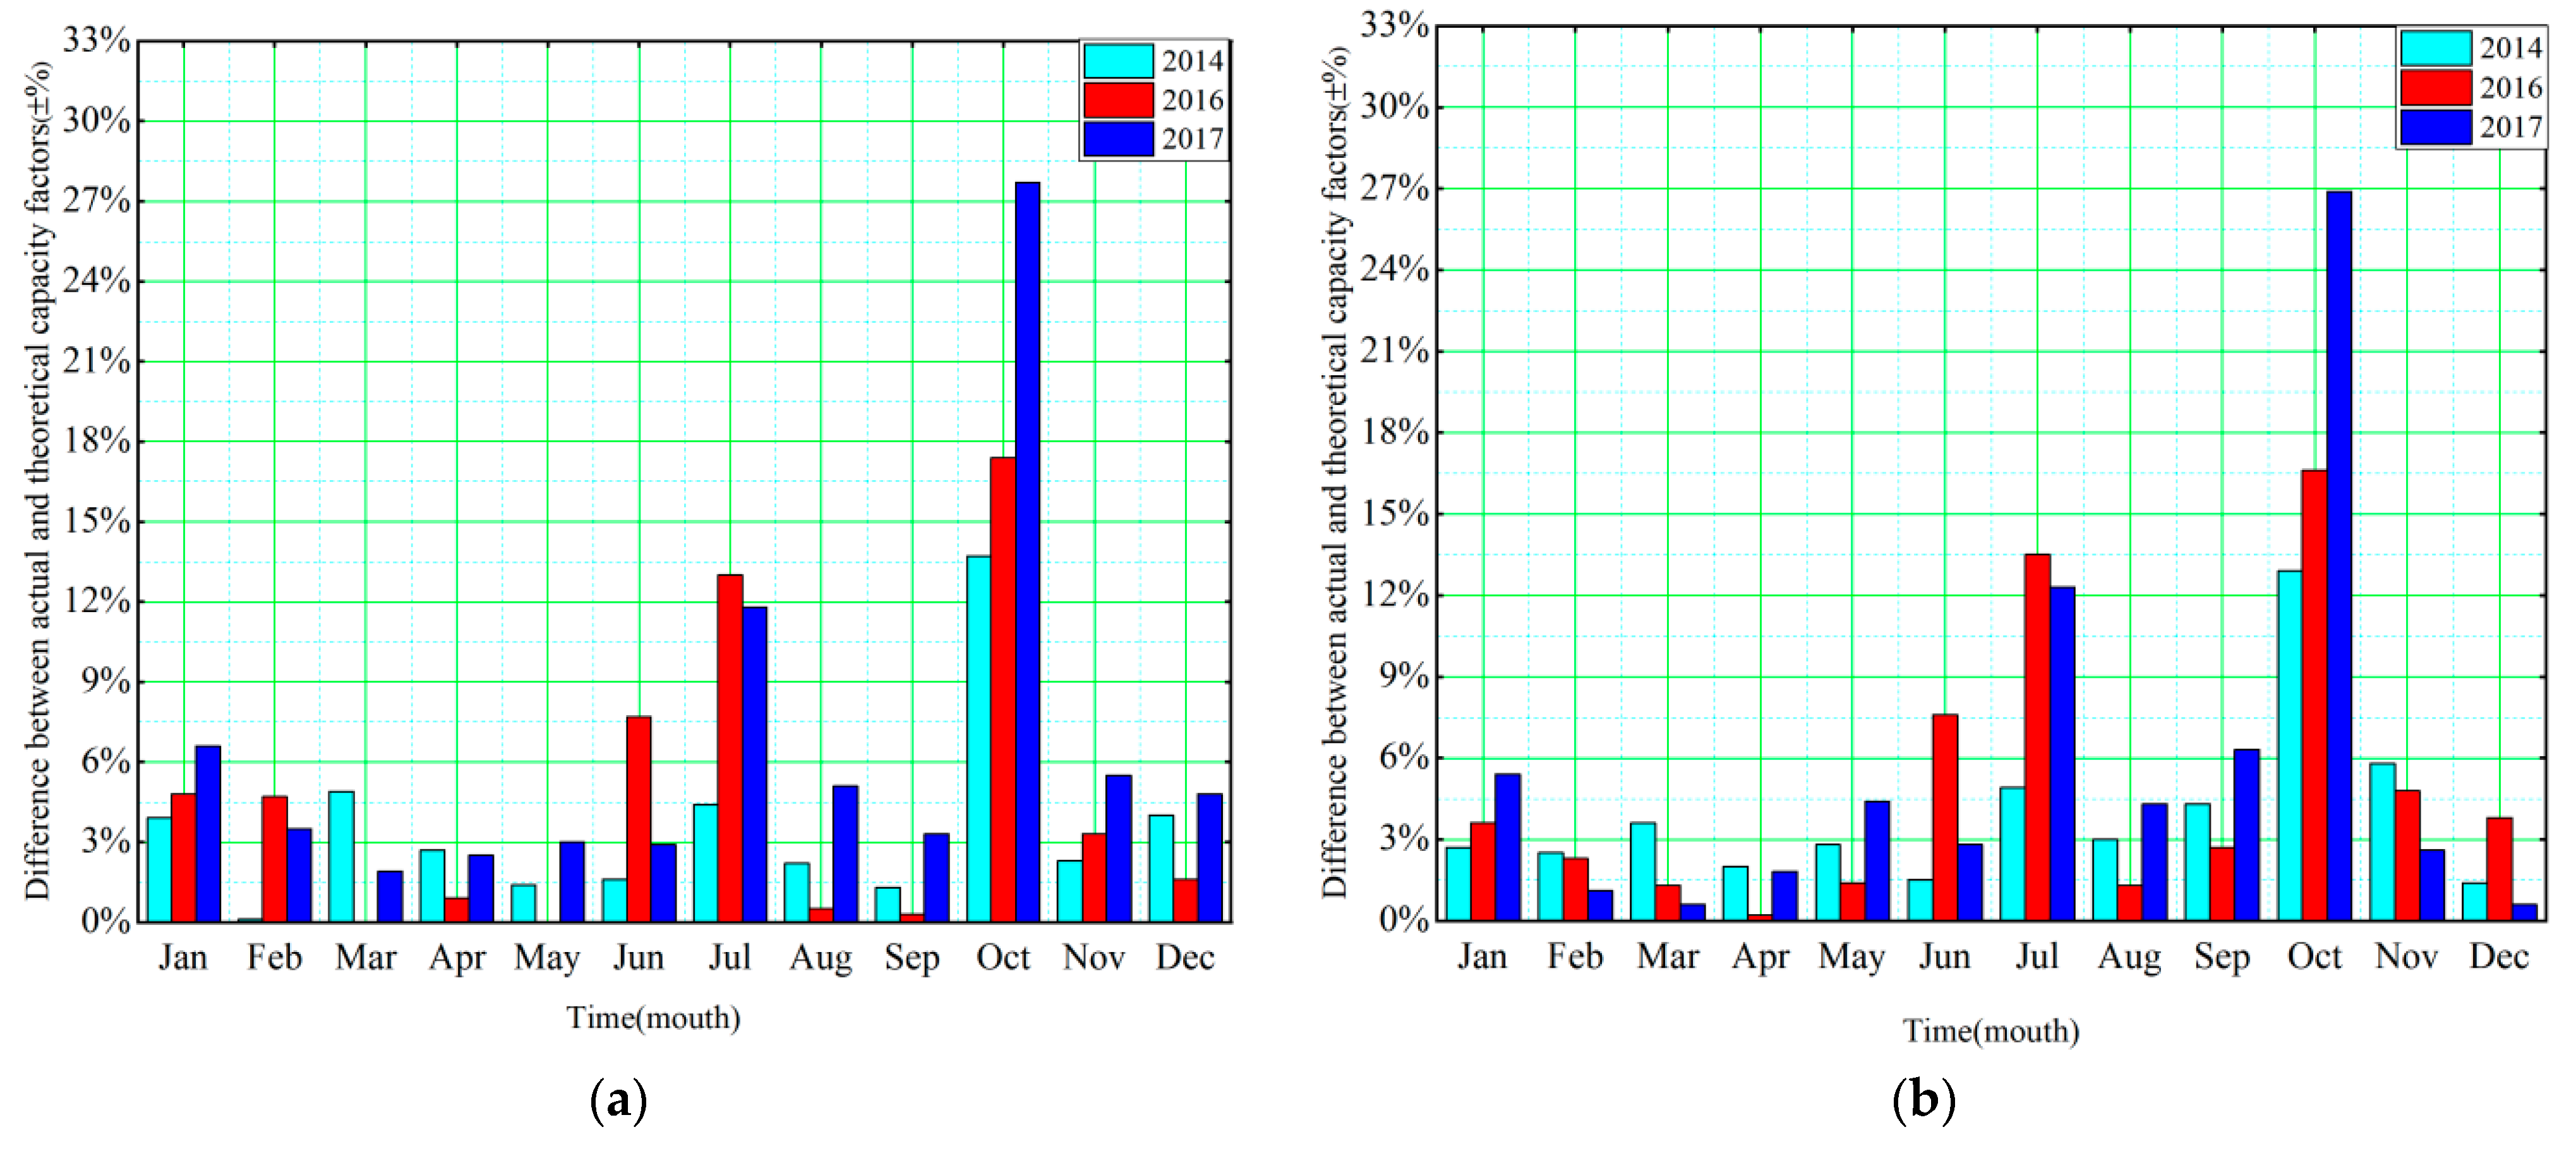
4.6. Comparison of Capacity Factors
5. Conclusions
- In terms of the characteristics of wind resources, the 3-year average monthly wind speed and wind energy density in the coastal areas of Zhejiang were basically the same. All indicators were higher in summer and autumn than in spring and winter, with obvious seasonal changes. The results also showed that the monthly average wind speed and wind energy density changed slightly in spring and winter, whereas they changed greatly in summer and autumn, especially in July and October. In this period, the maximum difference in monthly average wind speed was 1.46 times, and the maximum difference in monthly wind energy density was 1.5 times.
- The dominant wind directions during the same season in the 3 years were approximately the same, with obvious seasonal trends. The dominant wind direction in spring was northwesterly, while in summer, it was southwesterly, and in autumn and winter, it was northerly. Wind speed was higher in summer and lower in spring, and wind direction in summer was more concentrated than in other seasons.
- From the comparison of the capacity coefficient, it was deduced that the theoretical capacity coefficient was close to the actual capacity coefficient from January to June, August to September, and November to December, with an average difference of less than 9%, whereas a considerable gap existed between the theoretical and actual capacity coefficient in July and October, with an average difference of more than 9% and a maximum value of 28%. Combined with the monthly average wind speed, the variation in wind speed among different years was small when the monthly average wind speed was less than 6 m/s. In such a condition, the theoretical and actual capacity coefficients were extremely close, and the prediction was accurate. When the average wind speed in the current month was greater than 6 m/s, the variation range of wind speed in different years increased, the proximity between the theoretical and actual capacity coefficients decreased, and the accuracy of prediction also decreased.
Author Contributions
Funding
Institutional Review Board Statement
Informed Consent Statement
Data Availability Statement
Conflicts of Interest
References
- Wen, Y.; Kamranzad, B.; Lin, P. Assessment of long-term offshore wind energy potential in the south and southeast coasts of China based on a 55-year dataset. Energy 2021, 224, 120225. [Google Scholar] [CrossRef]
- Sawyer, S.; Teske, S.; Fried, L.; Shukla, S. Global Wind Energy Outlook; Global Wind Energy Council: Brussels, Belgium, 2016. [Google Scholar]
- Liang, Y.; Wu, C.; Ji, X.; Zhang, M.; Li, Y.; He, J.; Qin, Z. Estimation of the influences of spatiotemporal variations in air density on wind energy assessment in China based on deep neural network. Energy 2021, 239, 122210. [Google Scholar] [CrossRef]
- Vestas Leaves Competitors Trailing as Wind Industry Posts Another Record Year of Almost 100 Gigawatts. Available online: https://about.bnef.com/blog/vestas-leaves-competitors-trailing-as-wind-industry-posts-another-record-year-of-almost-100-gigawatts/ (accessed on 10 April 2022).
- Feng, J.; Feng, L.; Wang, J.; King, C.W. Evaluation of the onshore wind energy potential in mainland China—Based on GIS modeling and EROI analysis. Resour. Conserv. Recycl. 2019, 152, 104484. [Google Scholar] [CrossRef]
- Summary of China’s wind power industry operation in 2021 and industry trend forecast in 2022. Available online: https://baijiahao.baidu.com/s?id=1724303810359985333&wfr=spider&for=pc (accessed on 10 April 2022).
- Chen, X.; Foley, A.; Zhang, Z.; Wang, K.; O’Driscoll, K. An assessment of wind energy potential in the Beibu Gulf considering the energy demands of the Beibu Gulf Economic Rim. Renew. Sustain. Energy Rev. 2020, 119, 109605. [Google Scholar] [CrossRef]
- Shu, Z.; Li, Q.; Chan, P.W. Statistical analysis of wind characteristics and wind energy potential in Hong Kong. Energy Convers. Manag. 2015, 101, 644–657. [Google Scholar] [CrossRef]
- Emeksiz, C.; Demirci, B. The determination of offshore wind energy potential of Turkey by using novelty hybrid site selection method. Sustain. Energy Technol. Assess. 2019, 36, 100562. [Google Scholar] [CrossRef]
- Zhou, W.; Yang, H.; Fang, Z. Wind power potential and characteristic analysis of the Pearl River Delta region, China. Renew. Energy 2006, 31, 739–753. [Google Scholar] [CrossRef]
- Chen, X.; Wang, K.; Zhang, Z.; Zeng, Y.; Zhang, Y.; O’Driscoll, K. An assessment of wind and wave climate as potential sources of renewable energy in the nearshore Shenzhen coastal zone of the South China Sea. Energy 2017, 134, 789–801. [Google Scholar] [CrossRef] [Green Version]
- Deng, G.; Zhang, Z.; Li, Y.; Liu, H.; Xu, W.; Pan, Y. Prospective of development of large-scale tidal current turbine array: An example numerical investigation of Zhejiang, China. Appl. Energy 2020, 264, 114621. [Google Scholar] [CrossRef]
- Li, J.; Yu, X.B. Model and Procedures for Reliable near Term Wind Energy Production Forecast. Wind Eng. 2015, 39, 595–607. [Google Scholar] [CrossRef] [Green Version]
- Kang, S.; Khanjari, A.; You, S.; Lee, J.-H. Comparison of different statistical methods used to estimate Weibull parameters for wind speed contribution in nearby an offshore site, Republic of Korea. Energy Rep. 2021, 7, 7358–7373. [Google Scholar] [CrossRef]
- Safari, B.; Gasore, J. A statistical investigation of wind characteristics and wind energy potential based on the Weibull and Rayleigh models in Rwanda. Renew. Energy 2010, 35, 2874–2880. [Google Scholar] [CrossRef]
- Carta, J.; Ramírez, P.; Velázquez-Medina, S. A review of wind speed probability distributions used in wind energy analysis: Case studies in the Canary Islands. Renew. Sustain. Energy Rev. 2009, 13, 933–955. [Google Scholar] [CrossRef]
- Saleh, H.; Abou El-Azm Aly, A.; Abdel-Hady, S.M. Assessment of different methods used to estimate Weibull distribution parameters for wind speed in Zafarana wind farm, Suez Gulf, Egypt. Energy 2012, 44, 710–719. [Google Scholar] [CrossRef]
- Manwell, J.F.; McGowan, J.G.; Rogers, A.L. Book Review: Wind Energy Explained: Theory, Design and Application; John Wiley & Sons: Chichester, UK, 2006; Volume 30, pp. 169–170. [Google Scholar] [CrossRef]
- Li, J.; Yu, X.B. LiDAR technology for wind energy potential assessment: Demonstration and validation at a site around Lake Erie. Energy Convers. Manag. 2017, 144, 252–261. [Google Scholar] [CrossRef] [Green Version]
- Gomes, M.S.D.S.; de Paiva, J.M.F.; Moris, V.A.D.S.; Nunes, A.O. Proposal of a methodology to use offshore wind energy on the southeast coast of Brazil. Energy 2019, 185, 327–336. [Google Scholar] [CrossRef]
- Chang, T.P.C. Performance comparison of six numerical methods in estimating Weibull parameters for wind energy application. Appl. Energy 2011, 88, 272–282. [Google Scholar] [CrossRef]
- Usta, I.; Arik, I.; Yenilmez, I.; Kantar, Y.M. A new estimation approach based on moments for estimating Weibull parameters in wind power applications. Energy Convers. Manag. 2018, 164, 570–578. [Google Scholar] [CrossRef]
- Mohammadi, K.; Alavi, O.; Mostafaeipour, A.; Goudarzi, N.; Jalilvand, M. Assessing different parameters estimation methods of Weibull distribution to compute wind power density. Energy Convers. Manag. 2016, 108, 322–335. [Google Scholar] [CrossRef]
- Aukitino, T.; Khan, M.; Ahmed, M.R. Wind energy resource assessment for Kiribati with a comparison of different methods of determining Weibull parameters. Energy Convers. Manag. 2017, 151, 641–660. [Google Scholar] [CrossRef]
- Saeed, M.K.; Salam, A.; Rehman, A.U. Comparison of six different methods of Weibull distribution for wind power assessment: A case study for a site in the Northern region of Pakistan. Sustain. Energy Technol. Assess. 2019, 36, 100541. [Google Scholar] [CrossRef]
- Tizgui, I.; El Guezar, F.; Bouzahir, H.; Benaid, B. Comparison of methods in estimating Weibull parameters for wind energy applications. Int. J. Energy Sect. Manag. 2017, 11, 650–663. [Google Scholar] [CrossRef]
- Ouahabi, M.H.; Elkhachine, H.; Benabdelouahab, F.; Khamlichi, A. Comparative study of five different methods of adjustment by the Weibull model to determine the most accurate method of analyzing annual variations of wind energy in Tetouan—Morocco. Procedia Manuf. 2020, 46, 698–707. [Google Scholar] [CrossRef]
- Sumair, M.; Aized, T.; Bhutta, M.M.A.; Siddiqui, F.A.; Tehreem, L.; Chaudhry, A. Method of Four Moments Mixture-A new approach for parametric estimation of Weibull Probability Distribution for wind potential estimation applications. Renew. Energy 2022, 191, 291–304. [Google Scholar] [CrossRef]
- Wan, J.; Zheng, F.; Luan, H.; Tian, Y.; Li, L.; Ma, Z.; Xu, Z.; Li, Y. Assessment of wind energy resources in the urat area using optimized weibull distribution. Sustain. Energy Technol. Assess. 2021, 47, 101351. [Google Scholar] [CrossRef]
- Saeed, M.A.; Ahmed, Z.; Yang, J.; Zhang, W. An optimal approach of wind power assessment using Chebyshev metric for determining the Weibull distribution parameters. Sustain. Energy Technol. Assess. 2019, 37, 100612. [Google Scholar] [CrossRef]
- Li, J.; Yu, X.B. Onshore and offshore wind energy potential assessment near Lake Erie shoreline: A spatial and temporal analysis. Energy 2018, 147, 1092–1107. [Google Scholar] [CrossRef]
- Khahro, S.F.; Tabbassum, K.; Soomro, A.M.; Dong, L.; Liao, X. Evaluation of wind power production prospective and Weibull parameter estimation methods for Babaurband, Sindh Pakistan. Energy Convers. Manag. 2014, 78, 956–967. [Google Scholar] [CrossRef]
- Carreno-Madinabeitia, S.; Ibarra-Berastegi, G.; Sáenz, J.; Ulazia, A. Long-term changes in offshore wind power density and wind turbine capacity factor in the Iberian Peninsula (1900–2010). Energy 2021, 226, 120364. [Google Scholar] [CrossRef]
- Chen, H.; Anfinsen, S.N.; Birkelund, Y.; Yuan, F. Probability distributions for wind speed volatility characteristics: A case study of Northern Norway. Energy Rep. 2021, 7, 248–255. [Google Scholar] [CrossRef]
- Akdağ, S.A.; Dinler, A. A new method to estimate Weibull parameters for wind energy applications. Energy Convers. Manag. 2009, 50, 1761–1766. [Google Scholar] [CrossRef]
- Guarienti, J.A.; Almeida, A.K.; Neto, A.M.; Ferreira, A.R.D.O.; Ottonelli, J.P.; de Almeida, I.K. Performance analysis of numerical methods for determining Weibull distribution parameters applied to wind speed in Mato Grosso do Sul, Brazil. Sustain. Energy Technol. Assess. 2020, 42, 100854. [Google Scholar] [CrossRef]
- Mahmood, F.H.; Resen, A.; Khamees, A.B. Wind characteristic analysis based on Weibull distribution of Al-Salman site, Iraq. Energy Rep. 2019, 6, 79–87. [Google Scholar] [CrossRef]
- Miao, H.; Dong, D.; Huang, G.; Hu, K.; Tian, Q.; Gong, Y. Evaluation of Northern Hemisphere surface wind speed and wind power density in multiple reanalysis datasets. Energy 2020, 200, 117382. [Google Scholar] [CrossRef]
- Li, Y.; Wu, X.-P.; Li, Q.-S.; Tee, K.F. Assessment of onshore wind energy potential under different geographical climate conditions in China. Energy 2018, 152, 498–511. [Google Scholar] [CrossRef]
- Quan, P.; Leephakpreeda, T. Assessment of wind energy potential for selecting wind turbines: An application to Thailand. Sustain. Energy Technol. Assess. 2015, 11, 17–26. [Google Scholar] [CrossRef]
- Wilkie, D.; Galasso, C. A Bayesian model for wind farm capacity factors. Energy Convers. Manag. 2021, 252, 114950. [Google Scholar] [CrossRef]


| Project Name | Project Scale | Total Project Investment (Unit: Ten Thousand RMB) | Planned Construction Duration |
|---|---|---|---|
| National Xiangshan No. 1 Offshore Wind Farm | Installed capacity: 0.2542 GW | 429,518 | 2020–2022 |
| Huaneng Cangnan No. 4 Offshore Wind Power Project | Installed capacity: 0.2542 GW | 872,150 | 2020–2024 |
| Huarun Cangnan No. 1 Offshore Wind Power Project | Installed capacity: 0.4 GW | 620,000 | 2020–2023 |
| Huaneng Jiaxing Offshore Wind Power Project | Installed capacity: 0.402 GW | 531,400 | 2019–2022 |
| Zheneng Jiaxing No. 1 Offshore Wind Power Project | Installed capacity: 0.3 GW | 558,225 | 2019–2021 |
| Huadian Yuhuan No. 1 Offshore Wind Farm | Installed capacity: 0.3 GW | 505,747 | 2019–2022 |
| CSIC Haizhuang Xiangshan Offshore Wind Power Project | Installed capacity: 1.2 GW | 1,020,000 | 2020–2023 |
| Performance | Description |
|---|---|
| Model | Vestas® V80 |
| Rated power | 2000 KW |
| Number of blades | 3 |
| Rotor diameter | 80 m |
| Cut-in wind speed | 3.5 m/s |
| Cut-out wind speed | 25 m/s |
| Rated wind speed | 13 m/s |
| Hub height | 67 m |
| Site Location | Year | Time | Weibull Shape Factor K | Weibull Scale Factor C |
|---|---|---|---|---|
| 28°25′18.08″ N 121°36′18.29″ E | 2014 | Spring | 1.79 | 5.36 |
| Summer | 1.73 | 5.46 | ||
| Autumn | 2.02 | 6.67 | ||
| Winter | 2.14 | 6.39 | ||
| 2016 | Spring | 1.71 | 5.32 | |
| Summer | 2.02 | 6.37 | ||
| Autumn | 2.12 | 6.95 | ||
| Winter | 2.19 | 6.55 | ||
| 2017 | Spring | 1.91 | 5.24 | |
| Summer | 2.09 | 6.53 | ||
| Autumn | 2.28 | 7.33 | ||
| Winter | 2.48 | 6.81 |
| Type | Month | Day of Operation in 2019 | Capacity Factor in 2019 |
|---|---|---|---|
| F1 | January | 22 | 0.167 |
| February | 21 | 0.156 | |
| March | 18 | 0.132 | |
| April | 16 | 0.107 | |
| May | 15 | 0.111 | |
| June | 15 | 0.104 | |
| July | 20 | 0.169 | |
| August | 16 | 0.119 | |
| September | 24 | 0.233 | |
| October | 20 | 0.120 | |
| November | 17 | 0.162 | |
| December | 25 | 0.183 | |
| F17 | January | 20 | 0.179 |
| February | 20 | 0.180 | |
| March | 20 | 0.145 | |
| April | 16 | 0.114 | |
| May | 17 | 0.125 | |
| June | 15 | 0.105 | |
| July | 20 | 0.164 | |
| August | 18 | 0.127 | |
| September | 25 | 0.263 | |
| October | 20 | 0.128 | |
| November | 23 | 0.243 | |
| December | 24 | 0.237 |
Publisher’s Note: MDPI stays neutral with regard to jurisdictional claims in published maps and institutional affiliations. |
© 2022 by the authors. Licensee MDPI, Basel, Switzerland. This article is an open access article distributed under the terms and conditions of the Creative Commons Attribution (CC BY) license (https://creativecommons.org/licenses/by/4.0/).
Share and Cite
Fan, G.; Wang, Y.; Yang, B.; Zhang, C.; Fu, B.; Qi, Q. Characteristics of Wind Resources and Post-Project Evaluation of Wind Farms in Coastal Areas of Zhejiang. Energies 2022, 15, 3351. https://doi.org/10.3390/en15093351
Fan G, Wang Y, Yang B, Zhang C, Fu B, Qi Q. Characteristics of Wind Resources and Post-Project Evaluation of Wind Farms in Coastal Areas of Zhejiang. Energies. 2022; 15(9):3351. https://doi.org/10.3390/en15093351
Chicago/Turabian StyleFan, Guangyu, Yanru Wang, Bo Yang, Chuanxiong Zhang, Bin Fu, and Qianqian Qi. 2022. "Characteristics of Wind Resources and Post-Project Evaluation of Wind Farms in Coastal Areas of Zhejiang" Energies 15, no. 9: 3351. https://doi.org/10.3390/en15093351
APA StyleFan, G., Wang, Y., Yang, B., Zhang, C., Fu, B., & Qi, Q. (2022). Characteristics of Wind Resources and Post-Project Evaluation of Wind Farms in Coastal Areas of Zhejiang. Energies, 15(9), 3351. https://doi.org/10.3390/en15093351