
A Novel Artificial Intelligence Maximum Power Point Tracking Technique for Integrated PV-WT-FC Frameworks

 ,
,  , , ,
, , ,  and
and 
Abstract
:1. Introduction
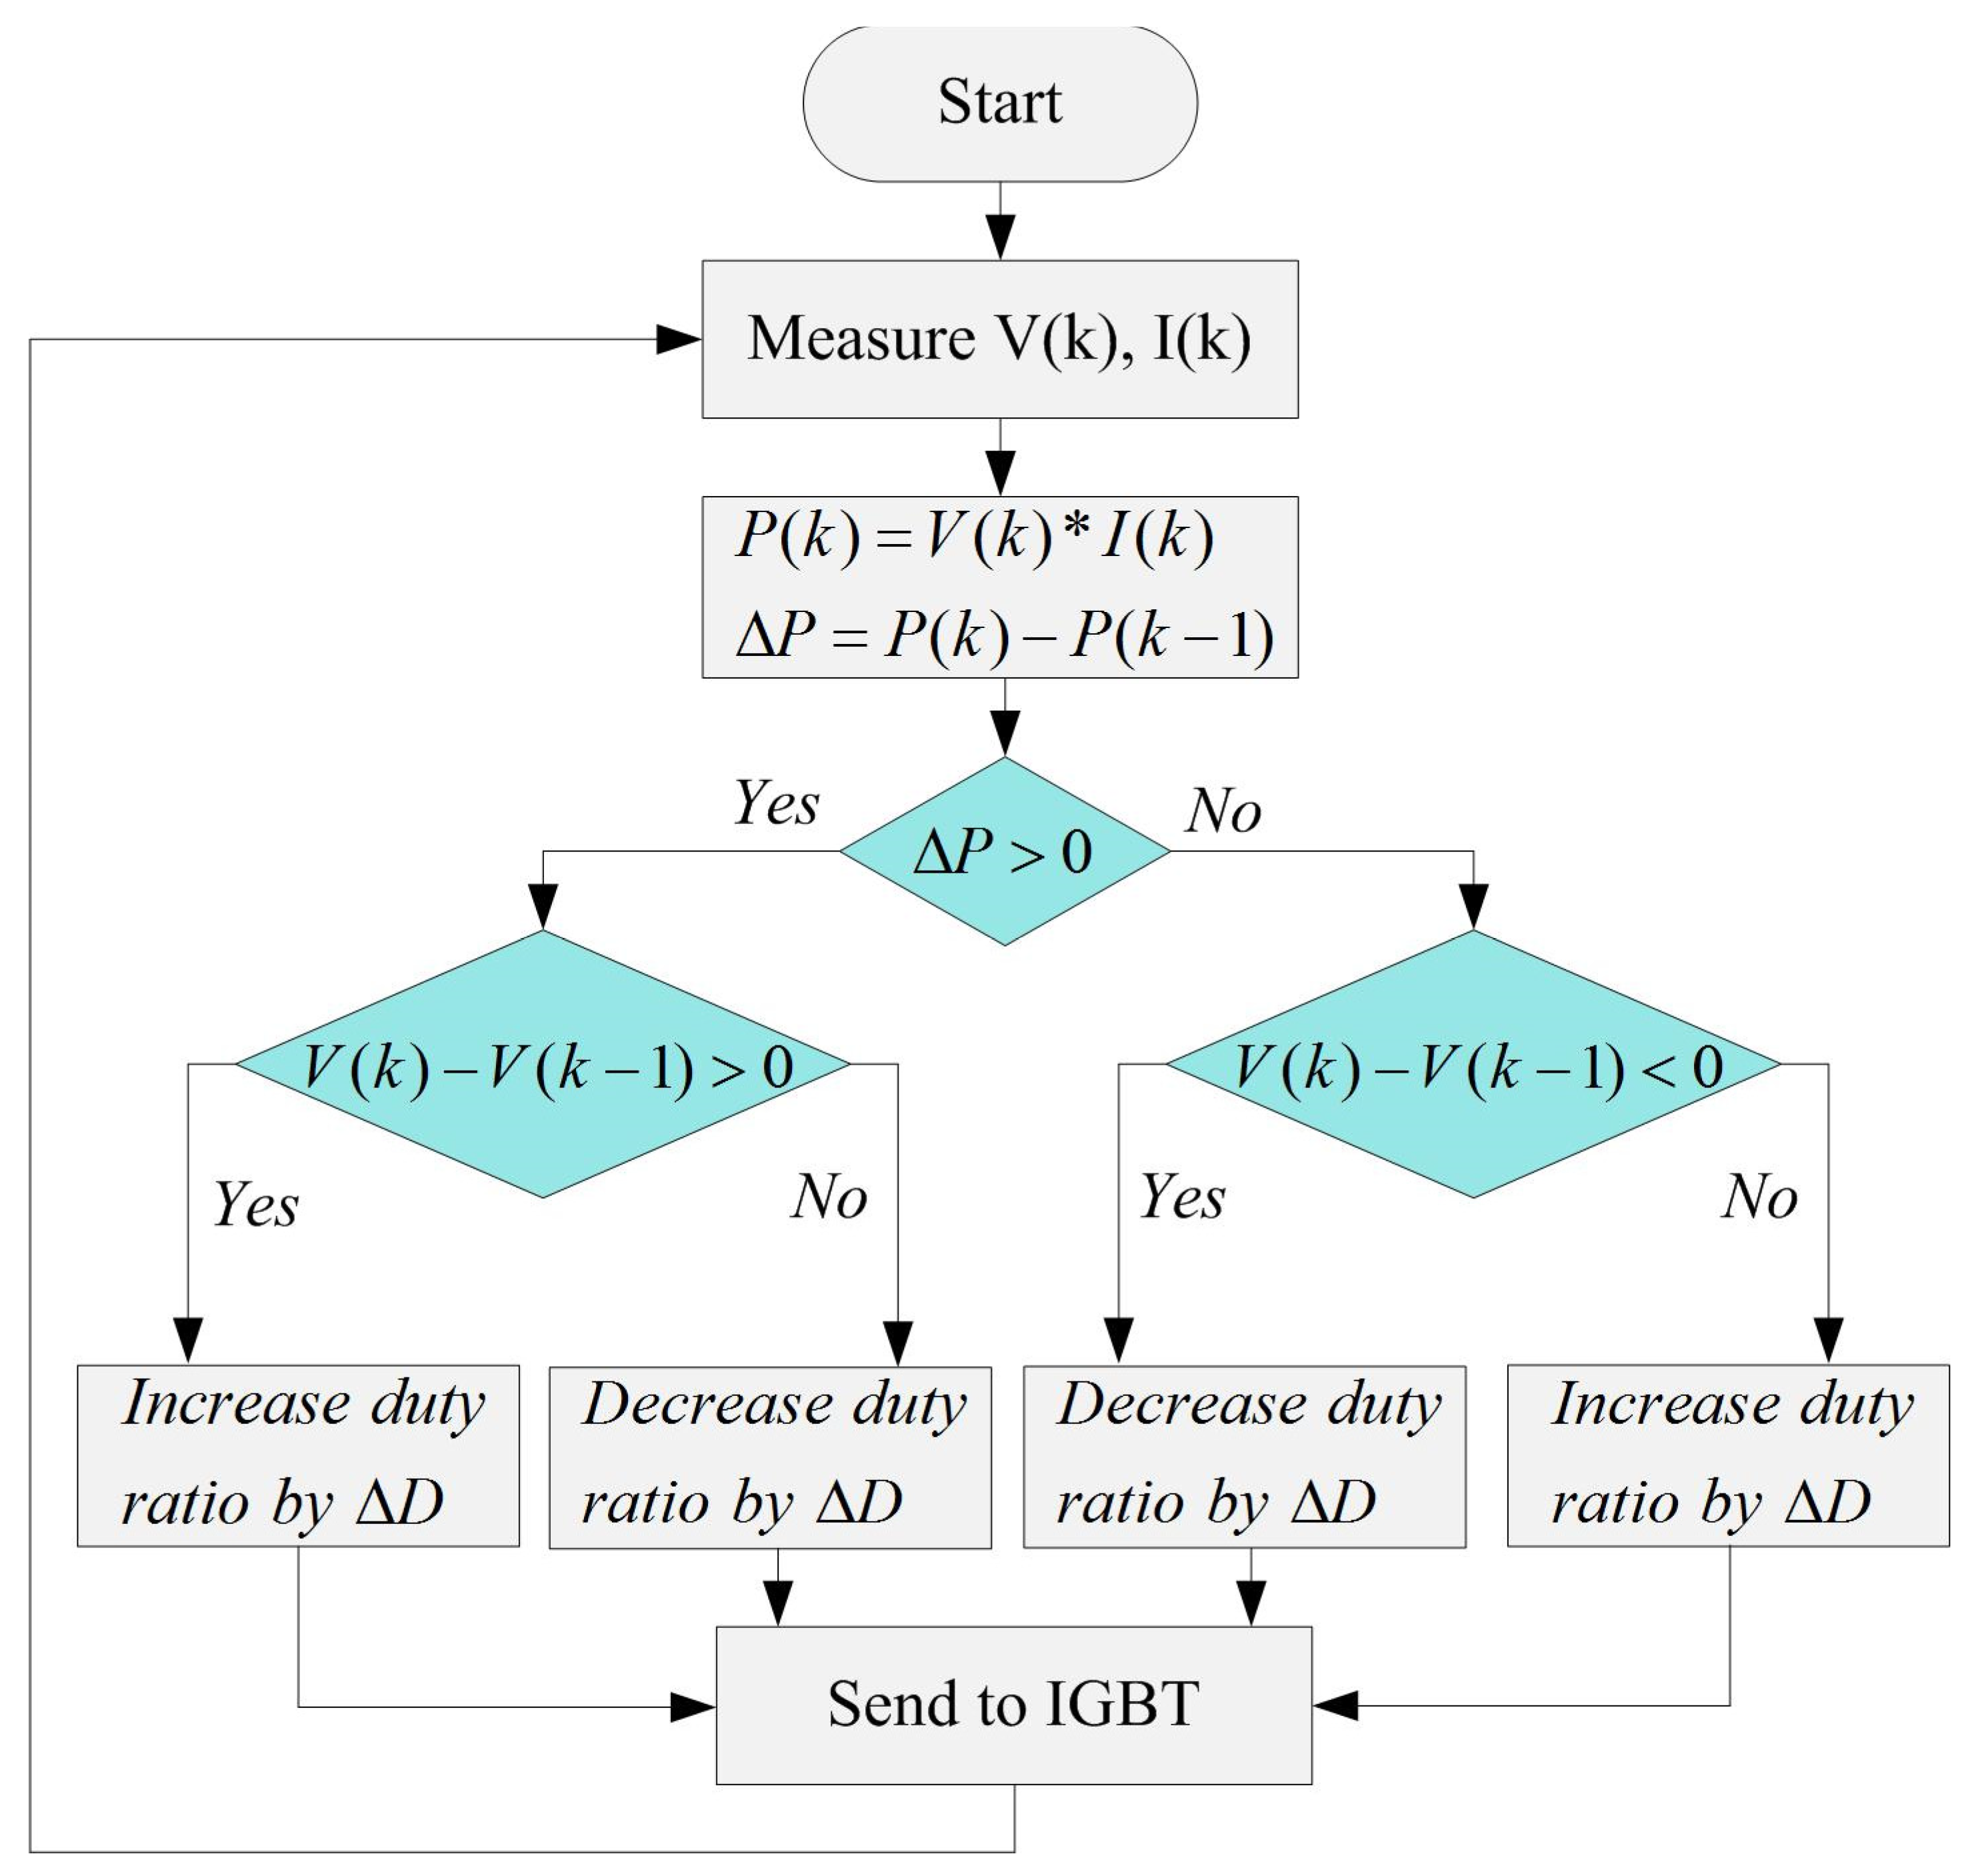
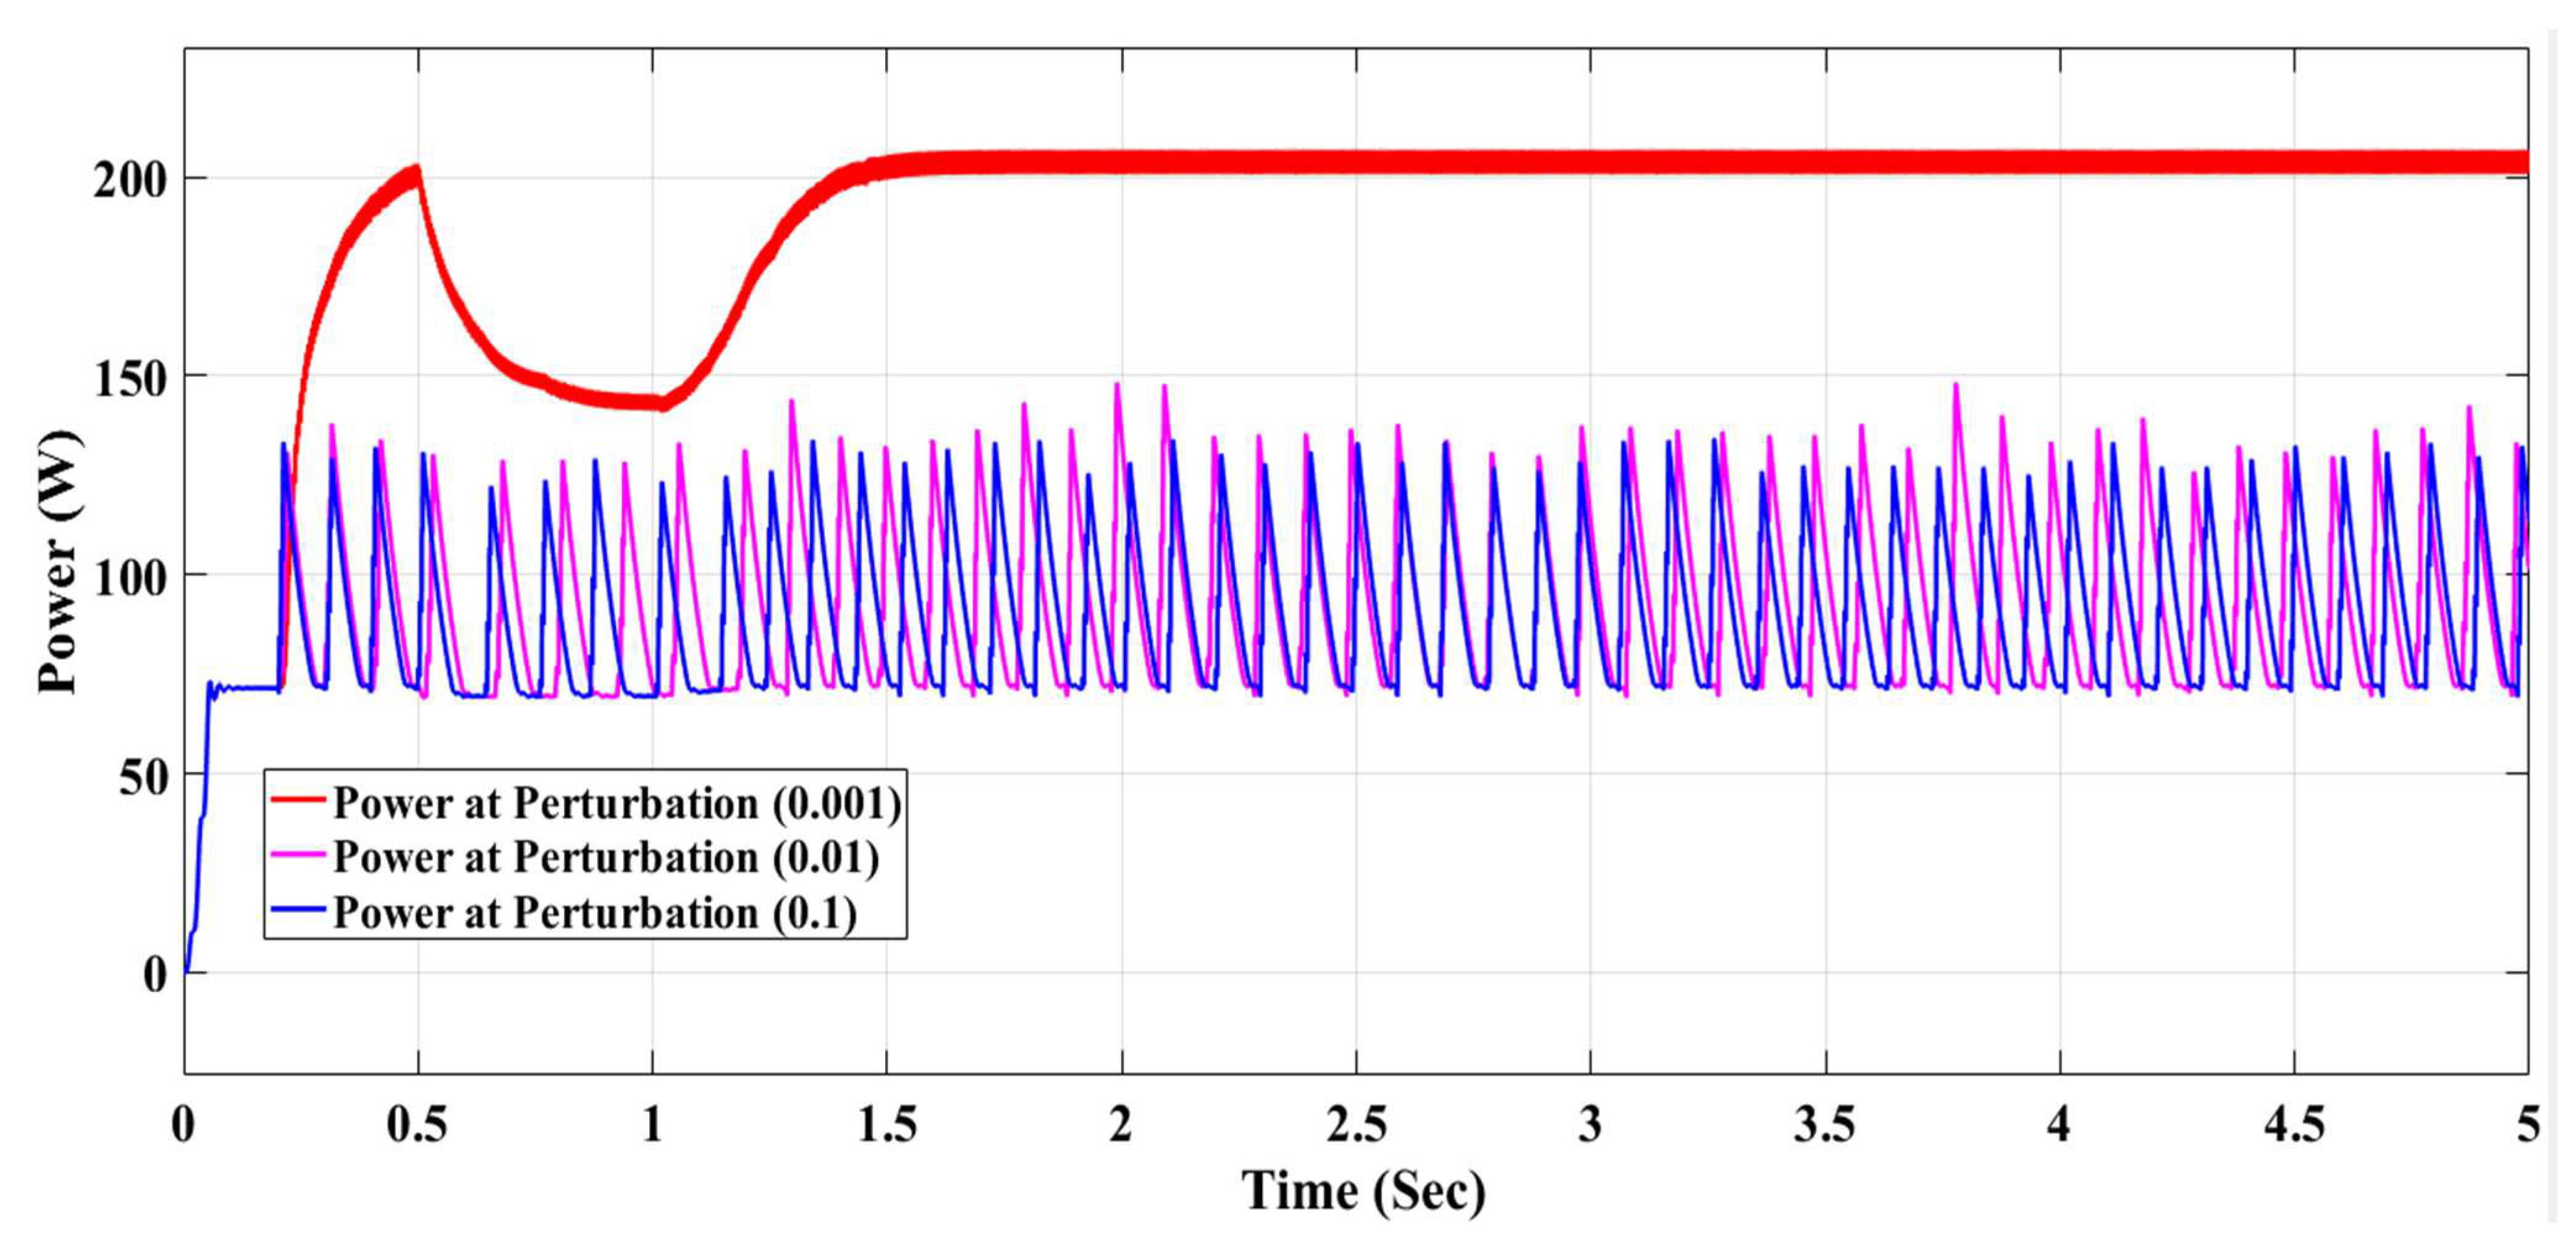
2. P-&-O Based MPPT
- (i)
- Static presentation (for a fixed MPP, how well it works).
- (ii)
- Dynamic presentation (the degree to which it responds to changes in MPP).
Simulation Models Using P-&-O Based MPPT Technique
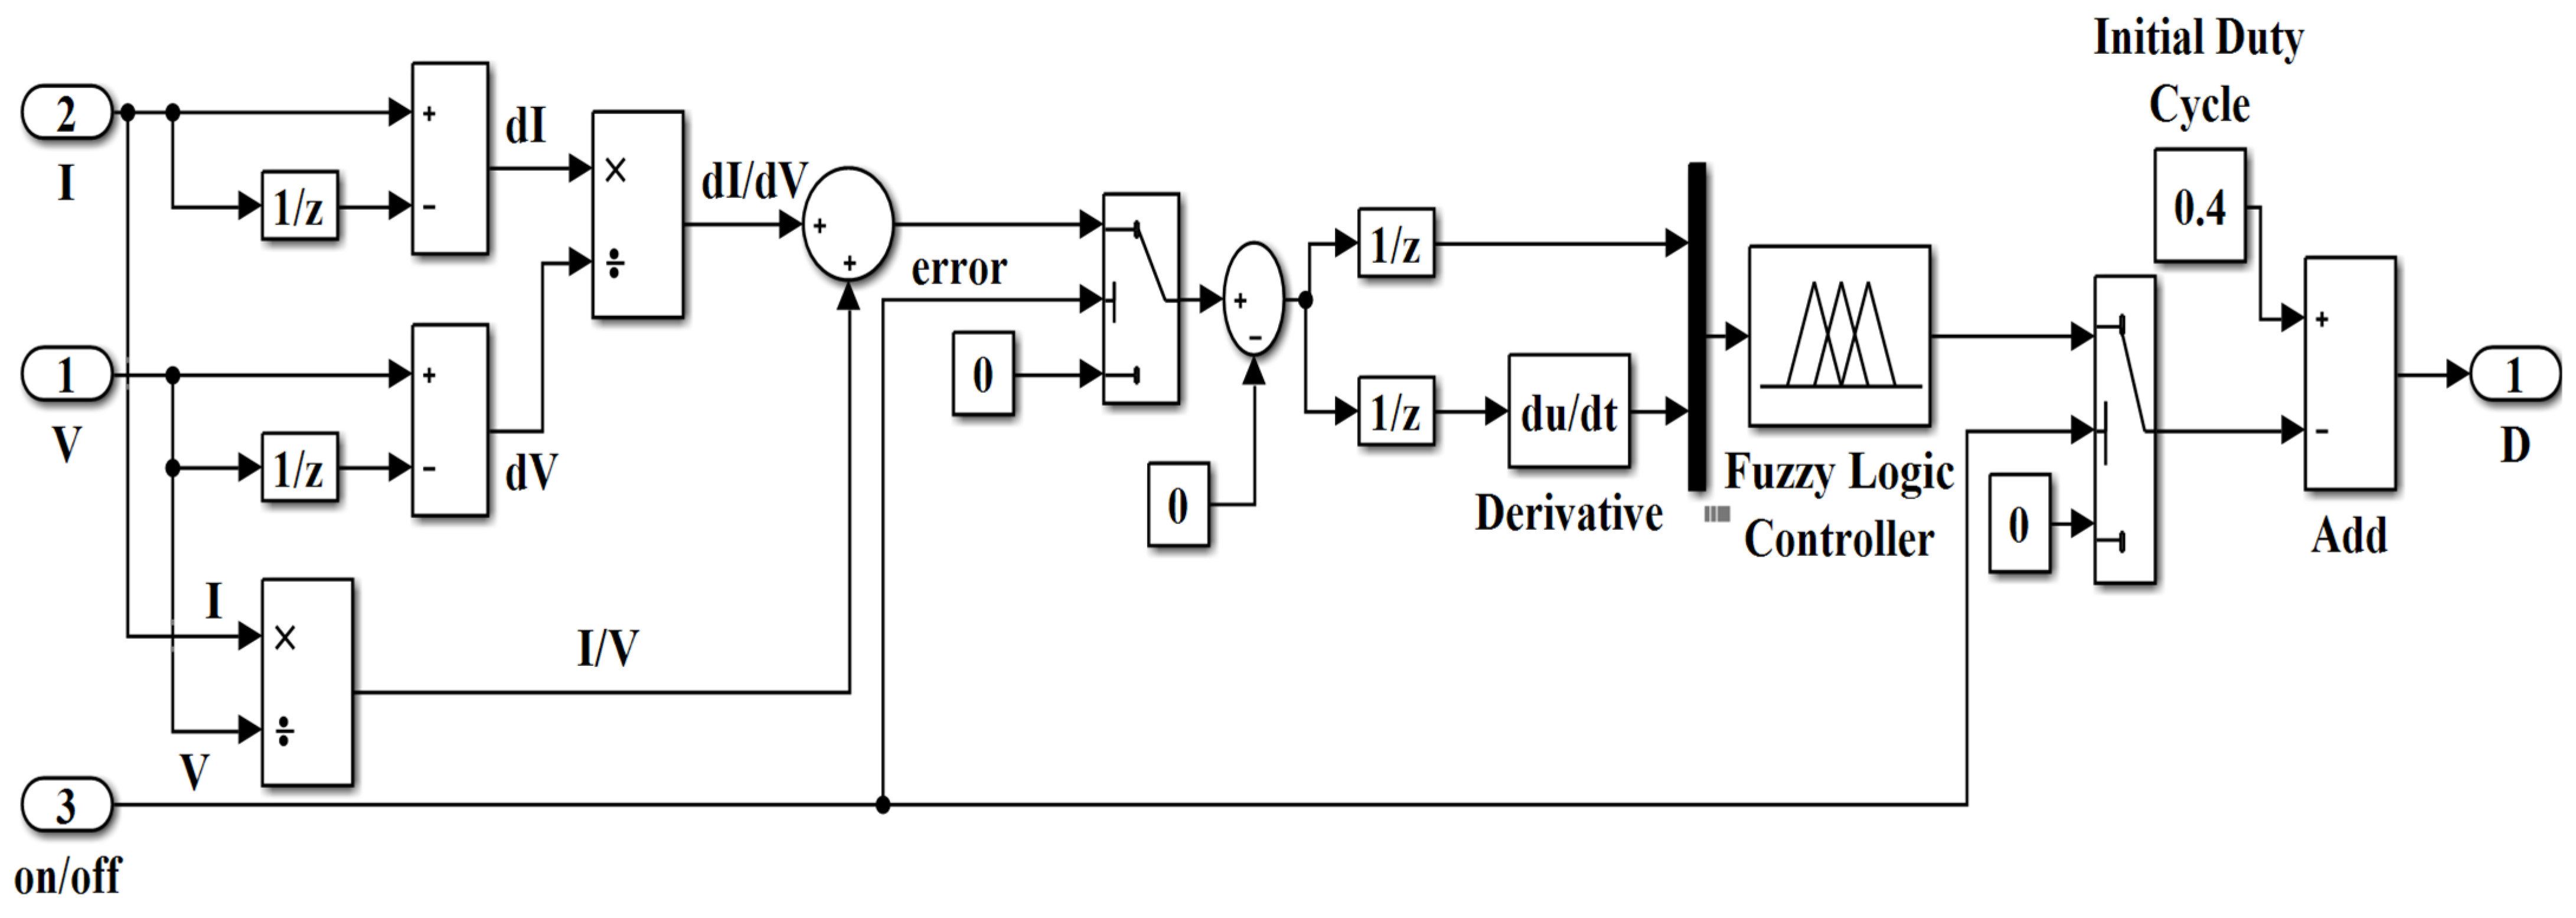
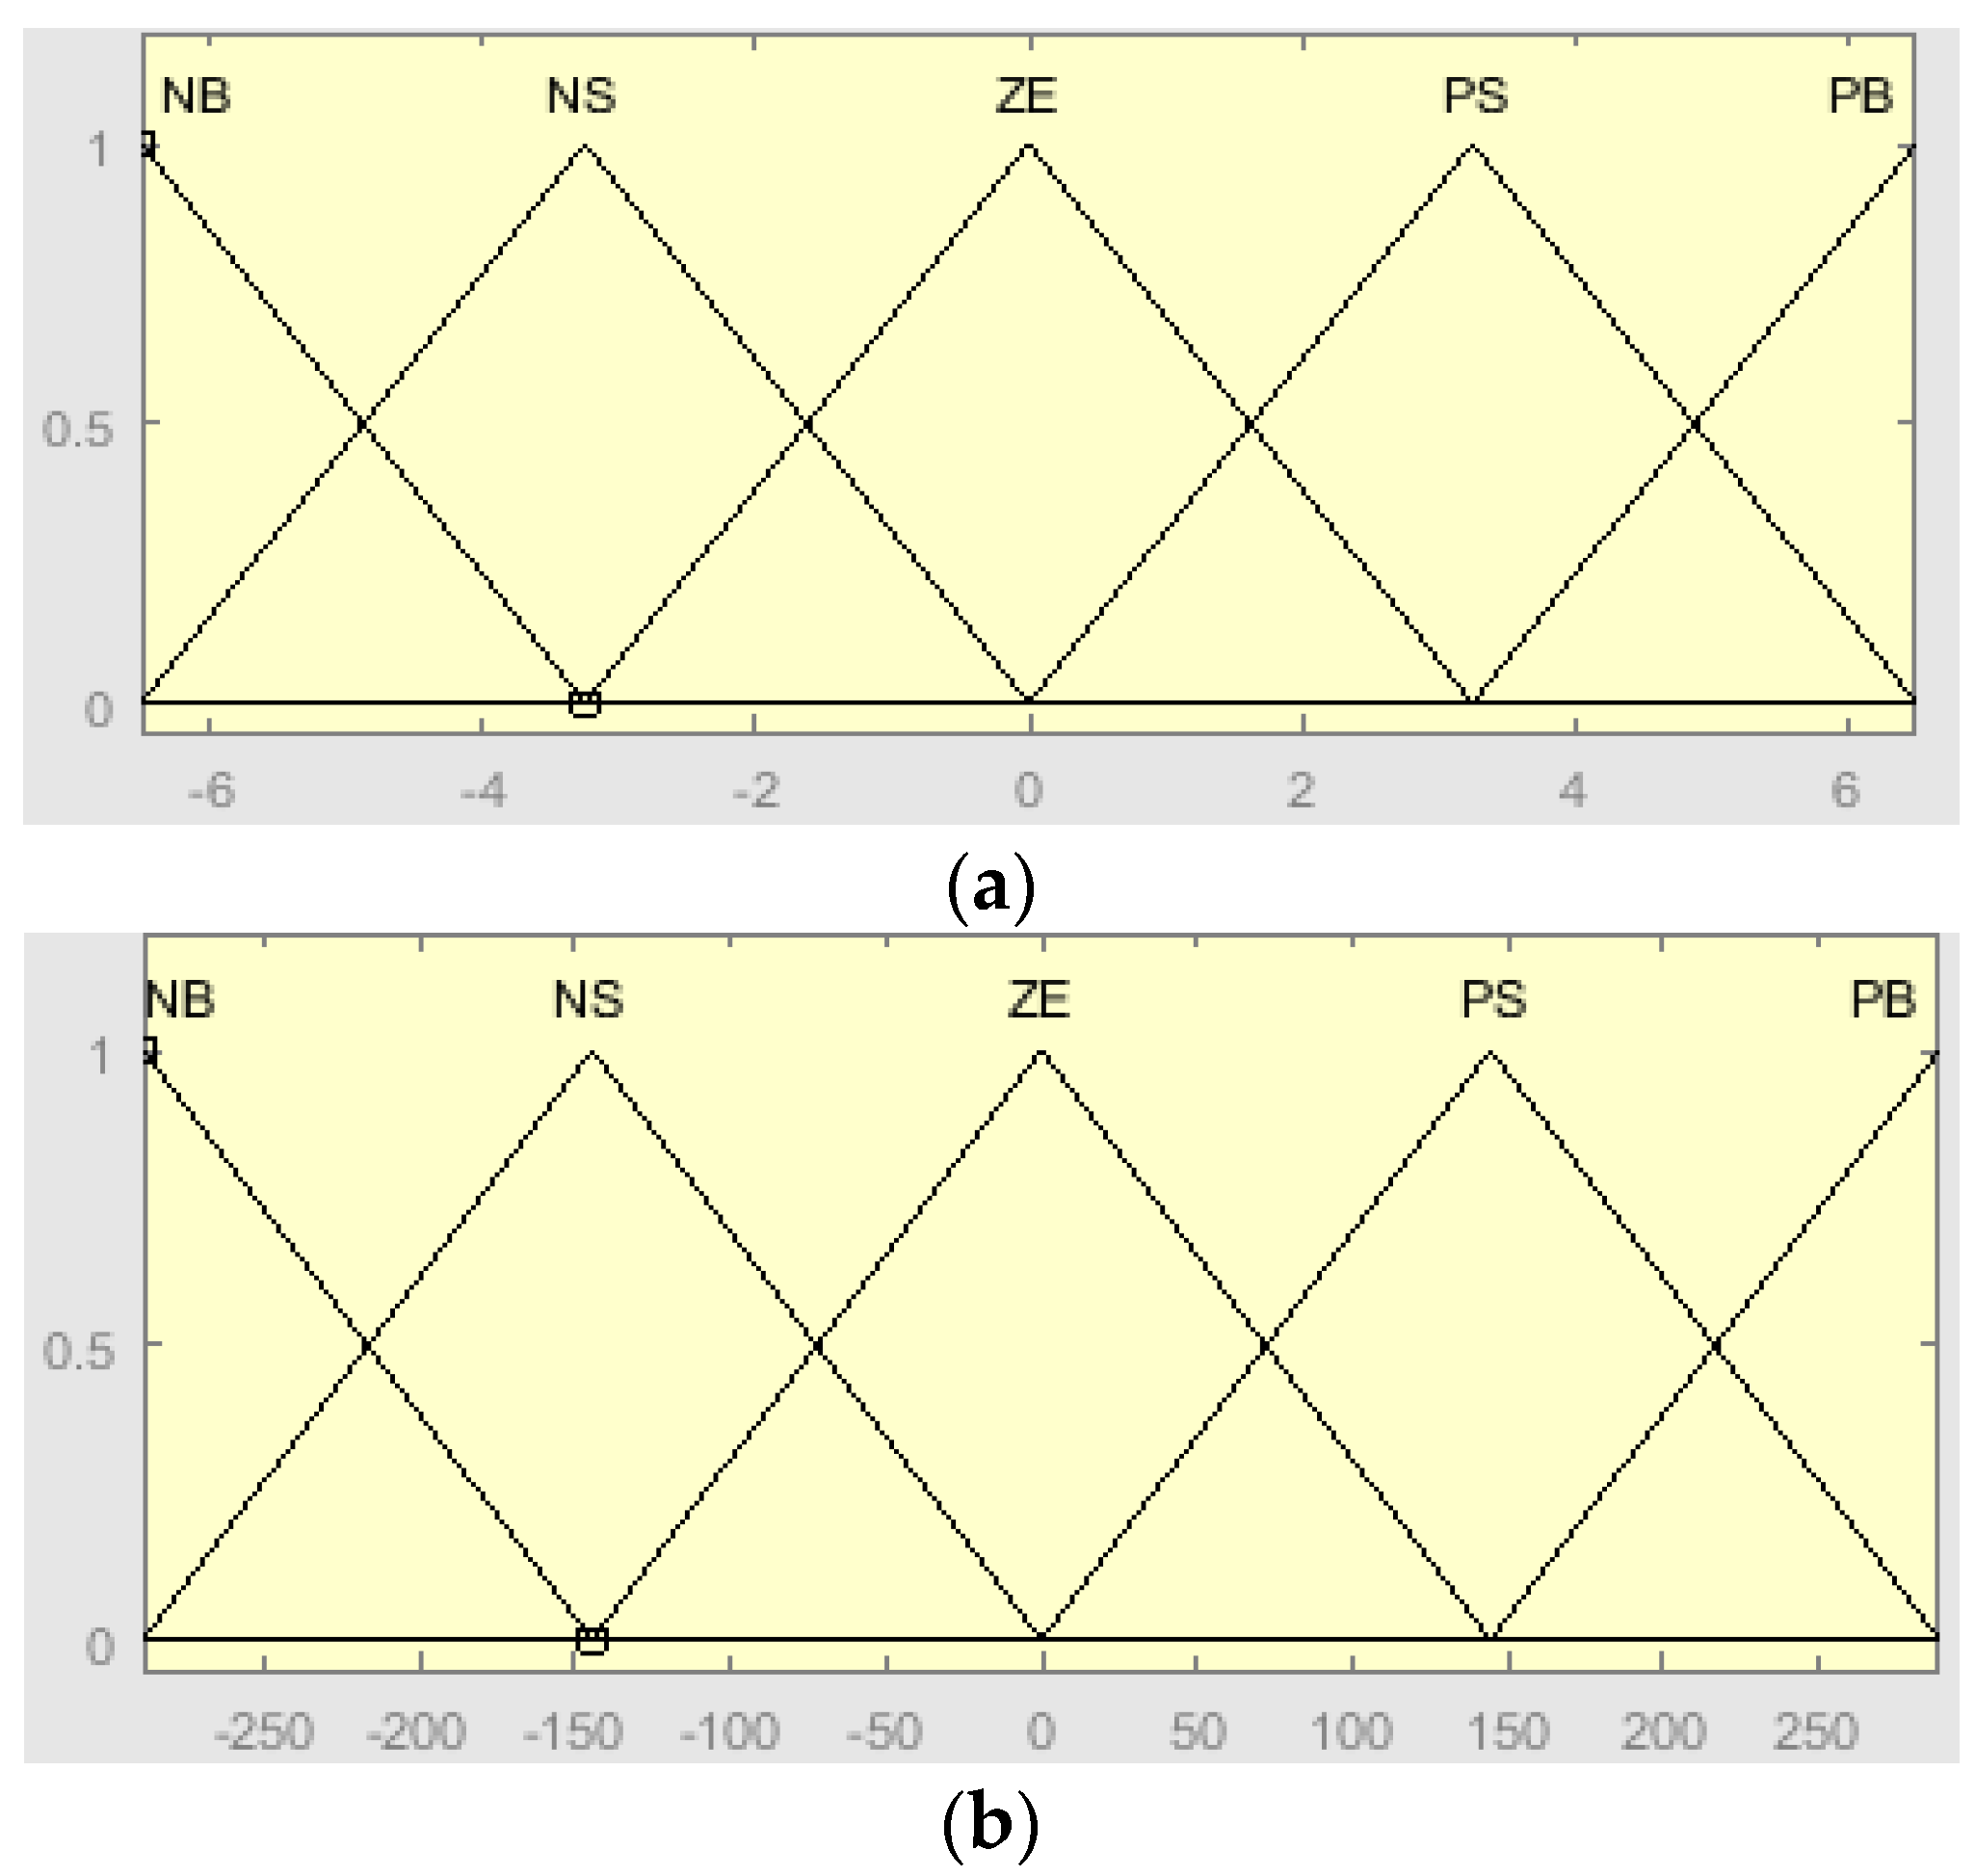
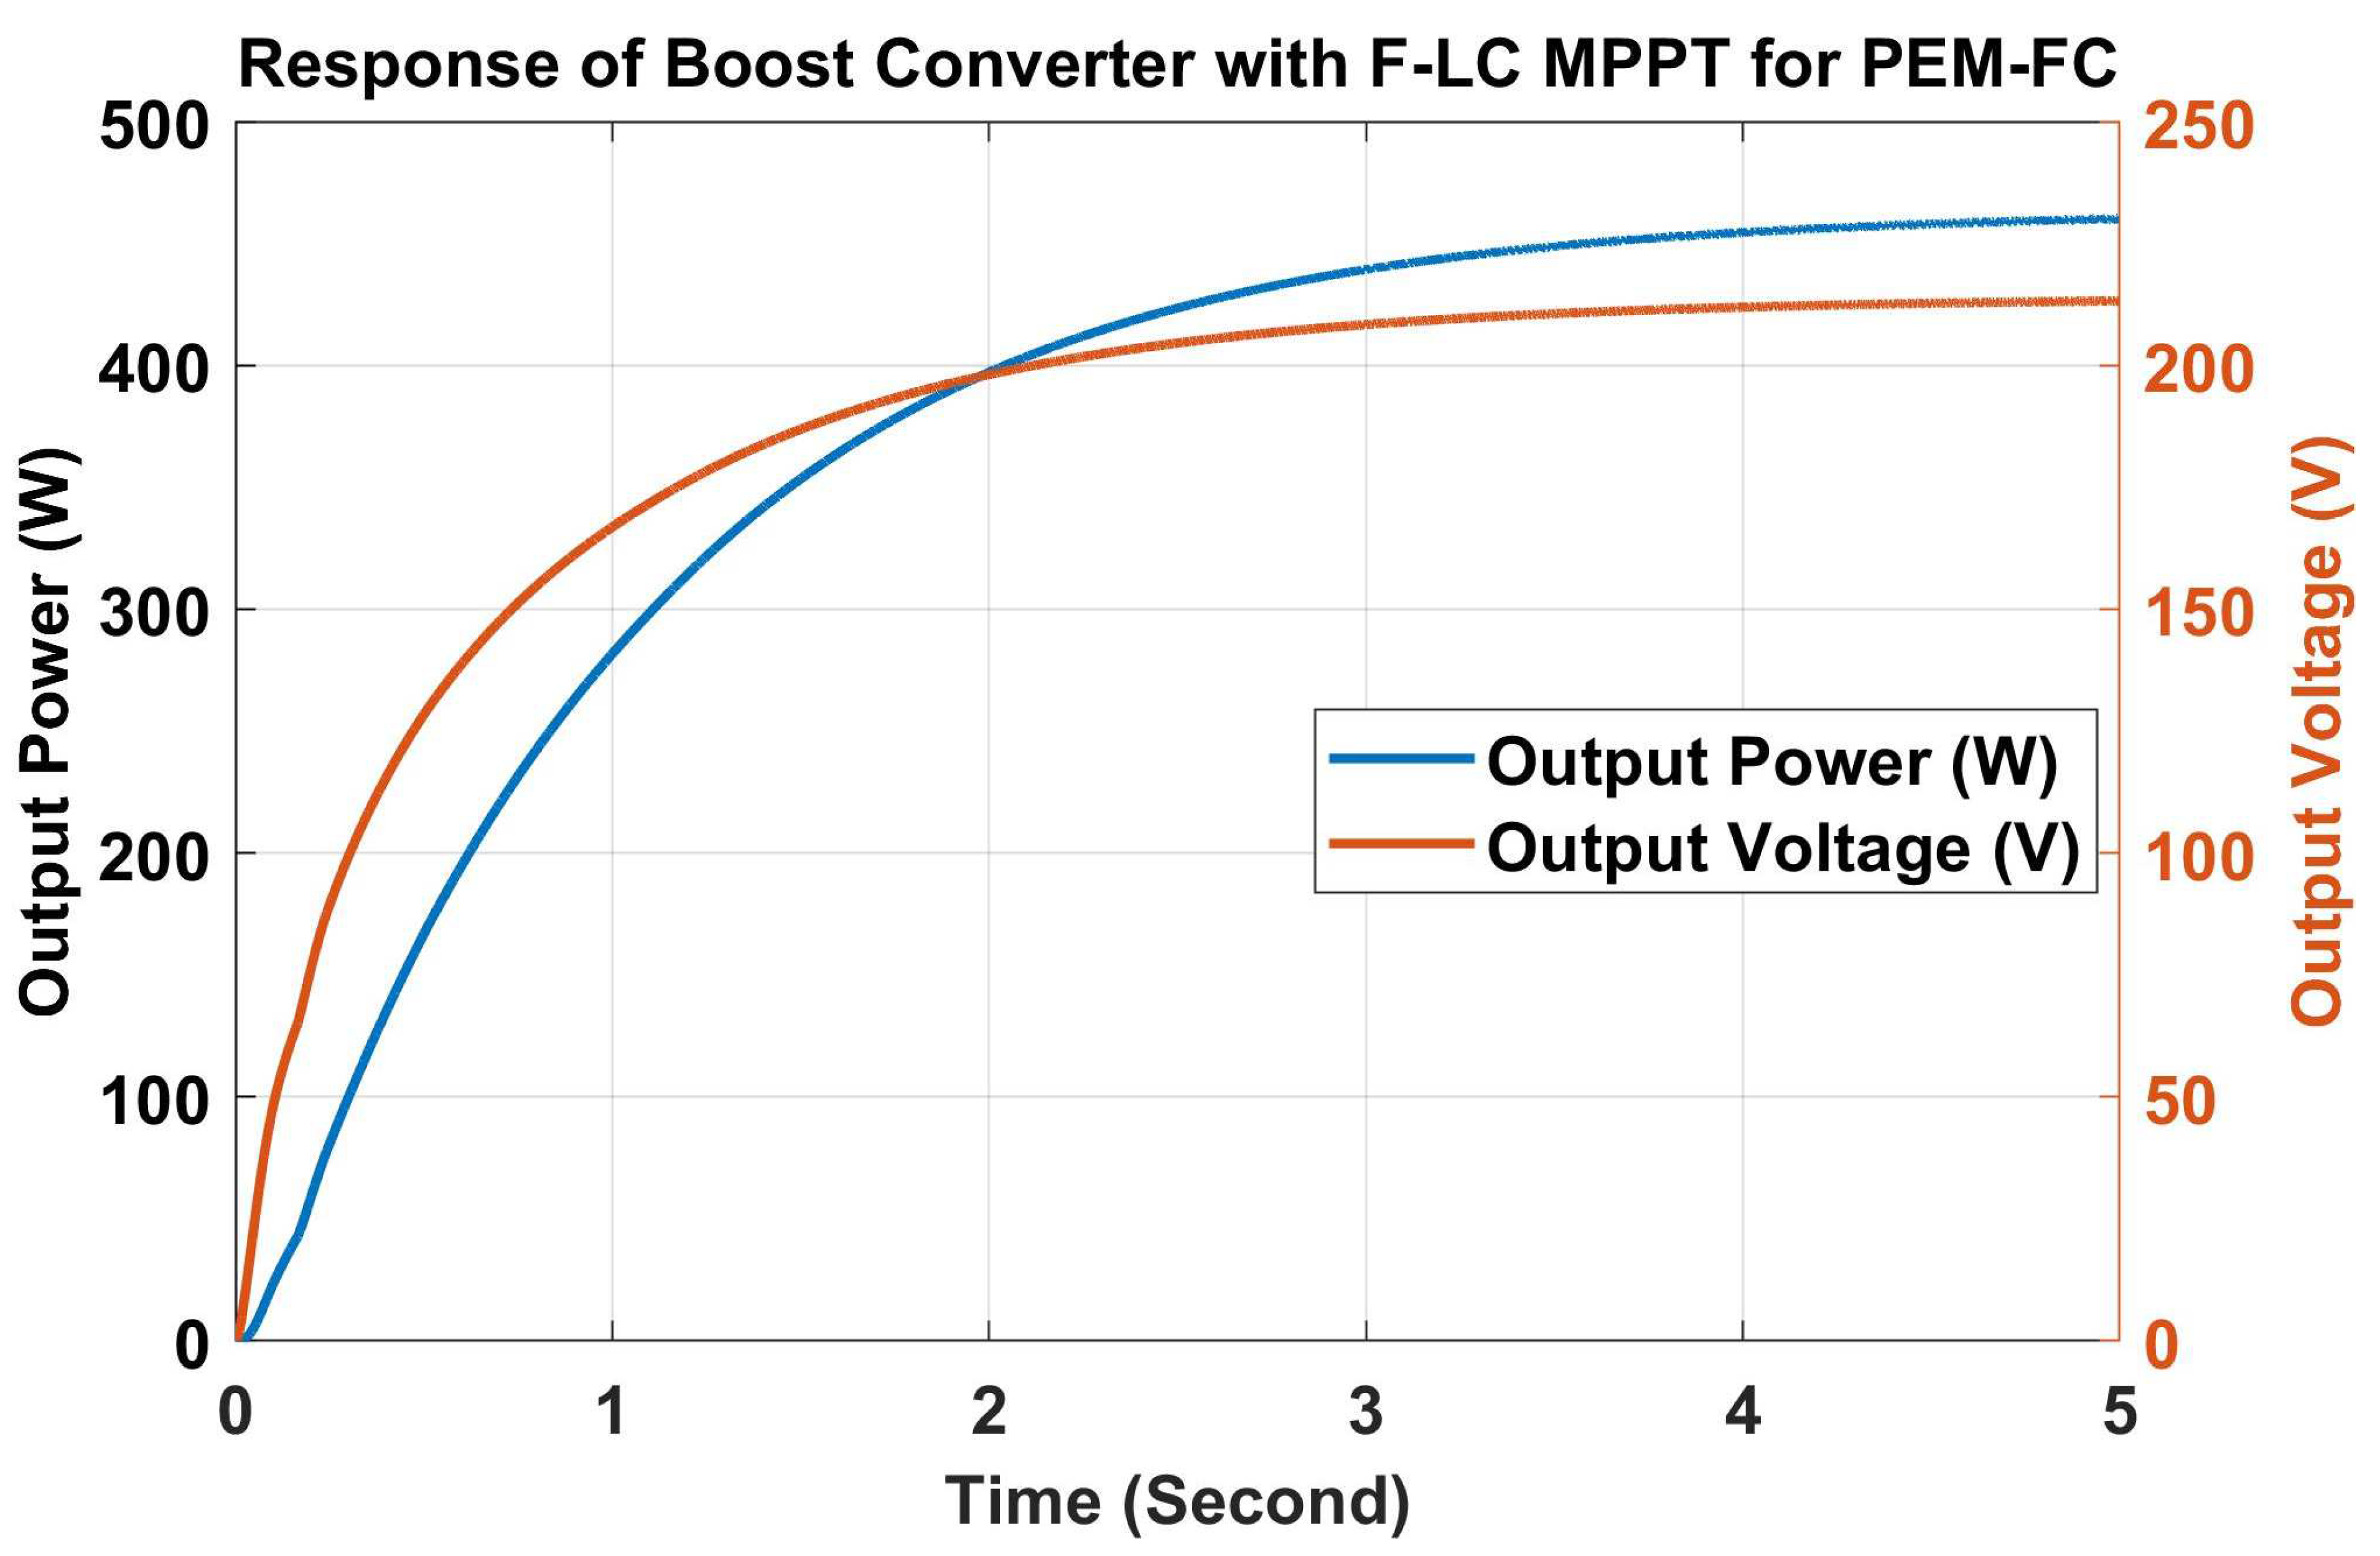
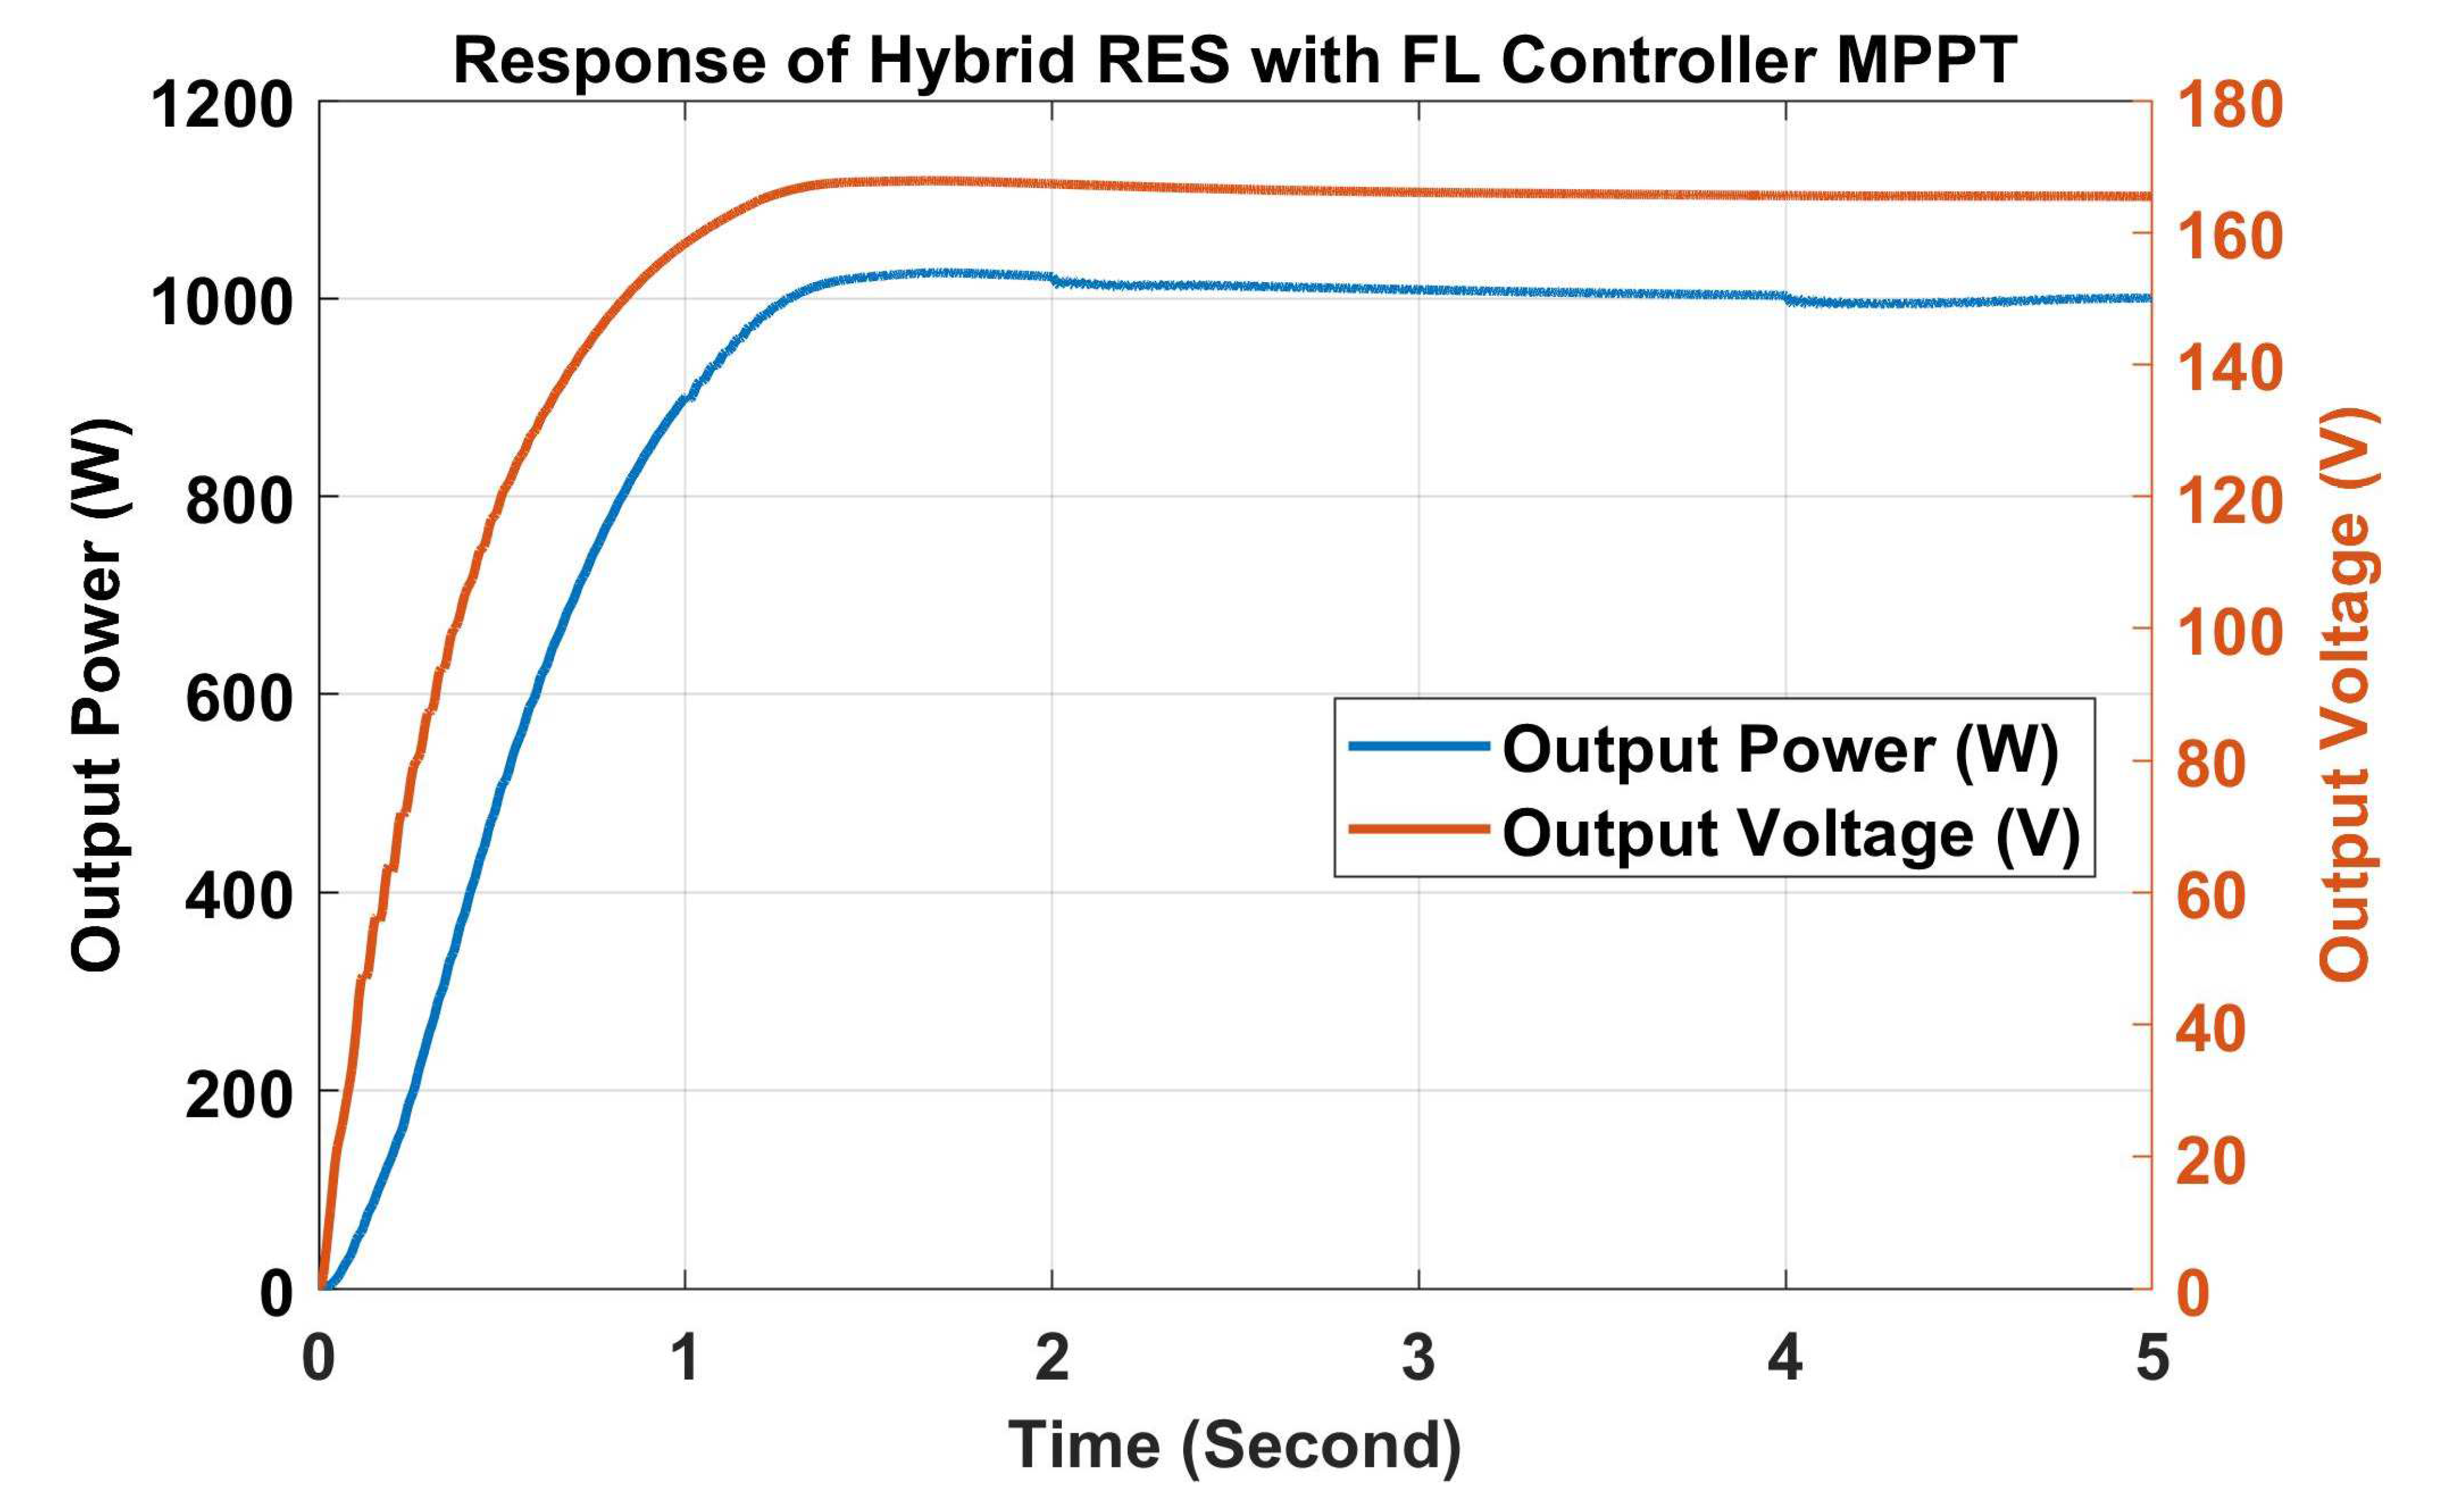
3. F-LC MPPT Controller
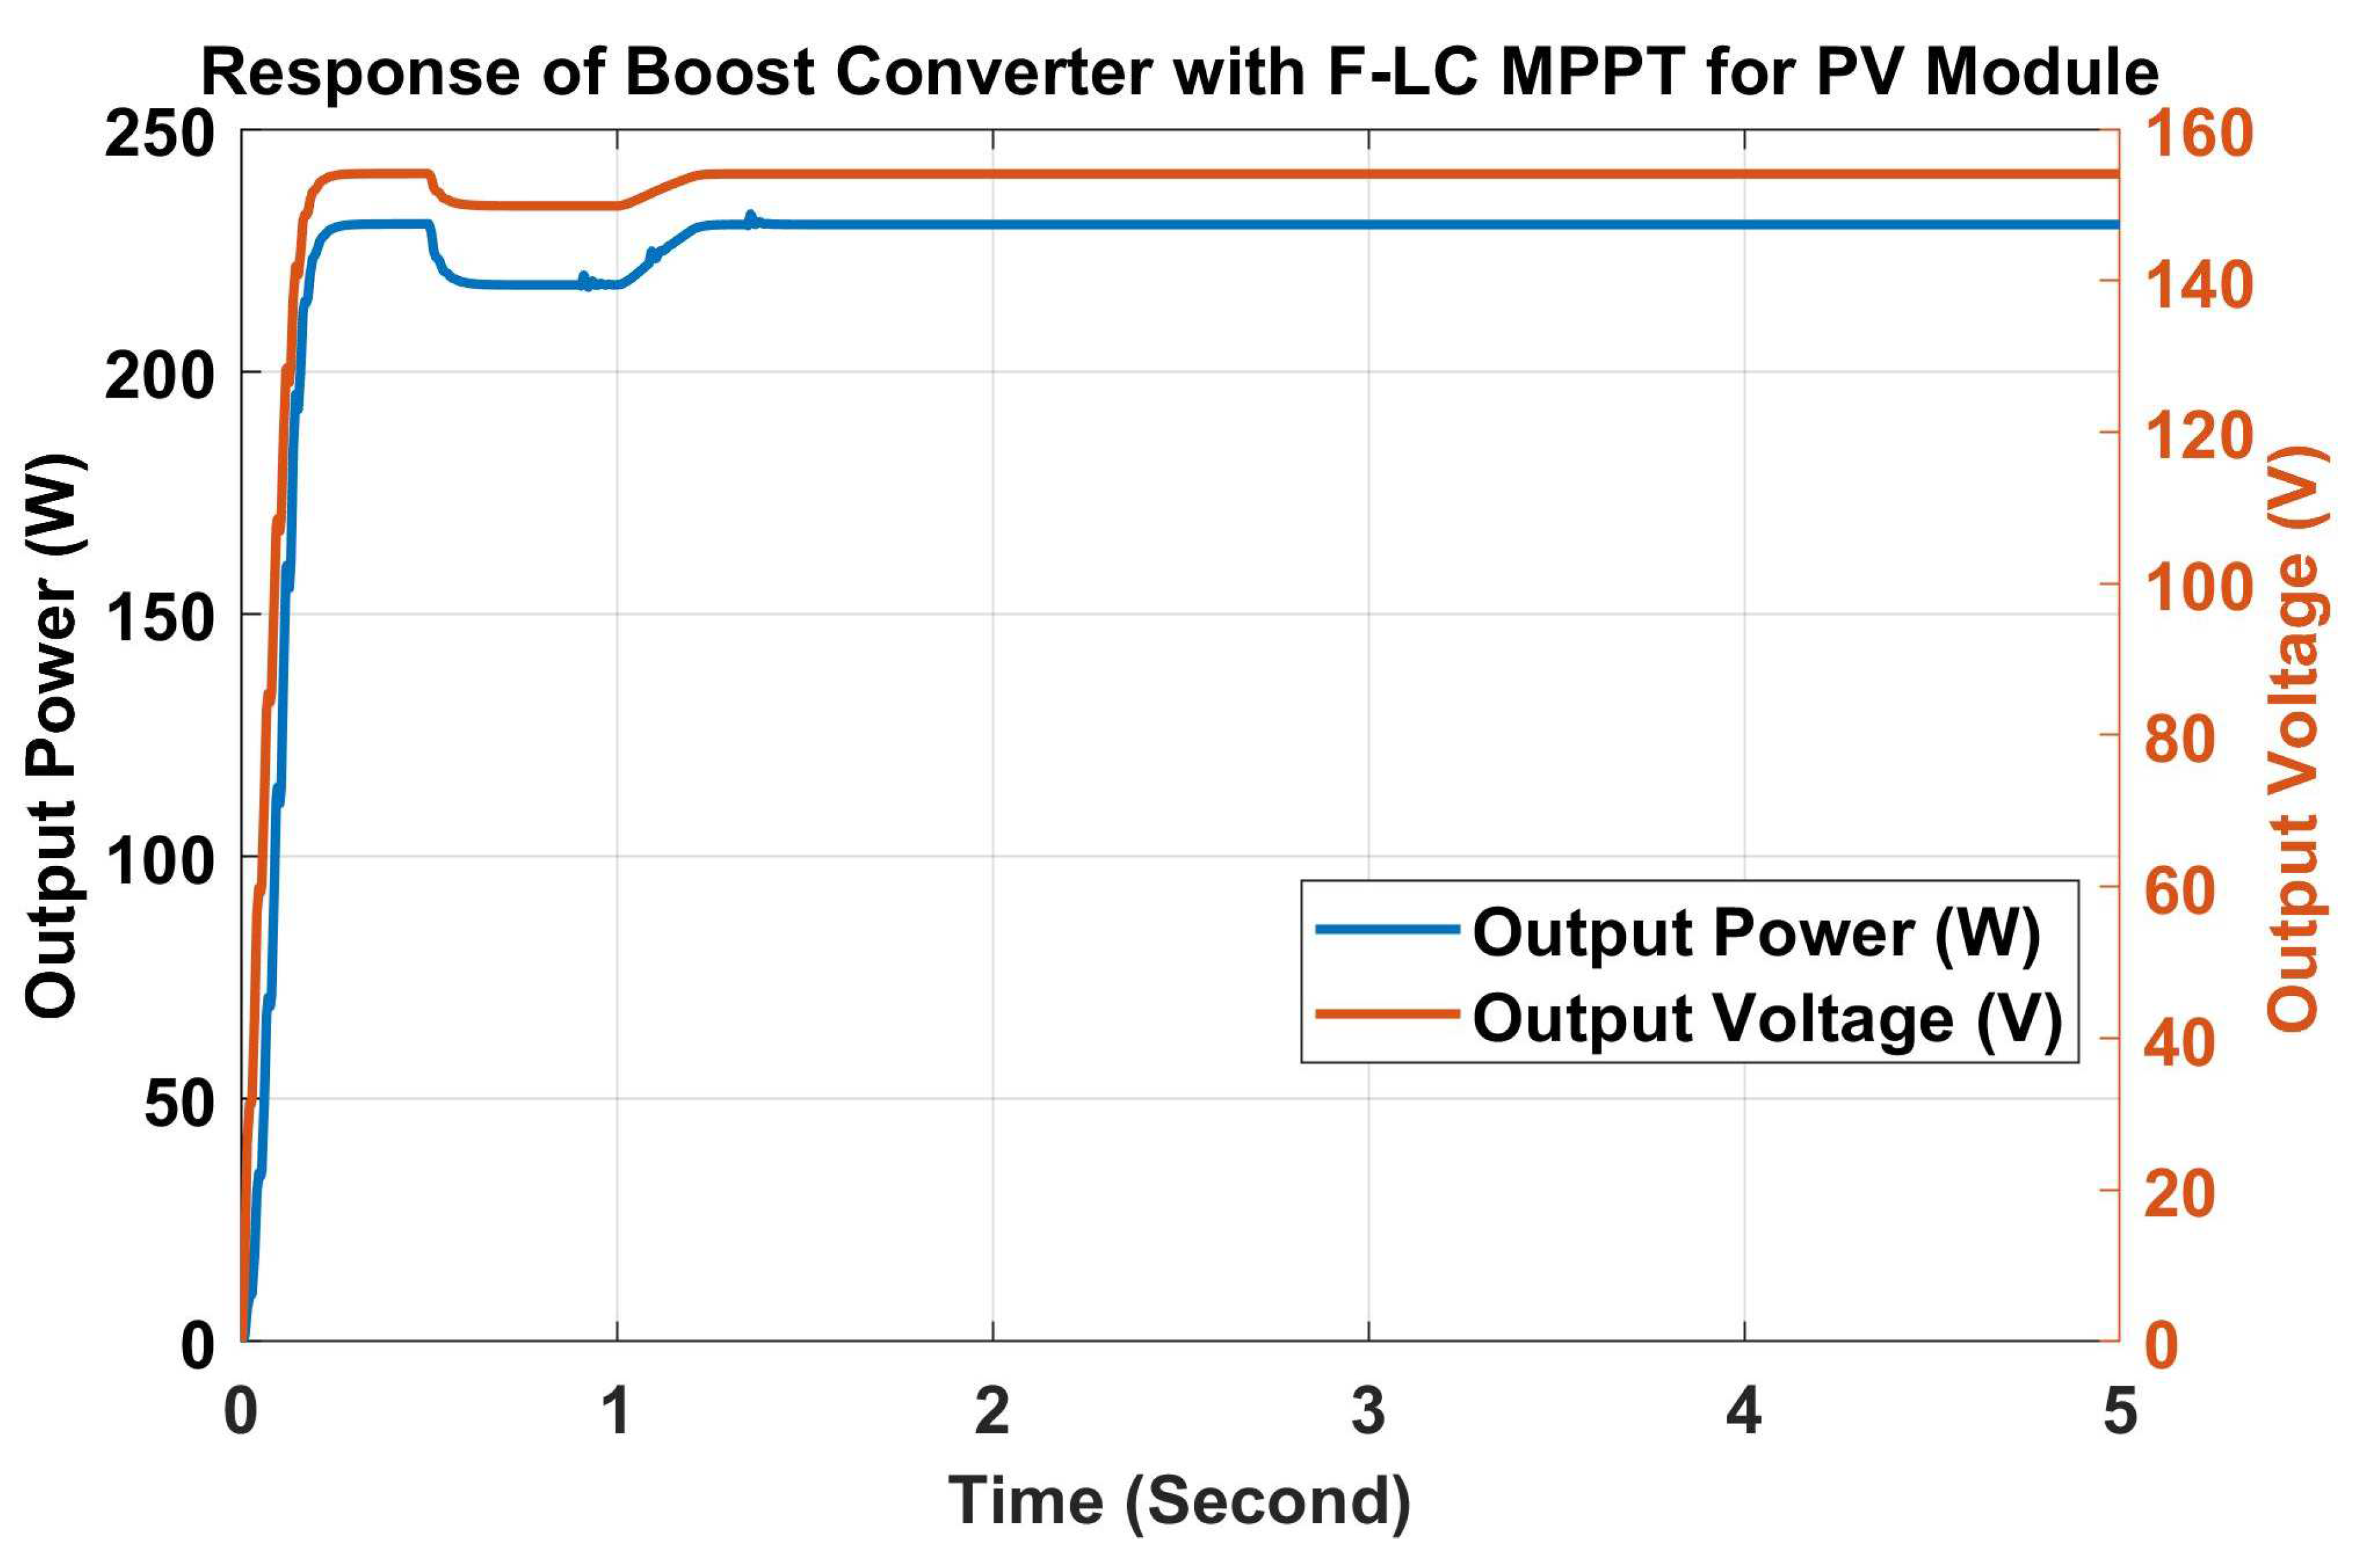
Simulation Modelling of PV, WTIG, PEM-FC and Hybrid RES System with F-LC MPPT
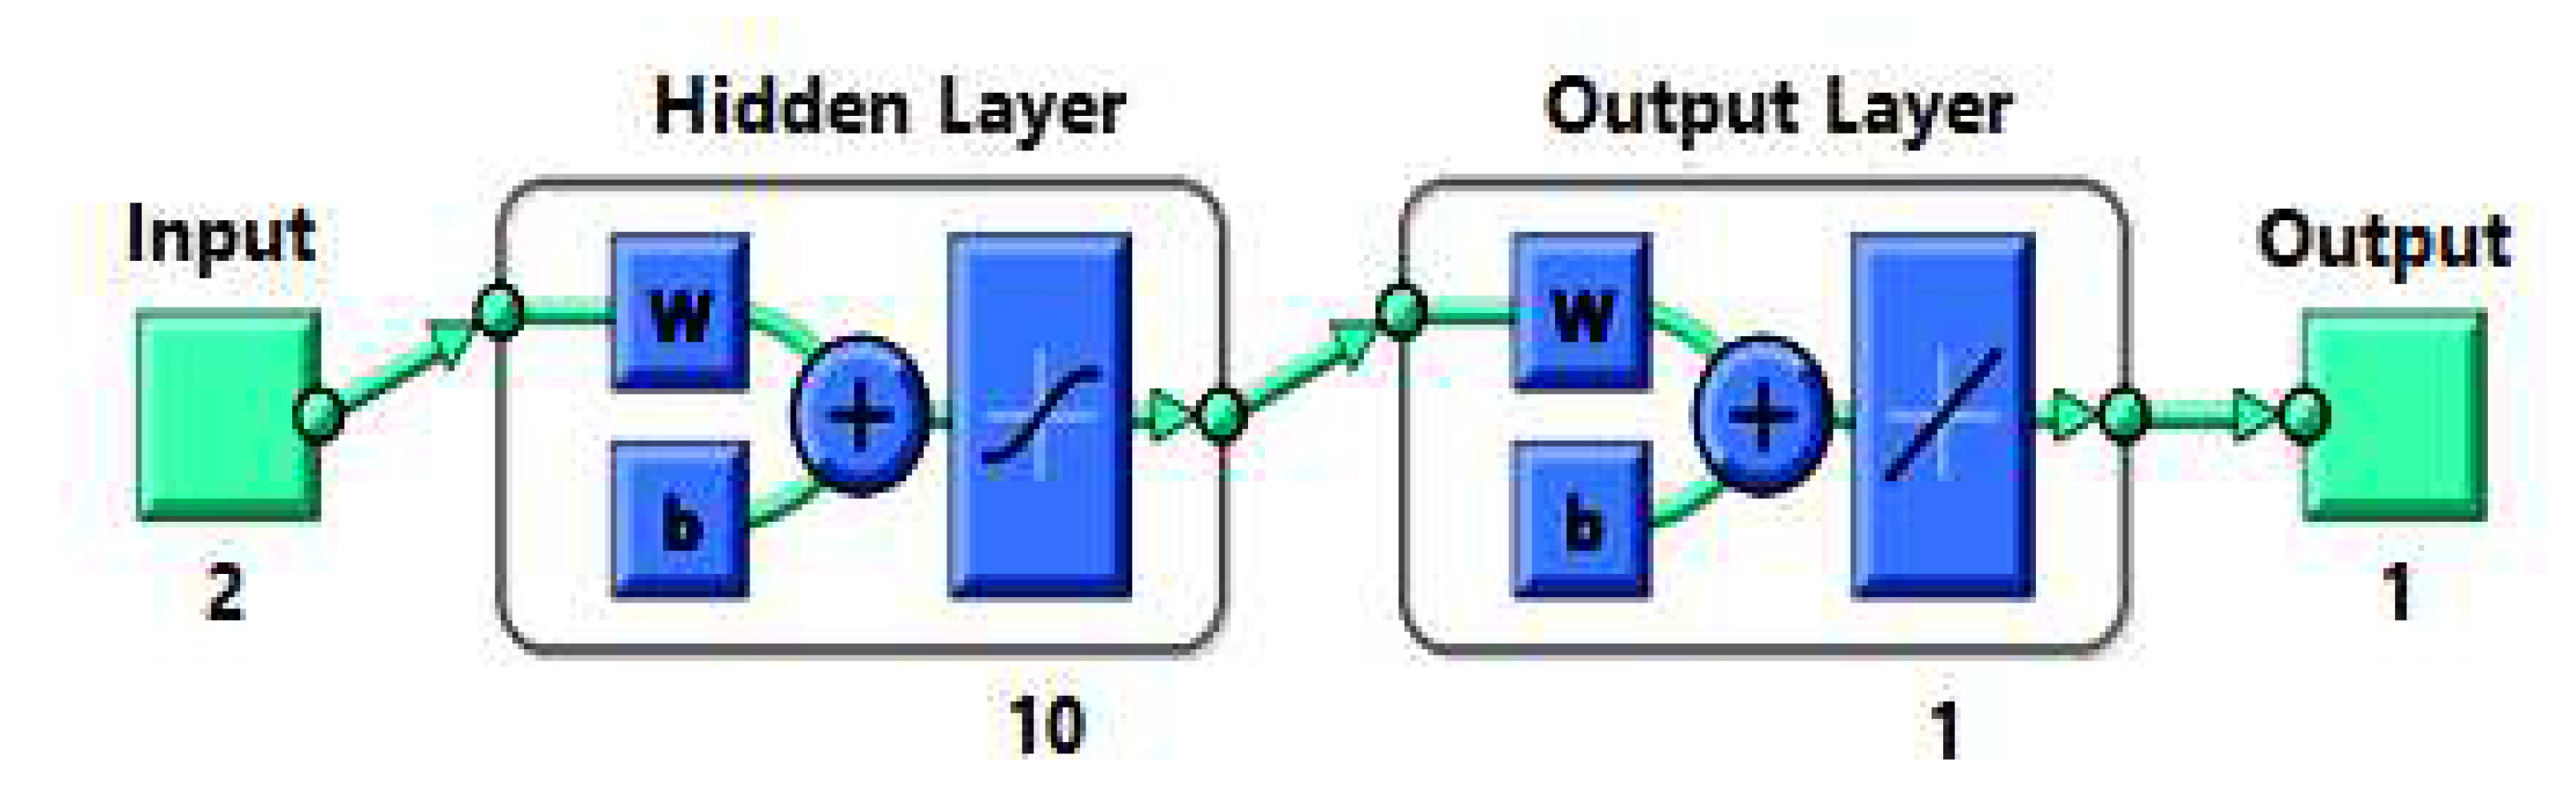
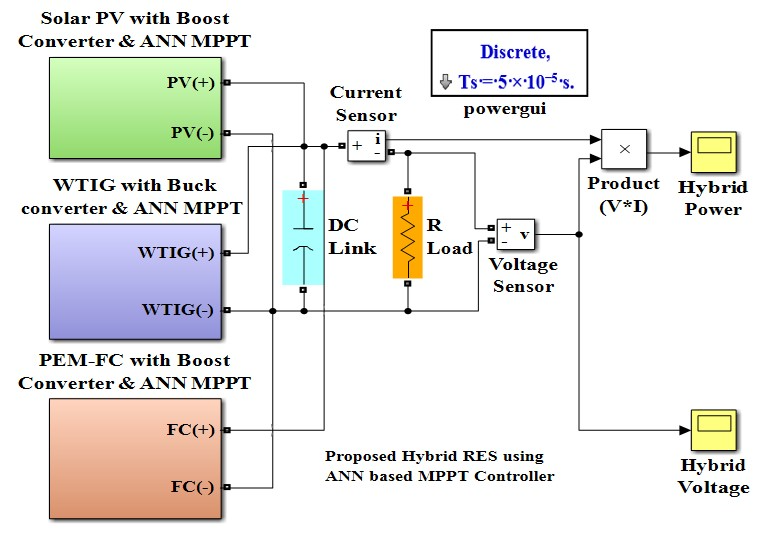
4. Scheme of AN-N MPPT Controller
Modelling and Analysis of AN-N MPPT
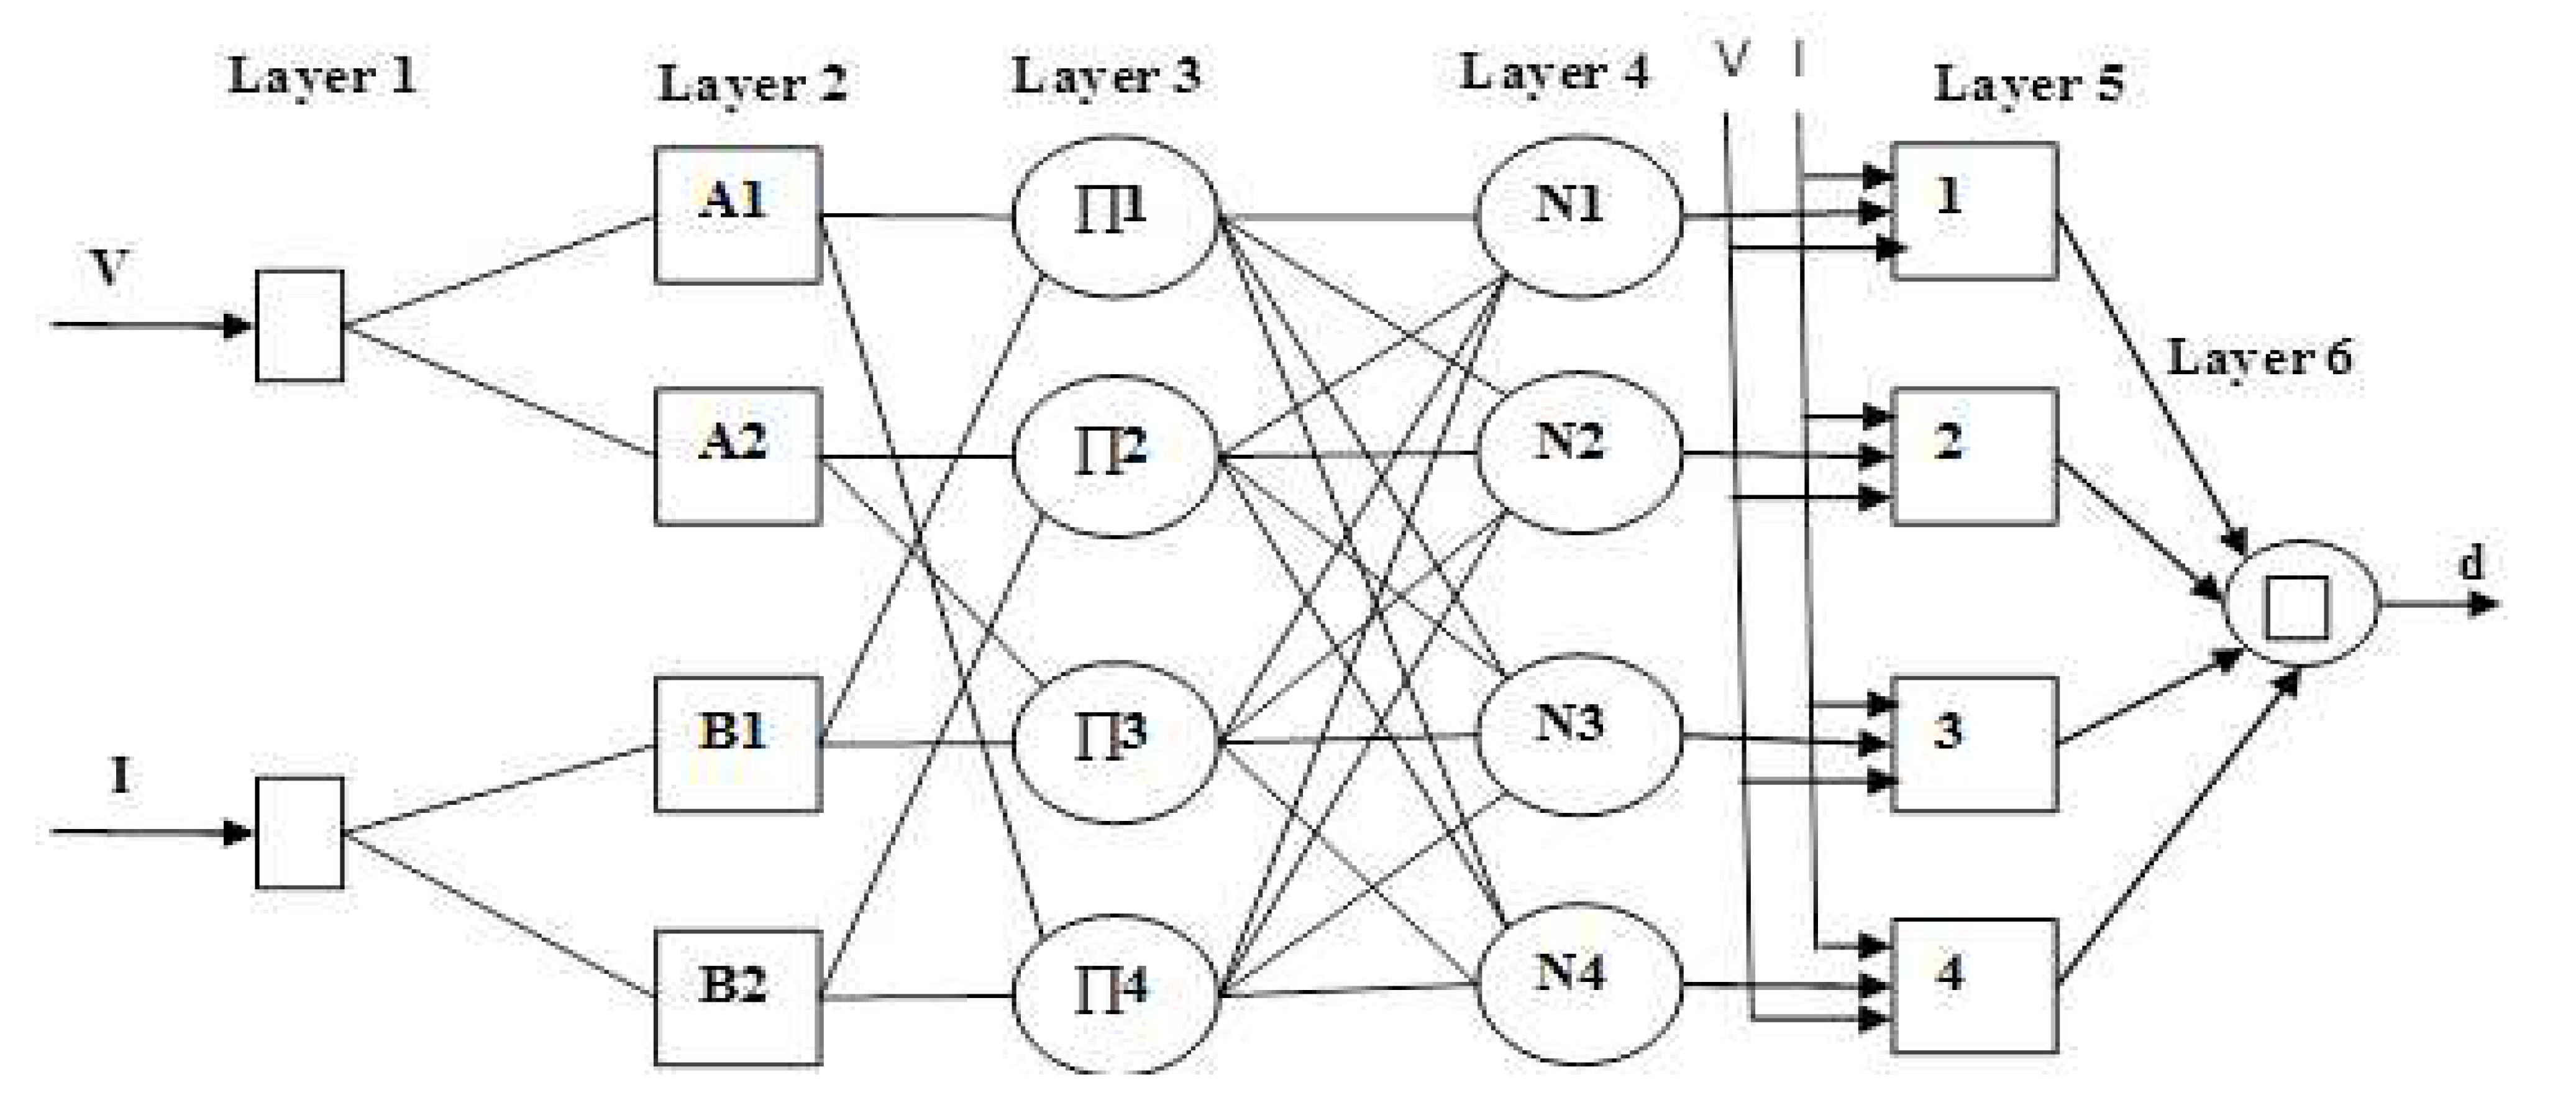
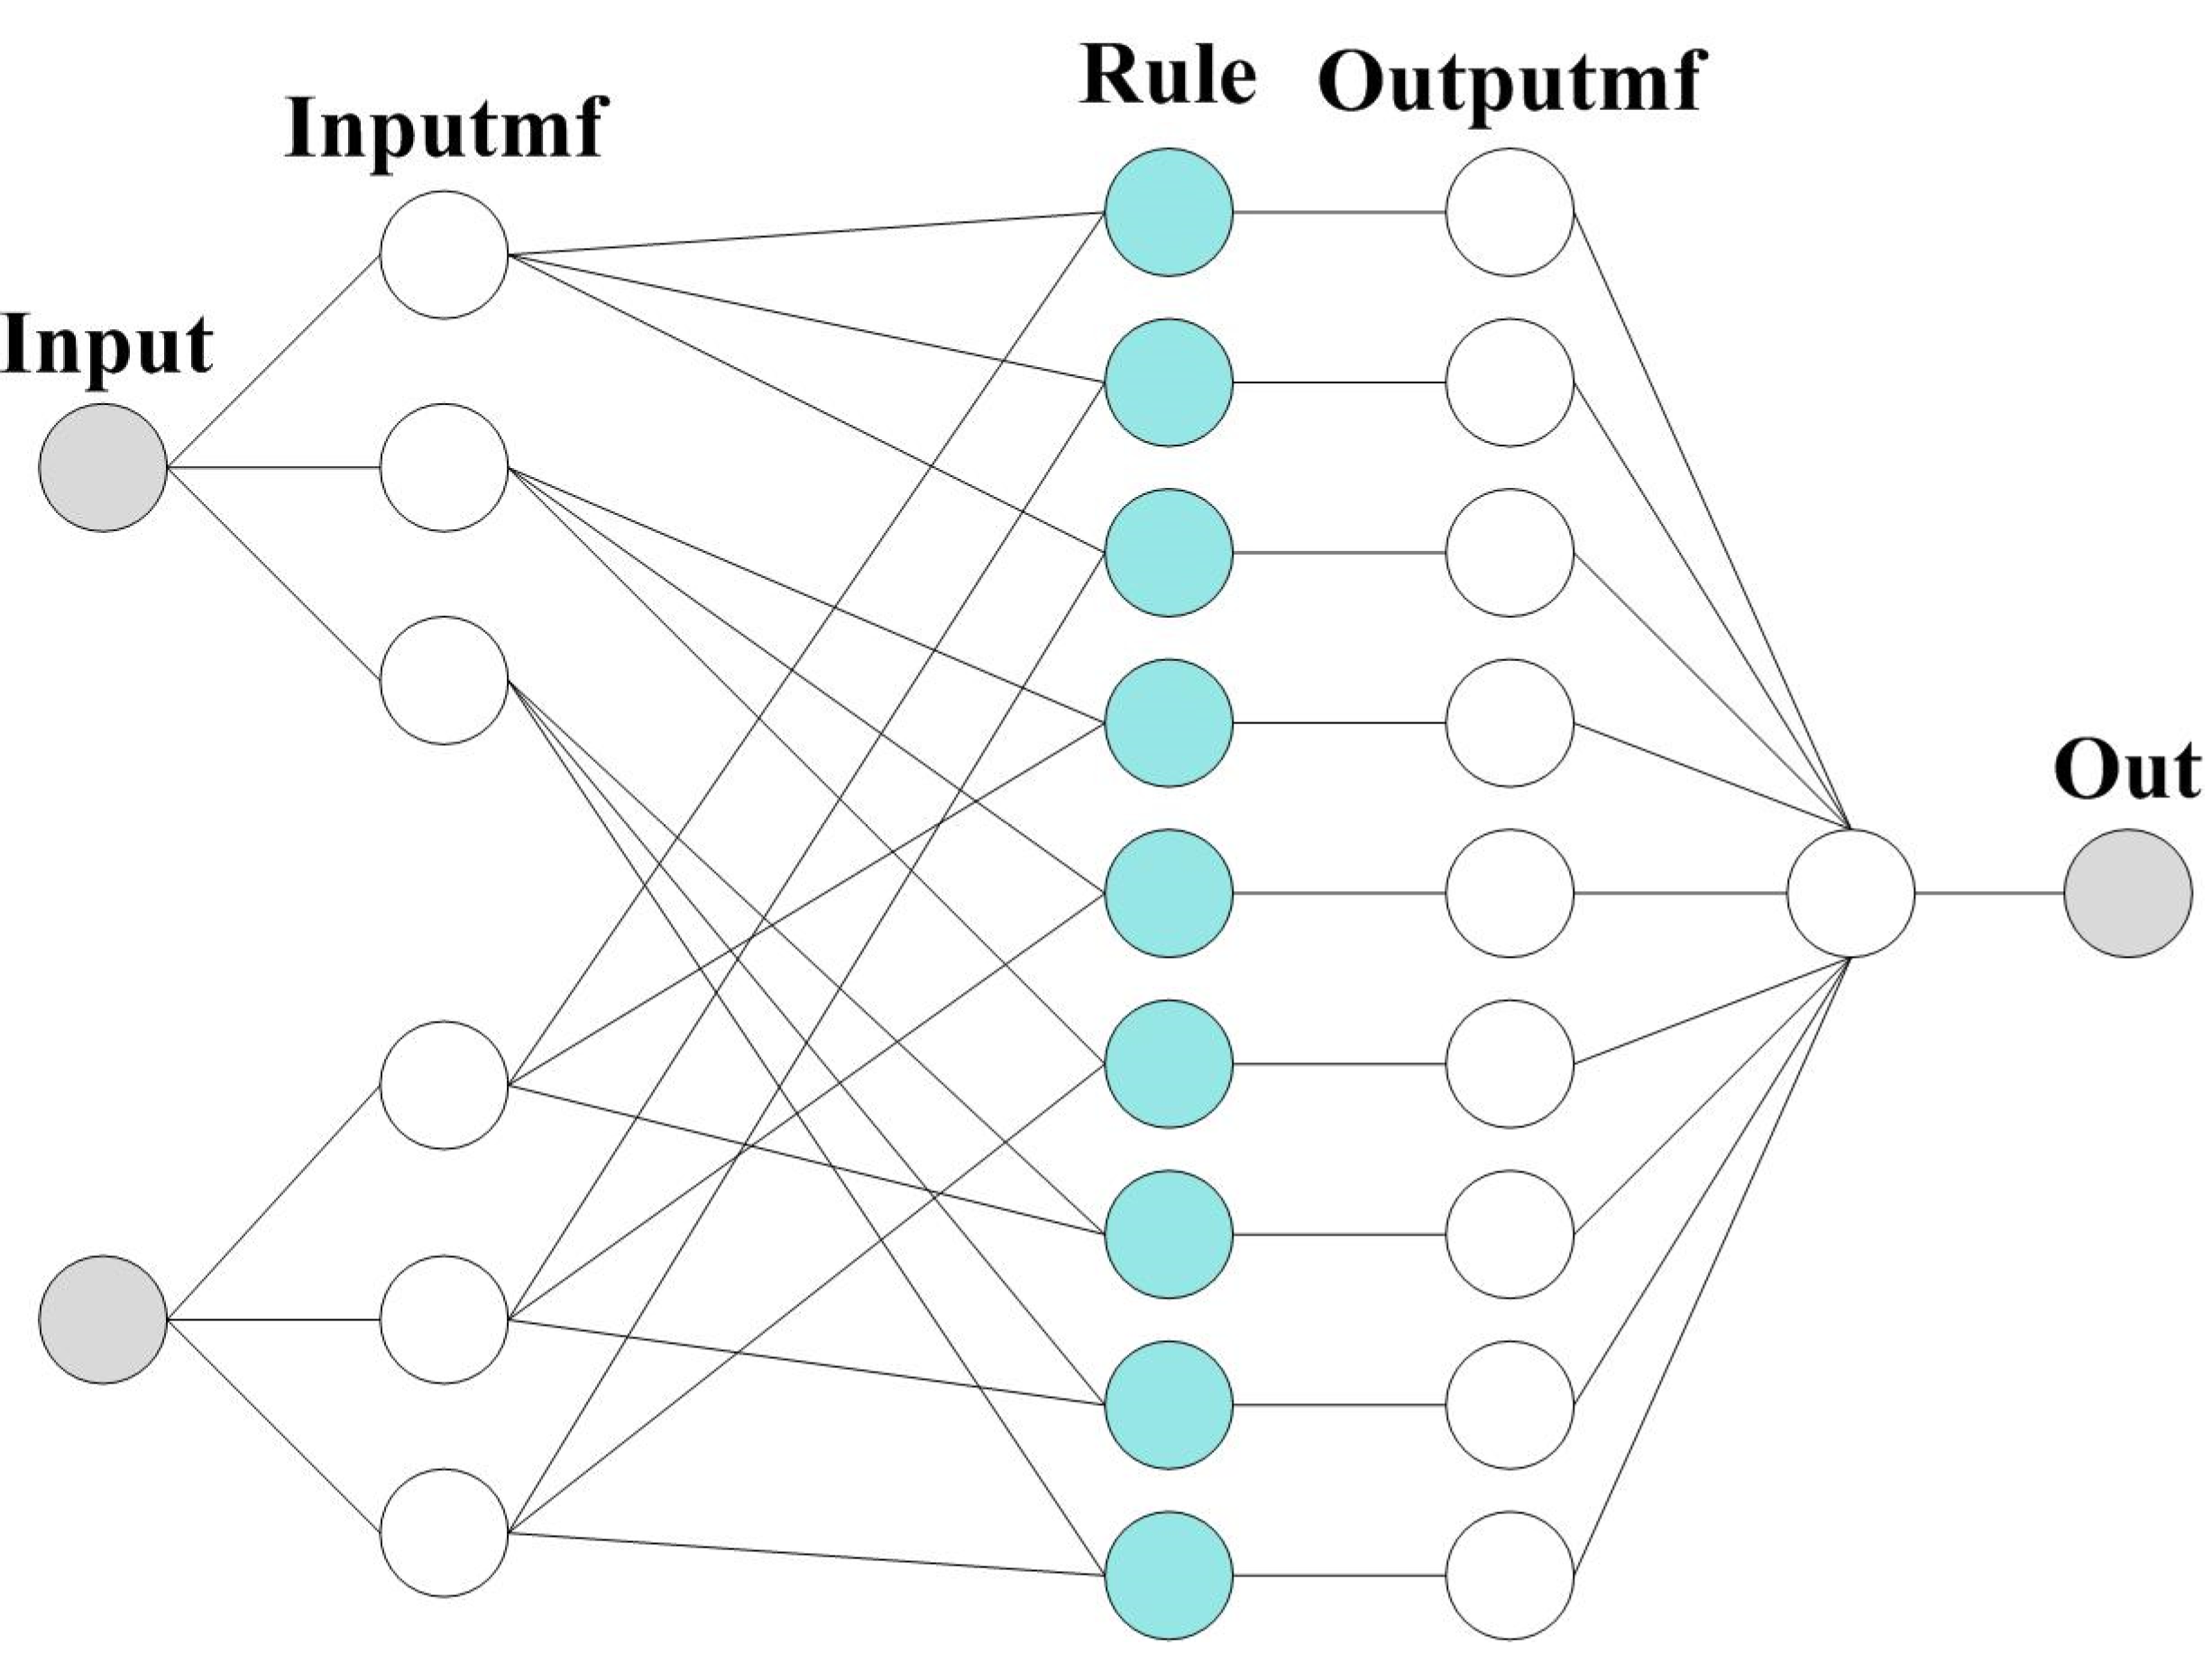
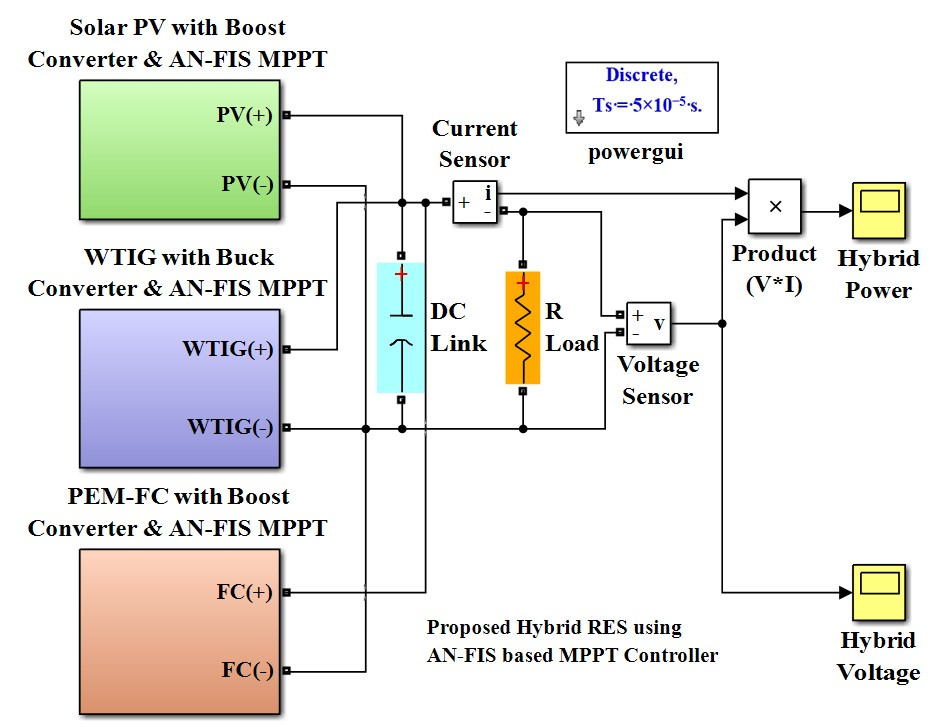
5. AN-FIS MPPT Controller
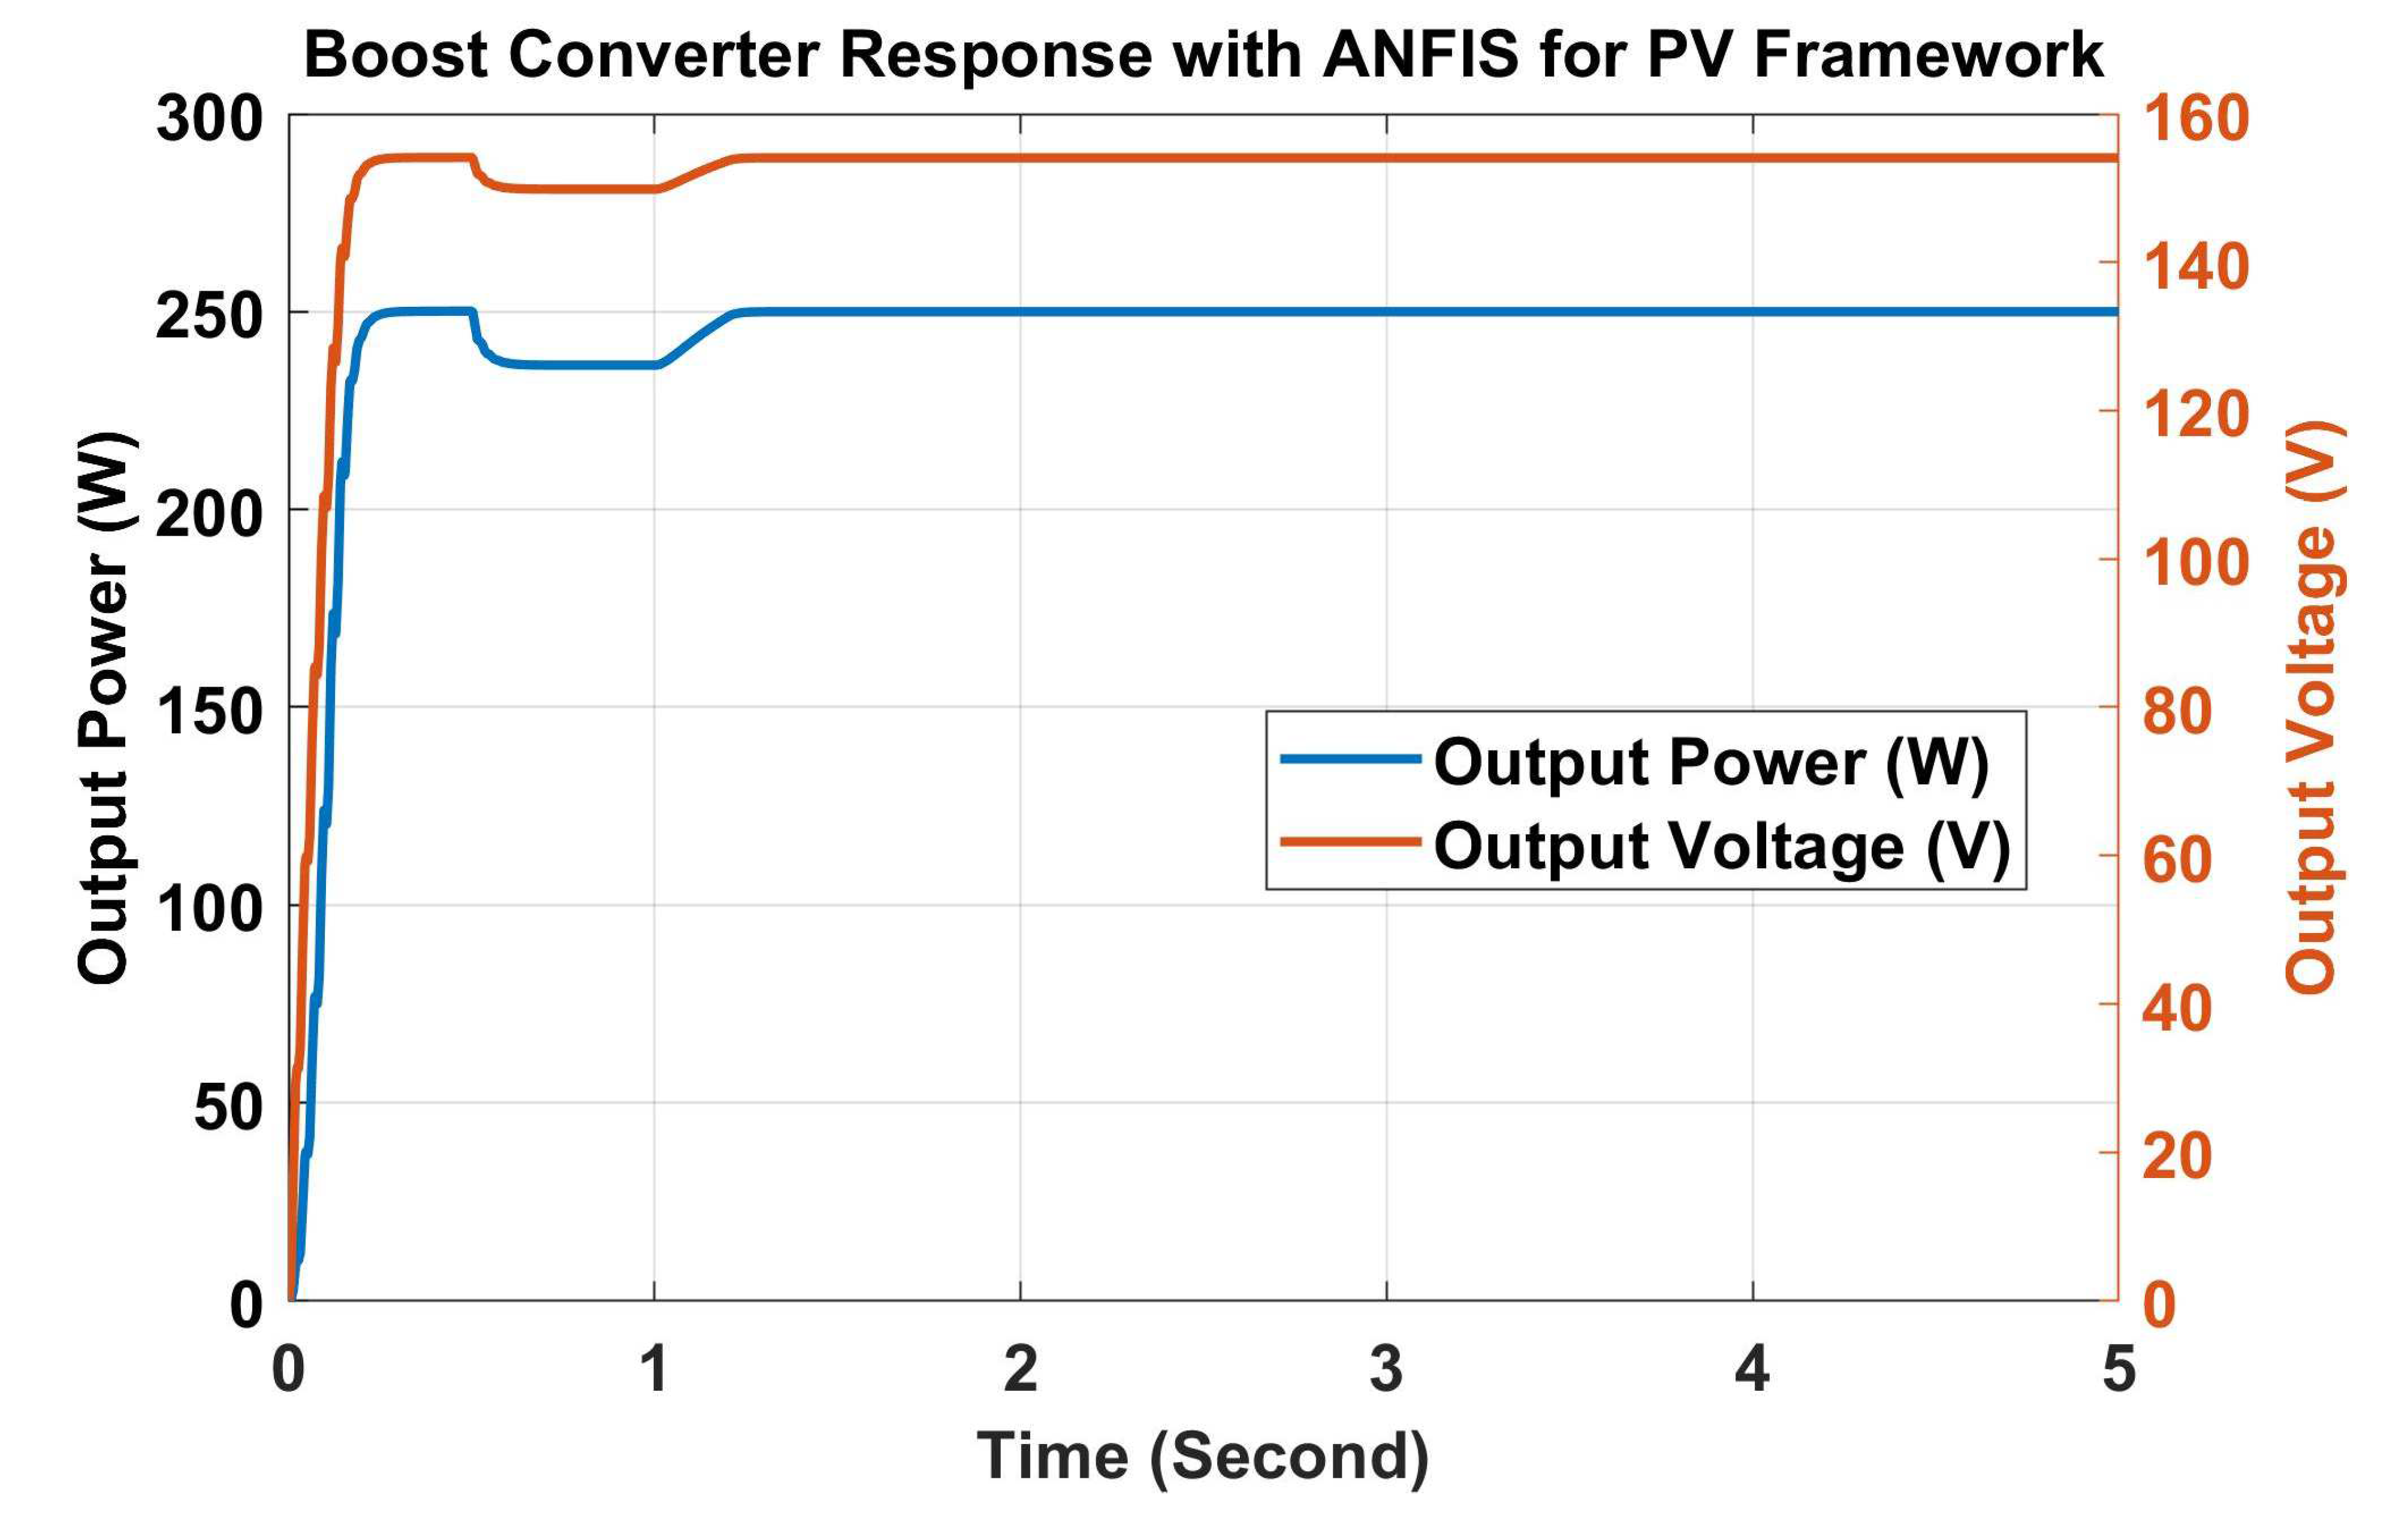
6. Results and Discussions
7. Comparison of Different MPPT Controllers for Different Systems
8. Conclusions
Author Contributions
Funding
Institutional Review Board Statement
Informed Consent Statement
Data Availability Statement
Acknowledgments
Conflicts of Interest
Nomenclature
| Abbreviations | Symbols | ||||
| AI | Artificial Intelligence | % | percentage | L | Inductor |
| AN-FIS | Adaptive Neuro-Fuzzy Inference System | second layer | lpm | Liter per minute | |
| AN-N | artificial neural network | bias of the hidden layer neurons | m/s | Meter per second | |
| DE | Differential-Evaluation | . | bias for the second layer neurons | mH | Mili Henary |
| FC | Fuel Cell | /ms | Per meter second | ns | series-connected cells in every array |
| F-LC | Fuzzy-Logic Controller | @ | at the rate | °C | Degree Celsius |
| GA | Genetic-Algorithm | ∆D | perturbation | P | Power |
| HFR | Hydrogen-Fuel-Rate | ∆E(k) | change in error | P1 | Present power |
| IN-C | Incremental-Conductance | µF | Micro Ferad | P2 | Power delay |
| MPP | Maxi-mum Power Point | A | Ampere | Pin | input power |
| MPPT | Maxi-mum Power Point Tracking | C0 | Output Capacitor | PMax | maximum output power at MPP |
| NB | negative-big | Cdc | dc link | Pmax | maximum power |
| NM | negative-medium | CS | Snubber-capacitance | PMPPT | output power at MPPT |
| NS | negative-small | D | duty-ratio | Pout | out power |
| ODE | Ordinary–Differential-Equation | deg./s | Degree per second | Pu | Per unit |
| P-&-O | perturb and observe | dI | change in current | qe | Electric charge |
| PB | positive-big | dV | change in voltage | RS | Snubber-resistance |
| PEM-FC | Proton Exchange Membrane Fuel Cell | E(k) and | Error | V | Voltage |
| PM | positive-medium | F | Frequency | V(k) | system’s Voltage |
| PS | positive-small | fs | Switching frequency | V(k − 1) | Voltage delay |
| PSC | partial shading conditions | I | current | Vmax | Maximum voltage at MPP |
| PSO | Particle-Swarm-Optimization | I(k) | system’s Current | Vmp | Voltage at the MPP |
| PV | photovoltaic | I(k − 1) | Current delay | Voc | open-circuit voltage |
| PWM | Pulse-Width-Modulation | IL | light generated current | W | Watt |
| RES | renewable energy sources | Imax | Maximum current at MPP | W/m2 | Watt per meter square |
| RR | Ramp rates | Imp | current at the MPP | wji | weighting given to the ith input unit’s link |
| SMC | Sliding-mode-control | Io | diode saturated current | wkj | weight on the jth input unit’s connections |
| SR | Solar-Radiation | Isc | short circuit current, | yk | Outputs of neurons |
| TC | temperature coefficient | kHz | Kilo Harz | Ω | Ohm |
| WS | Wind-Speed | ||||
| WT | wind turbines | ||||
| WTIG | WT base Induction Generator | ||||
| ZE | zero | ||||
References
- Benlahbib, B.; Bouarroudj, N.; Mekhilef, S.; Abdeldjalil, D.; Abdelkrim, T.; Bouchafaa, F. Experimental investigation of power management and control of a PV/wind/fuel cell/battery hybrid energy system microgrid. Int. J. Hydrogen Energy 2020, 45, 29110–29122. [Google Scholar] [CrossRef]
- Meenakshi Sundaram, B.; Manikandan, B.V.; Praveen Kumar, B.; Prince Winston, D. Combination of novel converter topology and improved MPPT algorithm for harnessing maximum power from grid connected solar PV systems. J. Electr. Eng. Technol. 2019, 14, 733–746. [Google Scholar] [CrossRef]
- Prince Winston, D.; Ganesan, K.; Samithas, D.; Baladhanautham, C.B. Experimental investigation on output power enhancement of partial shaded solar photovoltaic system. Energy Sources Part A Recovery Util. Environ. Eff. 2020. [Google Scholar] [CrossRef]
- El-Zoghby, H.M.; Bendary, A.F. A novel technique for maximum power point tracking of a photovoltaic based on sensing of array current using adaptive neuro-fuzzy inference system (ANFIS). Int. J. Emerg. Electr. Power Syst. 2016, 17, 547–554. [Google Scholar] [CrossRef]
- Ishaque, K.; Salam, Z.; Amjad, M.; Mekhilef, S. An improved particle swarm optimization (PSO)–based MPPT for PV with reduced steady-state oscillation. IEEE Trans. Power Electron. 2012, 27, 3627–3638. [Google Scholar] [CrossRef]
- Kolluru, V.R.; Mahapatra, K.; Subudhi, B. Real-time digital simulation and analysis of sliding mode and P&O MPPT algorithms for a PV system. Int. J. Emerg. Electr. Power Syst. 2015, 16, 313–322. [Google Scholar]
- García Márquez, F.P.; Peinado Gonzalo, A. A Comprehensive Review of Artificial Intelligence and Wind Energy. Arch Computat Methods Eng. 2021, 1–24. [Google Scholar] [CrossRef]
- Mosbah, M.; Khattara, A.; Becherif, M.; Arif, S. Optimal PV location choice considering static and dynamic constraints. Int. J. Emerg. Electr. Power Syst. 2017, 18, 10–24. [Google Scholar] [CrossRef]
- Malek, S. A simple tracking maximum power points method using stator flux orientation control for DFIG. Int. J. Ind. Electron. Drives 2015, 2, 191–202. [Google Scholar] [CrossRef]
- Sousa, S.M.; Gusman, L.S.; Lopes, T.A.S.; Pereira, H.A.; Callegari, J.M.S. MPPT algorithm in single loop current-mode control applied to dc–dc converters with input current source characteristics. Int. J. Electr. Power Energy Syst. 2022, 138, 107909. [Google Scholar] [CrossRef]
- Eid, A. Utility integration of PV-wind-fuel cell hybrid distributed generation systems under variable load demands. Int. J. Electr. Power Energy Syst. 2014, 62, 689–699. [Google Scholar] [CrossRef]
- Fathabadi, H. Novel standalone hybrid solar/wind/fuel cell power generation system for remote areas. Sol. Energy 2017, 146, 30–43. [Google Scholar] [CrossRef]
- Fathabadi, H. Novel highly accurate universal maximum power point tracker for maximum power extraction from hybrid fuel cell/photovoltaic/wind power generation systems. Energy 2016, 116, 402–416. [Google Scholar] [CrossRef]
- Nureddin, A.A.M.; Rahebi, J.; Ab-BelKhair, A. Power management controller for microgrid integration of hybrid PV/fuel cell system based on artificial deep neural network. Int. J. Photoenergy 2020, 2020, 8896412. [Google Scholar] [CrossRef]
- Belaid, S.; Rekioua, D.; Oubelaid, A.; Ziane, D.; Rekioua, T. A power management control and optimization of a wind turbine with battery storage system. J. Energy Storage 2022, 45, 103613. [Google Scholar] [CrossRef]
- Kumar, B.H.; Subburaj, V. Integration of RES with MPPT by SVPWM Scheme. Intell. Renew. Energy Syst. 2022, 157–178. [Google Scholar] [CrossRef]
- Lappalainen, K.; Wang, G.C.; Kleissl, J. Estimation of the largest expected photovoltaic power ramp rates. Appl. Energy 2020, 278, 115636. [Google Scholar] [CrossRef]
- Lappalainen, K.; Valkealahti, S. Experimental study of the maximum power point characteristics of partially shaded photovoltaic strings. Appl. Energy 2021, 301, 117436. [Google Scholar] [CrossRef]
- Ali AI, M.; Mohamed, H.R.A. Improved P&O MPPT algorithm with efficient open-circuit voltage estimation for two-stage grid-integrated PV system under realistic solar radiation. Int. J. Electr. Power Energy Syst. 2022, 137, 107805. [Google Scholar]
- Dash, S.K.; Garg, P.; Mishra, S.; Chakraborty, S.; Elangovan, D. Investigation of Adaptive Intelligent MPPT Algorithm for a Low-cost IoT Enabled Standalone PV System. Aust. J. Electr. Electron. Eng. 2022. [Google Scholar] [CrossRef]
- Matsukawa, H.; Koshiishi, K.; Koizumi, H.; Kurokawa, K.; Hamada, M.; Bo, L. Dynamic evaluation of maximum power point tracking operation with PV array simulator. Sol. Energy Mater. Sol. Cells 2003, 75, 537–546. [Google Scholar] [CrossRef]
- Khan, M.J.; Mathew, L. Fuzzy logic controller-based MPPT for hybrid photo-voltaic/wind/fuel cell power system. Neural Comput. Appl. 2019, 31, 6331–6344. [Google Scholar] [CrossRef]
- Hiyama, T.; Kitabayashi, K. Neural network based estimation of maximum power generation from PV module using environmental information. IEEE Trans. Energy Convers. 1997, 12, 241–247. [Google Scholar] [CrossRef]
- Chen, P.C.; Chen, P.Y.; Liu, Y.H.; Chen, J.H.; Luo, Y.F. A comparative study on maximum power point tracking techniques for photovoltaic generation systems operating under fast changing environments. Sol. Energy 2015, 119, 261–276. [Google Scholar] [CrossRef]
- Yadav, A.K.; Malik, J.; Chandel, S.S.; Khan, I.A.; Otaibi, S.A.; Alkhammash, H.I. Novel approach to investigate the influence of optimum tilt angle on minimum cost of energy based maximum power generation and sizing of PV systems: A case study of diverse climatic zones in India. IEEE Access 2021, 9, 110103–110115. [Google Scholar] [CrossRef]
- Yadav, A.K.; Malik, H. ANN- and Multiple Linear Regression-Based Modelling for Experimental Investigation of Photovoltaic Module Maximum Power Production under Outdoor Condition of Mountainous Region. In Springer Nature Book: Modern Maximum Power Point Tracking Techniques for Photovoltaic Energy Systems; Springer: Cham, Switzerland, 2020; pp. 229–245. [Google Scholar] [CrossRef]
- Fatima, K.; Minai, A.F.; Malik, H. Intelligent Approach-Based Maximum Power Point Tracking for Renewable Energy System: A Review. In Intelligent Data Analytics for Power and Energy Systems; Malik, H., Ahmad, M.W., Kothari, D., Eds.; Lecture Notes in Electrical Engineering; Springer: Singapore, 2022; Volume 802, pp. 373–405. [Google Scholar] [CrossRef]
- Chiu, Y.H.; Luo, Y.F.; Huang, J.W.; Liu, Y.H. An ANN-based maximum power point tracking method for fast changing environments. In Proceedings of the 6th International Conference on Soft Computing and Intelligent Systems, and The 13th International Symposium on Advanced Intelligence Systems, Kobe, Japan, 20–24 November 2012; pp. 715–720. [Google Scholar]
- Yadav, A.K.; Sharma, V.; Malik, H.; Chandel, S. Daily Array Yield Prediction of Grid-Interactive Photovoltaic Plant Using Relief Attribute Evaluator Based Radial Basis Function Neural Network. Renew. Sustain. Energy Rev. 2018, 81 Pt 2, 2115–2127. [Google Scholar] [CrossRef]
- Abu-Rub, H.; Iqbal, A.; Ahmed, S.M. Adaptive neuro-fuzzy inference system-based maximum power point tracking of solar PV modules for fast varying solar radiations. Int. J. Sustain. Energy 2012, 31, 383–398. [Google Scholar] [CrossRef]
- Shabbiruddin; Kanwar, N.; Jadoun, V.K.; Alotaibi, M.A.; Malik, H.E.; Nassar, M. Fuzzy-Based Investigation of Challenges for the Deployment of Renewable Energy Power Generation. Energies 2021, 15, 58. [Google Scholar] [CrossRef]
- Malik, H.; Yadav, A.K. A novel hybrid approach based on relief algorithm and fuzzy reinforcement learning approach for predicting wind speed. Sustain. Energy Technol. Assess. 2020, 43, 100920. [Google Scholar] [CrossRef]
- Vigya; Mahto, T.; Mukherjee, V.; Alotaibi, M.; Almutairi, A. Renewable Generation Based Hybrid Power System Control Using Fractional Order-Fuzzy Controller. Energy Rep. 2021, 7, 641–653. [Google Scholar] [CrossRef]
- Subudhi, B.; Pradhan, R. A comparative study on maximum power point tracking techniques for photovoltaic power systems. IEEE Trans. Sustain. Energy 2012, 4, 89–98. [Google Scholar] [CrossRef]


| Sr. No. | Technical Specification | Value |
|---|---|---|
| 01 | Voc of PV Array | 44 V |
| 02 | Isc of PV Array | 8.1 A |
| 03 | Vmp of PV Array | 34.7 V |
| 04 | Imp of PV Array | 7.8 A |
| 05 | TC of Voc (%/°C) | −0.36 |
| 06 | TC of Isc (%/°C) | 0.025 |
| 07 | IL of PV Array | 8.20 A |
| 08 | I0 of PV Array | 2.5 × 10⁻¹⁰ A |
| 09 | Ideality factor of a Diode | 0.98 |
| 10 | Shunt-resistance (Rp) | 3126.56 Ω |
| 11 | Series-resistance (Rs) | 0.52 Ω |
| 12 | qe (coulombs) | 1.6 × 10⁻¹⁹ |
| 13 | ns | 72 |
| 14 | Series-connected arrays for every string (Nss) | 2 |
| 15 | Parallel-connected arrays for every string (Npp) | 1 |
| 16 | Boltzmann constant (k) | 1.38 × 10⁻²³ |
| 17 | Maximum power (in W) | 270.66 |
| Sr. No. | Parameter | Value |
|---|---|---|
| 01 | Inductance (L) | 3 mH |
| 02 | Capacitance (Co) | 470 µF |
| 03 | Switching-frequency (fs) | 100 KHz |
| 04 | Input-Voltage (Vin) | 88 V |
| 05 | Duty-ratio (D) | Depending on the input and output voltages of the system |
| 06 | Load resistance | 100 Ohm (Ω) |
| Sr. No. | Specification | Significance |
|---|---|---|
| 01 | Output Power (Nominal) of WT Framework | 1200 W |
| 02 | Base WS (m/s) | 12 |
| 03 | Base rotation speed | 1 pu |
| 04 | Maximum-pitch-angle | 45 deg. |
| 05 | Maximum rate of change of pitch-angle | 2 (deg./s) |
| Induction Generator | ||
| 06 | Nominal power of induction generator (in VA) | 1200 (VA) |
| 07 | Line to line (L-to-L) voltage | 415.0 (Vrms) |
| 08 | Frequency (f) in Hz | 50 |
| 09 | Poles in Pairs | 4.0 |
| 10 | Constant of Inertia | 5.04 0 |
| 11 | Factor of Friction | 0.010 |
| Three-Phase Programmable Voltage Source | ||
| 12 | Positive-sequence (Vrms ph-ph) | 25,000 |
| 13 | Phase | 0 deg. |
| 14 | Frequency | 50 Hz |
| 15 | Load flow (generator type) | Swing |
| Three-Phase Transformer | ||
| 16 | Nominal power | 100 W |
| 17 | Frequency | 50 Hz |
| 18 | Voltage of winding 1 | 25,000 V |
| 18 | Voltage of winding 2 | 415 V |
| 20 | Magnetization resistance | 500 (pu) |
| Rectifier | ||
| 21 | Used the Bridge arm | 3 |
| 22 | Snubber-resistance (RS) | 1e5 Ohms |
| 23 | Snubber-capacitance (CS) | Inf |
| 24 | Power electronic device | Diodes |
| 25 | Output-capacitor | 1000 µF |
| Sr. No. | Specification | Significance |
|---|---|---|
| 01 | Inductor (L) | 3 mH |
| 02 | Output Capacitor (C0) | 470 µF |
| 03 | Switching frequency (fs) | 10 kHz |
| 04 | Input Voltage (V) | 300 V |
| 05 | Duty-ratio (D) | Varying |
| 06 | Load resistance | 100 Ω |
| Sr. No. | Technical Specification | Value |
|---|---|---|
| 01 | Number of cells in a PEM-FC | 48 |
| 02 | Rated-power | 1000 W |
| 03 | Performance in the form of voltage and current | 28.8 V @ 35 A |
| 04 | [H2] Supply valve-voltage | 12 V |
| 05 | Purging valve voltage | 12 V |
| 06 | Blower voltage | 12 V |
| 07 | External temperature | 5 to 30 °C |
| 08 | Maximum stack temperature | 65 °C |
| 09 | Range of H2 pressure (in bar) | 0.45–0.55 |
| 10 | Nominal stack efficiency | 40% |
| 11 | Flow rate at max output | 13 (lpm) |
| 12 | Hydrogen purity | 99.995% |
| 13 | Shut-down (Low voltage) | 24 V |
| 14 | Shut-down (Over current) | 42 A |
| 15 | Shut-down (Over temperature) | 65 °C |
| ∆D | Overshoot (%) | Transitions | Signal Statistics | ||
|---|---|---|---|---|---|
| Rise Time | Slew Rate | Amplitude | Time (s) | ||
| 0.1 | 1.872 | 37.408 ms | 1.522 (/ms) | 134.3 | 3.263 |
| 0.01 | 191.067 | 333.056 μs | 8.839 (/ms) | 148.4 | 1.99 |
| 0.001 | 1.822 | 167.375 ms | 642.381 (/s) | 206.8 | 2.674 |
| ∆D(k) | E(k) | |||||||
|---|---|---|---|---|---|---|---|---|
| NB | NM | NS | ZE | PS | PM | PB | ||
| ∆E(k) | NB | ZE | ZE | NM | NS | PM | PM | PB |
| NM | ZE | ZE | NS | ZE | PM | PS | PB | |
| NS | ZE | ZE | ZE | ZE | PM | PS | PB | |
| ZE | NM | NB | ZE | NM | PM | PS | PB | |
| PS | NM | BB | ZE | NM | ZE | ZE | ZE | |
| PM | NM | NB | PS | NM | ZE | ZE | ZE | |
| PB | NM | NB | PM | NM | ZE | PS | ZE | |
| ∆D(k) | E(k) | |||||
|---|---|---|---|---|---|---|
| NB | NS | ZE | PS | PB | ||
| ∆E(k) | NB | ZE | NS | ZE | NM | PM |
| NS | ZE | ZE | ZE | NS | PS | |
| ZE | ZE | ZE | ZE | ZE | PS | |
| PS | NM | NM | NB | ZE | PS | |
| PB | NM | NM | BB | ZE | ZE | |
| ∆E(k) | E(k) | |||||
|---|---|---|---|---|---|---|
| NB | NS | ZE | PS | PB | ||
| ∆D(k) | NB | NB | NS | NS | ZE | ZE |
| NS | NB | NS | NS | ZE | PS | |
| ZE | NS | NS | ZE | PS | PS | |
| PS | NS | ZE | PS | PS | PB | |
| PB | ZE | ZE | PS | PS | PB | |
| Sr. No. | Procedure | No. of Samples | MSE | Regression |
|---|---|---|---|---|
| For PV | ||||
| 1 | Training | 700.0 | 1.047 × 10⁻⁵ | 1.660 × 10⁻¹ |
| 2 | Validating | 150.0 | 1.239 × 10⁻⁵ | 1.334 × 10⁻¹ |
| 3 | Testing | 150.0 | 1.015 × 10⁻⁵ | 8.617 × 10⁻² |
| For WTIG | ||||
| 1 | Training | 3778 | 8.23371 × 10⁻² | 2.486 × 10⁻¹ |
| 2 | Validating | 810 | 7.98225 × 10⁻² | 2.33441 × 10⁻¹ |
| 3 | Testing | 810 | 8.55248 × 10⁻² | 2.2827 × 10⁻¹ |
| For PEM-FC | ||||
| 1 | Training | 3500 | 8.43061 × 10⁻² | 1.55297 × 10⁻¹ |
| 2 | Validating | 750 | 7.80607 × 10⁻² | 2.19705 × 10⁻¹ |
| 3 | Testing | 750 | 8.51936 × 10⁻² | 5.60816 × 10⁻¹ |
Publisher’s Note: MDPI stays neutral with regard to jurisdictional claims in published maps and institutional affiliations. |
© 2022 by the authors. Licensee MDPI, Basel, Switzerland. This article is an open access article distributed under the terms and conditions of the Creative Commons Attribution (CC BY) license (https://creativecommons.org/licenses/by/4.0/).
Share and Cite
Khan, M.J.; Kumar, D.; Narayan, Y.; Malik, H.; García Márquez, F.P.; Gómez Muñoz, C.Q. A Novel Artificial Intelligence Maximum Power Point Tracking Technique for Integrated PV-WT-FC Frameworks. Energies 2022, 15, 3352. https://doi.org/10.3390/en15093352
Khan MJ, Kumar D, Narayan Y, Malik H, García Márquez FP, Gómez Muñoz CQ. A Novel Artificial Intelligence Maximum Power Point Tracking Technique for Integrated PV-WT-FC Frameworks. Energies. 2022; 15(9):3352. https://doi.org/10.3390/en15093352
Chicago/Turabian StyleKhan, Mohammad Junaid, Divesh Kumar, Yogendra Narayan, Hasmat Malik, Fausto Pedro García Márquez, and Carlos Quiterio Gómez Muñoz. 2022. "A Novel Artificial Intelligence Maximum Power Point Tracking Technique for Integrated PV-WT-FC Frameworks" Energies 15, no. 9: 3352. https://doi.org/10.3390/en15093352
APA StyleKhan, M. J., Kumar, D., Narayan, Y., Malik, H., García Márquez, F. P., & Gómez Muñoz, C. Q. (2022). A Novel Artificial Intelligence Maximum Power Point Tracking Technique for Integrated PV-WT-FC Frameworks. Energies, 15(9), 3352. https://doi.org/10.3390/en15093352