Abstract
The work aimed to solve the problem of determining, validating, and transferring model parameters of flooding using chemical enhanced oil recovery (EOR) from a core experiment to a full-scale hydrodynamic model. For this purpose, a digital hydrodynamic model describing the process of oil displacement by the surfactant and polymer solution on the core is created and the digital model is matched to achieve convergence with the historical data. This approach allows the uncertainties associated with the limited number of experiments to be removed to fully describe the parameters of the chemical surfactant polymer flooding model and form a database that could subsequently be replicated at various field sites, having the composition of reservoir fluids and distribution of rock composition in the core material as the basis. Besides, the digital model allows for verification of physical and chemical properties of surfactants and polymers, values of the adsorption of chemical agents on rocks, and the behavior of relative permeability in the hydrodynamic model of EOR before making predictions on the full-scale model and to improve the quality of forecast cases.
1. Introduction
Hydrodynamic simulation of laboratory oil displacement tests with water is a convenient tool for qualitative and quantitative determination of displacement parameters in the evaluation of chemical EOR effects [1,2,3]. A number of parameters in the study of oil displacement by surfactants and polymers can be measured and quantified, for example, the concentration of solutions. It is possible to customize the model on them. The general picture of displacement can be understood by visualization methods using a microscope on thin sections or by tomography methods [4,5,6]. It allows uncertainty to be estimated and experimental conditions and regimes to be specified before costly, time-consuming experiments are performed [7,8,9]. For example, the authors [10] determined the influence of gravitational forces and filtration rate on the experimental determination of relative phase permeabilities; the influence of shallow inhomogeneities at the core level was shown. In the work by [11], simulation of core experiments significantly accelerated and facilitated the process of determining the characteristic relative phase permeabilities. In a study of characteristic relative phase permeabilities [12,13,14,15,16] using simulators, the limits (capillary number, heterogeneity) of 1D core model applications were established, and important conclusions about model constraints and assumptions were made. In the work by [17], the authors were able to tune physical and chemical properties and displacement characteristics, including relative phase permeabilities and capillary logarithm value at interpolation transition, to new relative phase permeabilities of an oil displacement surfactant core experiment using simulation and tuning to actual data from the oil displacement core experiment. At the same time, in the work by [18], it was also possible to identify the shortcomings of simulators in the simulation of some EORs.
The proposed methodology is convenient because when performing experiments under laboratory conditions, a qualitative and accurate recording of input and output parameters with high-precision laboratory equipment is assumed, which cannot be obtained in the field conditions, where the measurement of parameters is complicated, and in-situ and geological processes introduce much uncertainty.
Despite a number of limitations on full-scale models associated with scaling results from core models due to heterogeneity—saturation and capillary pressure [19]—there are several parameters that do not require scaling at all and do not depend on saturation, e.g., adsorption, residual resistance factor, and inaccessible pore volume.
Numerous works are devoted to modeling core experiments, where the authors propose their own approaches and use various models from analytical to numerical ones used in various commercial simulators [7,13,17,20]. There is much to argue about the effectiveness and shortcomings of the models used; however, the goal in describing the processes of oil displacement by chemical agents should be clear—the model should qualitatively describe the filtration process and be able to remove a number of uncertainties that are impossible or too labor-intensive to perform in laboratory conditions. However, in most of the works by the authors, such model tuning parameters as the volume of displaced oil and water, surfactant and polymer concentrations, and pressure gradients are indicated [20,21,22,23].
Having obtained the tuned and adapted model of the experiment, it is possible, with the help of the simulator, to perform experiments on other modes and under other conditions, which allows us to go a little beyond the experiment and beyond the restrictions related to technical and temporal capabilities of the laboratory. In turn, adjusting the hydrodynamic model to the experiment allows us to determine or confirm the parameters for further full-scale simulation quite accurately. All of this allows us to see and look for further ways of development [24,25] and improve the quality of forecasts when using hydrodynamic models and improve forecast reliability in simulations.
2. Materials and Methods
The initial data for modeling and matching were the actual results of experiments on the displacement of oil on the core by a slug of agents (polymer and surfactant) after the stage of water injection.
The studies were carried out using the Autoflood 700 apparatus for flow testing from Vinci Technologies S.A. (92022 Nanterre, France). The equipment is designed to perform physical simulation of coreflood processes under reservoir conditions. Lines are connected to the input and output of the reservoir model, to which differential pressure transducers are connected through a system of pneumatic valves in order to measure the pressure drop across a model. The valve system enables transducers to be switched with different measuring ranges without stopping the displacement process. The outlet line of the core holder is connected to a fluid collector, which measures the volume of effluent samples.
The accuracy in determining physical parameters during the coreflood test did not exceeded:
- -
- Temperature in the oven: ±0.5 °C;
- -
- Pressure: 0.1% of the maximum value;
- -
- Effluent fluid volumes: 0.1 cm3.
The viscosities of polymer and surfactant solutions were measured by viscometer Physica MCR 301 (company Anton Paar, Graz, Austria).
In general, the method of adapting the results of experiments is based on an iterative process of correcting adsorption parameters, such as dead pore volume and residual resistance factor, as well as the capillary number, at which the relative phase permeabilities switch from the water–oil system to the water solution of the surfactant–oil system. These are the main parameters of uncertainty in a laboratory experiment and allow the model the model to be adjusted to the actual experimental data.

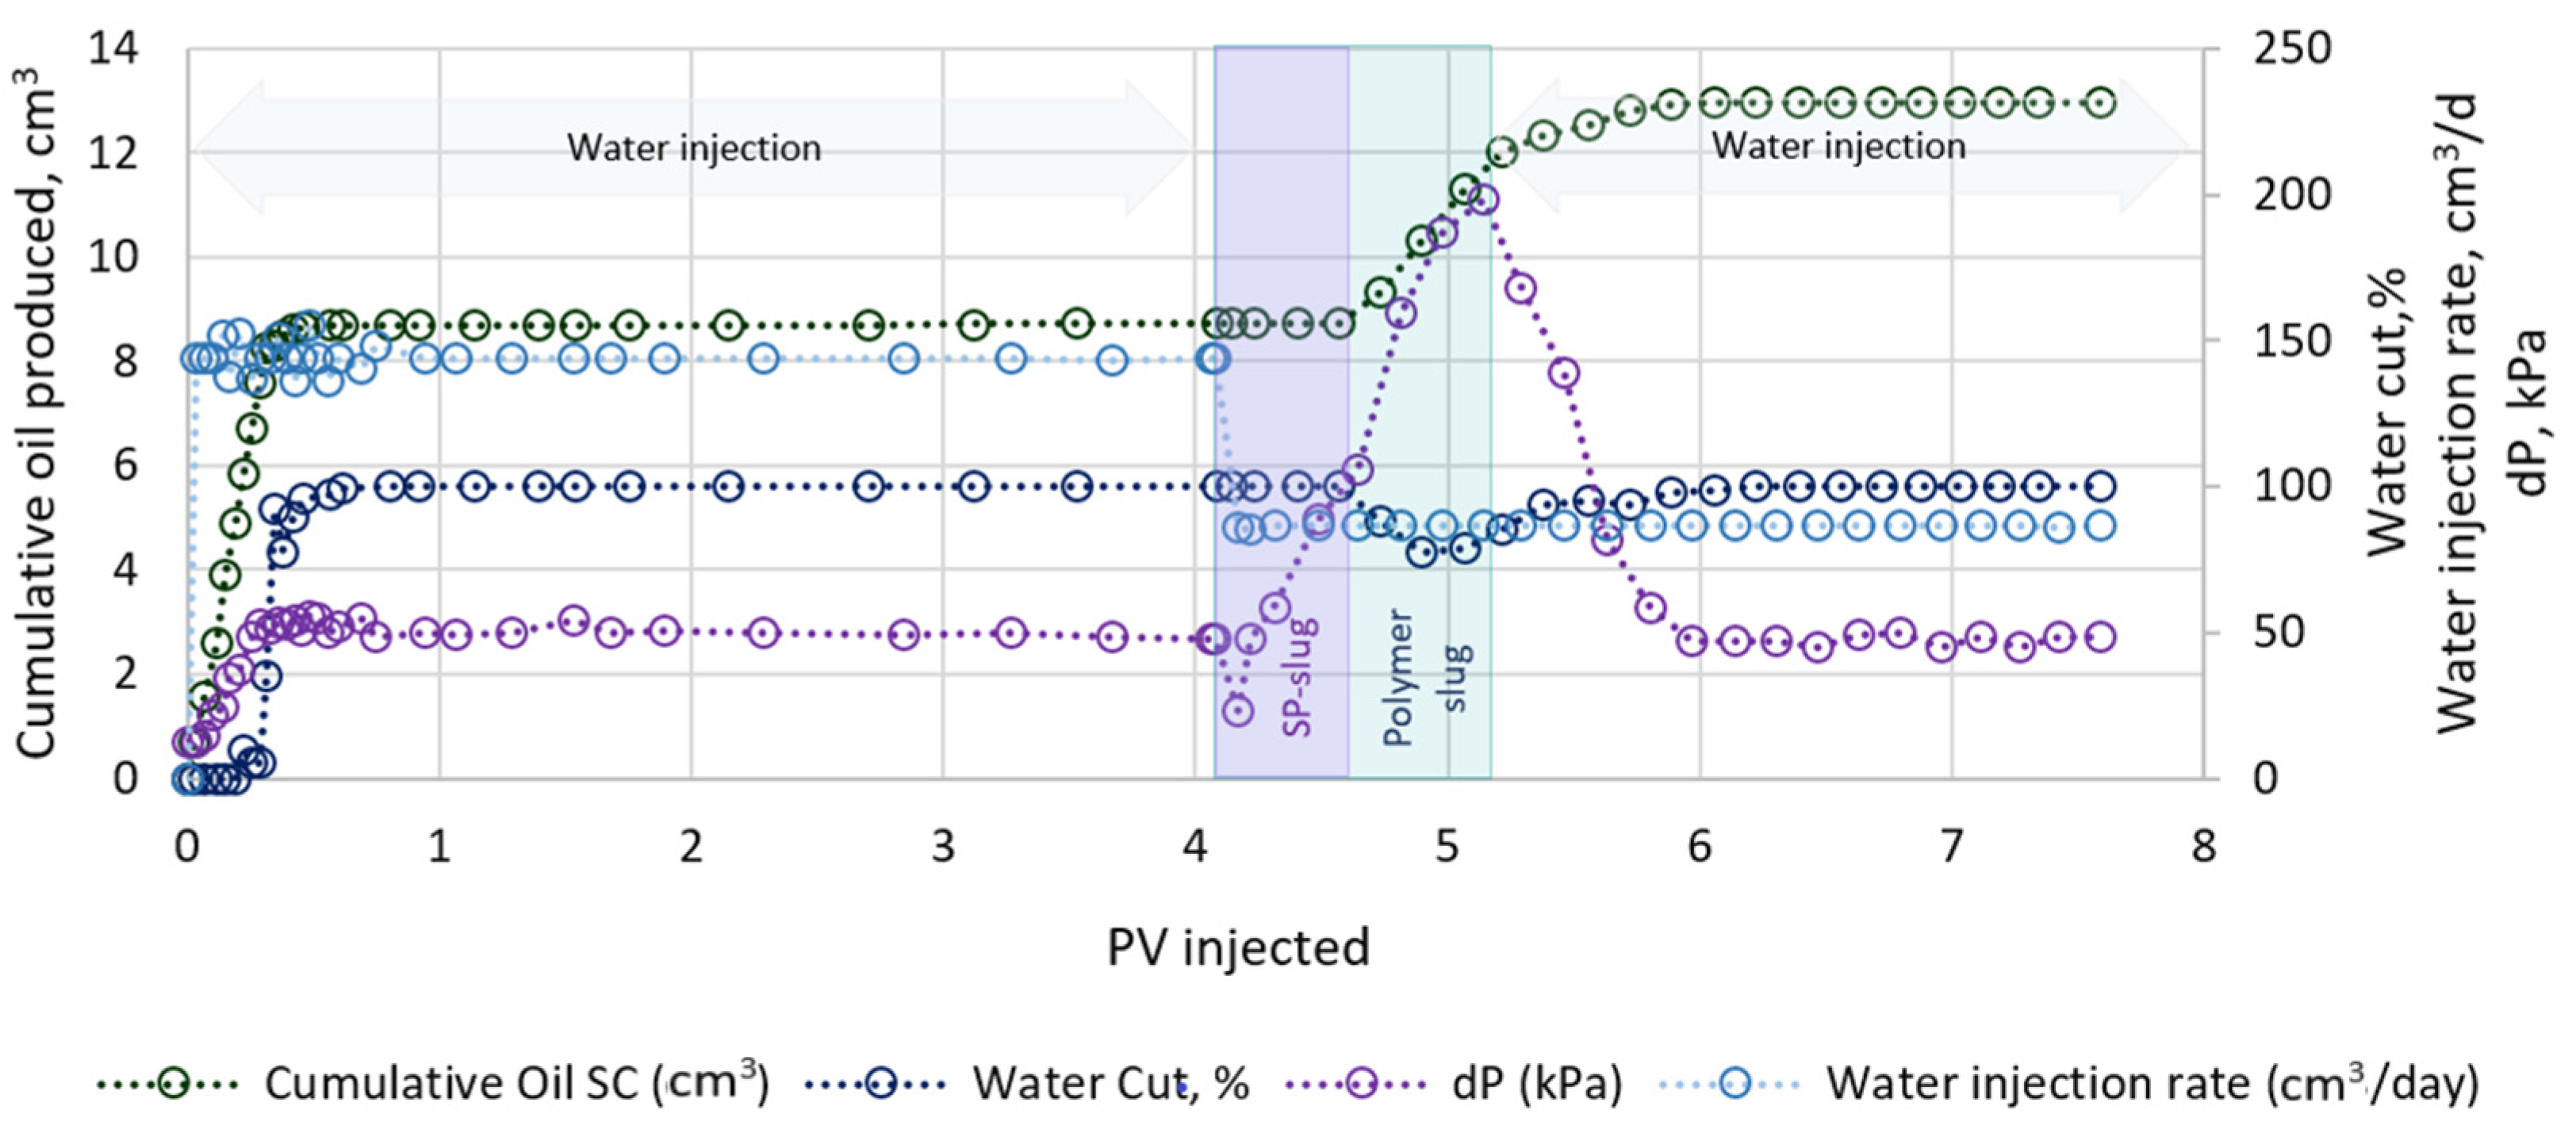
Figure 1.
Dynamics of oil yield, water cut, water injection, and pressure drop during the experiment.
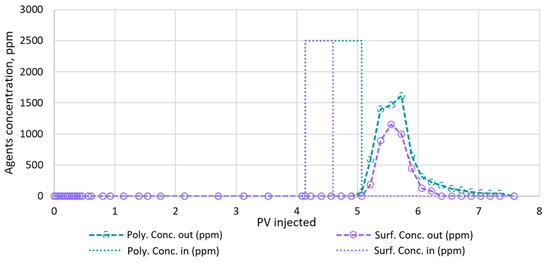
Figure 2.
Agent concentrations at sample inlet and outlet.

Table 1.
Agent injection modes (PV—pore volumes).
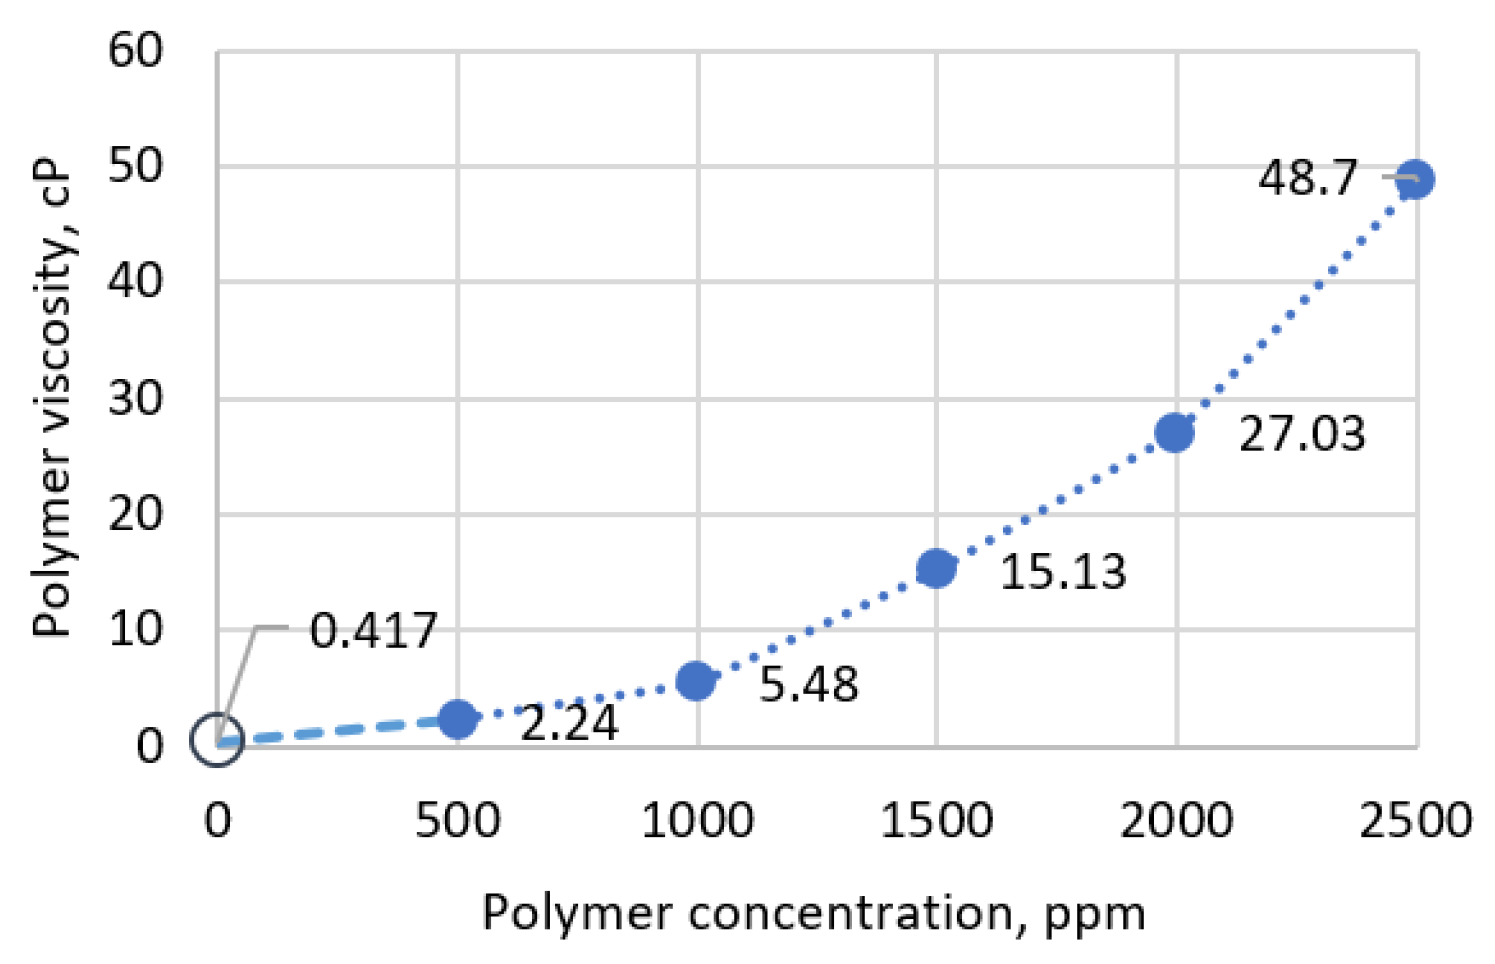
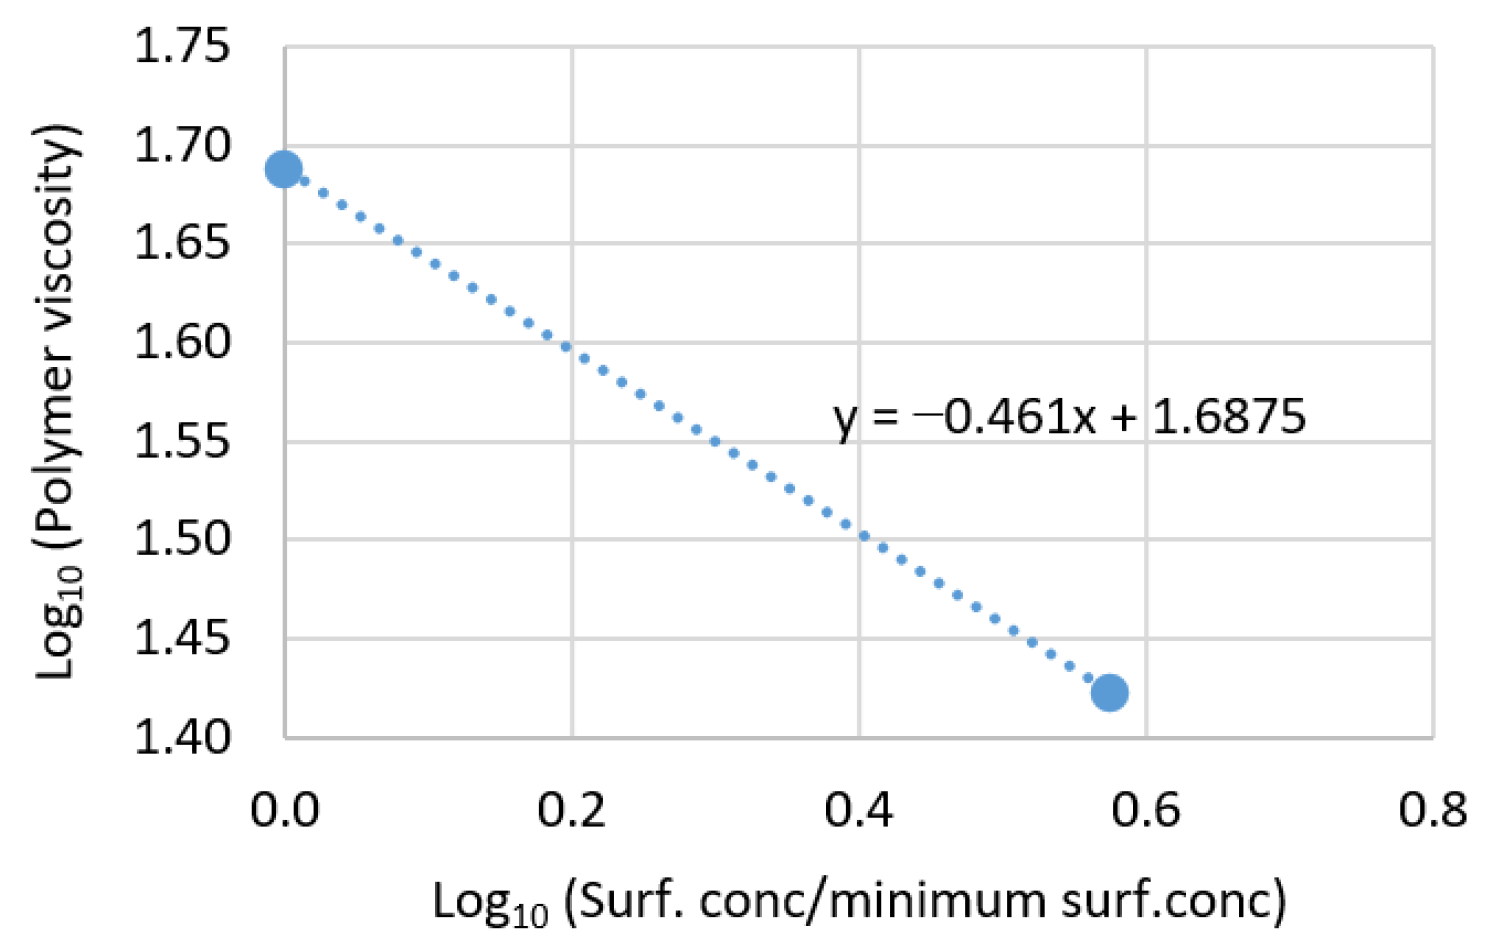
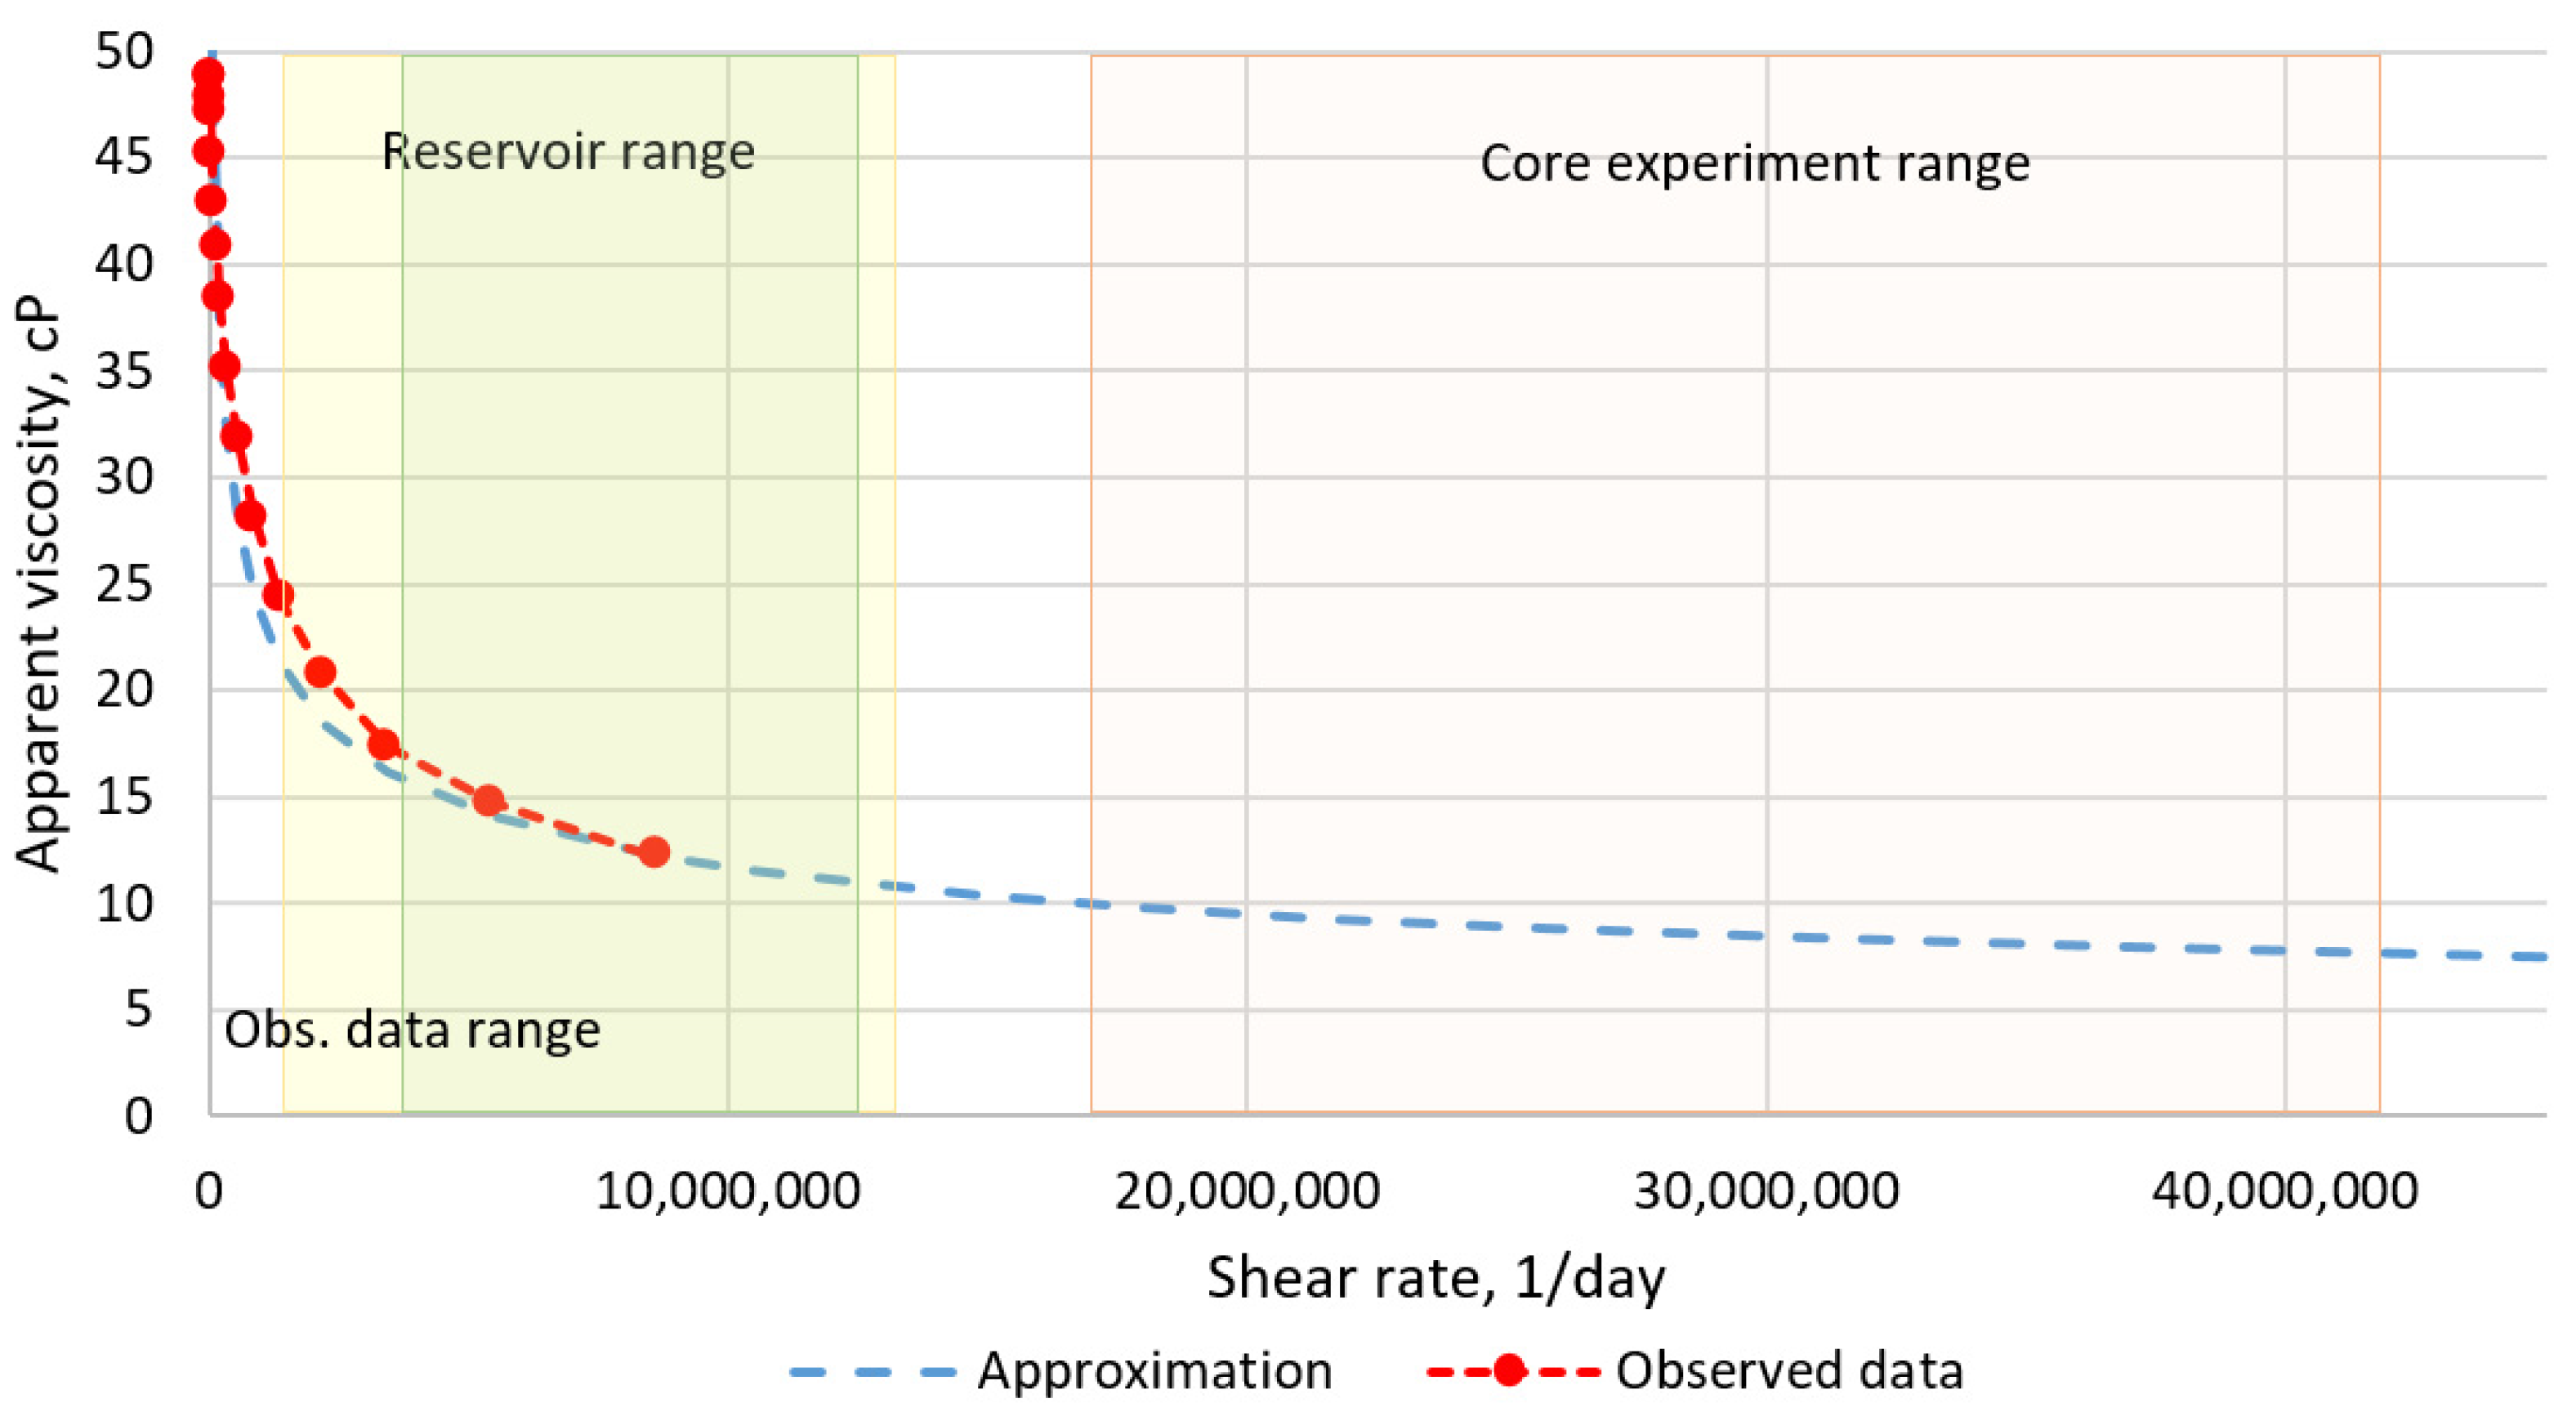
The parameters of the polymer and surfactant solutions obtained from static experiments were used as input data: the dependence of polymer viscosity on its concentration (Figure 3), the influence of surfactant presence and concentration on polymer viscosity (Figure 4), and the effect of shear rate on polymer viscosity (Figure 5). When studying the effect of surfactants on the viscosity of the polymer, a limited number of measurements were performed, which made it possible to approximate the viscosity of the polymer from the surfactant concentration for only two points. This, in turn, also introduced uncertainty into the calculations, but allowed us to estimate the viscosity of the polymer for the boundaries of the studied concentrations. These parameters were determined directly under laboratory conditions. One of the steps in tuning the model was to select the extrapolation dependence of polymer viscosity behavior on shear rate in intervals that the experiment could not cover. The extrapolation dependence is described using a power function (this function is a function of a hydrodynamic simulator). Moreover, the selection of viscosity extrapolation parameters into the area of high filtration rates due to high gradients in the real reservoir will help solve the problem of scaling oil viscosity at the averaged distance from the well.

Figure 3.
Influence of polymer concentration on polymer solution viscosity.
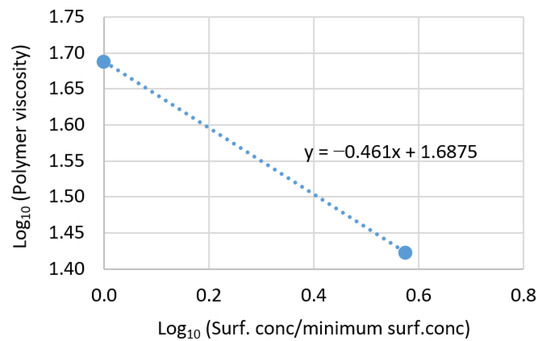
Figure 4.
Influence of surfactant presence and its concentration on polymer solution viscosity.
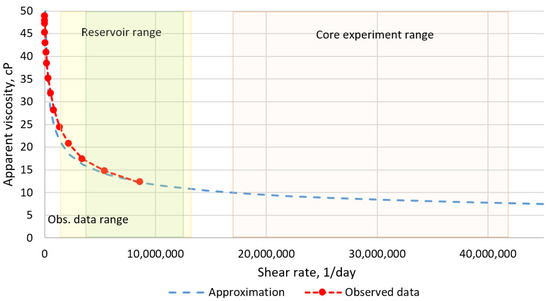
Figure 5.
Effect of shear rate on the viscosity of the polymer solution.
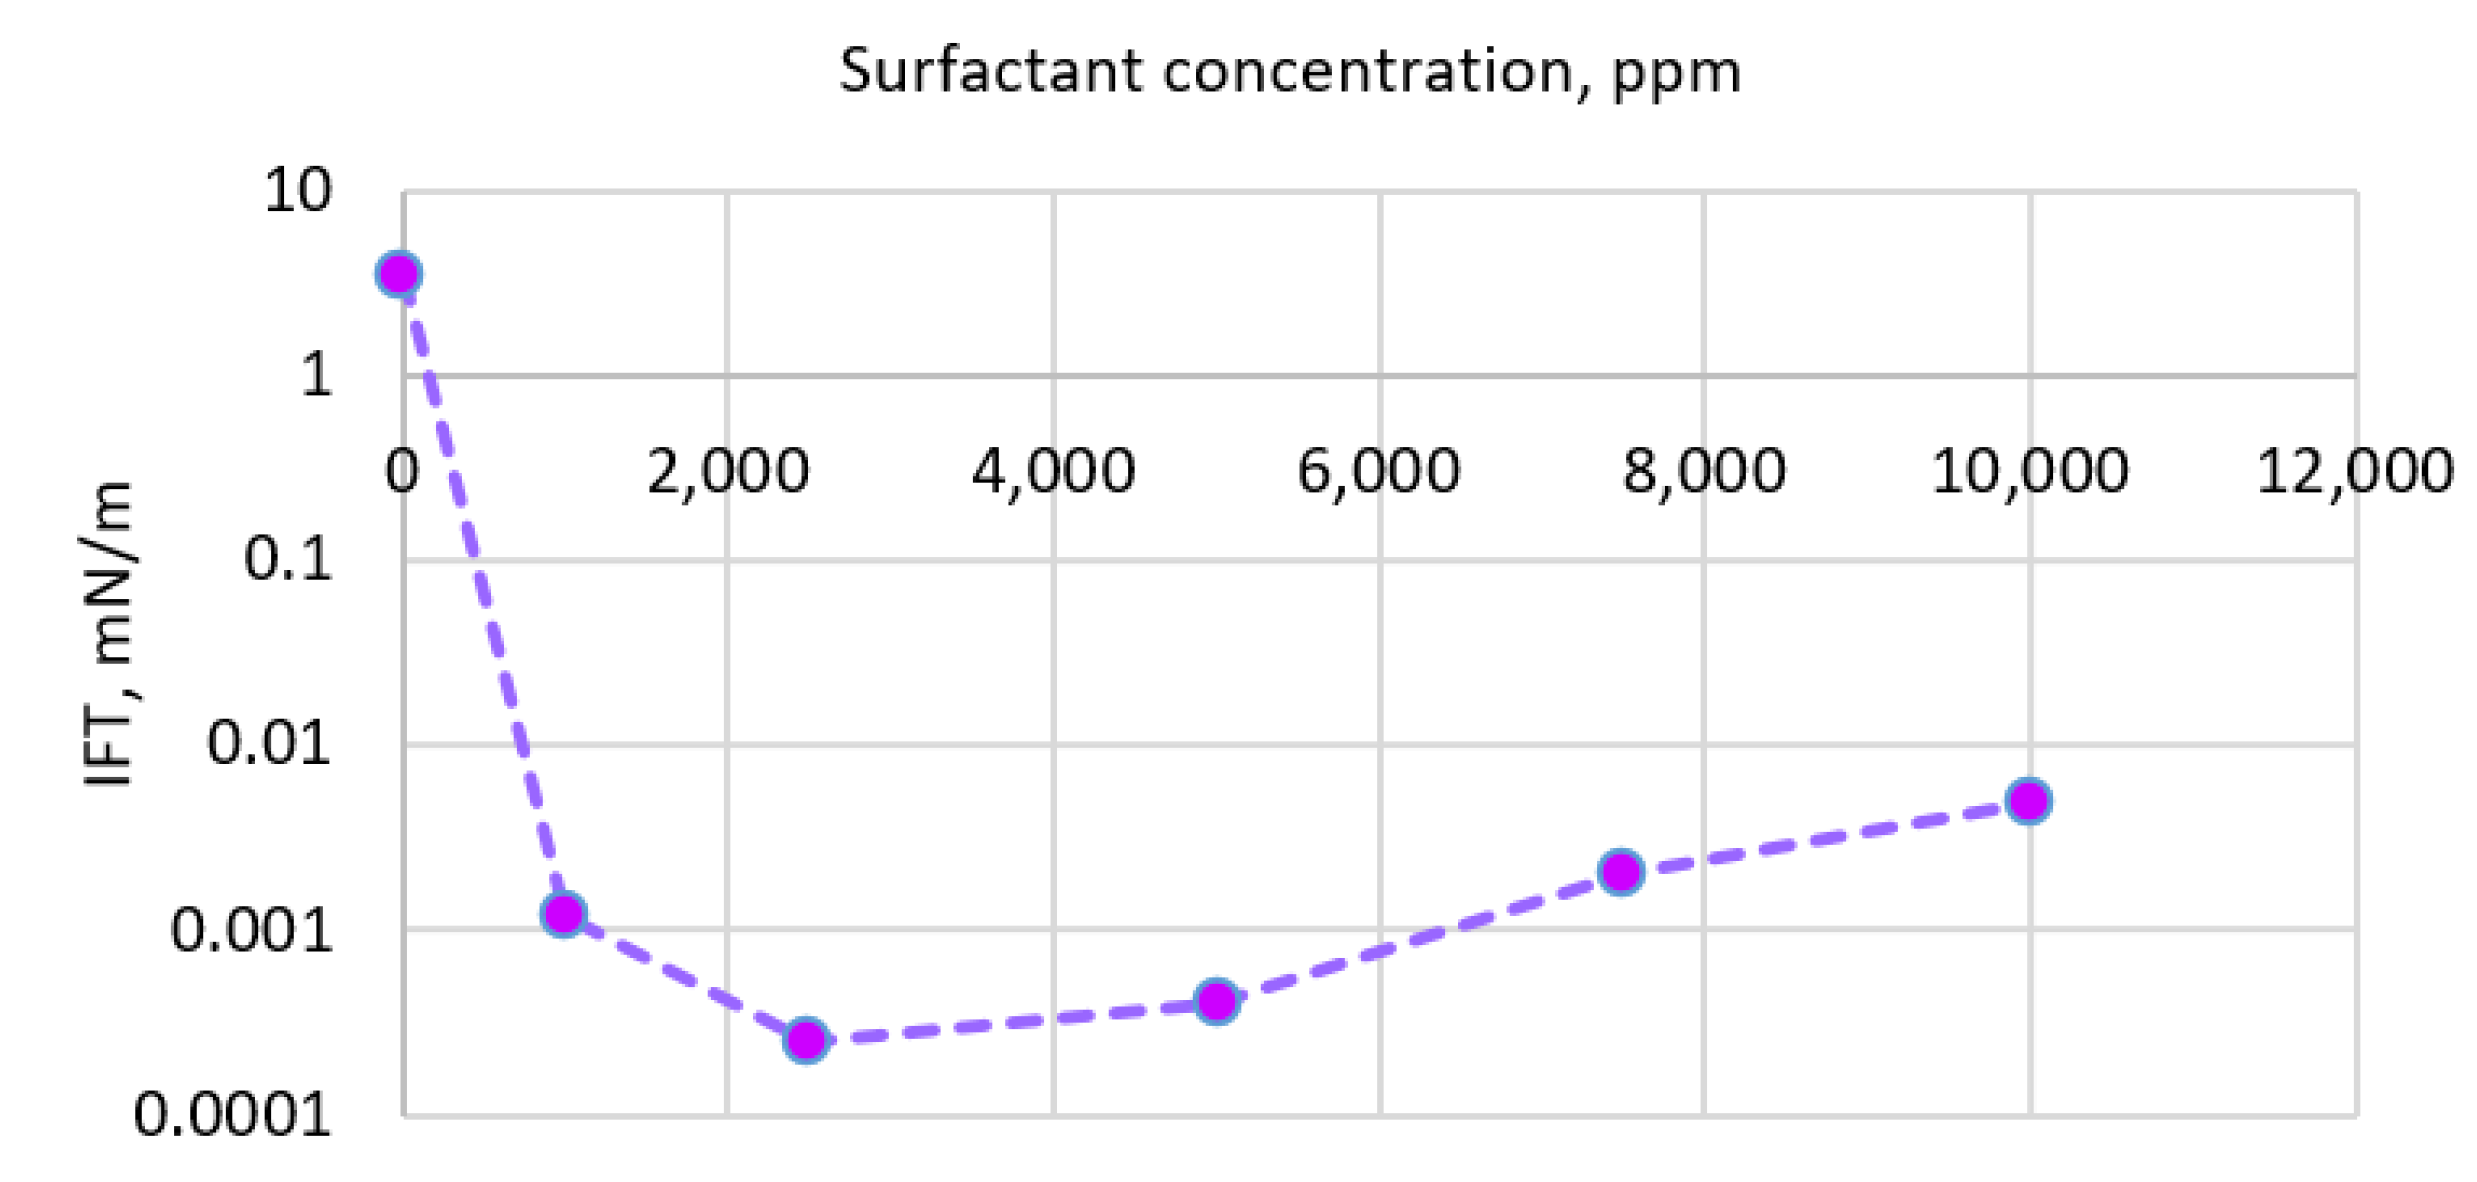
To simulate the interfacial tension, the function of surfactant concentration influence was used, defined as the dependence obtained by direct determination in the laboratory conditions (Figure 6).
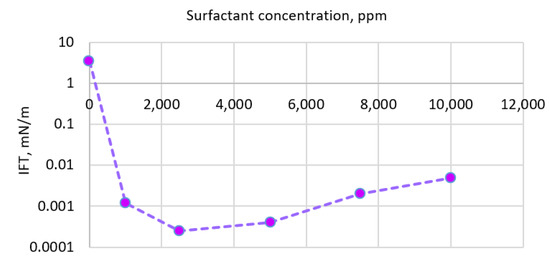
Figure 6.
Dependence of interfacial tension on surfactant concentration.
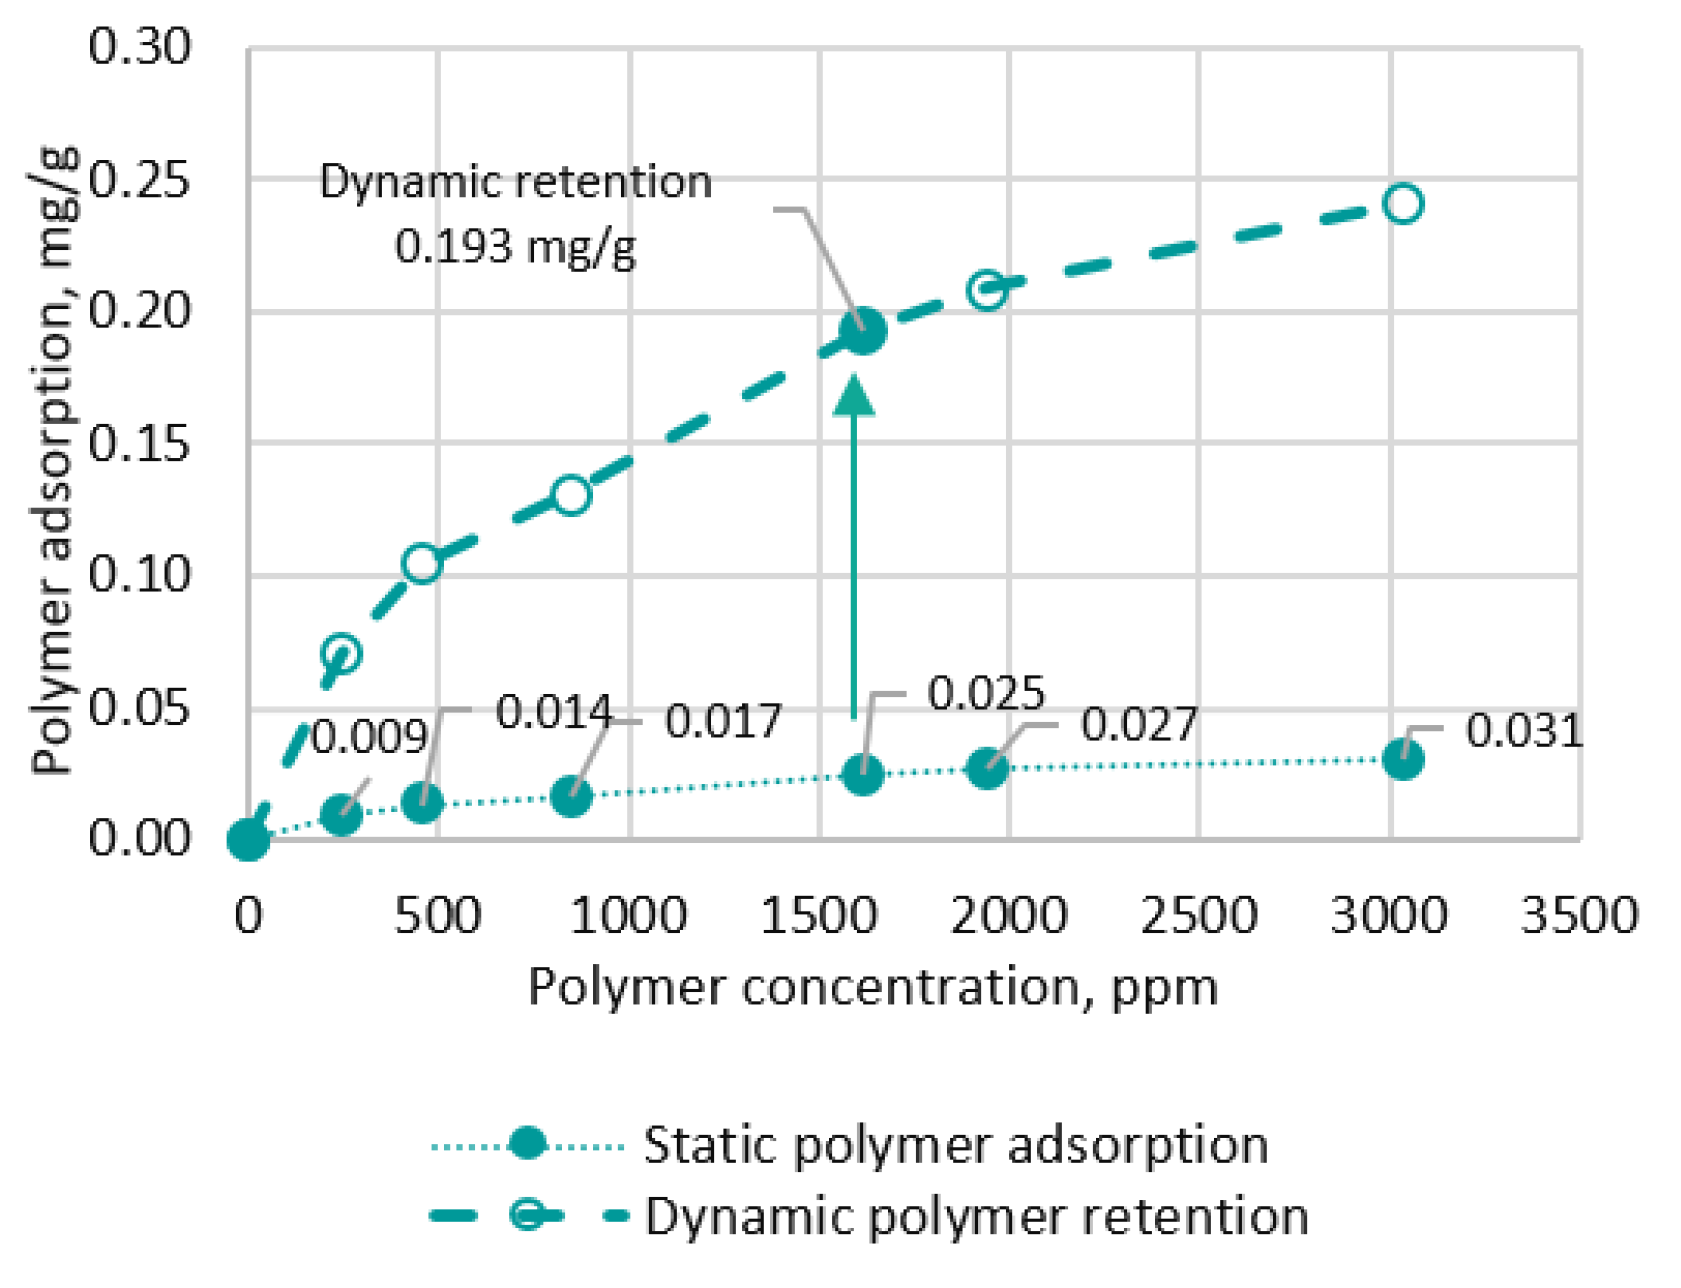
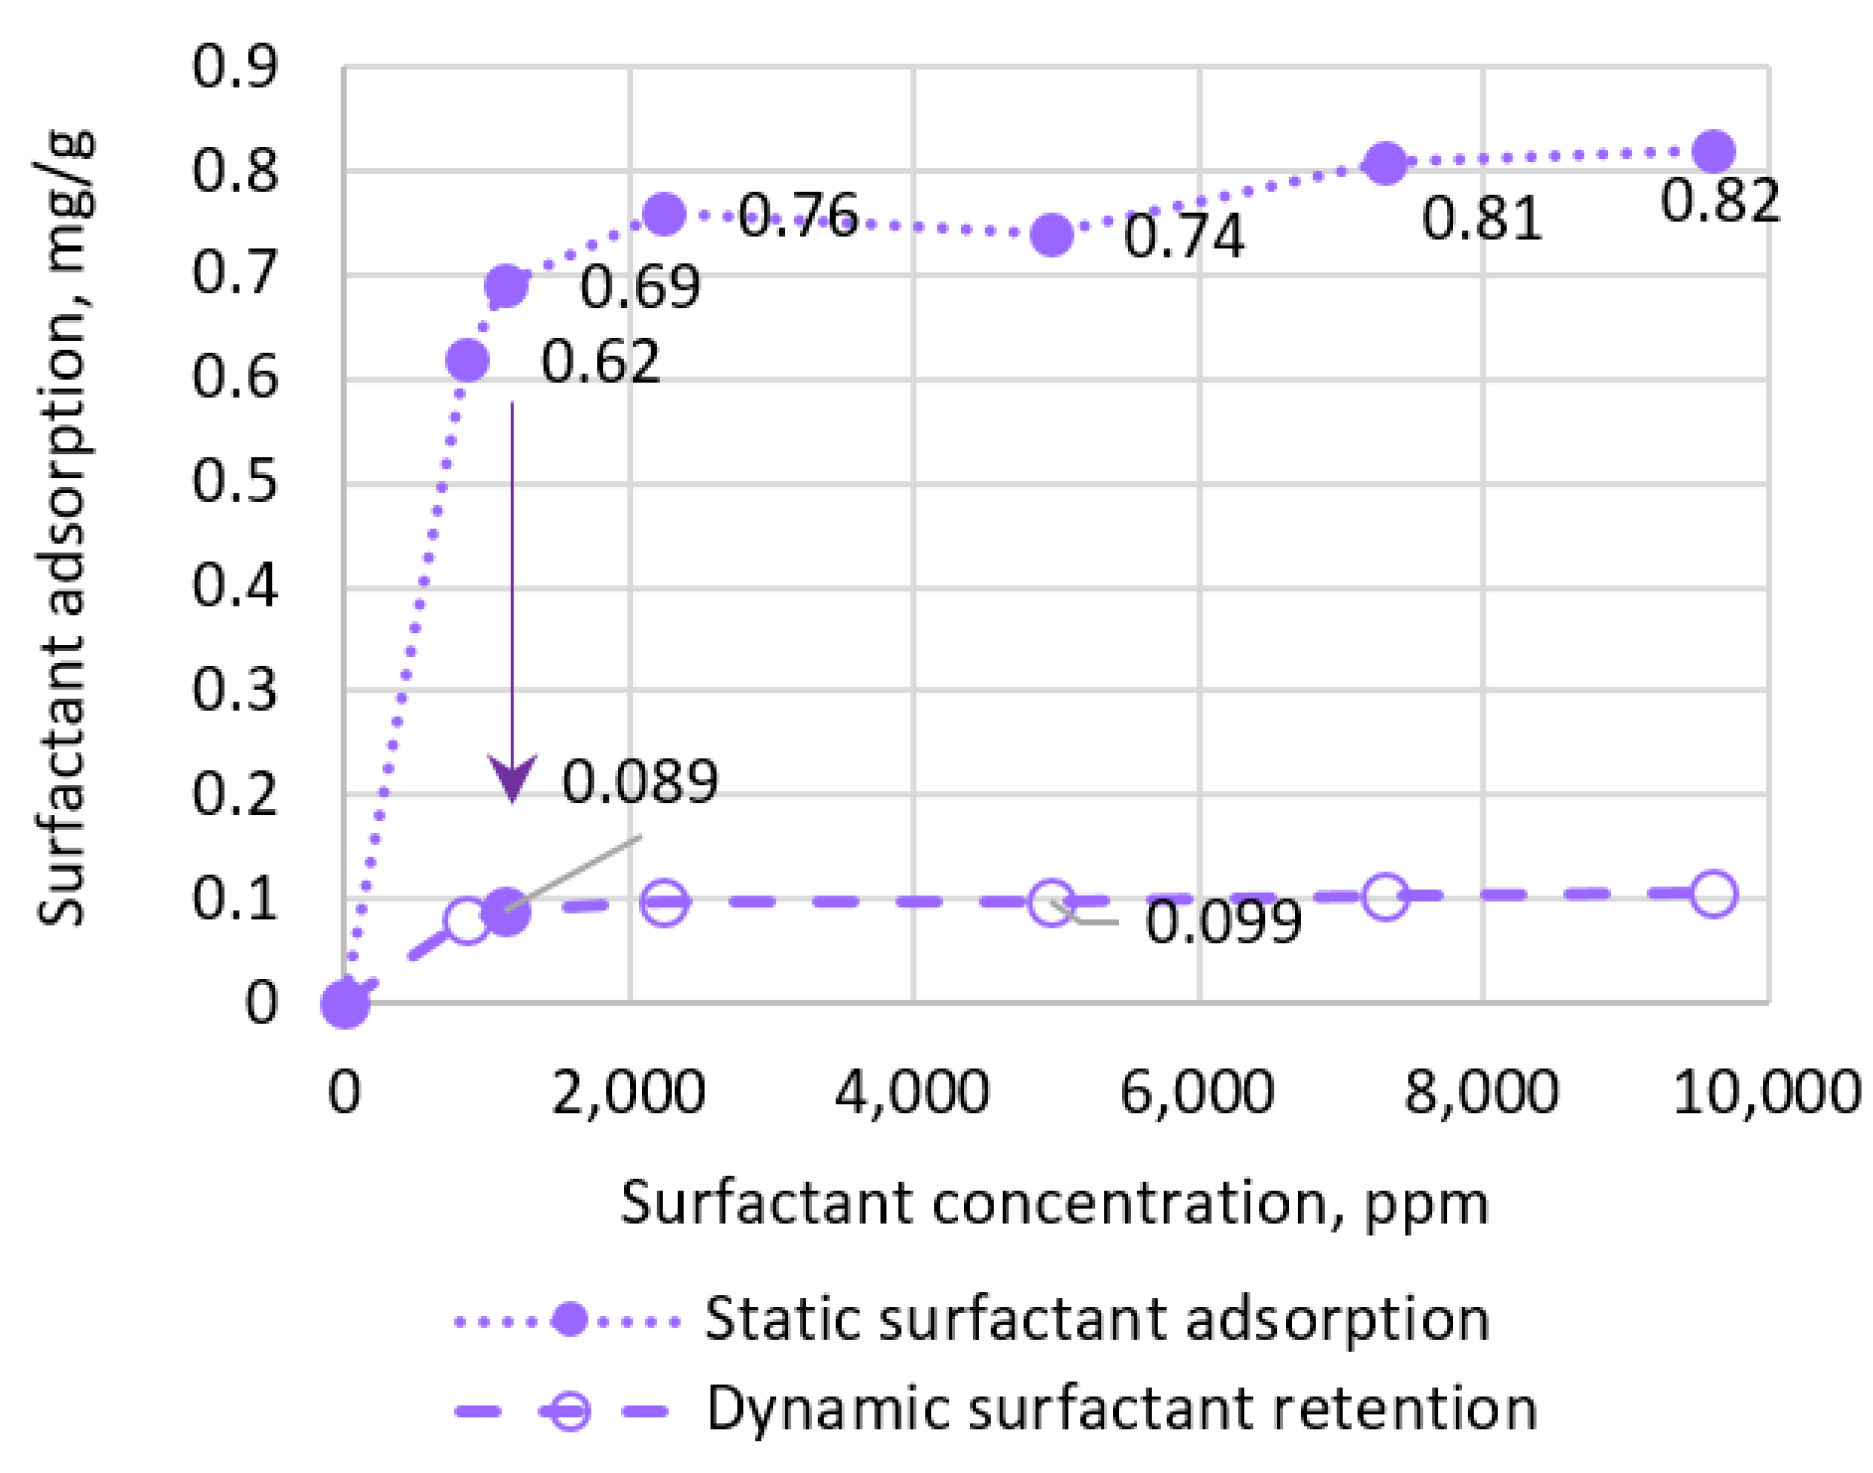
One of the steps in tuning the polymer and surfactant adsorption parameters on the rock was scaling the static adsorption data by the adsorption obtained from the filtration experiment. The adsorption concentration dependence curves determined by the static method were used as a starting point for the data, and then the adsorption curve obtained by the parallel transfer method was normalized to the experimental dynamic adsorption point, after which the curves were further smoothed. This process is necessary, since for a correct description of adsorption behavior it is necessary to perform a large number of experiments for different concentrations of chemical agents, which in practice turns out to be a very expensive process and requires a considerable amount of time. In this case, only dynamic adsorption gives a real picture of the retention on the surfactant rock and polymer in the reservoir (Figure 7 and Figure 8).

Figure 7.
Curve of adsorption dependence on polymer concentration.

Figure 8.
Adsorption concentration curve for surfactants.
No matter how many experiments are performed, there are always parameters that will introduce uncertainty into the calculations. It is these that can be used as tuning parameters on the actual experiment data. Such parameters include inaccessible pore volume, residual resistance factor, and desorption value (if its value could not be determined as a result of a filtration experiment, or experiments for complete desorption assessment are insufficient). In this work, the first approximation is given on the basis of literature sources (Table 2).
Table 2.
Values of parameters for the simulation to tune.
A commercial simulator was used to simulate a wide range of physical processes of surfactant and polymer solution filtration.
The capillary number plays a key role in describing the processes of surfactant injection, which combines many effects, such as an increase in the viscosity of the displacing agent, a decrease in interfacial tension, and an effect on the injection rate [1,26,27]. Thus, a double set of parameters is assigned—for water and for chemical action. For intermediate values of capillary number, the values of the displacement ratio and relative permeabilities are automatically scaled by the simulator. At the same time, different simulators use different approaches to simulate the capillary number—either a piecewise linear function or a non-linear function [23]. A nonlinear description of relative permeability scaling from the capillary number is closer to the description of a real pattern of oil displacement by surfactant. Capillary number thresholds are determined by simulation. Surfactant and polymer slug injection is simulated, and during the simulation the capillary number values are taken directly from the logarithm cube at the point of maximum surfactant concentration. The minimum value of the capillary number in the model corresponds to the mode of displacement by water.
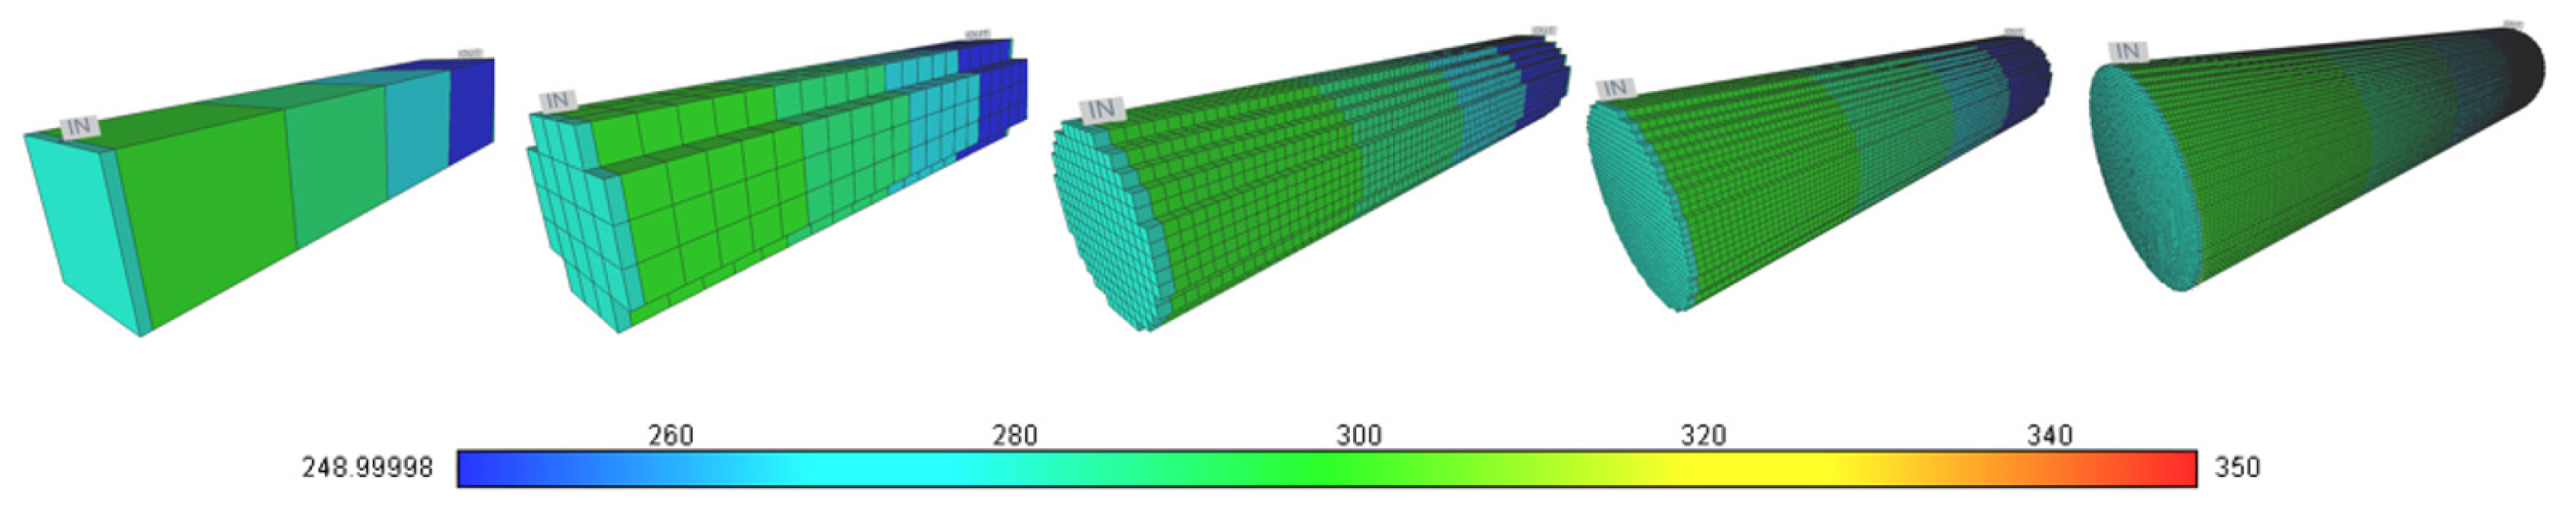
Determination of the optimal number of cells for the simulation of the displacement experiment was performed by simulating the experiment with cells of different dimensions. For this purpose, five different core models were created and analyzed accordingly. The cell size of each model was chosen to have the same equivalent cross-sectional area of the circular core sample and to create equity in the original pore volume conditions.
The basic assumption of the model in reservoir porosity and permeability (RPP) allocation is as follows: Within the model, porosity, permeability, residual oil saturation and associated water saturation are given by data obtained in the laboratory, and the properties are distributed isotropically over the entire sample volume (since in this work, computer tomography of the core sample to determine the RPP was not carried out). A general view of all models is shown in Figure 9. The grid was described using the Cartesian model. The dimensions of the models are shown in Table 3.

Figure 9.
General view of all models used for permeability cube analysis.
Table 3.
Model parameters.
The basic physical parameters of the filtration models are given in Table 4.
Table 4.
Final model parameters.
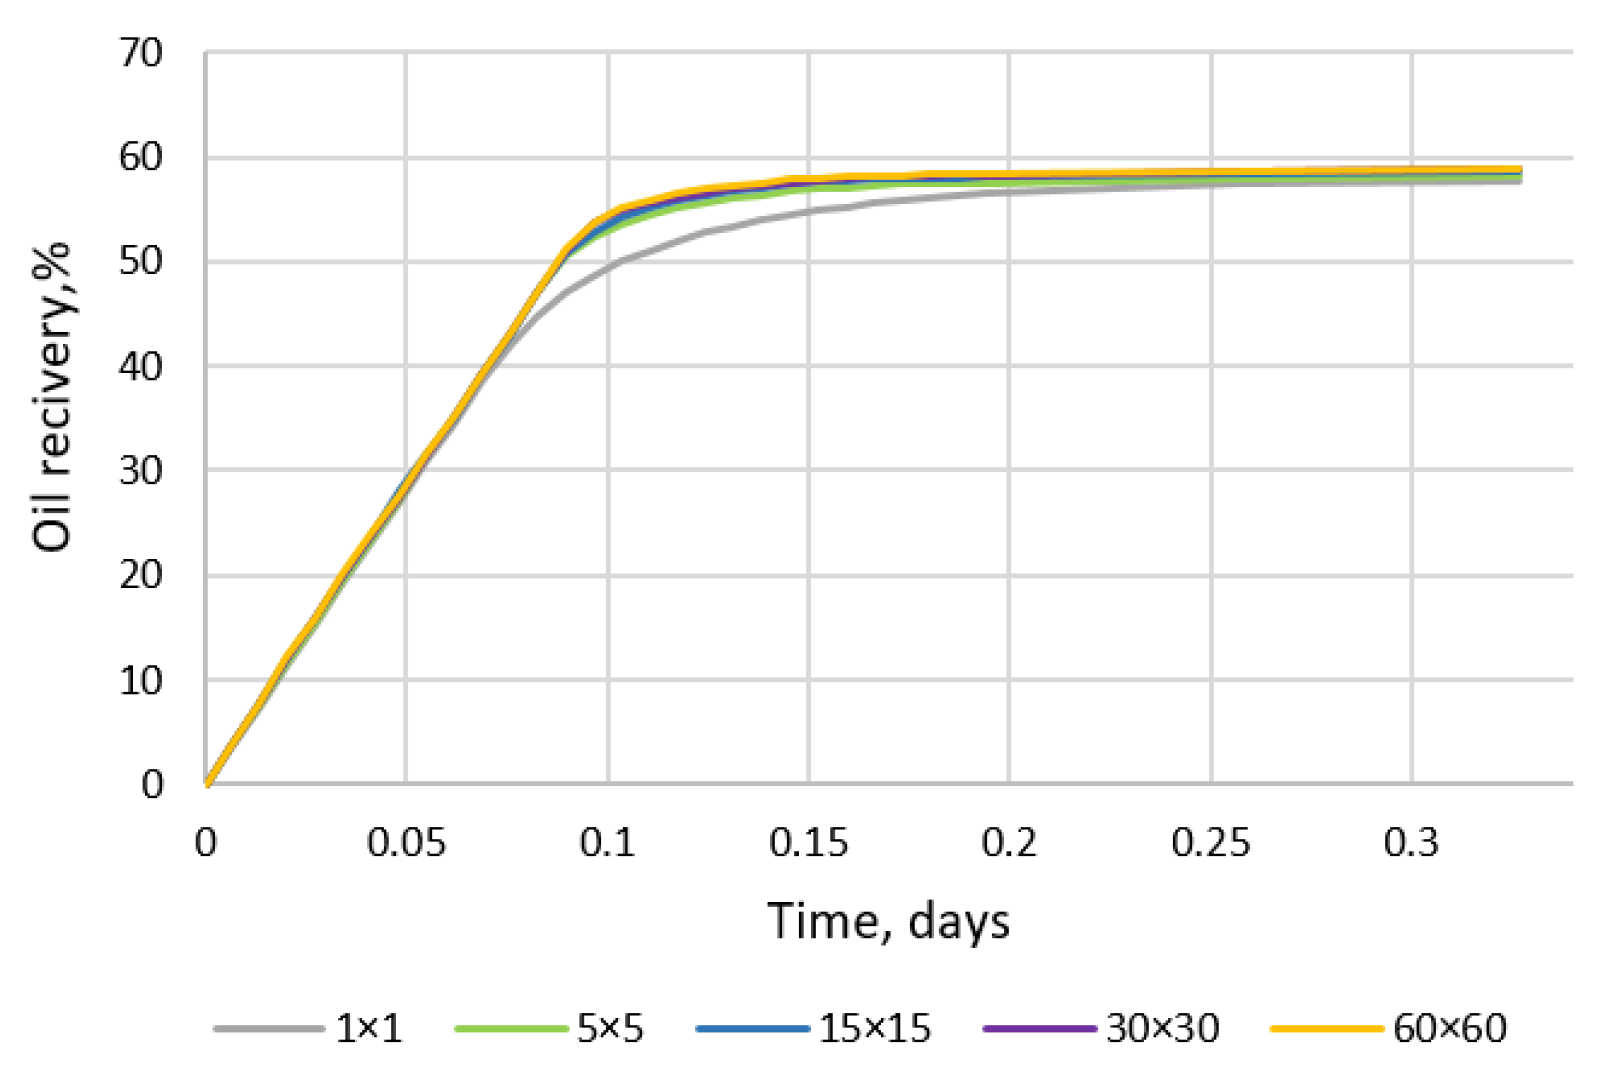
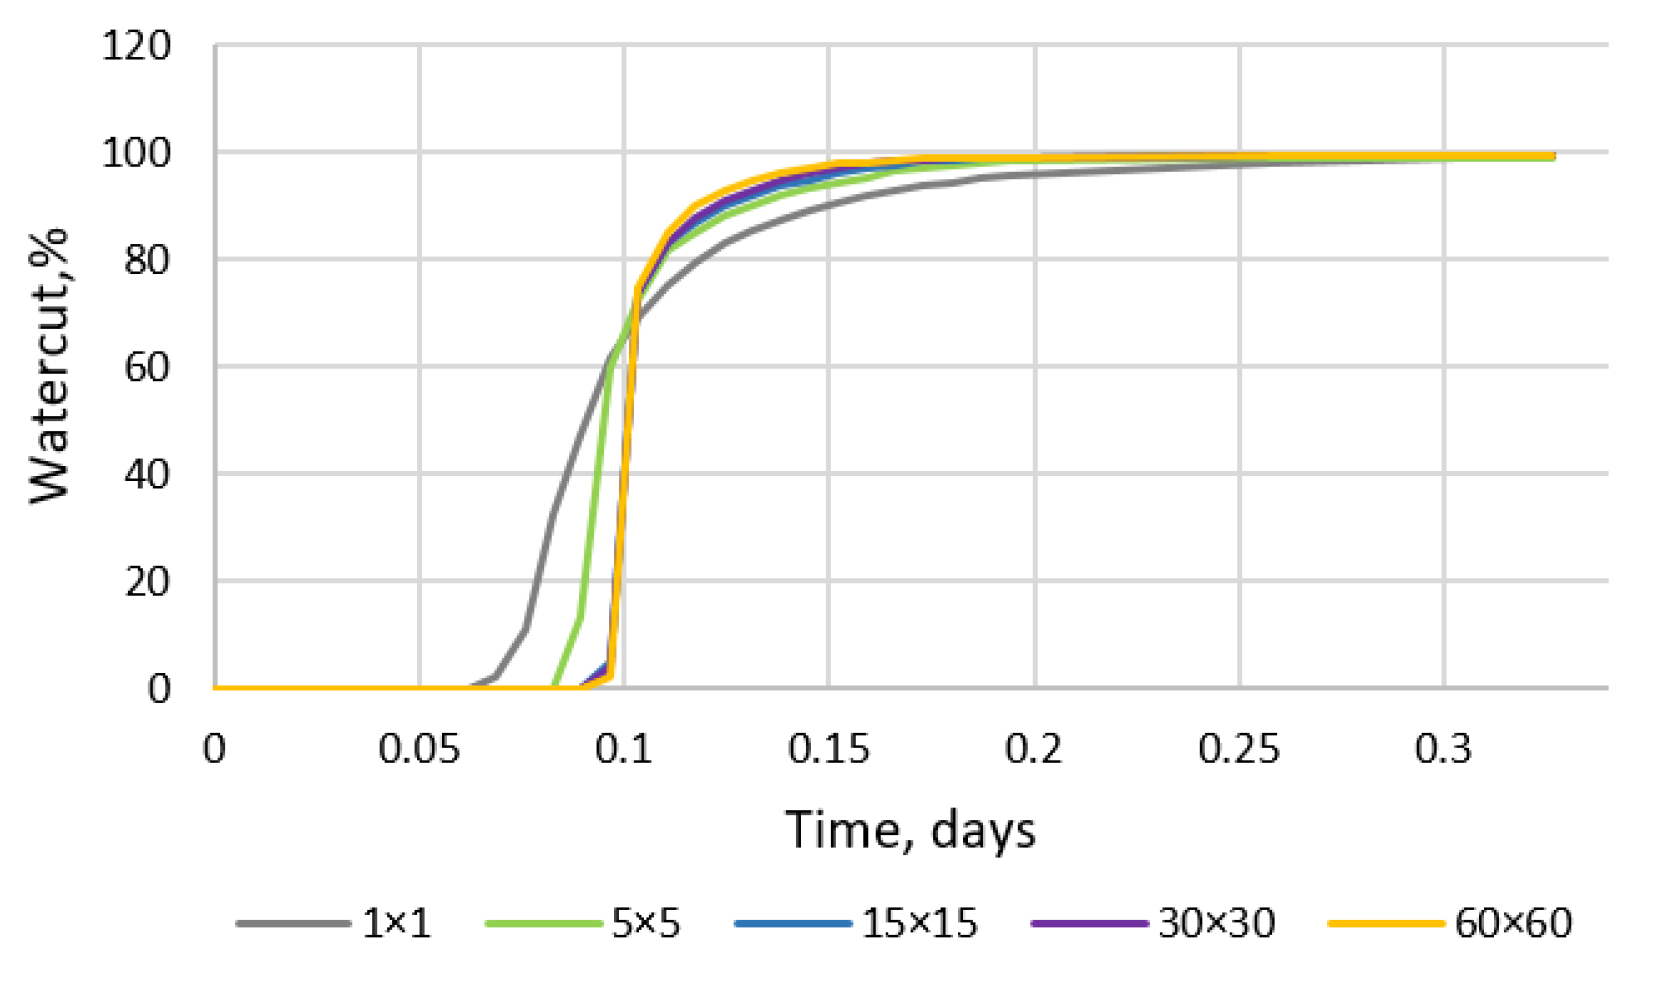
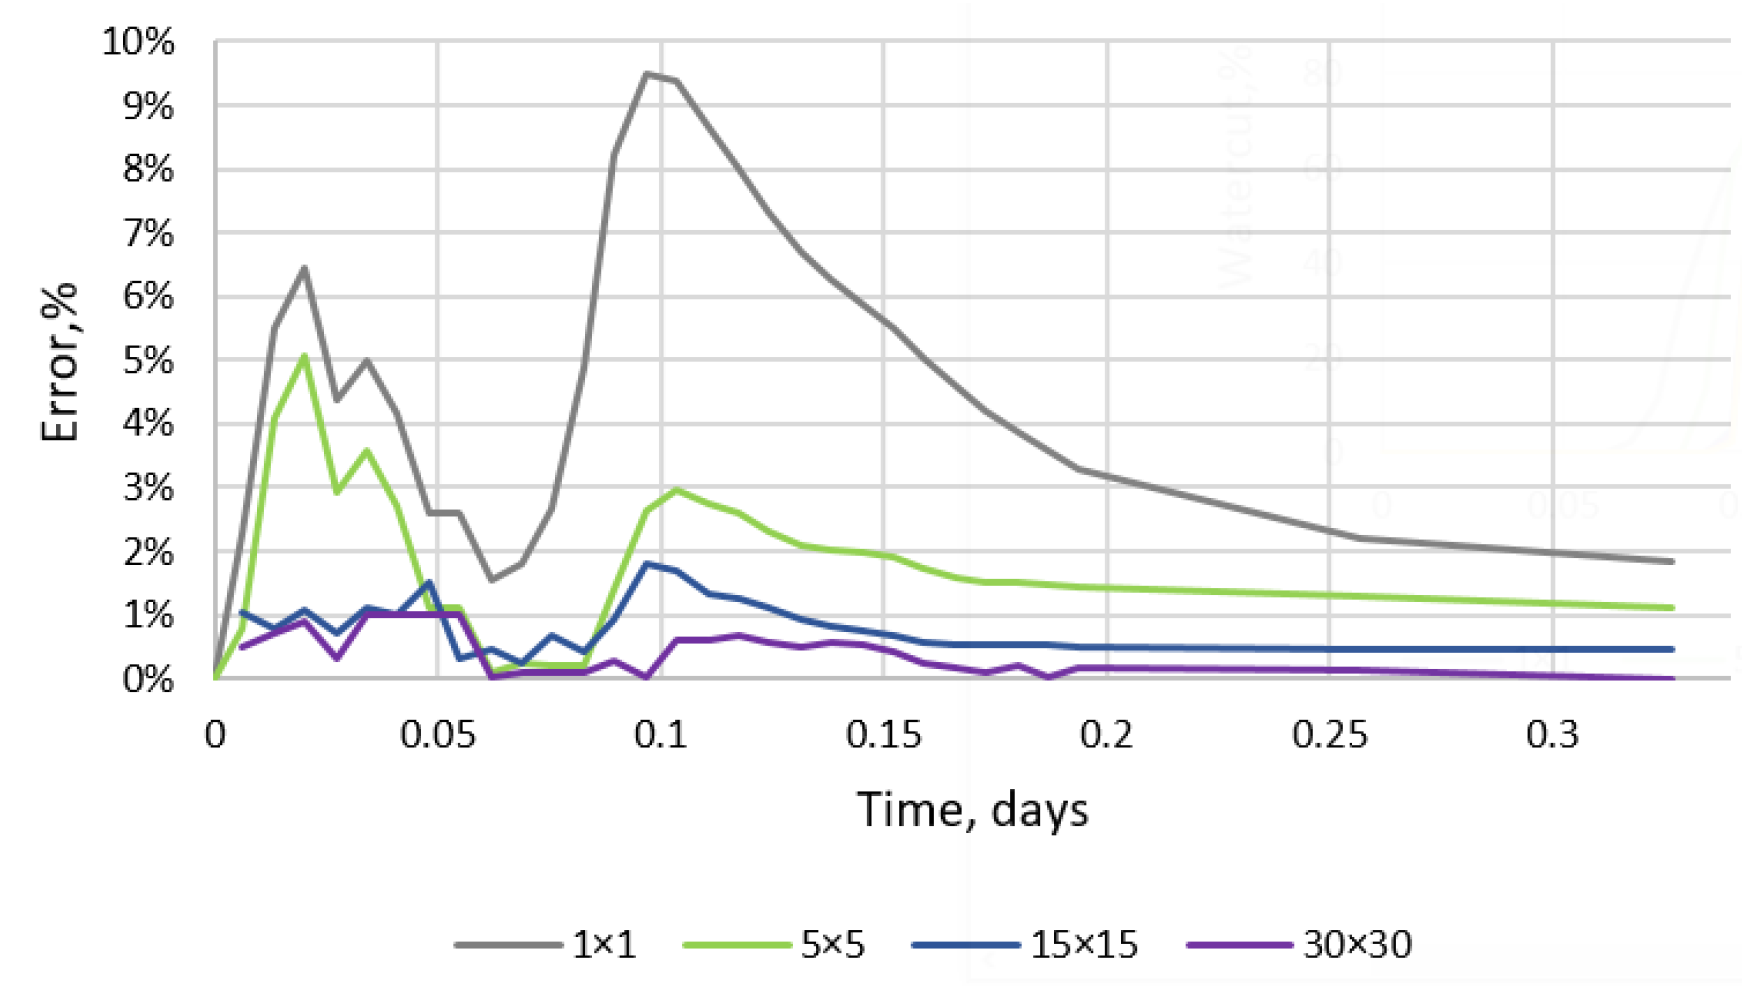
In order to correctly compare the calculation results in the model with the actual experimental results, a simulation of oil displacement by water in the same regime as water flow was performed. Calculations were performed for the experiment to determine the displacement efficiency by water. The results are exemplified by oil recovery (Figure 10) and the water-cut schedule in the model as the parameter most affected by cell size (scaling) (Figure 11). In addition, we compare the relative error concerned with changed of cells sizes (Figure 12 and Figure 13).
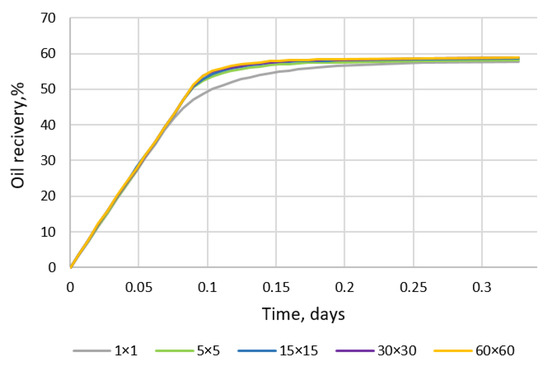
Figure 10.
Oil recovery comparison.

Figure 11.
Comparison of the water-cut schedule for models with different meshes.
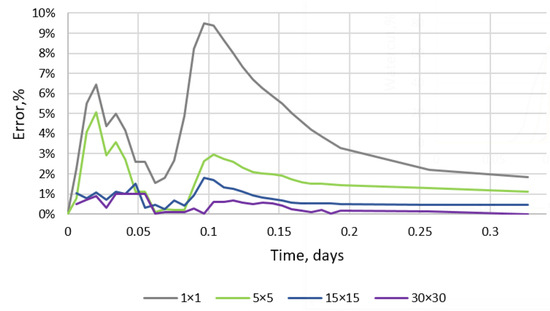
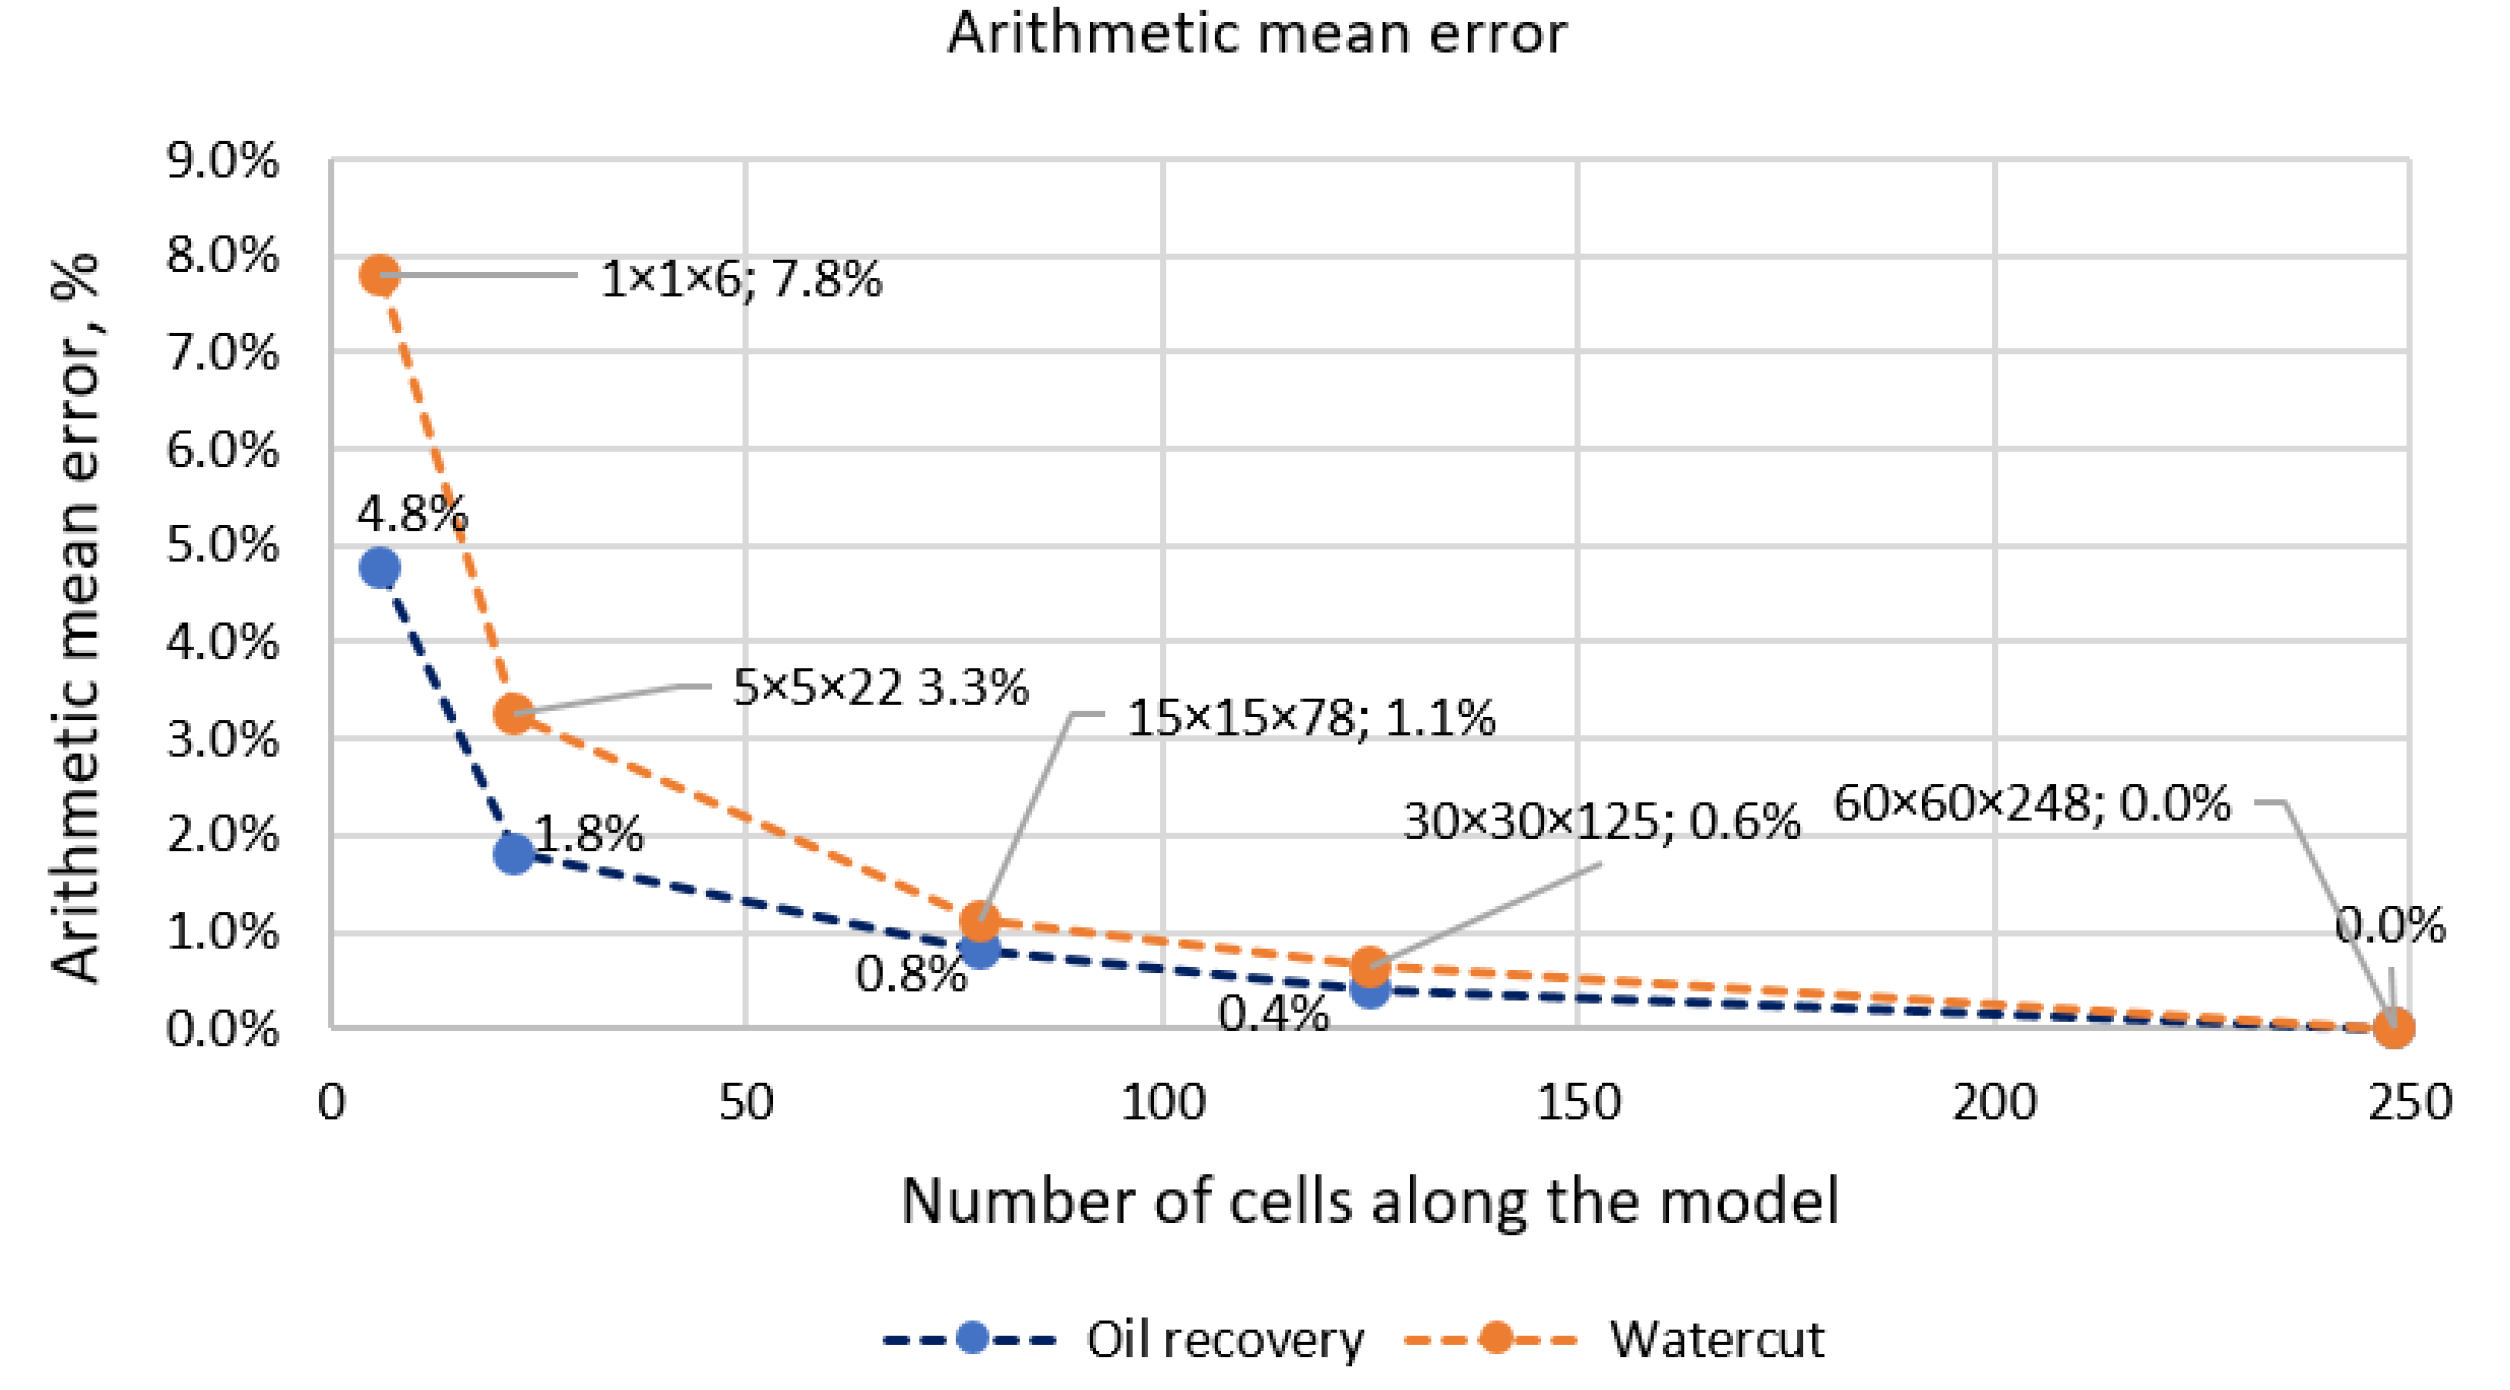
Figure 12.
Error relative to the ideal (60 × 60) oil yield.
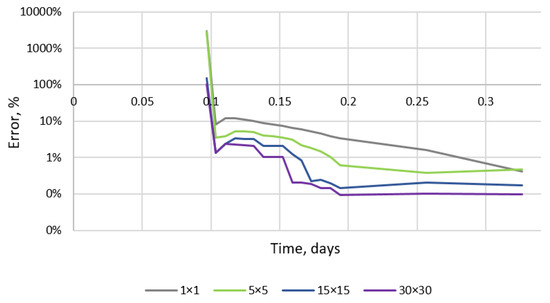
Figure 13.
Error relative to the ideal variant (60 × 60) for water cut.
The calculation results show that models with a resolution higher than 15 × 15 showed the same behavior as water slug movement during filtration inside the core, which can be judged by water and oil yields from the samples. This means that it is not necessary, specifically in this and similar cases, to use a mesh size of less than 1–2 mm. The maximum deviation due to scale effects with respect to the model with smaller cell size did not reach 2%, which is acceptable for further simulation. Moreover, the calculation accuracy gain along the inflection line of arithmetic mean errors lay in the same range of the model with a cell size of 15 × 15 (Figure 14).
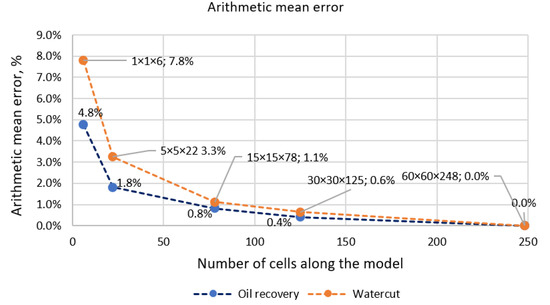
Figure 14.
Analysis of the effect of mesh size reduction on the gain in accuracy of the calculation.
3. Results
Based on the data described above, an experiment on oil displacement by surfactant and polymer was reproduced by means of hydrodynamic simulation. The main goal of the model adaptation was to achieve the maximum possible convergence with the experimental results. In our case, the following model-experiment error criteria were chosen: cumulative oil production and water cut of no more than 5%, differential pressure of no more than 10%, and a concentration of polymer and surfactant at the exit from the core of no more than 20%.
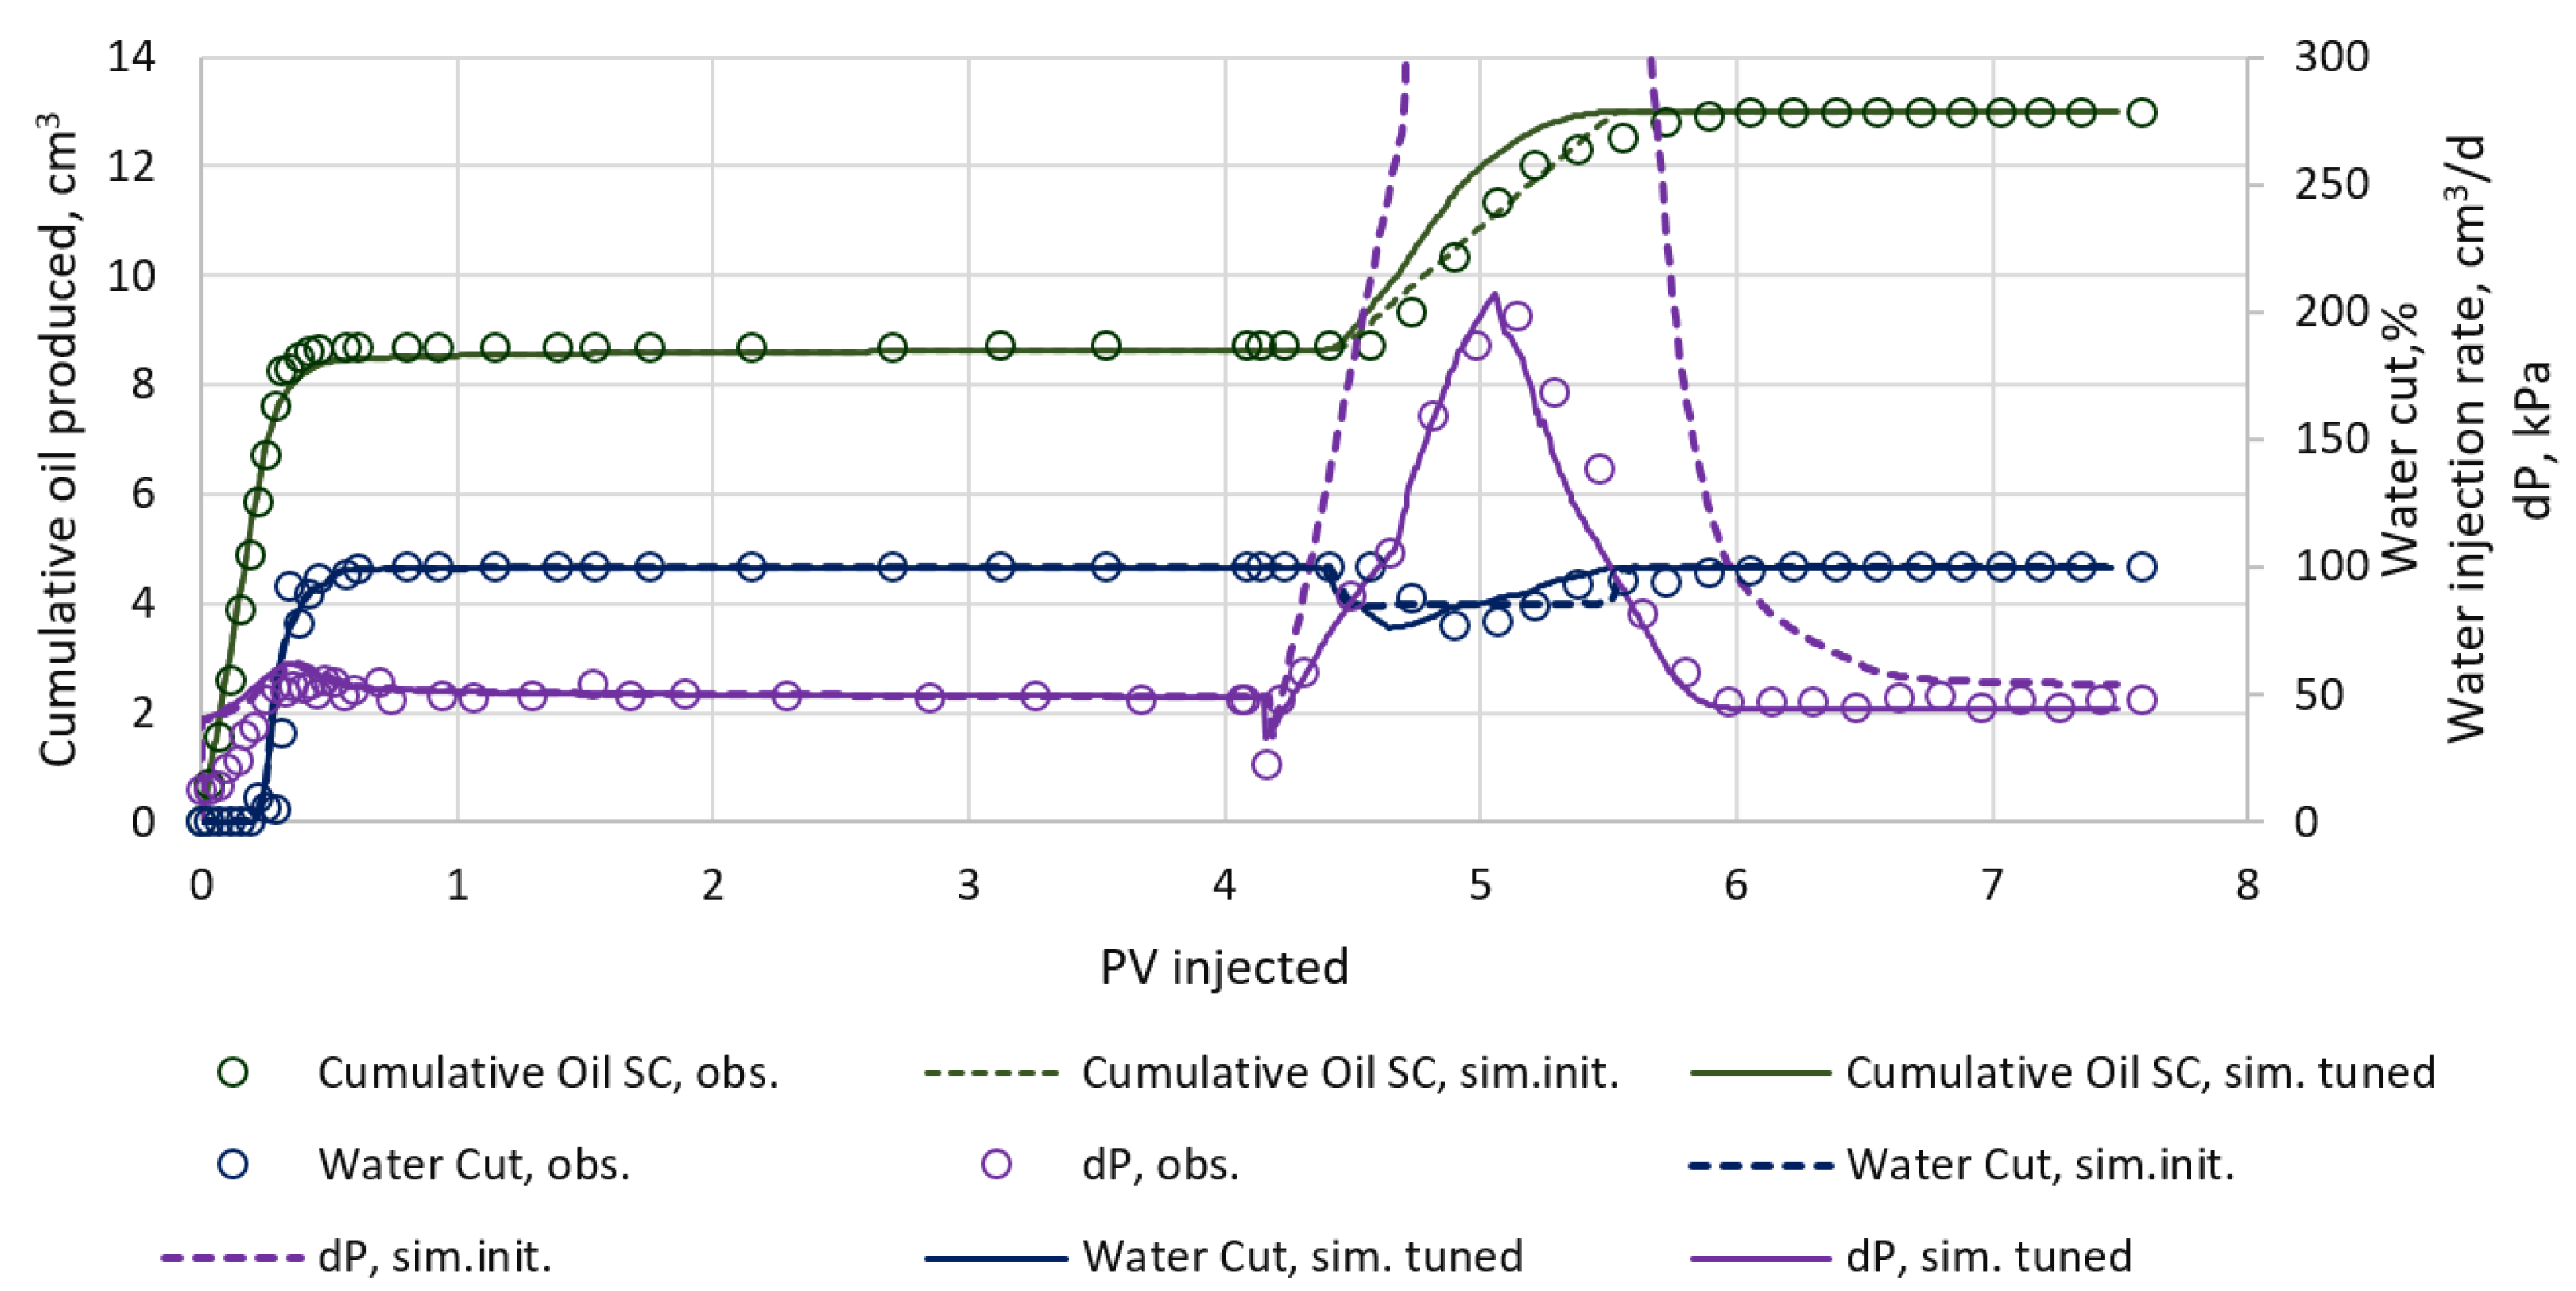
The results of the simulation of the main displacement indices and core-surfactant and polymer yield concentrations are presented for the first iteration and the last iteration (when convergence with experimental results is achieved) in Figure 15 and Figure 16.
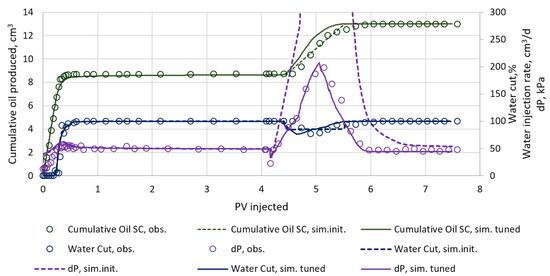
Figure 15.
Result of model tuning to experimental data (displacement parameters).
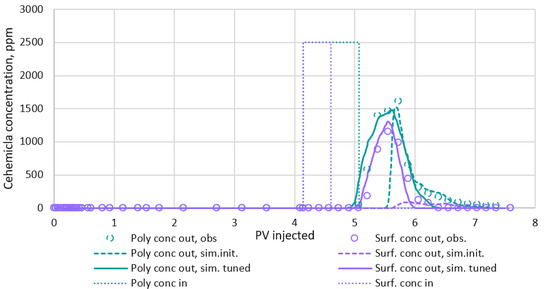
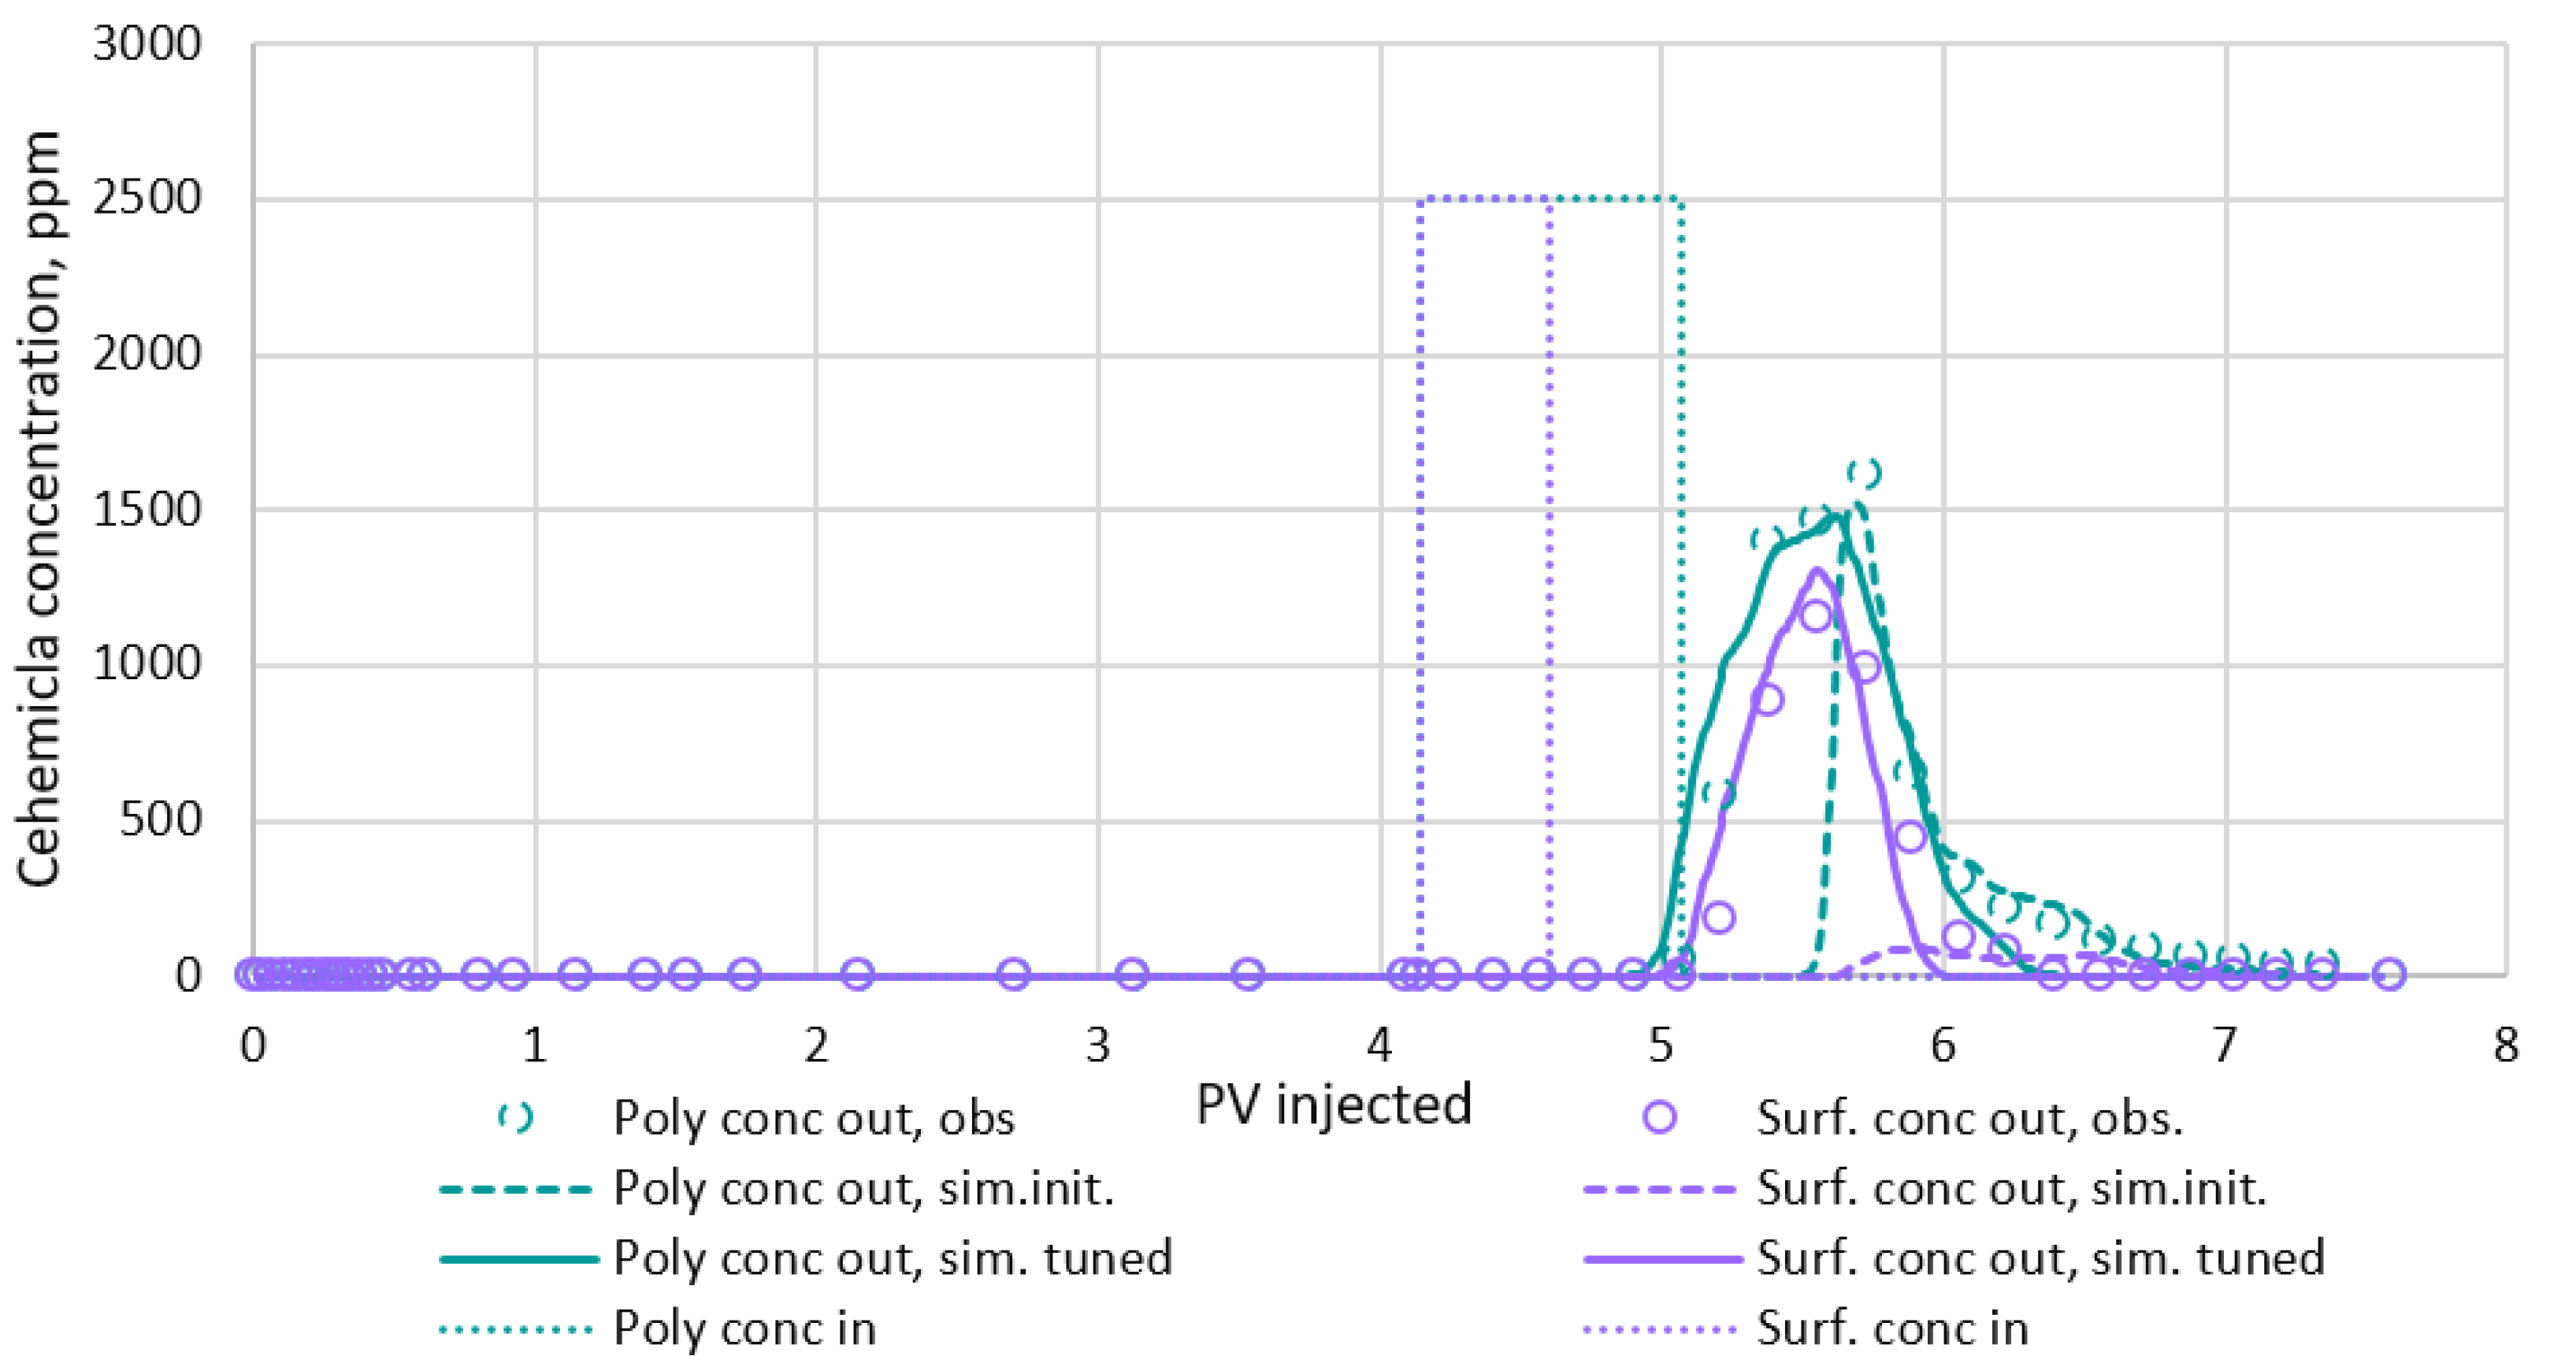
Figure 16.
Result of model tuning to experimental data (surfactant and polymer yields).
As a result of the adaptation of the model, it was possible to reproduce all the indicators of the experiment within the specified error, so the results obtained during the simulation can be considered satisfactory. In the process of iterative tuning of the model, the main parameters of uncertainty were refined when describing the physics of the process of oil displacement by surfactants and polymers, which were not studied experimentally.
The uncertain parameters obtained in the experiment and refined in the course of model tuning described earlier are shown in Table 5 and in Figure 17 and Figure 18.
Table 5.
Parameters obtained by tuning the model to the experiment.
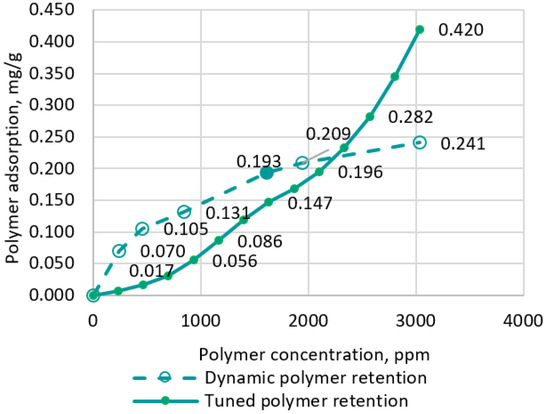
Figure 17.
Polymer retention curve obtained in the model tuning.
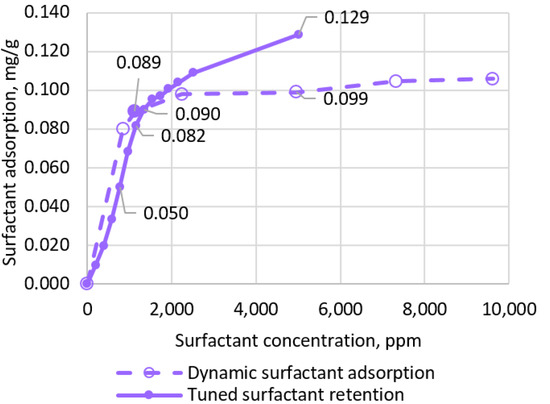
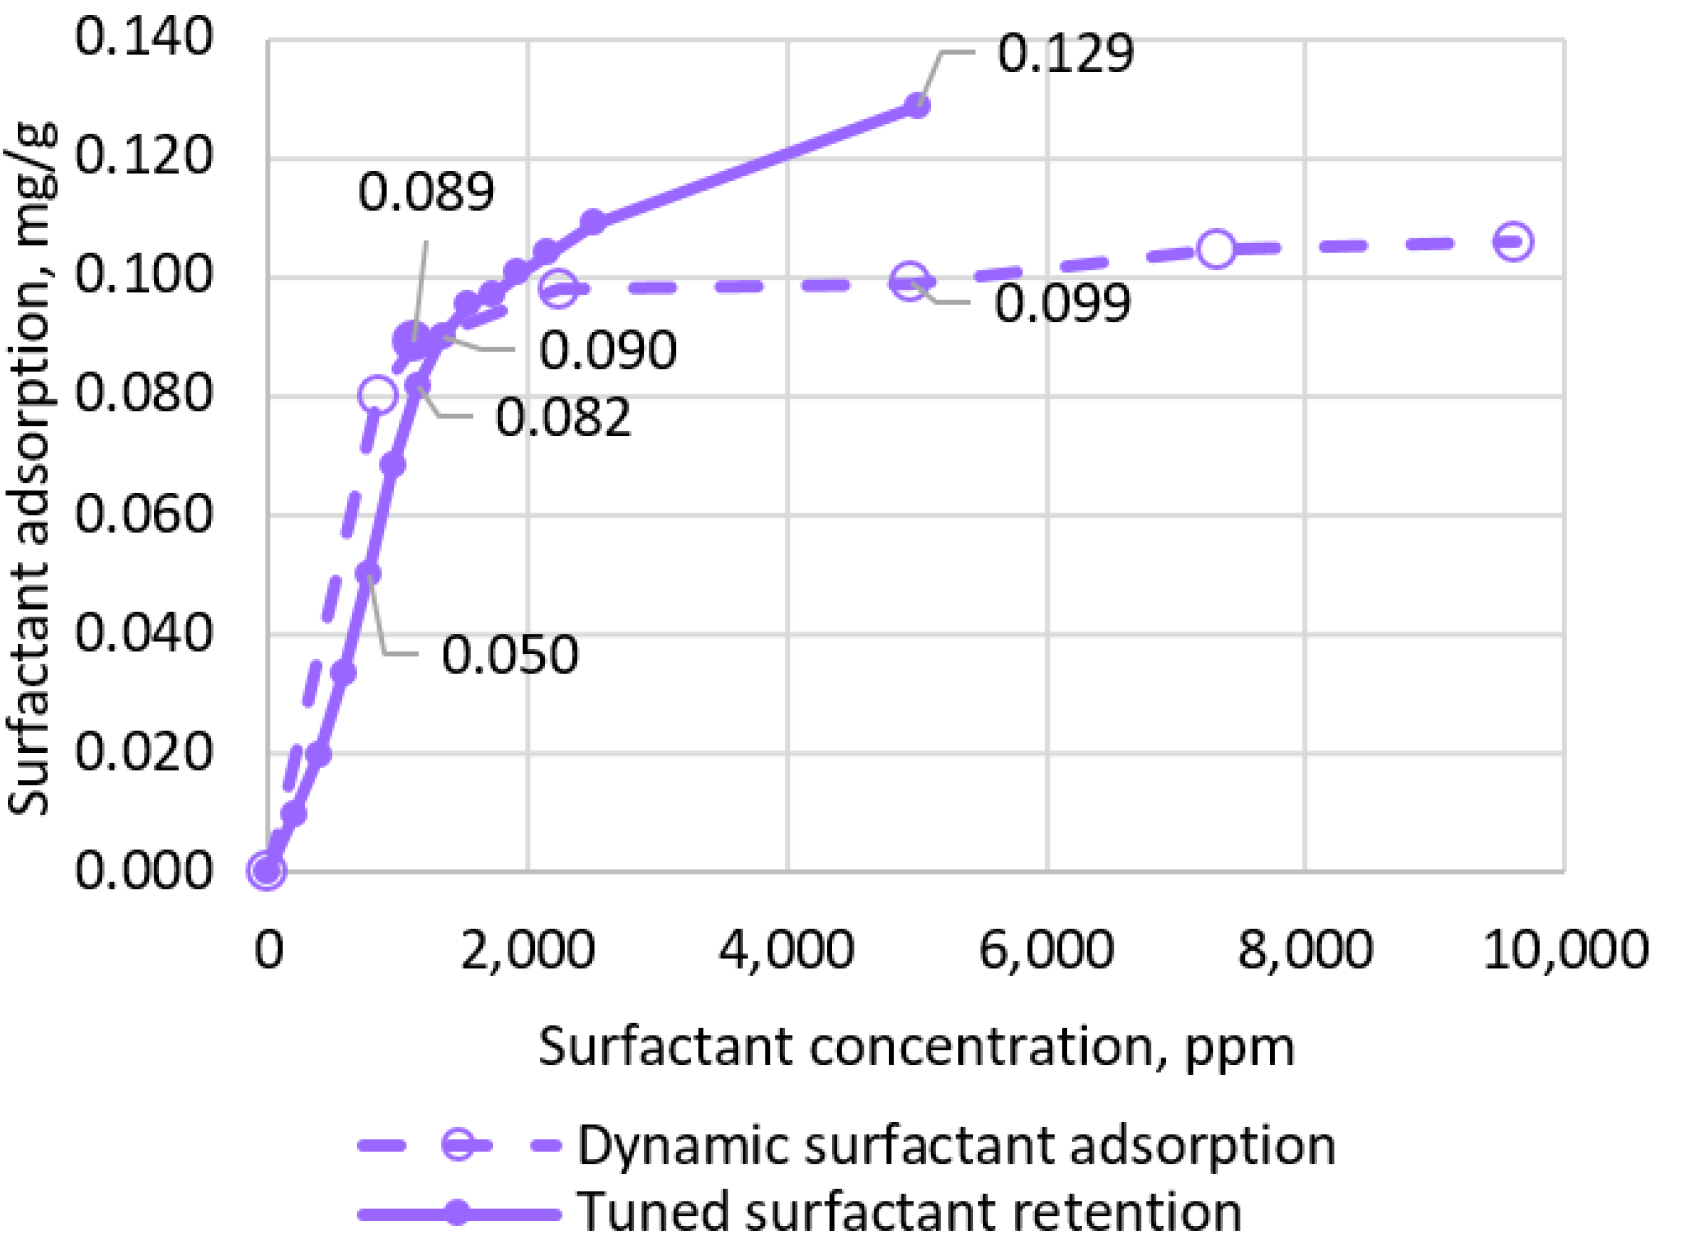
Figure 18.
Surfactant retention curve obtained in the model tuning.
The main reason for the sharp increase in pressure drop in the model during agent injection and piston displacement of oil by the agent slug was the increased viscosity of the slug, which was due to the high concentration of polymer in the free volume. The tuning in this case was done by increasing the values of the polymer adsorption curve and activating the desorption function in order to maintain the overall polymer yield from the model.
The shift of agent slug yield time to the left in the tuning process is achieved by changing the shape of the adsorption curves and increasing the pore space that is not available. In the case of surfactants, in general, adsorption was reduced from the original adsorption and desorption was added. In this case, the value of residual adsorption for both agents served as a tuning tool and was chosen to achieve maximum convergence with the experimental data on the accumulated agent yield and the shape of the concentration curve at the yield.
The value of the residual resistivity factor for the polymer was selected based on the goal of achieving pressure drop convergence in the post-polymer slug stage when only the polymer in bound form was present in the rock.
4. Discussion
The model used the inaccessible pore space for the surfactant as the tuning parameter. The introduction of this parameter proved necessary once the shape of the adsorption curve from concentration could not achieve acceptable convergence. This parameter may be due to the carrying capacity of the polymer. It was assumed that in this case, most of the surfactant was in the volume of water and was filtered together with the polymer, which accelerated the passage of the surfactant through the pore space.
The dependence of adsorption on concentration, in particular the curvature of the line, was significantly changed during the tuning process compared to the initial ones set by normalizing static adsorption to dynamic adsorption. In this case, the polymer adsorption increased due to the significant component of mechanical entrapment. Thus, in the case of static adsorption determination, there is no mechanical trapping. Besides, the dependence in the process of adapting the model to the experimental results was more linearized, which indicates a decrease in the influence factor of surface forces and a departure from the classical dependence of adsorption on the value of polymer concentration.
However, it is worth noting that there was an error in determining the dynamic adsorption value. This was due to the fact that the polymer concentration at the core outlet was determined by its viscosity. In the experiment, if analyzed using the model, there was a significant shear rate and low viscosity during filtration. This fact is evidenced by the relatively low pressure drop during injection of the polymer slug, which can affect the mechanical degradation of the polymer and lead to erroneous overestimation of polymer adsorption. For example, when injecting a polymer with a viscosity of 28 cP at 10 s−1 at the core exit, the viscosity of the polymer solution was 6 cP at a shear rate of 10 s−1. The decrease in viscosity in this case was interpreted as capturing the polymer.
In addition to the uncertainties described above, there may be a problem in the time bias of the original data, as the modeling process necessitated underestimating the agent adsorption in the low concentration range to increase the agent diffusion rate and its more rapid exit from the model.
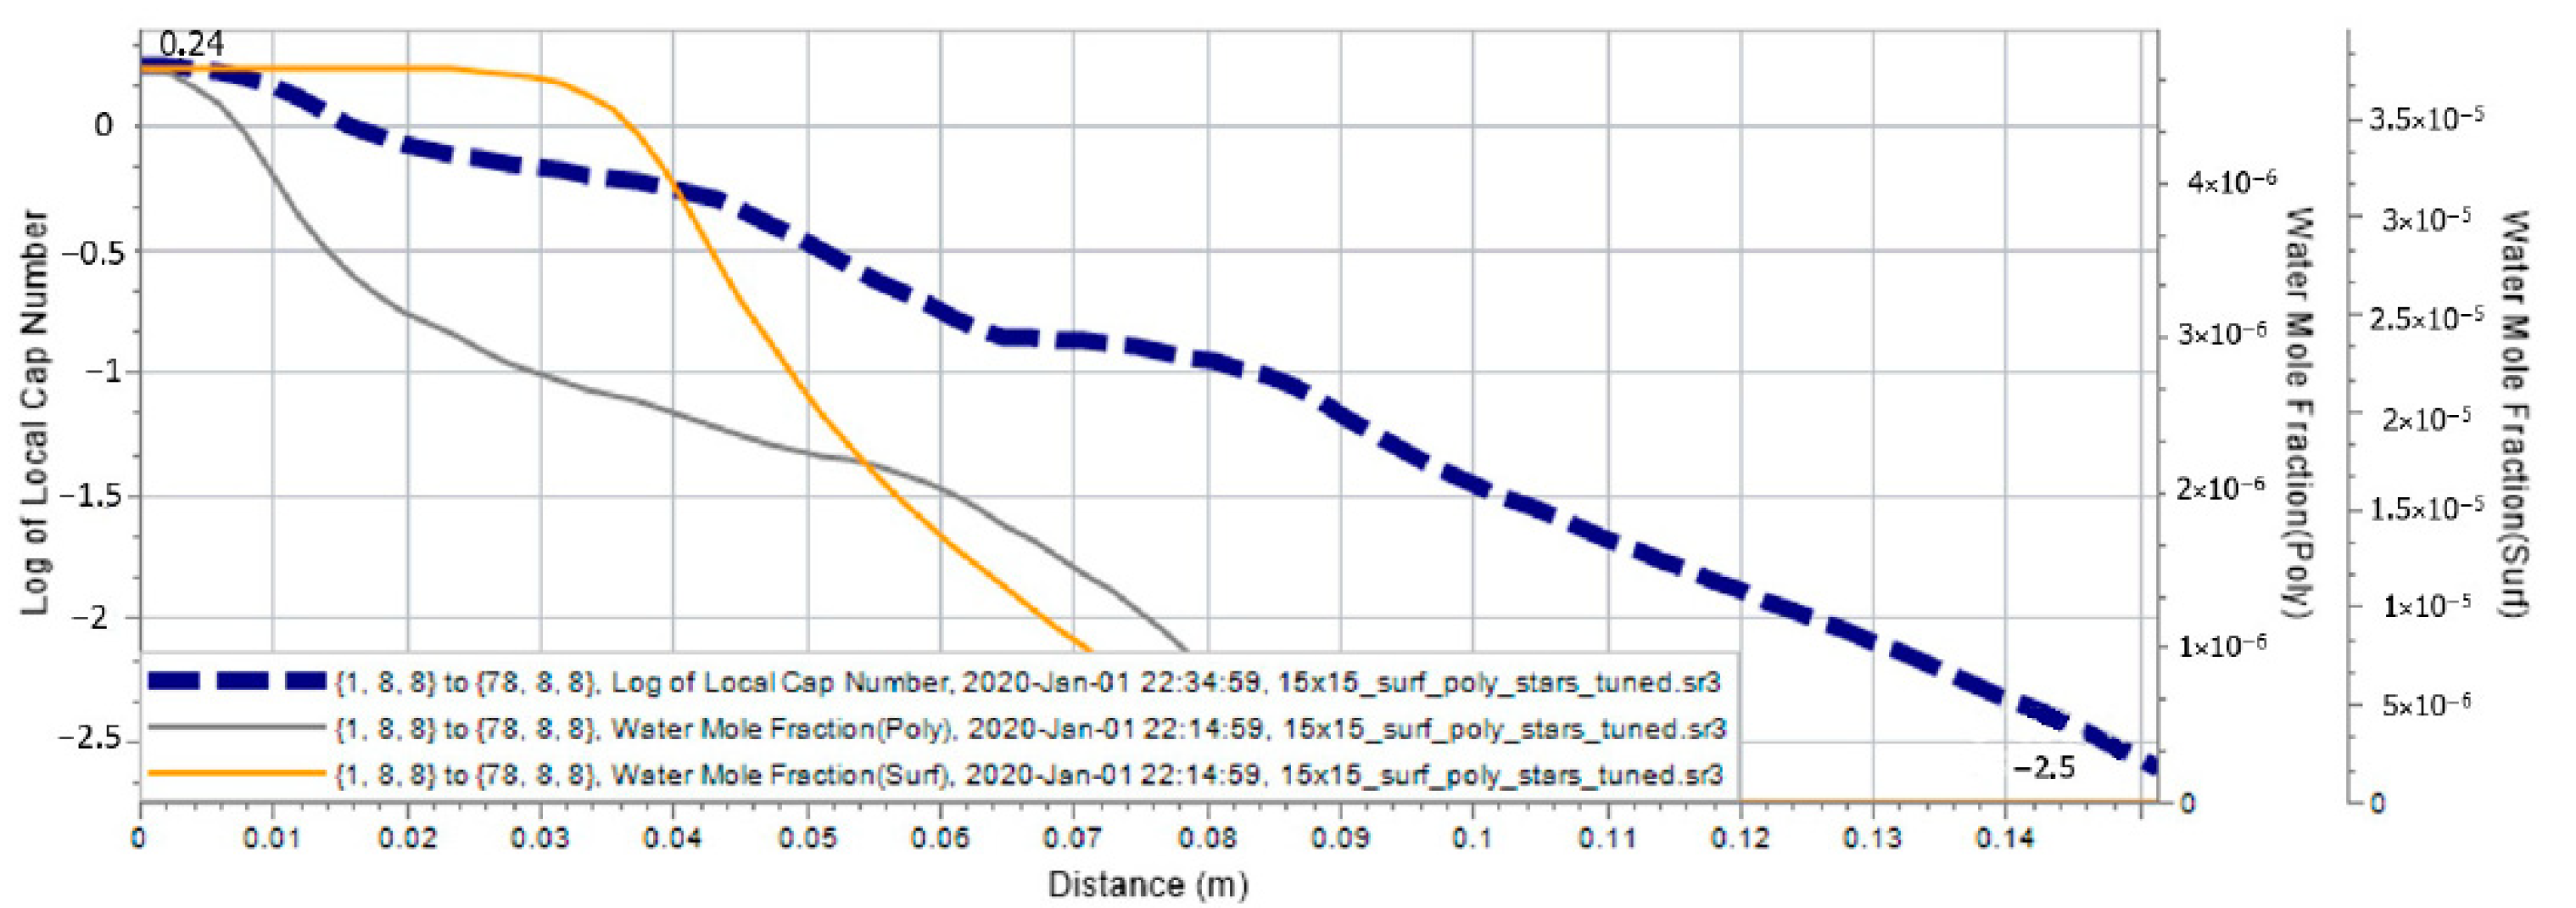
In general, if the contribution of each agent to the displacement ratio is qualitatively distinguished, the polymer effect will be quite significant, as can be seen from the change in the capillary number value in the model, since it is obviously affected by both the surfactant concentration and the polymer. If we highlight the contribution of each reagent to an increase in oil recovery at a qualitative level, in this case the influence of the polymer will be quite significant. What can be judged by the change in the value of the capillary number according to the model—it is obviously influenced by both the concentration of surfactants and the polymer (Figure 19). It is classically believed that surfactant in surfactant–polymer action is the main tool of pre-displacement, and the polymer serves to align the displacement profile. In this work, however, the polymer gave a predominant contribution to the increase in the displacement factor in the hydrodynamic model.
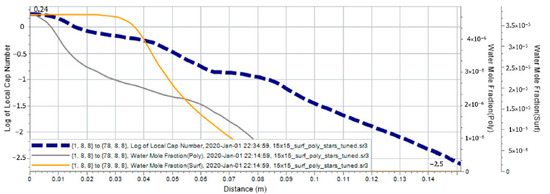
Figure 19.
Change in the capillary number logarithm along the model at the moment of reaching maximum value.
During model tuning, it was also found that when reproducing physical processes of surfactant filtration in the core, scaling of residual oil saturation values is preferably done through capillary number, not only through surfactant concentration. This can have a significant impact on the evaluation and selection of optimal surfactant–polymer flooding technology.
During the hydrodynamic simulation of the filtration experiment described in this work, the maximum concentration of agents was not reached in the filtration process. It was connected to the presence of bound water in the pore space, which means that the displacement factor obtained actually corresponded to a lower concentration than that which was used for core injection. This can generally lead to an underestimation of the potential for chemical impact. This is often due to the fact that the tasks for experimentalists are more often set on the basis of relevance at field sites, but in the process of simulating experiments, a wider range of input and output data is required in order to correctly scale parameters from the experiment on the core to the large cells of the three-dimensional hydrodynamic model. Another problem is that in the laboratory there is often an attempt to simulate oil displacement processes in the reservoir by chemical agent slugs by 0.1–0.5 pore volumes, as is done in the field. However, in this case, it only distorted the picture of surfactant–polymer flooding efficiency and made it difficult to transfer data from the core to the reservoir scale. In the process of simulating the experiment and subsequent transfer of the experiment to the three-dimensional geological model mesh, it was determined that agent injection should be carried out until the pressure drop and agent concentration at the outlet are stabilized.
5. Conclusions
- While performing digital simulations of the laboratory surfactant–polymer oil displacement process, the surfactant and polymer properties that were not directly determined in the laboratory were clarified. These include the polymer residual resistance factor (value—3.5), inaccessible pore volume (for polymer the value was 0.35; for surfactants the value was 0.25), the type of surface tension dependence on surfactant concentration (originally assumed to be linear; in the process of adaptation to the results of the experiment the logarithmic dependence was obtained), and the share of desorption value from adsorption value for surfactant and polymer (0.375).
- Since the digital core hydrodynamic model satisfactorily described the behavior in the experiment, the predictive ability of the model with these parameters and at the field scale was enhanced. The error on all model settings did not exceed 5%.
- Reproduction of the experiment on oil displacement by surfactant and polymer with the help of the model allowed attention to be drawn to some imperfections of laboratory experiments, in particular the determination of polymer concentration by viscosity at the output.
- In order to more correctly model the process of oil displacement by surfactant and polymer on the core, it was necessary to inject chemical solutions until the accumulated oil production and concentration of polymer and surfactant at the outlet were stabilized, i.e., until full saturation of the pore space with agents. In this case, the error was reduced in determining the dynamic adsorption of the surfactant and polymer at equilibrium concentration as well as the residual oil saturation factor.
- In the process of tuning the experiment described in this work, the carrying capacity of the polymer when co-filtration with it accelerated the passage of the surfactant through the core (effect of inaccessible pore space for polymer and surfactant) was established, which requires further study, possibly on a digital core, using tomography methods.
Author Contributions
Conceptualization—A.C. and A.K.; methodology—M.S. and D.M.; investigation—K.K. and V.L.; validation—A.P. All authors have read and agreed to the published version of the manuscript.
Funding
This research received no external funding.
Institutional Review Board Statement
Not applicable.
Informed Consent Statement
Not applicable.
Data Availability Statement
Not applicable.
Conflicts of Interest
The authors declare no conflict of interest.
Abbreviations
The following abbreviations are used in the text of the article:
| SC | Standard conditions |
| cP | Centipoise (mP s) |
| mD | miliDarcy (10−15 m2) |
| PV | Pore Volume |
| Poly. | Polymer |
| Surf. | Surfactant |
| Sim. | Simulated |
| Conc. | Concentration |
| Init. | Initial |
| Obs. | Observed |
| dP | Differential pressure |
| ITF | Interfacial tension |
References
- Chatzis, I.; Morrow, N.R. Correlation of Capillary Number Relationships for Sandstone. Soc. Pet. Eng. J. 1984, 24, 555–562. [Google Scholar] [CrossRef]
- Druetta, P.; Picchioni, F. Surfactant flooding: The influence of the physical properties on the recovery efficiency. Petroleum 2020, 6, 149–162. [Google Scholar] [CrossRef]
- Wilson, D.; Poindexter, L.; Nguyen, T. Role of surfactant structures on surfactant-rock adsorption in various rock types. In Proceedings of the SPE International Conference on Oilfield Chemistry, Galveston, TX, USA, 8–9 April 2019. [Google Scholar]
- Davarpanah, A.; Mirshekari, B. Numerical simulation and laboratory evaluation of alkali–surfactant–polymer and foam flooding. Int. J. Environ. Sci. Technol. 2020, 17, 1123–1136. [Google Scholar] [CrossRef]
- Mohammadi, H.; Delshad, M.; Pope, G.A. Mechanistic modeling of alkaline/surfactant/polymer floods. SPE Reserv. Eval. Eng. 2009, 12, 518–527. [Google Scholar] [CrossRef]
- Yeh, H.-S.; Juárez, J.J. Waterflooding of Surfactant and Polymer Solutions in a Porous Media Micromodel. Colloids Interfaces 2018, 2, 23. [Google Scholar] [CrossRef] [Green Version]
- Hakiki, F.; Maharsi, D.A.; Marhaendrajana, T. Surfactant-Polymer Coreflood Simulation and Uncertainty Analysis Derived from Laboratory Study. J. Eng. Technol. Sci. 2015, 47, 706–725. [Google Scholar] [CrossRef]
- Zhou, H.; Davarpanah, A. Hybrid Cemical Enhanced Oil Recovery Techniques: A Simulation Study. Symmetry 2020, 12, 86. [Google Scholar] [CrossRef]
- Davarpanah, A.; Mirshekari, B. A mathematical model to evaluate the polymer flooding performances. Energy Rep. 2019, 5, 1651–1657. [Google Scholar] [CrossRef]
- Kuo, C.W. Effect of Gravity, Flow Rate, and Small Scale Heterogenity on Multiphase Flow of CO2 and Brine; SPE: Anaheim, CA, USA, 2010. [Google Scholar]
- Rabinovich, A. Determining Characteristic Relative Permeability from Coreflooding Experiments: A Simplified Model Approach; American Geophysical Union: Washington, DC, USA, 2019. [Google Scholar]
- Krause, M.H. Modeling Sub-Core Scale Permeability in Sandstone for Use in Studying Multiphase Flow of CO2 And Brine in Core Flooding Experiments; Stanford University: Stanford, CA, USA, 2009. [Google Scholar]
- Krause, M.H. Modeling and Investigation of the Influence of Capillary Heterogeneity on Multiphase Flow Heterogeneity on Multiphase Flow; Stanford University: Stanford, CA, USA, 2012. [Google Scholar]
- Wang, K.-L.; Zhang, L.-L.; Li, X.; Ming, Y.-Y. Experimental Study on the Properties and Displacement Effects of Polymer Surfactant Solution. J. Chem. 2013, 2013, 956027. [Google Scholar] [CrossRef] [Green Version]
- Krause, M.H. Modeling Permeability Distributions in a Sandstone Core for History Matching Coreflood Experiments; SPE: Anaheim, CA, USA, 2011. [Google Scholar]
- Krause, B. Accurate Determination of Characteristic Relative Permeability Curves. Adv. Water Resour. 2015, 83, 376–388. [Google Scholar] [CrossRef]
- Kumar, A.; Mandal, A. Core-scale modelling and numerical simulation of zwitterionic surfactant flooding: Designing of chemical slug for enhanced oil recovery. J. Pet. Sci. Eng. 2020, 192, 107333. [Google Scholar] [CrossRef]
- Kechut, N.I.; Jamiolahmady, M.; Sohrabi, M. Numerical Simulation of Experimental Carbonated Water Injection (CWI) for Improved Oil Recovery and CO2 Storage; Elseiver: Amsterdam, The Netherlands, 2011. [Google Scholar]
- Chen, F.; Gu, J.; Jiang, H.; Yao, X.; Li, Y. Laboratory evaluation and numerical simulation of the alkali–surfactant–polymer synergistic mechanism in chemical flooding. RSC Adv. 2018, 8, 26476–26487. [Google Scholar] [CrossRef] [Green Version]
- Pal, N.; Mandal, A. Numerical Simulation of Enhanced Oil Recovery (EOR) studies for aqueous Gemini Surfactant-Polymer-Nanoparticle systems. AIChE J. 2020, 66, e17020. [Google Scholar] [CrossRef]
- Alsofi, A.; Liu, J.S.; Han, M. Numerical Simulation of Surfactant-Polymer Coreflooding Experiments for Carbonates. J. Petrol. Sci. Eng. 2013, 111, 184–196. [Google Scholar] [CrossRef]
- Rai, S.K.; Bera, A.; Mandal, A. Modeling of surfactant and surfactant–polymer flooding for enhanced oil recovery using STARS (CMG) software. J. Pet. Explor. Prod. Technol. 2015, 5, 1–11. [Google Scholar] [CrossRef] [Green Version]
- HosseiniNasab, S.M.; Chahardowli, M.; Zitha, P.L.J. Simplified Numerical Model for Simulation of Surfactant/Polymer (SP) Flooding Process for Enhanced Oil Recovery. In Proceedings of the Conference Proceedings, 78th EAGE Conference and Exhibition 2016, Online, 30 May–2 June 2016; European Association of Geoscientists & Engineers: Bunnik, The Netherlands, 2016; Volume 2016, pp. 1–5. [Google Scholar] [CrossRef]
- Abbas, A.H.; Elhag, H.H.; Sulaiman, W.R.W.; Gbadamosi, A.; Pourafshary, P.; Ebrahimi, S.S.; Alqohaly, O.Y.; Agi, A. Modelling of continuous surfactant flooding application for marginal oilfields: A case study of Bentiu reservoir. J. Petrol. Explor. Prod. 2021, 11, 989–1006. [Google Scholar] [CrossRef]
- Alzayer, H.A.; Jahanbakhsh, A.; Sohrabi, M. New Methodology for Numerical Simulation of Water-Alternating-Gas (WAG) Injection; EAGE: Stavenger, Norway, 2017. [Google Scholar]
- Fulcher, R.A., Jr.; Ertekin, T.; Stahl, C.D. Effect of Capillary Number and Its Constituents on Two-Phase Relative Permeability Curves; SPE: Anaheim, CA, USA, 1985. [Google Scholar]
- Guo, H.; Dou, M.; Wang, H.; Wang, F.; Gu, Y.; Yu, Z.; Wang, Y.; Li, Y. Review of Capillary Number in Chemical Enhanced Oil Recovery; SPE: Anaheim, CA, USA, 2015. [Google Scholar]


Publisher’s Note: MDPI stays neutral with regard to jurisdictional claims in published maps and institutional affiliations. |
© 2022 by the authors. Licensee MDPI, Basel, Switzerland. This article is an open access article distributed under the terms and conditions of the Creative Commons Attribution (CC BY) license (https://creativecommons.org/licenses/by/4.0/).