Article

Numerical Simulation of Multiarea Seepage in Deep Condensate Gas Reservoirs with Natural Fractures

1
CNOOC Research Institute Co., Ltd., Beijing 100028, China
2
School of Civil and Resource Engineering, University of Science and Technology Beijing, Beijing 100083, China
*
Author to whom correspondence should be addressed.
Energies 2023, 16(1), 10; https://doi.org/10.3390/en16010010
Submission received: 16 November 2022 / Revised: 12 December 2022 / Accepted: 14 December 2022 / Published: 20 December 2022

Abstract

:
Research into condensate gas reservoirs in the oil and gas industry has been paid much attention and has great research value. There are also many deep condensate gas reservoirs, which is of great significance for exploitation. In this paper, the seepage performance of deep condensate gas reservoirs with natural fractures was studied. Considering that the composition of condensate gas changes during the production process, the component model was used to describe the condensate gas seepage in the fractured reservoir, modeled using the discrete fracture method, and the finite element method was used to conduct numerical simulation to analyze the seepage dynamic. The results show that the advancing speed of the moving pressure boundary can be reduced by 55% due to the existence of threshold pressure gradient. Due to the high-speed flow effect in the near wellbore area, as well as the high mobility of oil, the condensate oil saturation near the wellbore can be reduced by 42.8%. The existence of discrete natural fractures is conducive to improving the degree of formation utilization and producing condensate oil.

1. Introduction

The development of petroleum industrial technologies and the quick growth in demand for oil and gas resources have meant that unconventional oil and gas resources have gradually become a hot spot in the industry, and the development of deep oil and gas reservoirs is gradually increasing. Of the newly discovered recoverable reserves of global condensate oil in 2020, deep and ultra-deep condensate oil accounts for 95% [1], and 100 billion cubic meters of large, deep condensate gas fields exist in Bohai [2]. However, problems such as their great depth and the complex hydrocarbon fluid phase state bring difficulties to their development.
Deep, fractured condensate gas reservoirs have obvious retrograde condensate characteristics in the development process, forming a multiscale, multiphase flow system with matrix fractures. Syed et.al [3] reported a comprehensive review of the complex nature of unconventional reservoirs. Apart from tight reservoirs, deep natural gas reservoirs and geo-pressurized zones, which usually exist under high pressure and high temperature, are also referred to as unconventional reservoirs. The low, dual porosity distribution and ultra-low permeability of those reservoirs are evident. According to an evaluation of core samples [4], the pore size of deep reservoirs can be tiny and heterogeneous. The matrix of deep formation is tight and has a low permeability, and the permeability difference between it and its fractures is large, which causes different flow characteristics to form [5,6]. For low-permeability reservoirs, many research results have shown the impact of threshold pressure gradient on seepage [7,8,9,10]. Many studies focus on oil, water, or oil–water phases [11,12], while practice has proved that there is a threshold pressure gradient in the development of low-permeability gas reservoirs [13,14,15]. Tian et al. [16] pointed out that the threshold pressure gradient of a tight sandstone condensate gas reservoir is positively related to the liquid saturation, and the threshold pressure gradient is significantly increased when fractures have not developed. Martyushev et.al [17] reported that the properties of fractured reservoirs cannot fully recover after damage caused by the stress state increasing. Therefore, there is a risk of a production decline due to reservoir pressure drops and fracture closures [18]. For the study of fractured reservoirs, the dual medium model, equivalent model, and discrete fracture model are mainly used. Due to its advantages with regard to simulation and accuracy, the discrete fracture model is widely used [19,20,21]. The discrete fracture method is popular for dealing with the matrix-fracture flow of shale gas. Wang et al. [22] established a discrete fracture model to analyze the impact of hydraulic fractures on shale gas development, taking into account non-Darcy flow, and this model can be used for ultra-low permeability reservoirs. Zhao et al. [23] established a discrete fracture network including micro fractures and hydraulic fractures, coupled with the gas exchange between the matrix and fracture, and analyzed the impact of fracture geometry and distribution on production.
The purpose of this paper is to study the seepage performance of deep condensate gas reservoirs with natural fractures and to establish a mathematical model for this subject. The model can be applied to calculate the formation pressure distribution and the expansion dynamic of the moving pressure boundary at different development stages, and to analyze the changes in condensate oil in different areas of the formation and the impact of natural discrete fractures on the seepage field.

2. Model and Methods

2.1. Physical Model

The seepage problem present in deep fractured condensate gas reservoirs was considered. The porosity and permeability of the formation were assumed to be homogeneous, and the temperature was constant. The seepage in the formation was unsteady; that is, the formation pressure was a function of time and position. The physical model of formation with natural fractures was built using the discrete fracture method, as shown in Figure 1. The model was divided into matrix area (gray entity) and fracture area (black line).

2.2. Mathematical Description

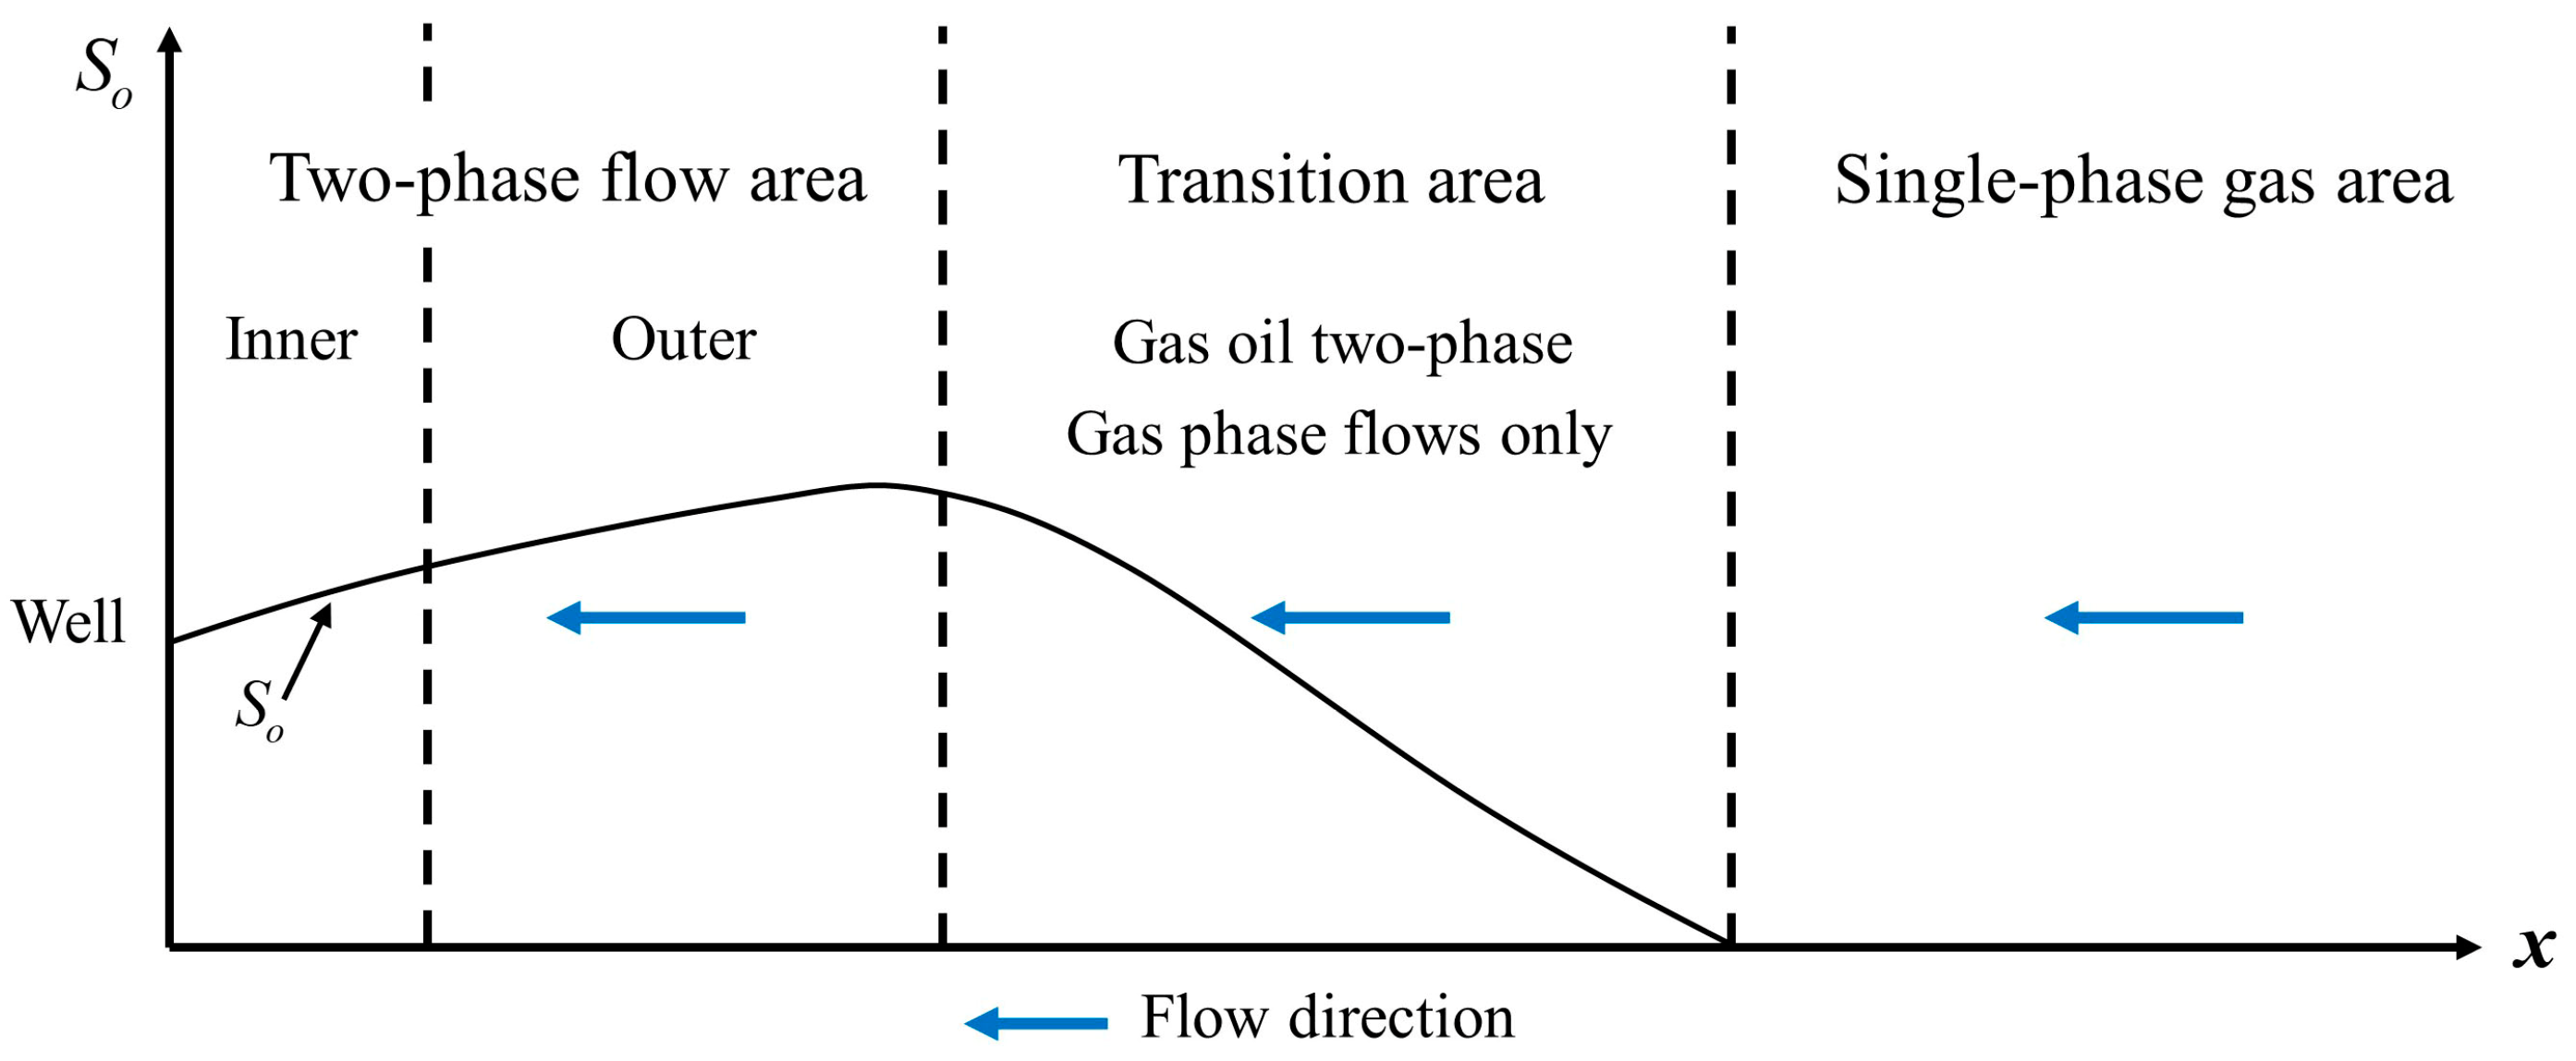
The seepage field structure of condensate gas reservoirs can be considered as fitting the four-zone flow model [24], as shown in Figure 2. From the boundary to the bottom of the well, the formation is divided into a single-phase gas area, a transition area, an outer two-phase flow area, and an inner two-phase flow area. The formation pressure in the single-phase gas area is higher than the dew pressure, and no condensate is produced. The formation pressure in the transition zone decreases gradually, and there is no flowing condensate oil, only gas-phase flows. Gas and oil two-phase flow exists in both the outer and inner two-phase flow areas, which are divided by Reynolds number.

2.2.1. Continuity Equation

The flow of condensate gas belongs to a multicomponent, multiphase flow, and the continuity equation of component i is:
x i ρ o v o + y i ρ g v g + t ϕ j x i ρ o S o + y i ρ g S g q i = 0 ,
where xi and yi are the mole fractions of component i in the oil phase and gas phase respectively; t is the time; ϕ is the porosity; ρ is the fluid density; S is the saturation; v is the velocity vector; qi is the source and sink item; subscript j = m and f, representing matrix and fracture, respectively; and subscripts o and g denote oil and gas phases, respectively.
The dimension of the discrete fracture model can be reduced [25], and the continuity equation of the fracture can be written as:
d f x i ρ o v o + y i ρ g v g + d f t ϕ j x i ρ o S o + y i ρ g S g d f q i = 0 ,
where df is the fracture width.

2.2.2. Motion Equation

In the single-phase gas area, the transition area, and the outer two-phase flow area, fluid flow can be described by Darcy’s law modified by threshold pressure gradient:
v n = k r n k j μ n p n G ,
where v is the velocity; kr is the relative permeability; μ is the viscosity; p is the pressure; G is the threshold pressure gradient; and subscript n = o and g.
In the inner two-phase flow area, the influence of the near-well high-speed non-Darcy effect shall be considered [26]. The non-Darcy term was introduced to describe the flow law and is written as:
p n G = μ n k r n k j v n + β ρ n v n 2 ,
where β is the inertial coefficient. The inertial coefficient reflects the deviation of seepage from Darcy’s law. When oil and gas two-phases coexist in the near-wellbore area, the inertial coefficient can be calculated using [27]:
β = 3.3 × 10 9 ϕ 0.75 k 1.25 s g 4.5 ,
The inner and outer two-phase flow areas are divided by Reynolds number, which can be calculated by Kajiahoff Equation (6), and the critical value is 0.2~0.3. The area where Reynolds number is greater than the critical value is the inner two-phase flow area, and the opposite is the outer two-phase flow area.
R e = v ρ k 17.5 μ ϕ 1.5 ,

2.2.3. Constraint Equation

The constraint condition of the component is:
x i = y i = 1 ,
The constraint condition of saturation is:
S o + S g + S w = 1 ,
where Sw is the connate water saturation.
The total molar amount of component i is:
z i = L x i + V y i ,
where L and V are the mole fractions of the oil phase and gas phase in the system, respectively, as shown in Equation (10).
L = ρ o S o ρ o S o + ρ g S g , V = ρ g S g ρ o S o + ρ g S g ,

2.2.4. Phase Equilibrium Equation

f i L = f i V ,
where f i L and f i V represent the liquid fugacity and gas fugacity of component i, respectively.

2.2.5. State Equation

The state equation of rock is:
ϕ = ϕ i n t 1 + C s p p i n t ,
where Cs is the rock compression coefficient; ϕint is the original porosity; and pint is the original pressure.
The fluid phase density is calculated using:
ρ n = p M n Z n R T ,
where M is the average molecular weight; Z is the deviation factor; R is the ideal gas constant; and T is the temperature.
The PVT properties are described by Peng-Robinson equation [28]:
p = R T V r b α T V r V r + b + b V r b ,
α T c = 0.45724 R T c 2 p c ,
b = 0.0778 R T p c ,
where Vr is the molar volume; pc is the contrast pressure; and Tc is the contrast temperature.

2.2.6. Boundary Conditions and Initial Conditions

The closed outer boundary condition is:
n · ρ v = 0 ,
where n is the boundary normal vector.
The specified rate condition for the inner boundary is:
v Ω i n = q 0 2 π r w h ,
where Ωin represents the inner boundary, and q0 is the production rate under formation condition.
The initial conditions can be written as:
p t = 0 = p i n t ,
S o t = 0 = 0 .

3. Model Validation

3.1. Static Parameters

The modeled typical deep fractured condensate gas reservoir had a depth of 4550.6 m, and a fracture width between 0.1 mm and 0.4 mm, with east-west strike fractures,. The static parameters of the formation are shown in Table 1.

3.2. Fluid Properties

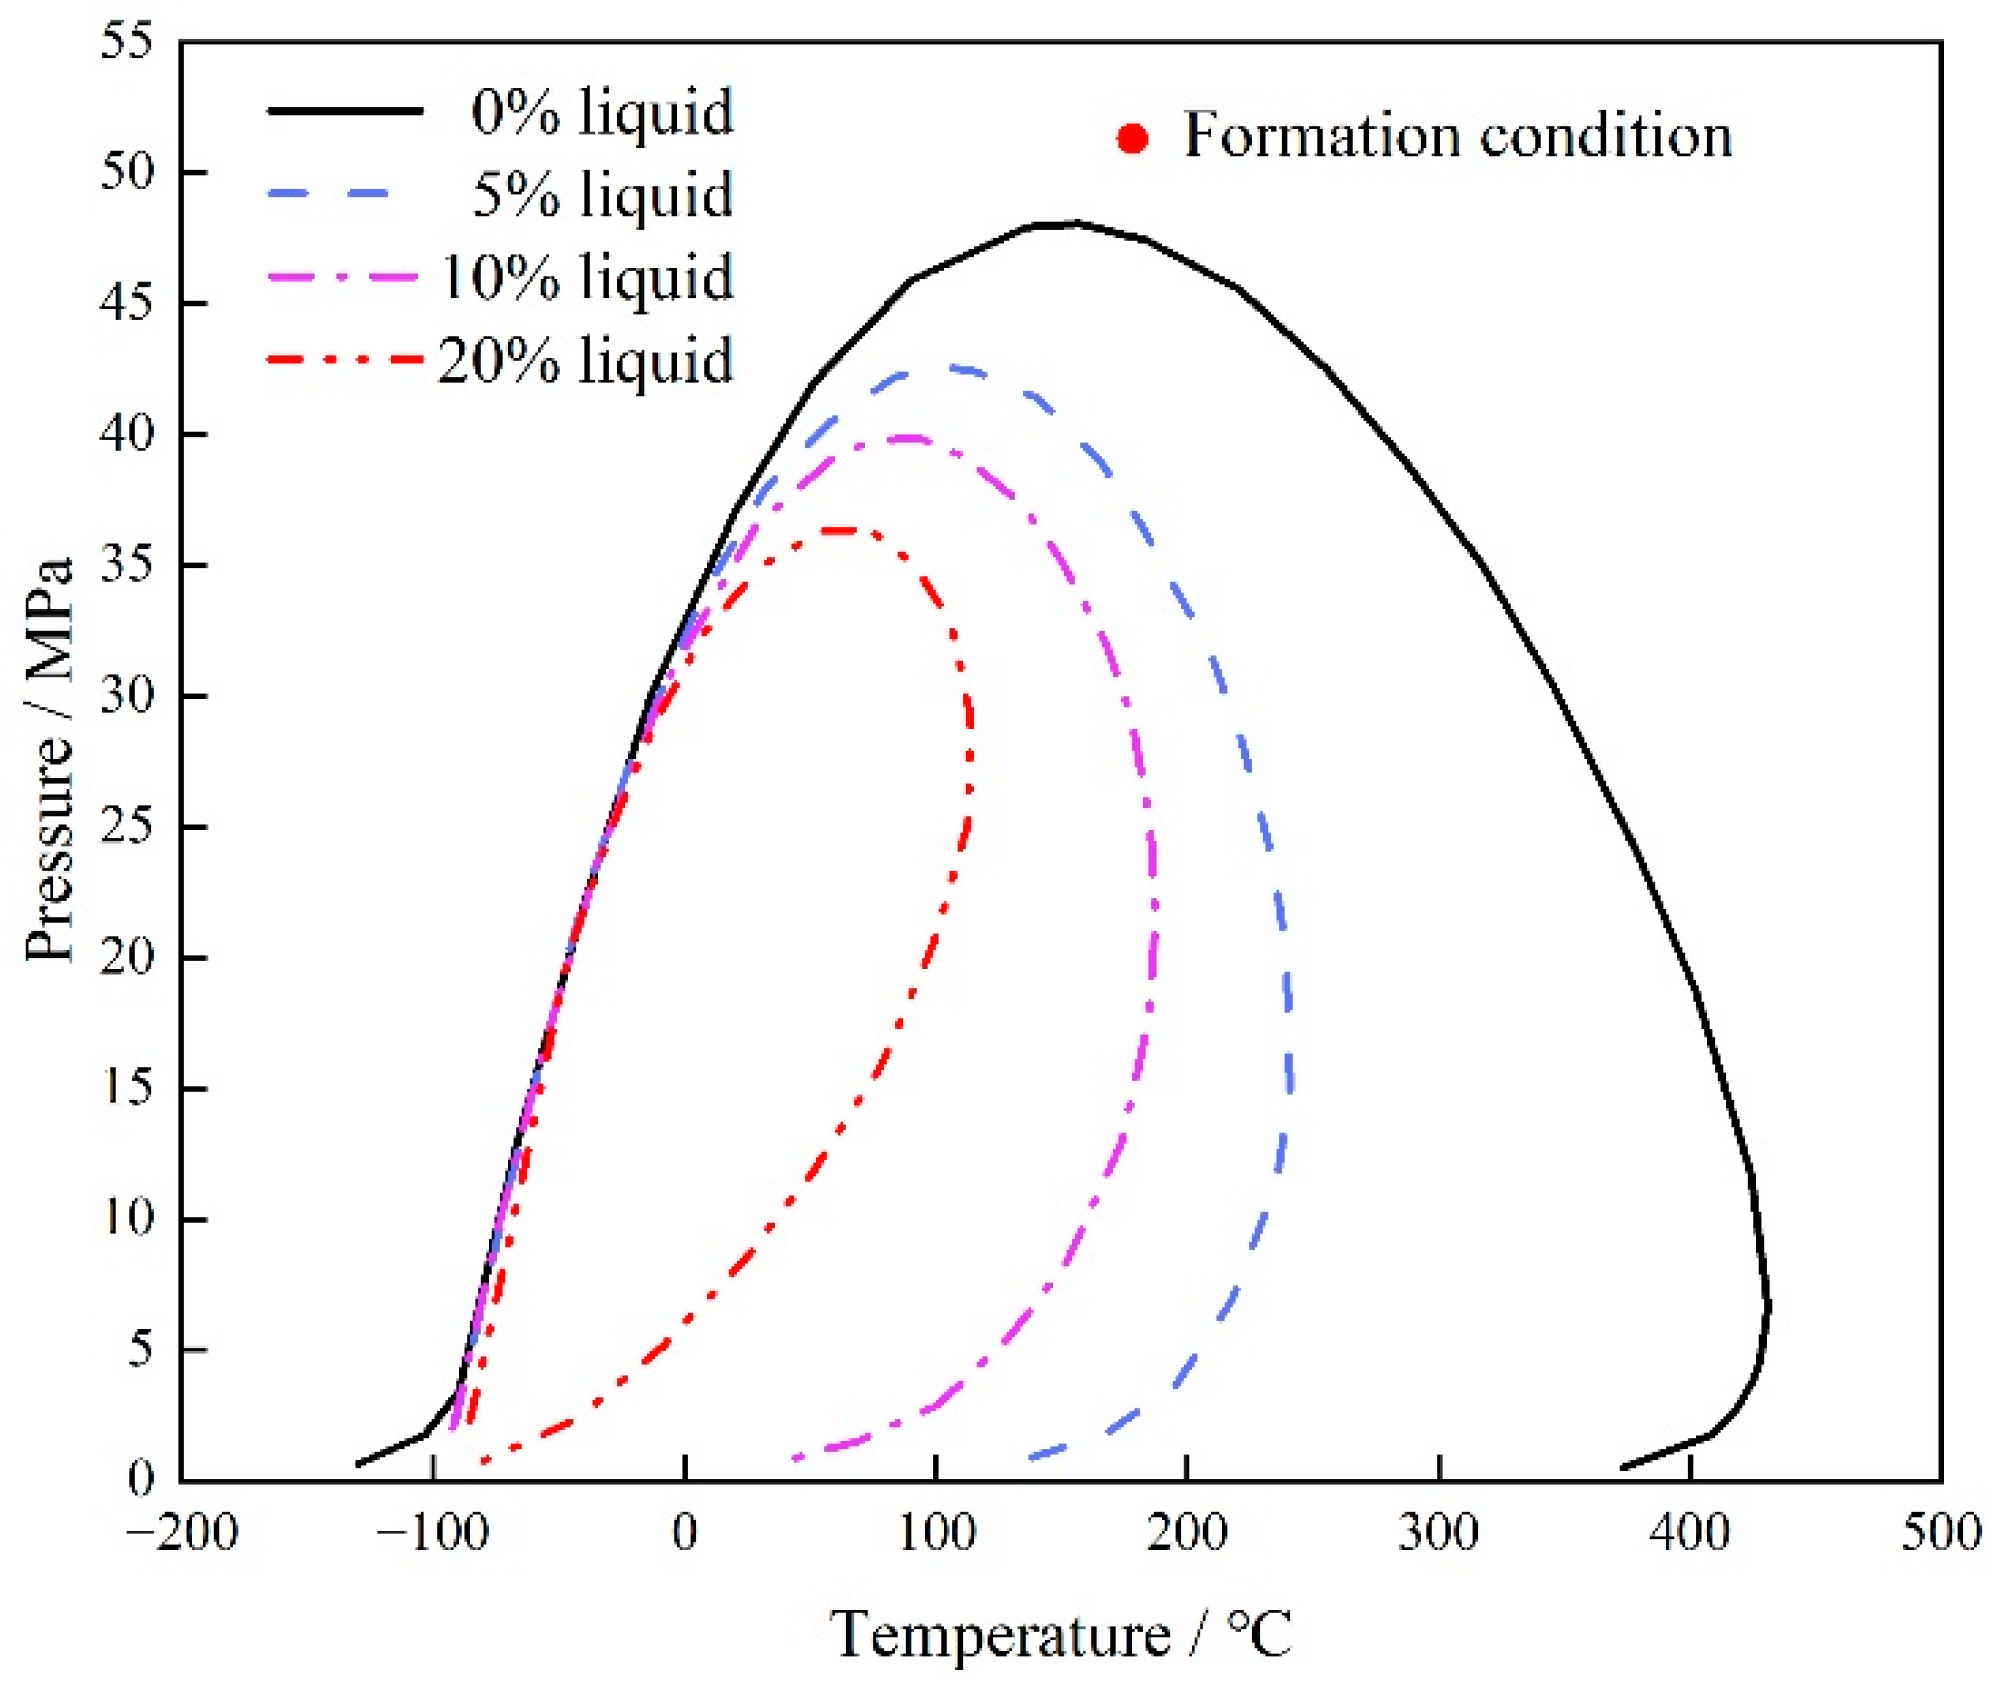
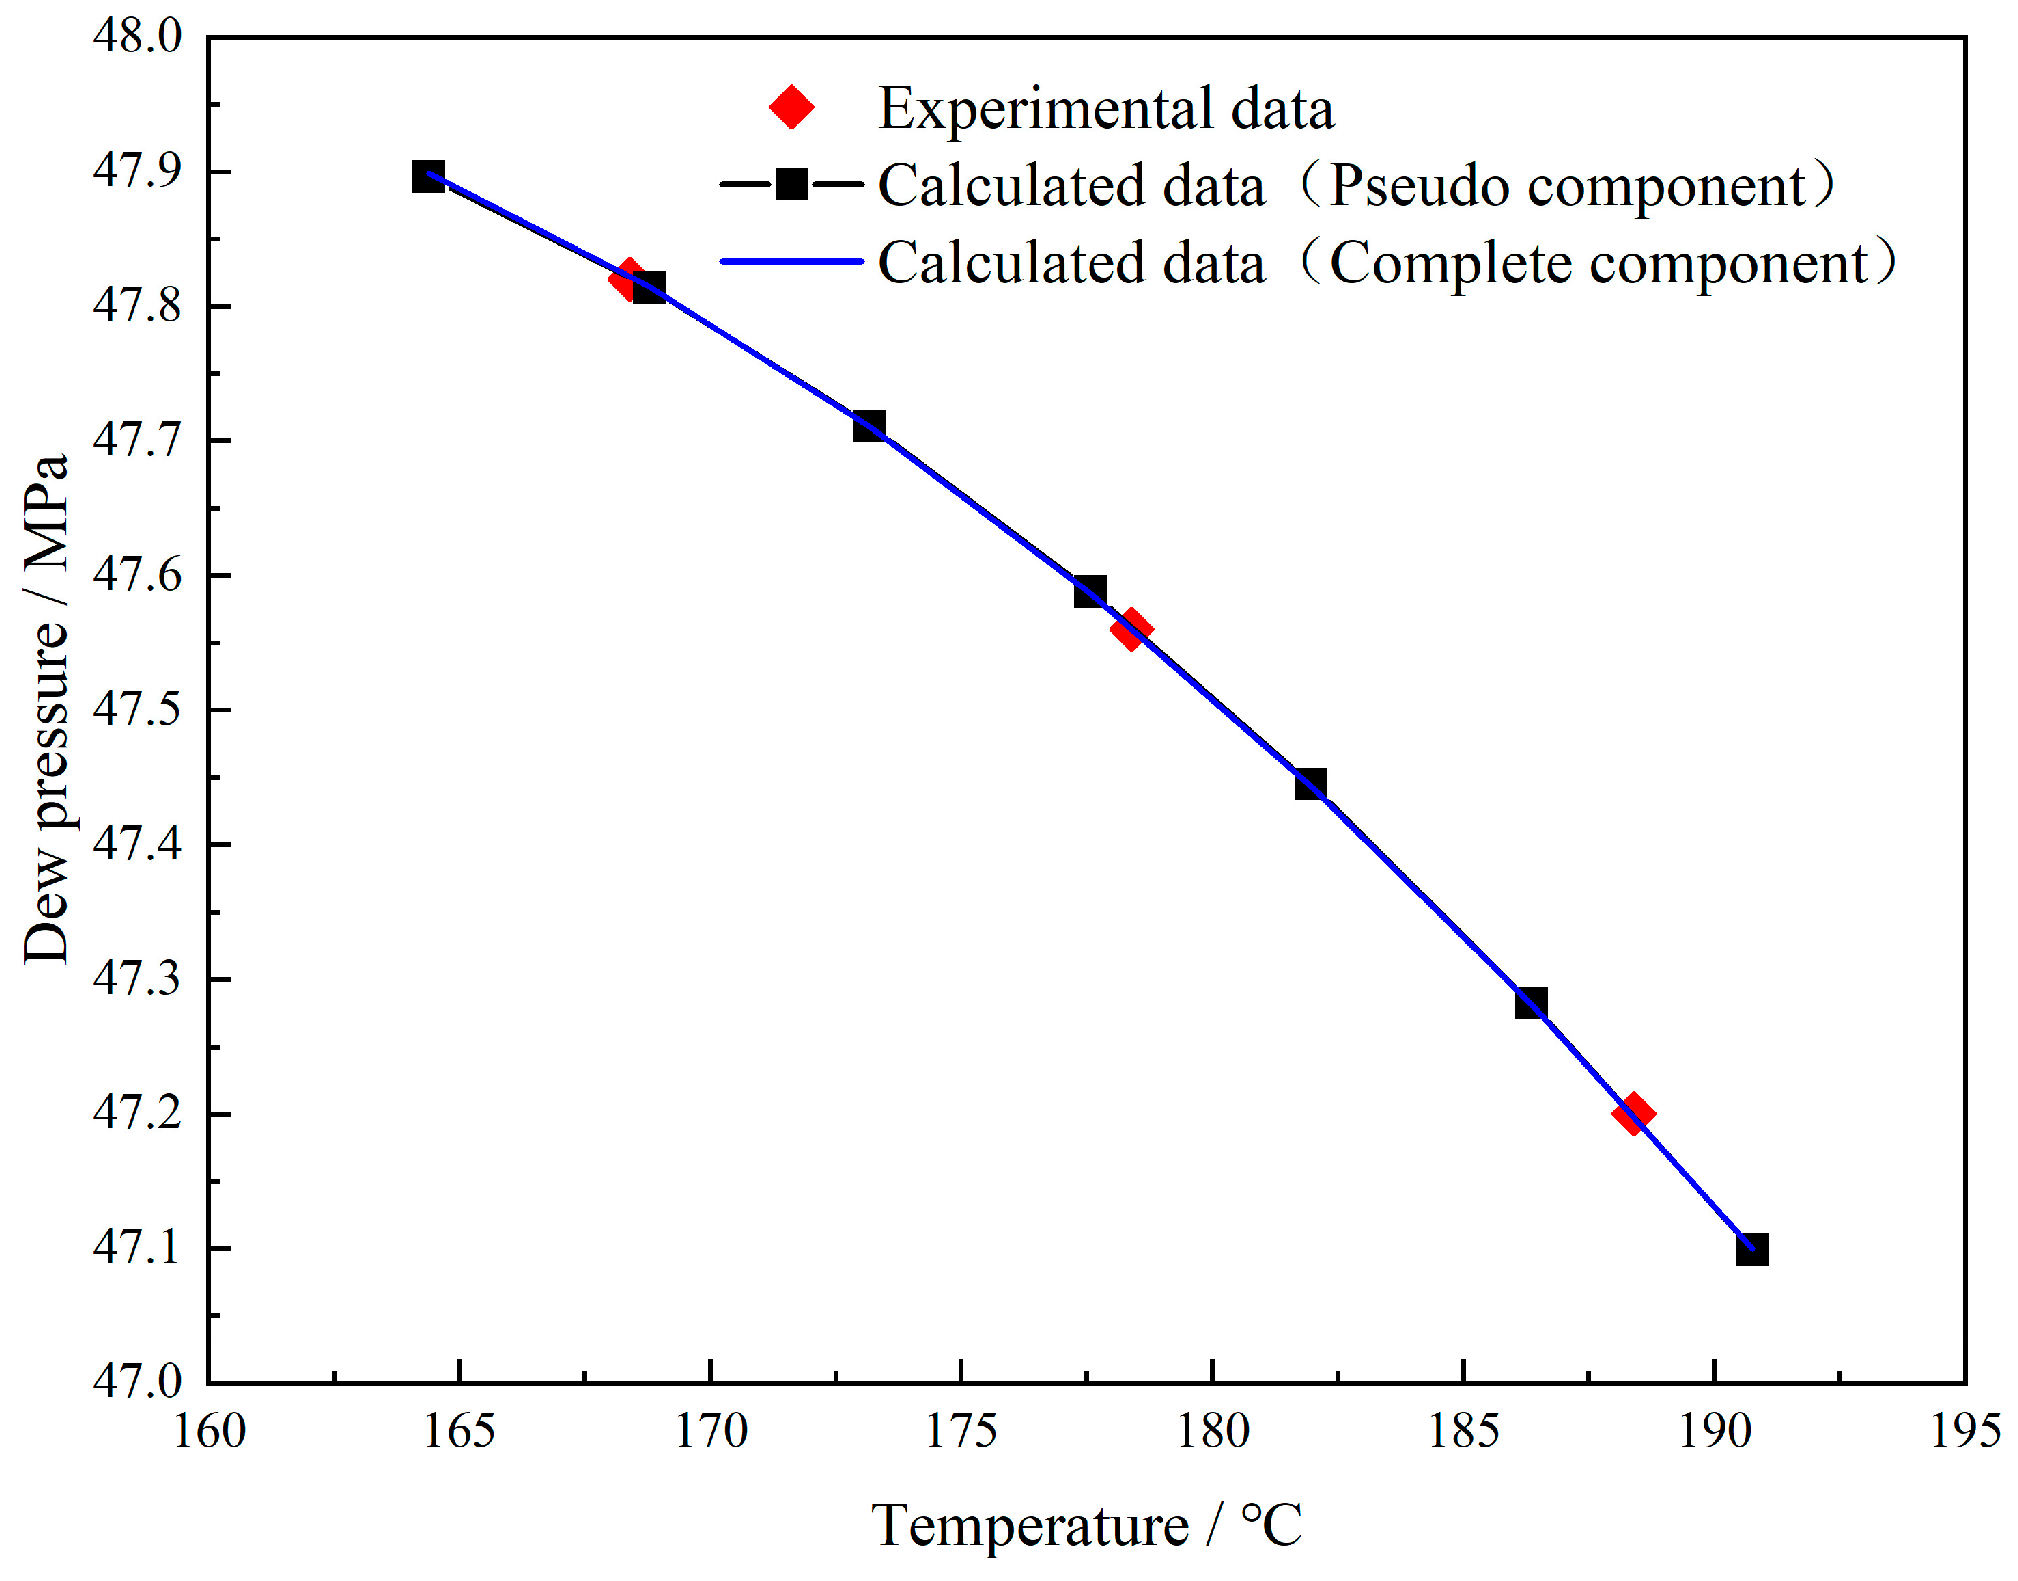
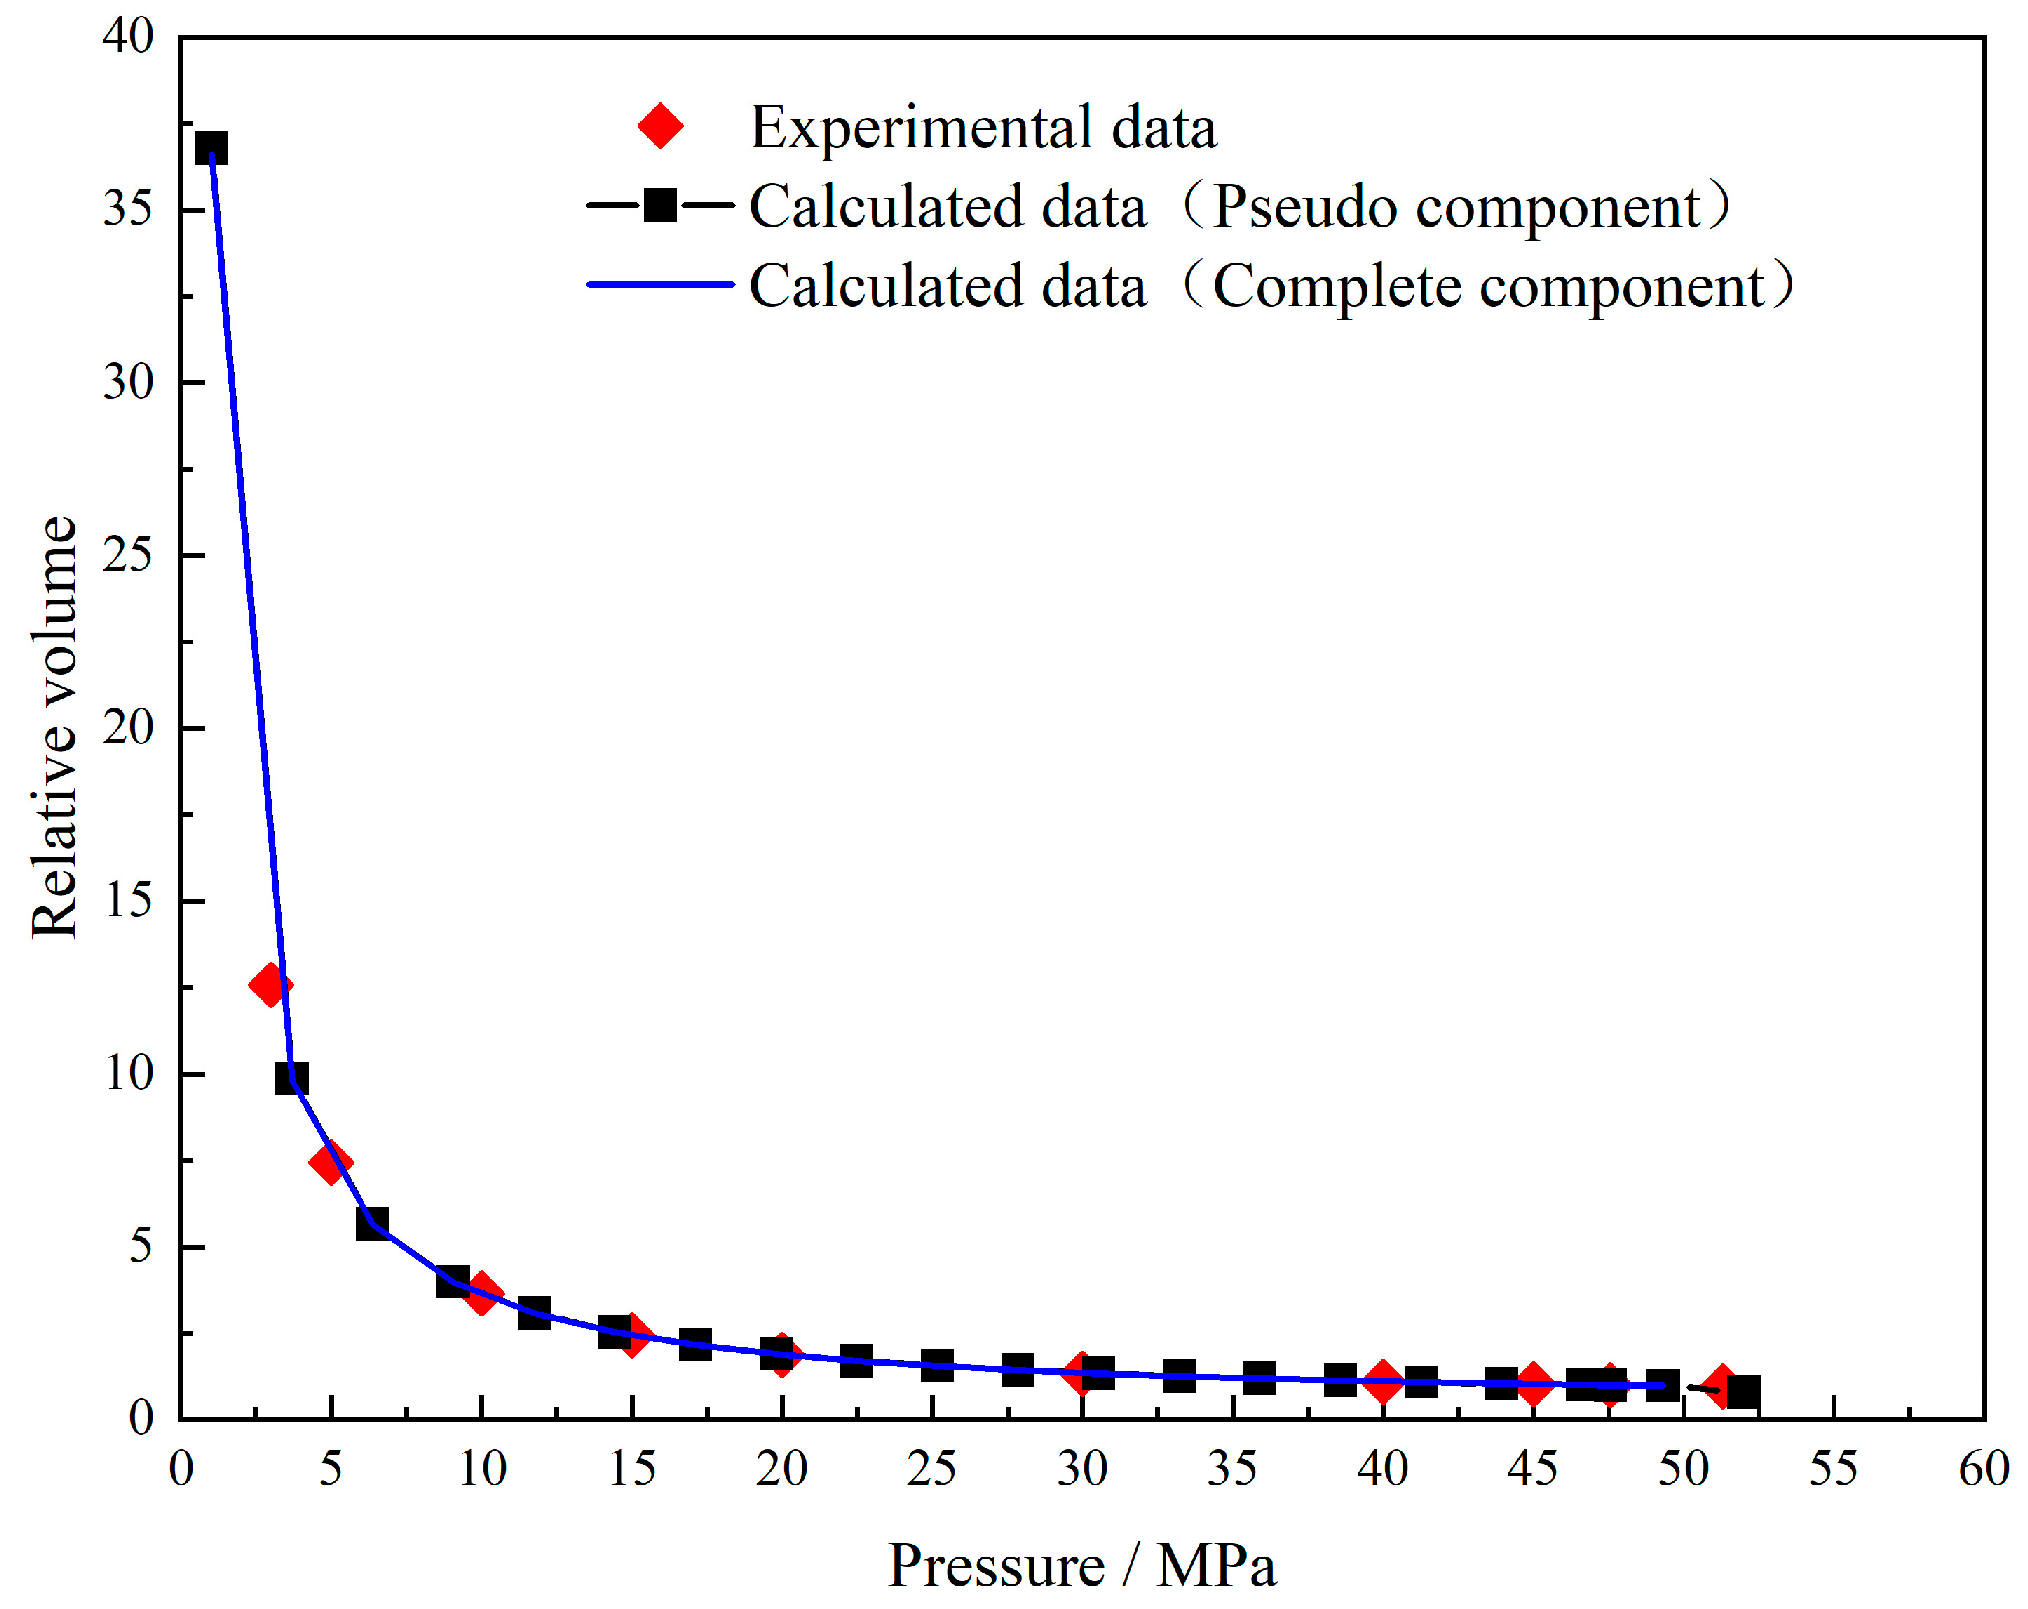
The content of C1, C2~C6+CO2, and C7+ in the condensate gas of the gas reservoir accounted for 71.97%, 18.76%, and 9.27%, respectively. The dew pressure was 47.56 MPa at the formation temperature of 178 °C. The P-T phase diagram of formation fluid is shown in Figure 3, in which 0%, 5%, 10%, and 20% represent the phase envelope lines at different condensate oil volumes. The components of condensate gas are complex, and calculations using the complete component will greatly reduce the calculation efficiency. Therefore, C2~C5 components and C6~C10 components were each combined into pseudo components. The PVT fitting was performed and dew pressure and relative volume fitting results are shown in Figure 4 and Figure 5. The results show that the fitting effect of the pseudo components is good and can be used for calculation.

3.3. Validation

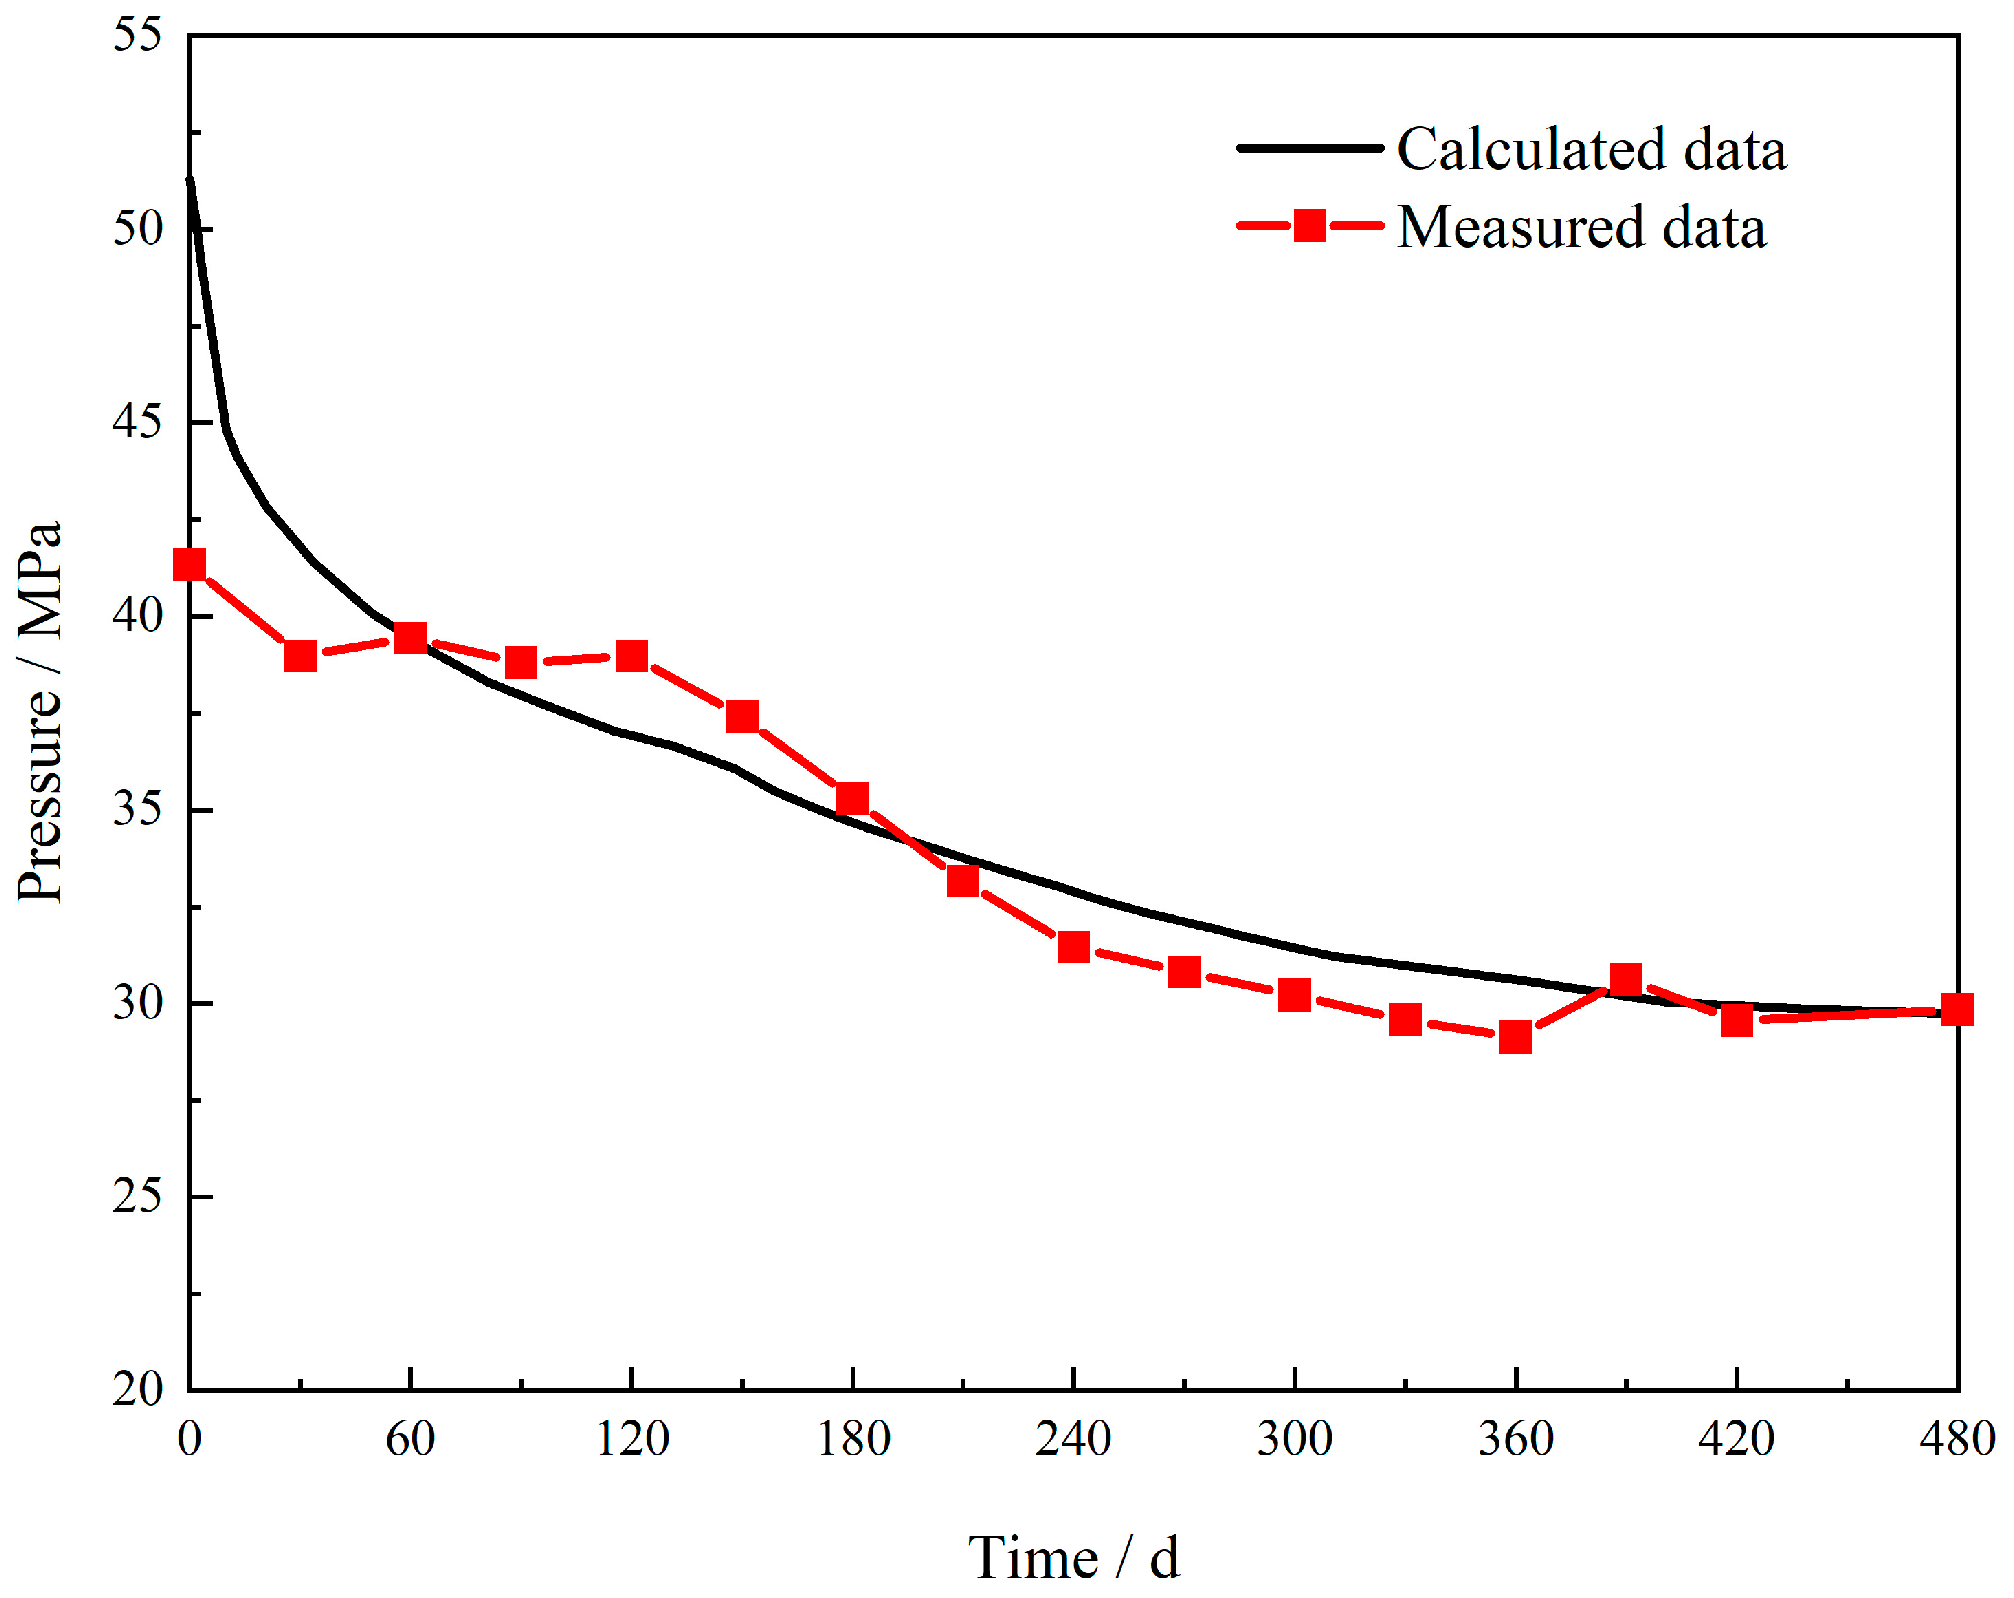
The equations were solved using the finite element numerical method. The measured production performance data of a production well within 480 days are matched with the above model, and the result is shown in Figure 6. In practice, the production rate is always changing. Therefore, in the early period of production, the measured production pressure data are unstable, and there are discrepancies between measured data and calculated data. After 390 days, the errors almost disappear, meaning that the model fits well.

4. Simulation Results and Discussion

In this section, a production simulation was conducted using the specified rate condition with a value of 14.27 × 10⁴ m3/d from the 480th day to the 1500th day.

4.1. Formation Pressure Distribution

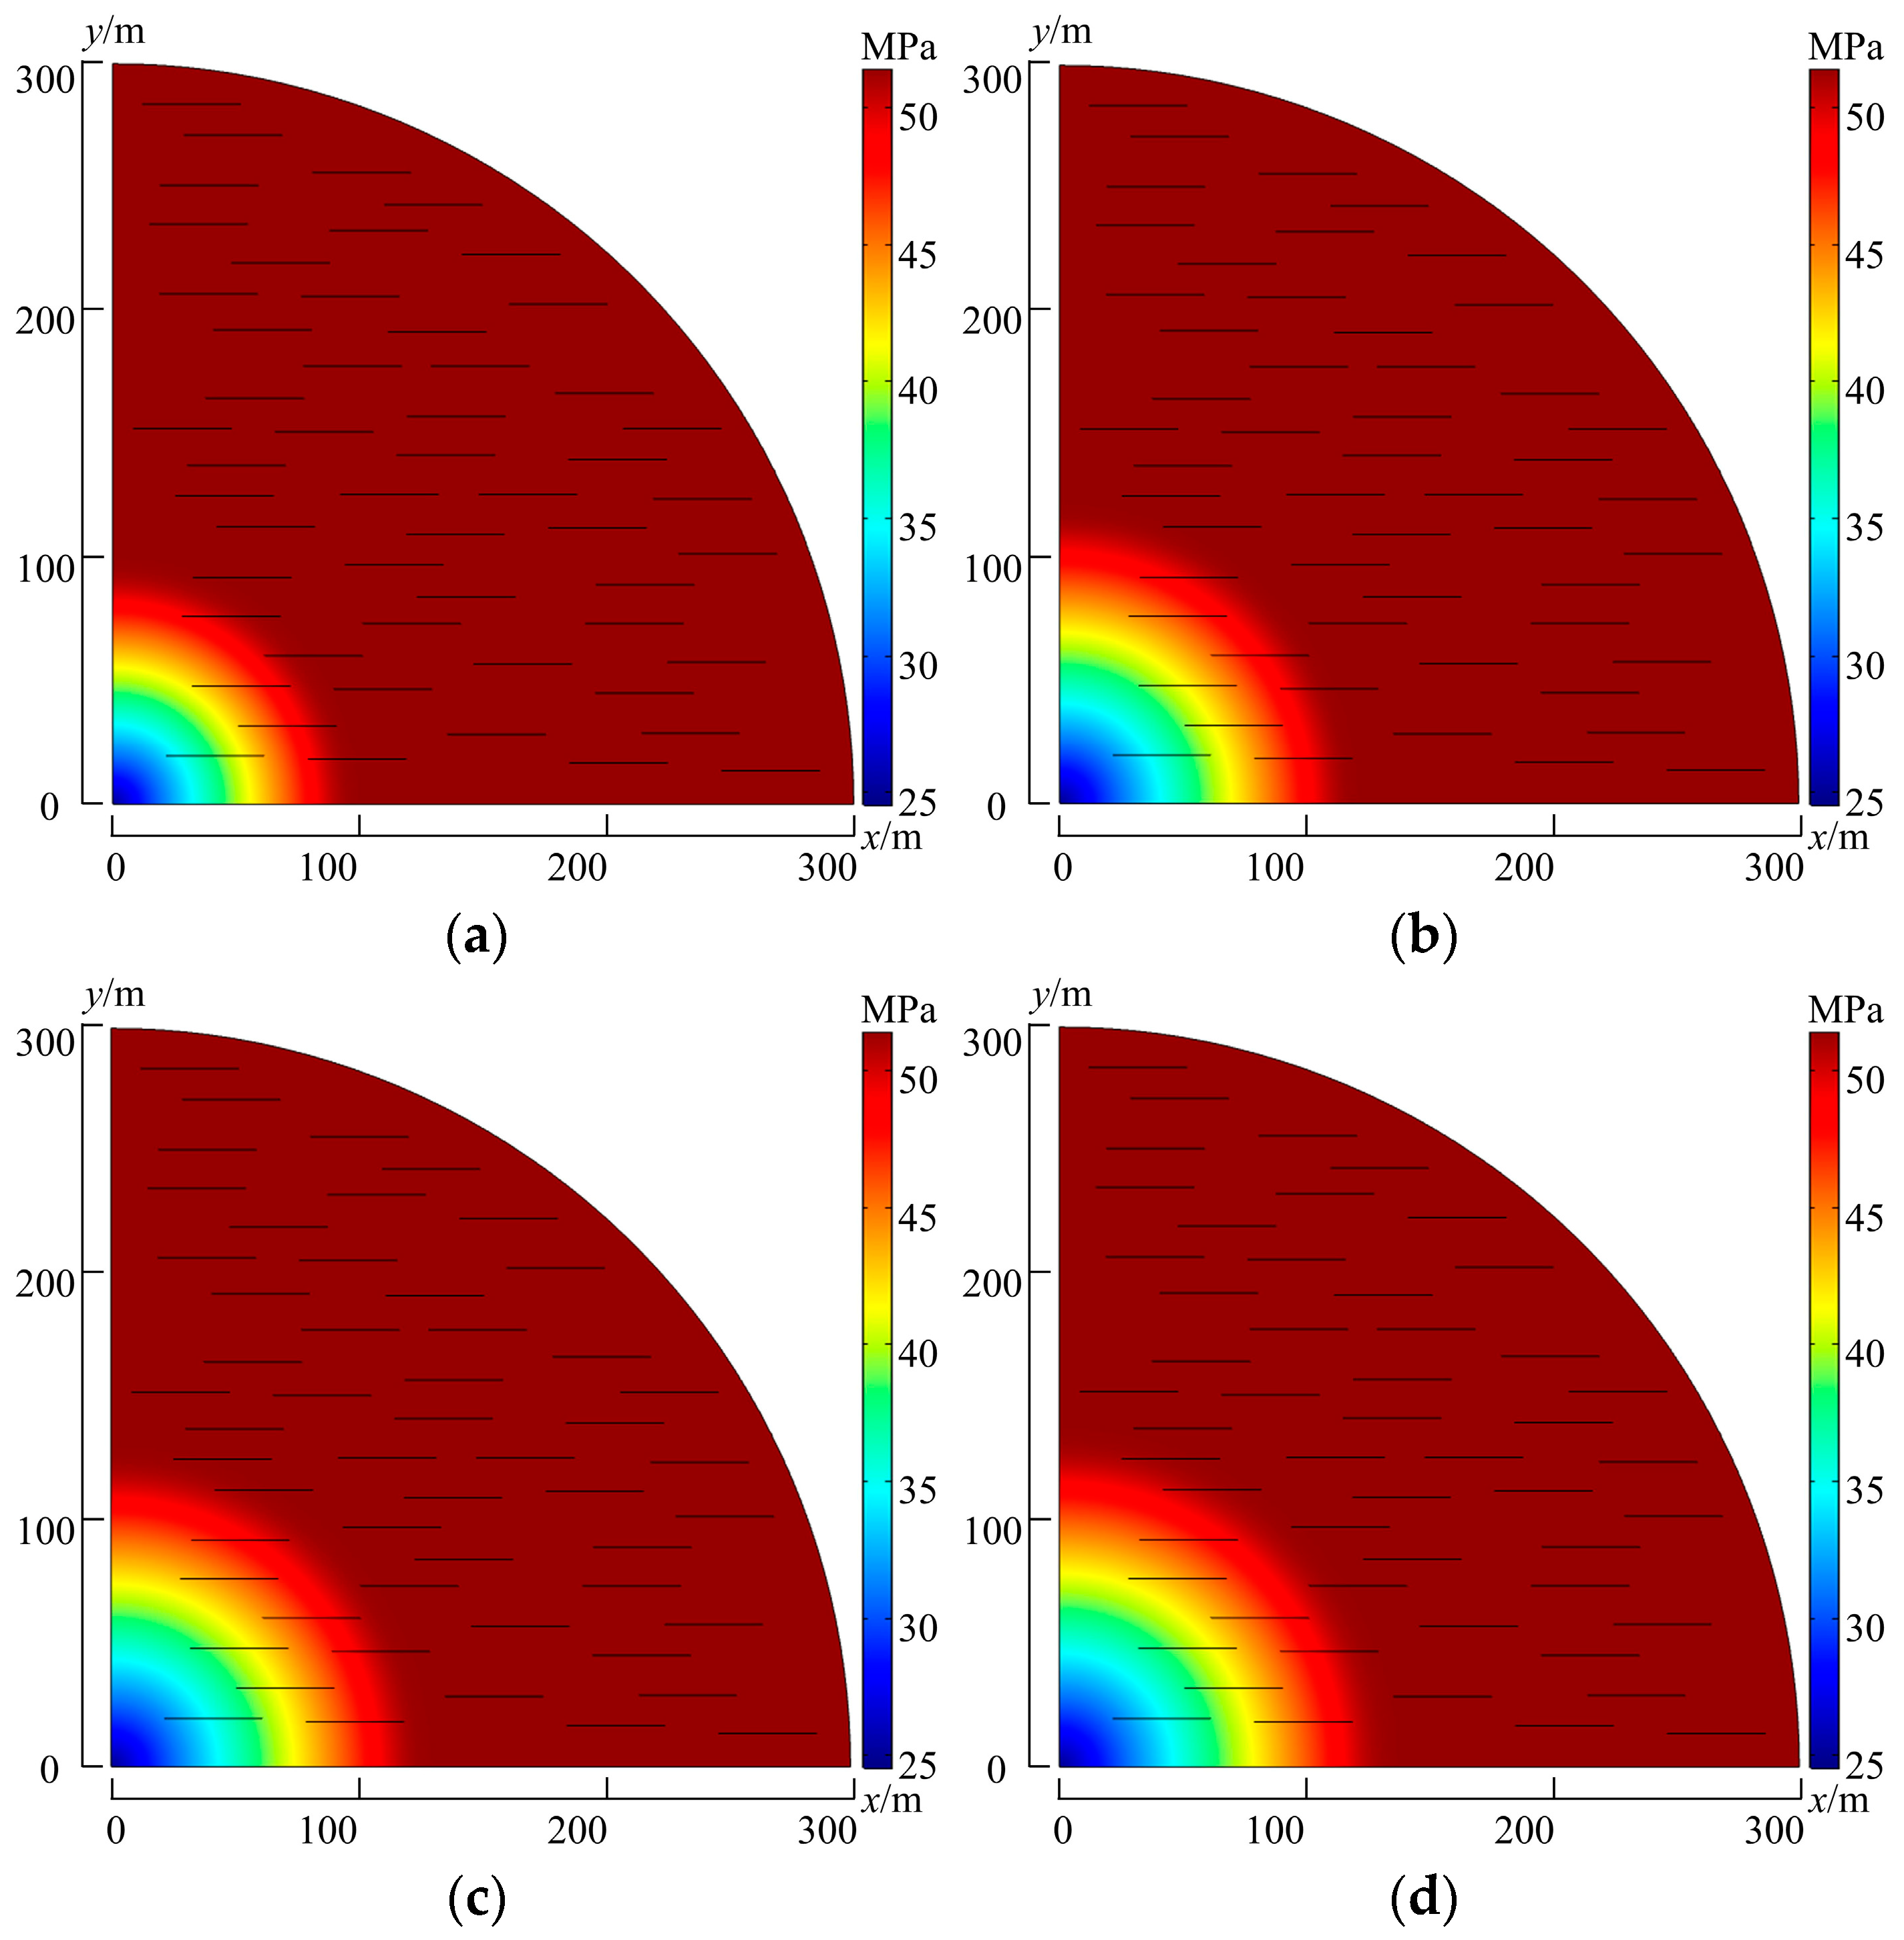
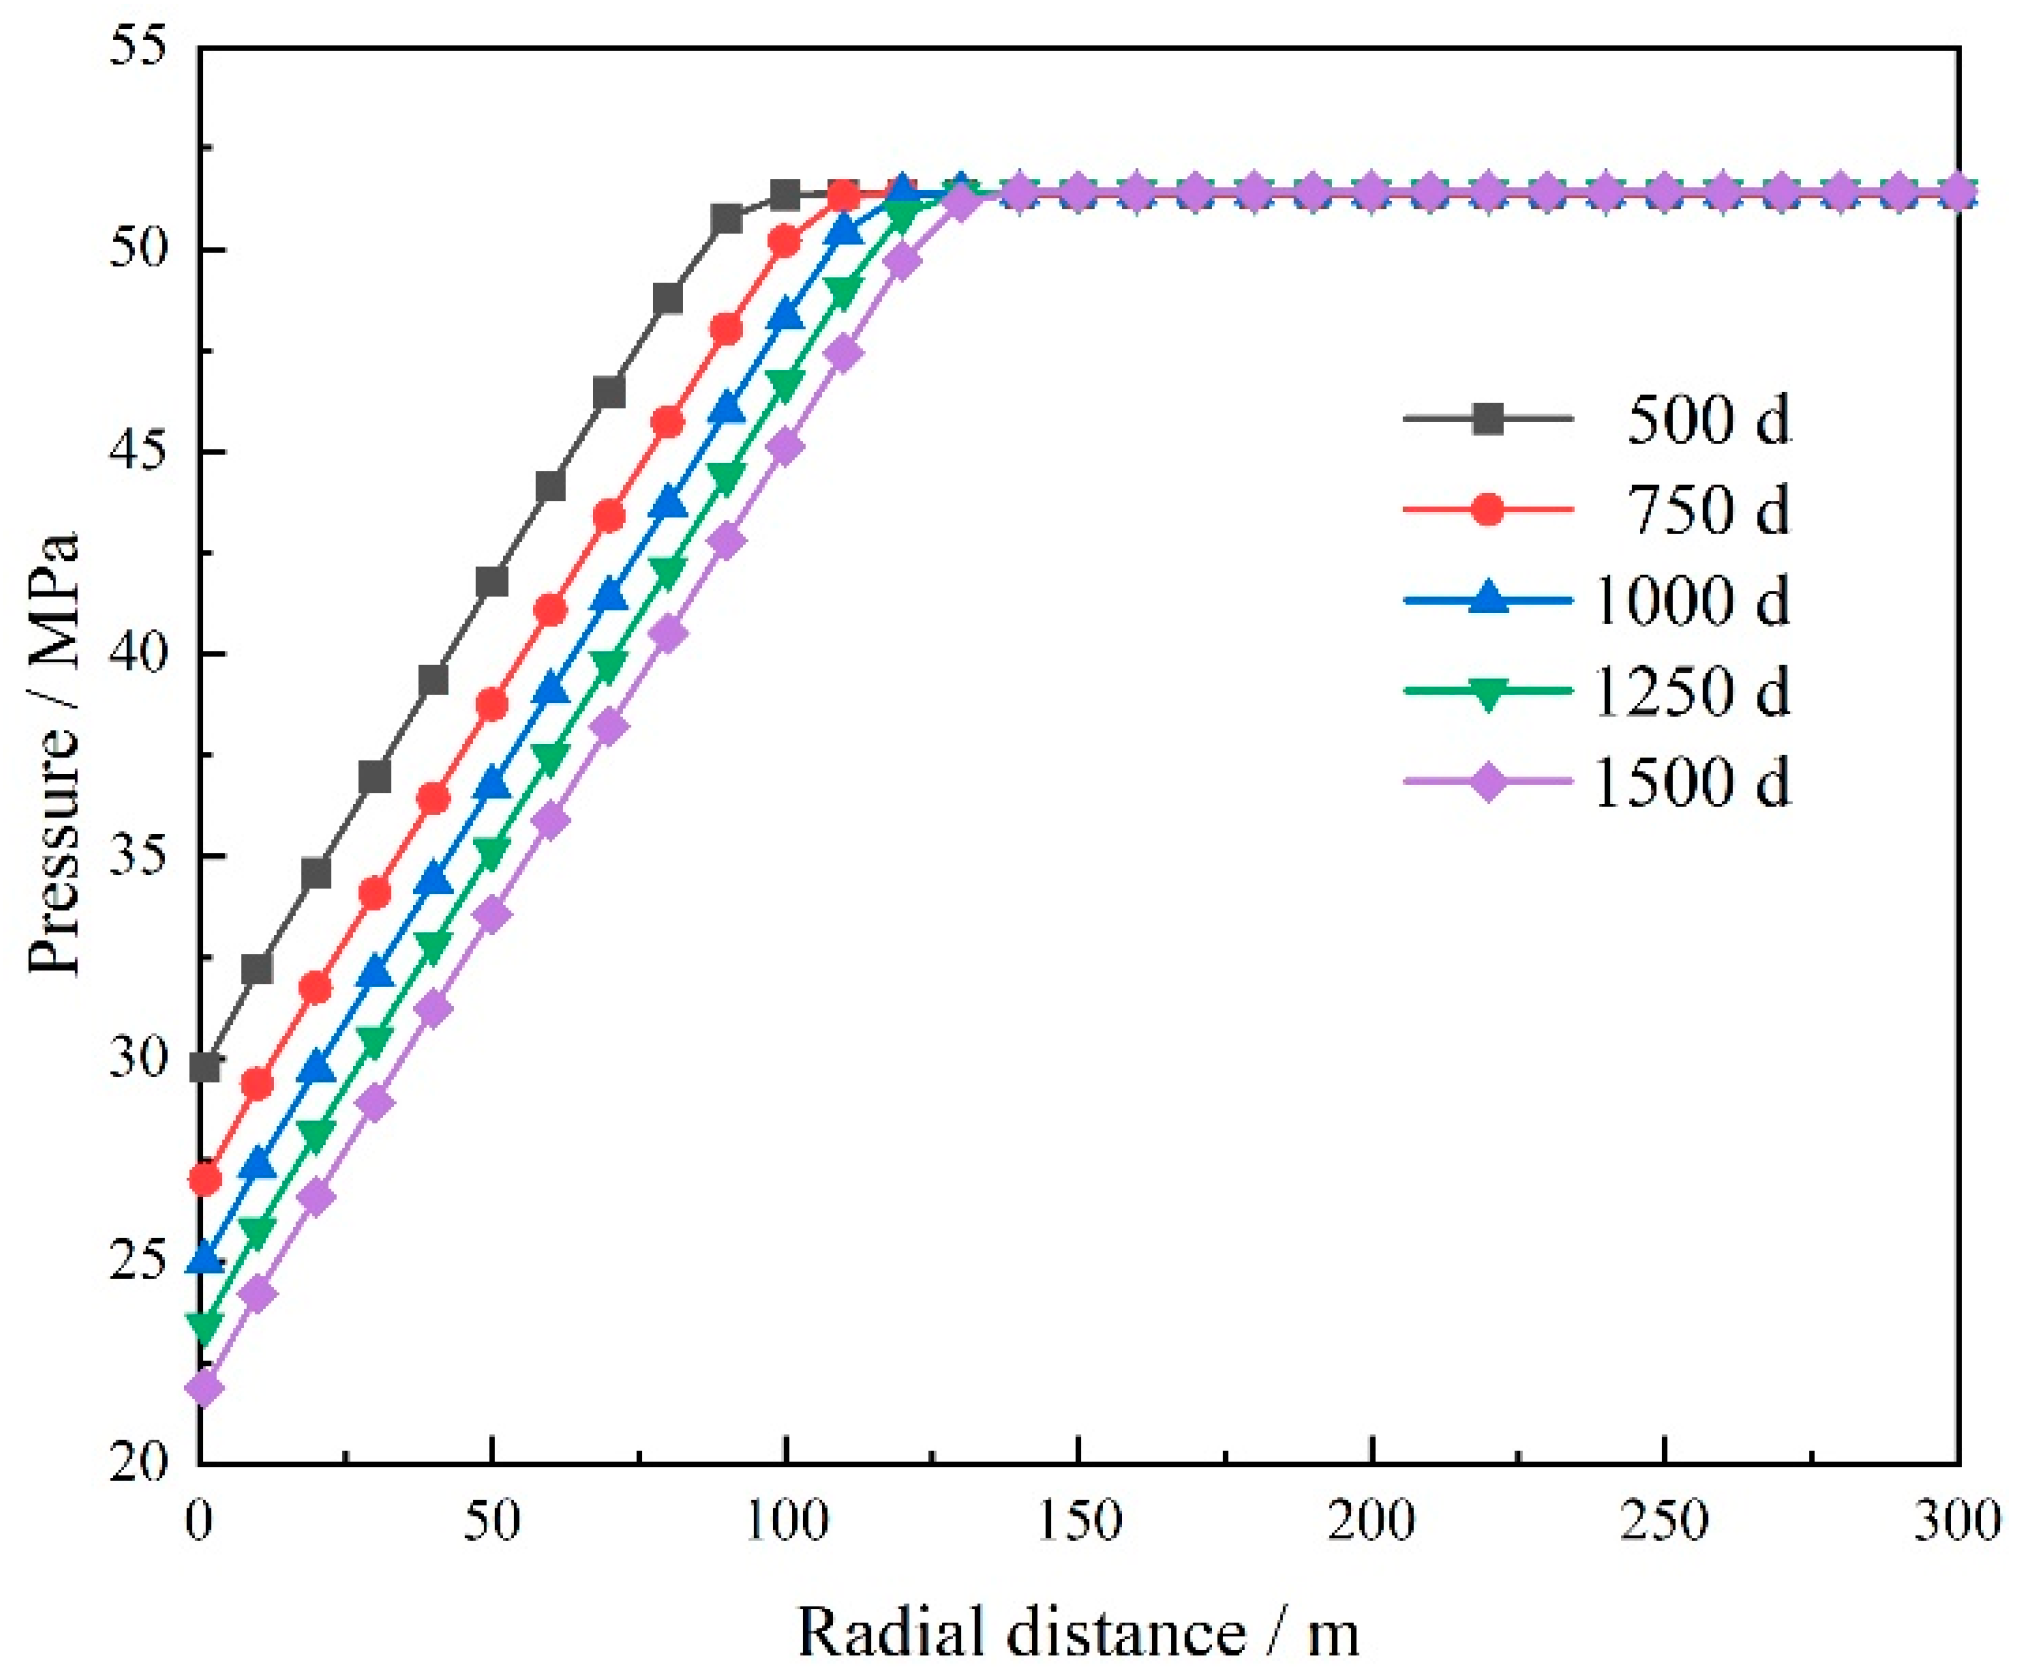
Figure 7 shows the radial distribution nephogram of formation pressure at different times. With the development of production, the pressure propagation range increases, meaning that the producing range of the formation gradually expands. As can be seen from the pressure curves shown in Figure 8, the advancing speed of the pressure moving boundary gradually decreases. From 500 days to 750 days, the moving pressure boundary advances 20 m, while from 1250 days to 1500 days, the moving pressure boundary advances only 9 m, showing a relative decrease of 55% compared with the former. The formation energy decreases when the production is conducted, and at the same time, the pressure propagation also needs to overcome the threshold pressure gradient, so the moving boundary moves slowly.

4.2. Condensate Oil Distribution

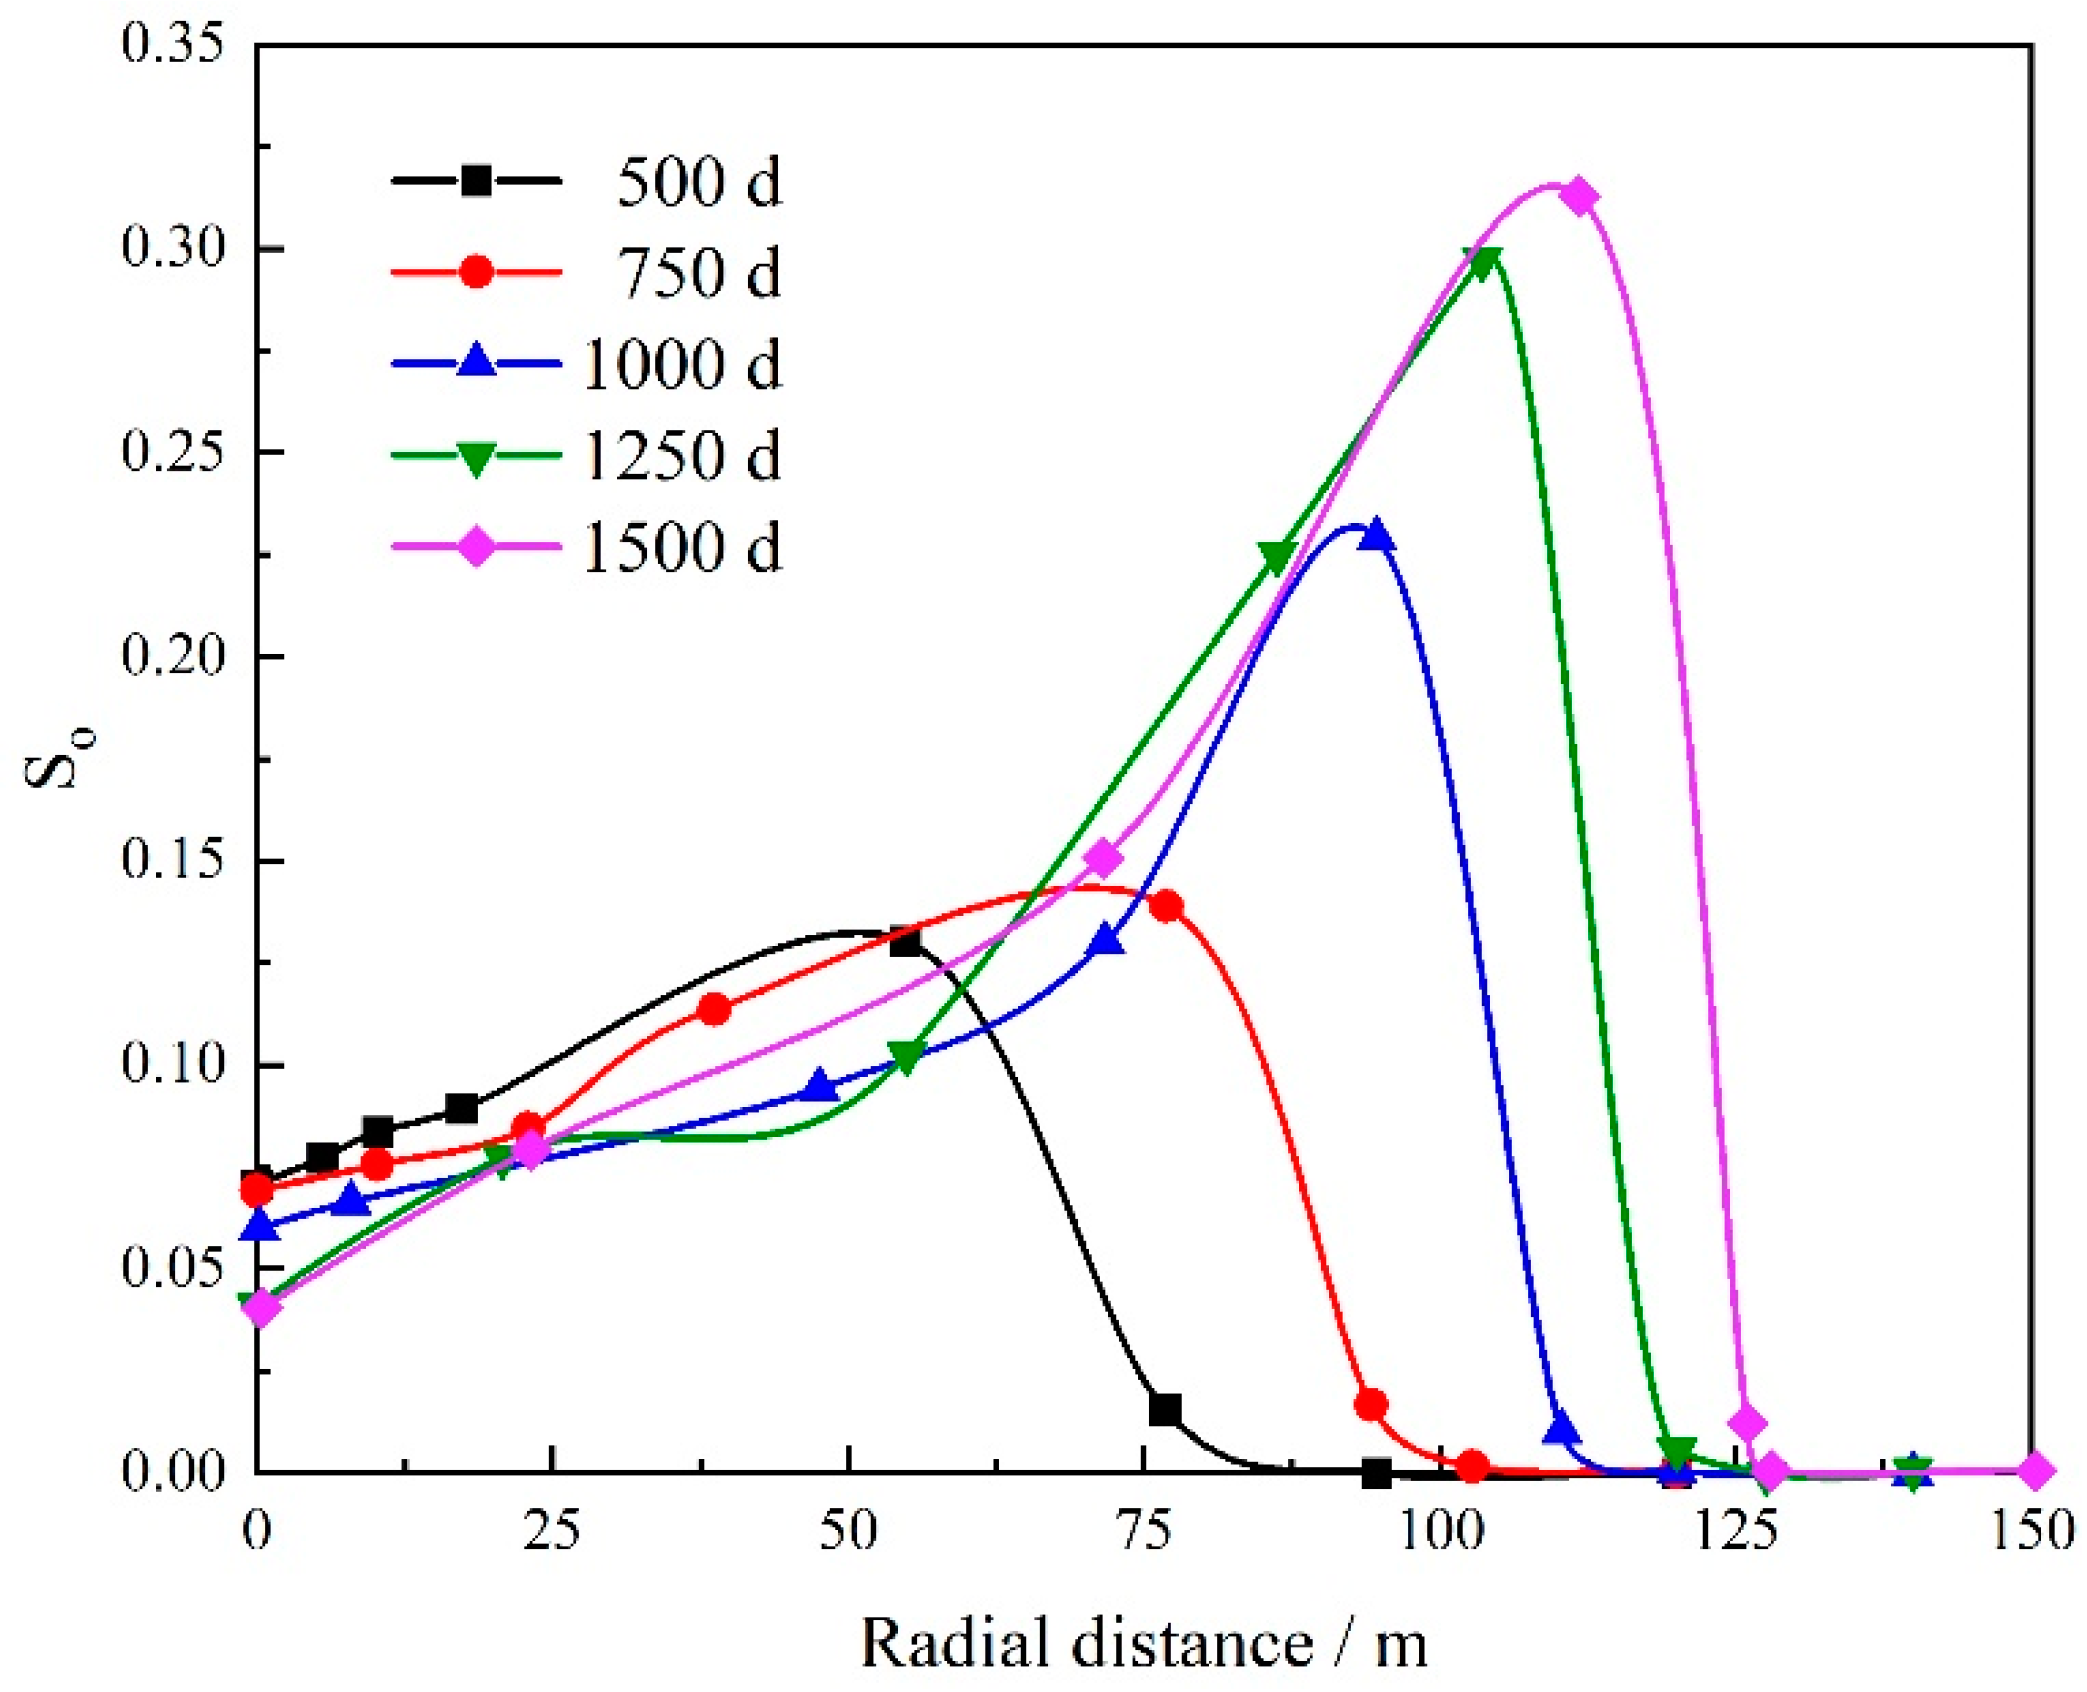
Figure 9 shows the distribution of condensate oil from the wellbore to the far side of formation at different times. Generally speaking, the closer to the wellbore, the lower the bottom hole pressure is, the higher the condensate oil saturation is. However, high saturation always brings high liquidity. With the development of production, the two-phase flow area expands, and the condensate oil is separated and gradually forms continuous phases and flows. In addition, the high-speed gas flow will carry part of condensate oil out of the reservoir, so condensate oil saturation near the wellbore decreases. When the production reaches 1500 days, the condensate oil saturation near the wellbore decreases from 0.07 to 0.04, forming a decrease of 42.8%. The pressure drop spreads to the far side of the formation, thus the transition area also gradually expands. From the 500th day to 1500th day, the transition area boundary expands from 94.4 m to 128.3 m.

4.3. Influence of Discrete Natural Fractures

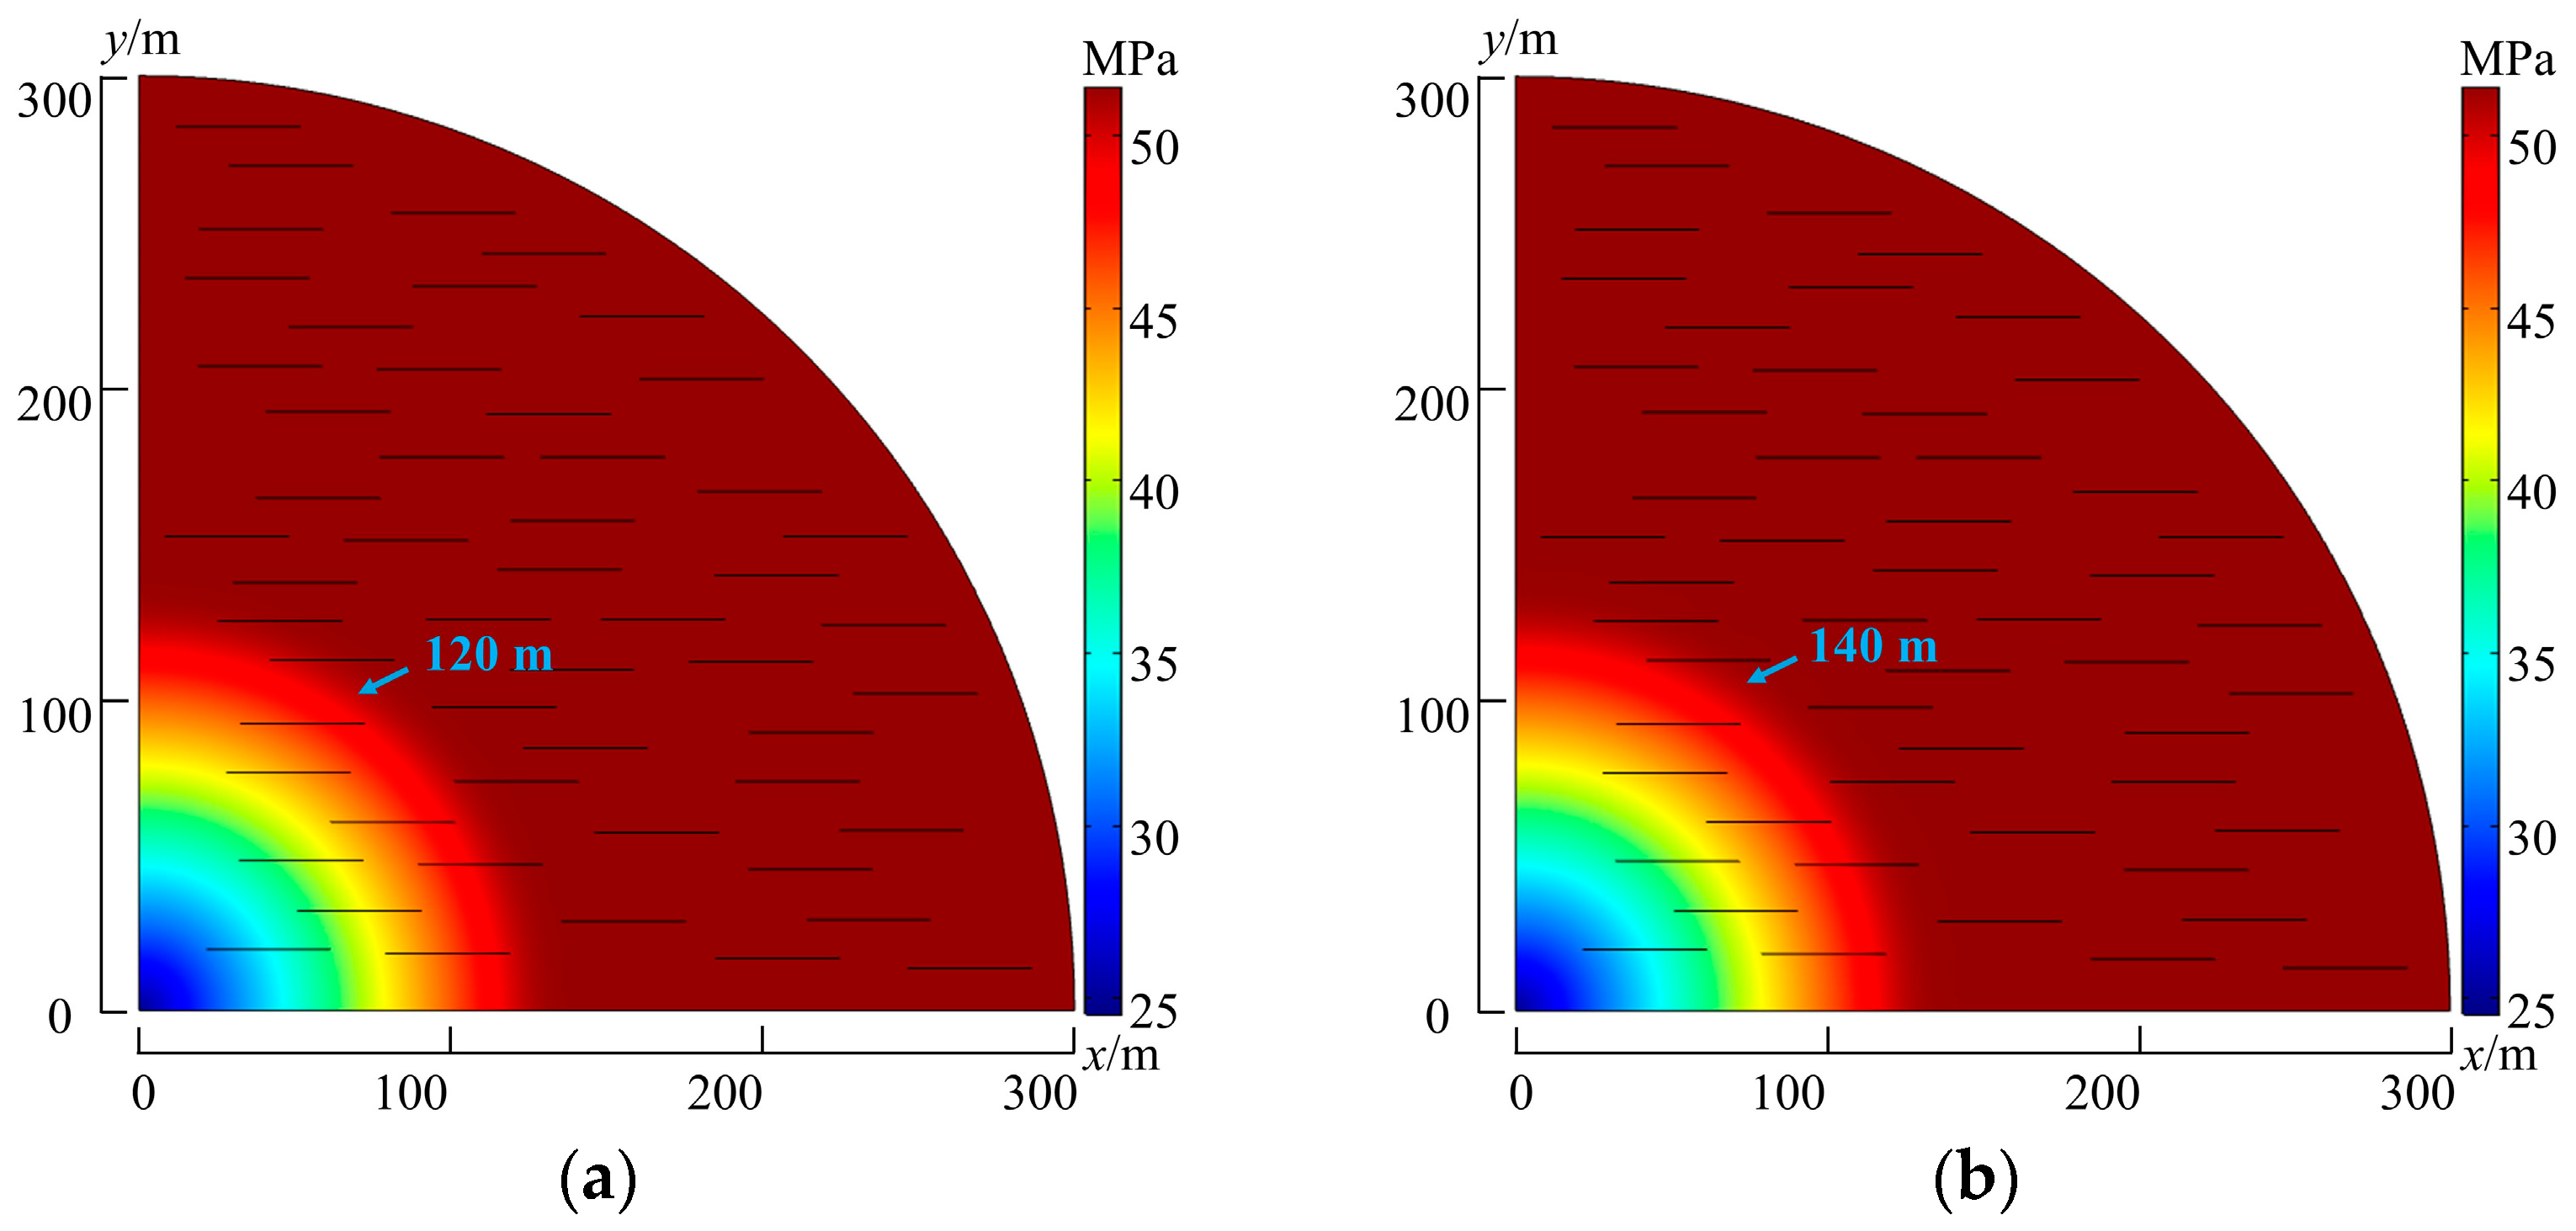
Figure 10 shows the nephogram of formation pressure distribution under different fracture permeability. The discrete natural fractures and matrix are spatially continuous, so the pressure field is continuous. Compared with the initial fracture permeability, the advancing distance of the moving pressure boundary increases from 120 m to 140 m, with a relative increase of 16.7% after the fracture permeability doubled. Figure 11 shows the variation of condensate oil saturation in the presence of fractures with different permeabilities. With an increase in fracture permeability, the condensate oil near the wellbore is further exploited, and the condensate oil saturation decreases. As the moving pressure boundary advances farther, the oil–gas two-phase area is further expanded, and more condensate oil is produced in the middle of the formation (101–135 m).

5. Conclusions

In this paper, the component equation and discrete fracture method was applied to establish a seepage model of deep condensate gas reservoirs with natural fractures by considering the seepage laws of different flow areas, and the numerical simulation study was carried out to analyze the seepage dynamic. The following conclusions are drawn:
  • The existence of the threshold pressure gradient slows down the propagation speed of pressure to the far side of formation. For the same production interval, the advancing speed of the moving pressure boundary decreases by 55%.
  • The condensate oil saturation is not higher when it is closer to the wellbore. The continuous flow of condensate oil itself and the high-speed gas flow can reduce the condensate oil saturation near the wellbore by up to 42.8%.
  • The existence of natural fractures is conducive to the expansion of the moving pressure boundary and the utilization of formation and condensate oil. The gas–oil two-phase area becomes larger, and the condensate oil saturation in the middle of the formation increases.

Author Contributions

Conceptualization, L.Z. and W.B.; Methodology, L.Z., W.B. and Y.L.; Validation, N.L. and X.T.; Writing—original draft, W.B., N.L. and Y.L.; Writing—review and editing, L.Z. and X.T. All authors have read and agreed to the published version of the manuscript.

Funding

This research received no external funding.

Data Availability Statement

Not applicable.

Conflicts of Interest

The authors declare no conflict of interest.

References

  1. Wang, Z.; Wen, Z.; He, Z.; Song, C.; Liu, X.; Chen, R.; Liu, Z.; Bian, H.; Shi, H. Global condensate oil resource potential and exploration fields. Acta Pet. Sin. 2021, 42, 1556–1565. [Google Scholar]
  2. Shi, H.; Wang, Q.; Wang, J.; Liu, X.; Feng, C.; Hao, Y.; Pan, W. Discovery and exploration significance of large condensate gas fields in BZ19-6 structure in deep Bozhong sag. China Pet. Explor. 2019, 24, 36–45. [Google Scholar]
  3. Syed, F.I.; Dahaghi, A.K.; Muther, T. Laboratory to field scale assessment for EOR applicability in tight oil reservoirs. Pet. Sci. 2022, 19, 2131–2149. [Google Scholar] [CrossRef]
  4. Martyushev, D.A.; Ponomareva, I.N.; Osovetsky, B.M.; Kazymov, K.P.; Tomilina, E.M.; Lebedeva, A.S.; Chukhlov, A.S. Study of the structure and development of oil deposits in carbonate reservoirs using field data and X-ray microtomography. Georesursy 2022, 24, 114–124. [Google Scholar]
  5. Martyushev, D.A.; Ponomareva, I.N.; Filippov, E.V.; Li, Y. Formation of hydraulic fracturing cracks in complicated carbonate reservoirs with natural fracturing. Bull. Tomsk Polytech. Univ. Geo Assets Eng. 2022, 333, 85–94. [Google Scholar]
  6. Galkin, S.V.; Martyushev, D.A.; Osovetsky, B.M.; Kazymov, K.P.; Song, H. Evaluation of void space of complicated potentially oil-bearing carbonate formation using X-ray tomography and electron microscopy methods. Energy Rep. 2022, 8, 6245–6257. [Google Scholar] [CrossRef]
  7. Luo, X.; Wang, X.; Wu, Z.; He, T.; Qiu, X.; Yuan, F.; Tan, C. Study on Stress Sensitivity of Ultra-Low Permeability Sandstone Reservoir Considering Starting Pressure Gradient. Front. Earth Sci. 2022, 10, 890084. [Google Scholar] [CrossRef]
  8. Li, D.; Zha, W.; Liu, S.; Wang, L.; Lu, D. Pressure transient analysis of low permeability reservoir with pseudo threshold pressure gradient. J. Pet. Sci. Eng. 2016, 147, 308–316. [Google Scholar] [CrossRef]
  9. Wang, R.; Yang, J.; Wang, M.; Zhao, Y.; Chen, W. Effect of Threshold Pressure Gradients on Control Areas Determination of Production Well in CBM Reservoirs. Adv. Polym. Technol. 2019, 2019, 3517642. [Google Scholar] [CrossRef] [Green Version]
  10. Ren, S.; Shen, F.; Yang, S.; Zhang, X.; Luo, H.; Feng, C. Analysis and Calculation of Threshold Pressure Gradient Based on Capillary Bundle. Math. Probl. Eng. 2021, 2021, 5559131. [Google Scholar] [CrossRef]
  11. Shi, X.; Wei, J.; Bo, H.; Zheng, Q.; Yi, F.; Yin, Y.; Chen, Y.; Dong, M.; Zhang, D.; Li, J.; et al. A novel model for oil recovery estimate in heterogeneous low-permeability and tight reservoirs with pseudo threshold pressure gradient. Energy Rep. 2021, 7, 1416–1423. [Google Scholar] [CrossRef]
  12. Liu, H.; Zhao, T. Theoretical and Experimental Study on Nonlinear Flow Starting Pressure Gradient in Low Permeability Reservoir. In IOP Conference Series: Earth and Environmental Science; IOP Publishing: Bristol, UK, 2020; Volume 571, p. 012044. [Google Scholar]
  13. Lu, C.; Qin, X.; Ma, C.; Yu, L.; Geng, L.; Bian, H.; Zhang, K.; Zhou, Y. Investigation of the impact of threshold pressure gradient on gas production from hydrate deposits. Fuel 2022, 319, 123569. [Google Scholar] [CrossRef]
  14. Bo, N.; Zuping, X.; Xianshan, L.; Zhijun, L.; Zhonghua, C.; Bocai, J.; Xin, Z.; Huan, T.; Xiaolong, C. Production prediction method of horizontal wells in tight gas reservoirs considering threshold pressure gradient and stress sensitivity. J. Pet. Sci. Eng. 2020, 187, 106750. [Google Scholar] [CrossRef]
  15. Lu, J. Pressure Behavior of a Hydraulic Fractured Well in Tight Gas Formation with Threshold Pressure Gradient. In Proceedings of the SPE Middle East Unconventional Gas Conference and Exhibition, Abu Dhabi, United Arab Emirates, 23–25 March 2012. [Google Scholar]
  16. Tian, W.; Zhu, W.; Zhu, H.; Zhang, X.; An, Z.; Du, S. Condensate gas reservoir threshold pressure gradient for tight sandstone. J. Cent. South Univ. 2015, 46, 3415–3421. [Google Scholar]
  17. Martyushev, D.A.; Galkin, S.V.; Shelepov, V.V. The influence of the rock stress state on matrix and fracture permeability under conditions of various lithofacial zones of the tournaisian-fammenian oil fields in the Upper Kama Region. Moscow Univ. Geol. Bull. 2019, 74, 573–581. [Google Scholar] [CrossRef]
  18. Martyushev, D.A.; Yurikov, A. Evaluation of opening of fractures in the Logovskoye carbonate reservoir, Perm Krai, Russia. Pet. Res. 2021, 6, 137–143. [Google Scholar] [CrossRef]
  19. Xia, Y.; Jin, Y.; Chen, M.; Chen, K.P. An Enriched Approach for Modeling Multiscale Discrete-Fracture/Matrix Interaction for Unconventional-Reservoir Simulations. SPE J. 2018, 24, 349–374. [Google Scholar] [CrossRef]
  20. Zidane, A.; Firoozabadi, A. An efficient numerical model for multicomponent compressible flow in fractured porous media. Adv. Water Resour. 2014, 74, 127–147. [Google Scholar] [CrossRef]
  21. Xia, Y.; Jin, Y.; Oswald, J.; Chen, M.; Chen, K. Extended finite element modeling of production from a reservoir embedded with an arbitrary fracture network. Int. J. Numer. Methods Fluids 2018, 86, 329–345. [Google Scholar] [CrossRef]
  22. Wang, Y.; Shahvali, M. Discrete fracture modeling using Centroidal Voronoi grid for simulation of shale gas plays with coupled nonlinear physics. Fuel 2016, 163, 65–73. [Google Scholar] [CrossRef]
  23. Zhao, Y.; Lu, G.; Zhang, L.; Wei, Y.; Guo, J.; Chang, C. Numerical simulation of shale gas reservoirs considering discrete fracture network using a coupled multiple transport mechanisms and geomechanics model. J. Pet. Sci. Eng. 2020, 195, 107588. [Google Scholar] [CrossRef]
  24. Gringarten, A.C.; Al-Lamki, A.; Daungkaew, S.; Mott, R.; Whittle, T.M. Well Test Analysis in Gas-Condensate Reservoirs. In Proceedings of the SPE Annual Technical Conference and Exhibition, Dallas, TX, USA, 1–4 October 2000. [Google Scholar]
  25. Huang, Z.; Yan, X.; Yao, J. A Two-Phase Flow Simulation of Discrete-Fractured Media using Mimetic Finite Difference Method. Commun. Comput. Phys. 2014, 16, 799–816. [Google Scholar] [CrossRef]
  26. Forchheimer, P. Wasserbewegung durch boden. Z. Ver. Dtsch. Ing. 1901, 45, 1782–1788. [Google Scholar]
  27. Blom, S.M.P.; Hagoort, J. The Combined Effect of Near-Critical Relative Permeability and Non-Darcy Flow on Well Impairment by Condensate Drop Out. SPE Reserv. Eval. Eng. 1998, 1, 421–429. [Google Scholar] [CrossRef]
  28. Peng, D.-Y.; Robinson, D.B. A New Two-Constant Equation of State. Ind. Eng. Chem. Fundam. 1976, 15, 59–64. [Google Scholar] [CrossRef]
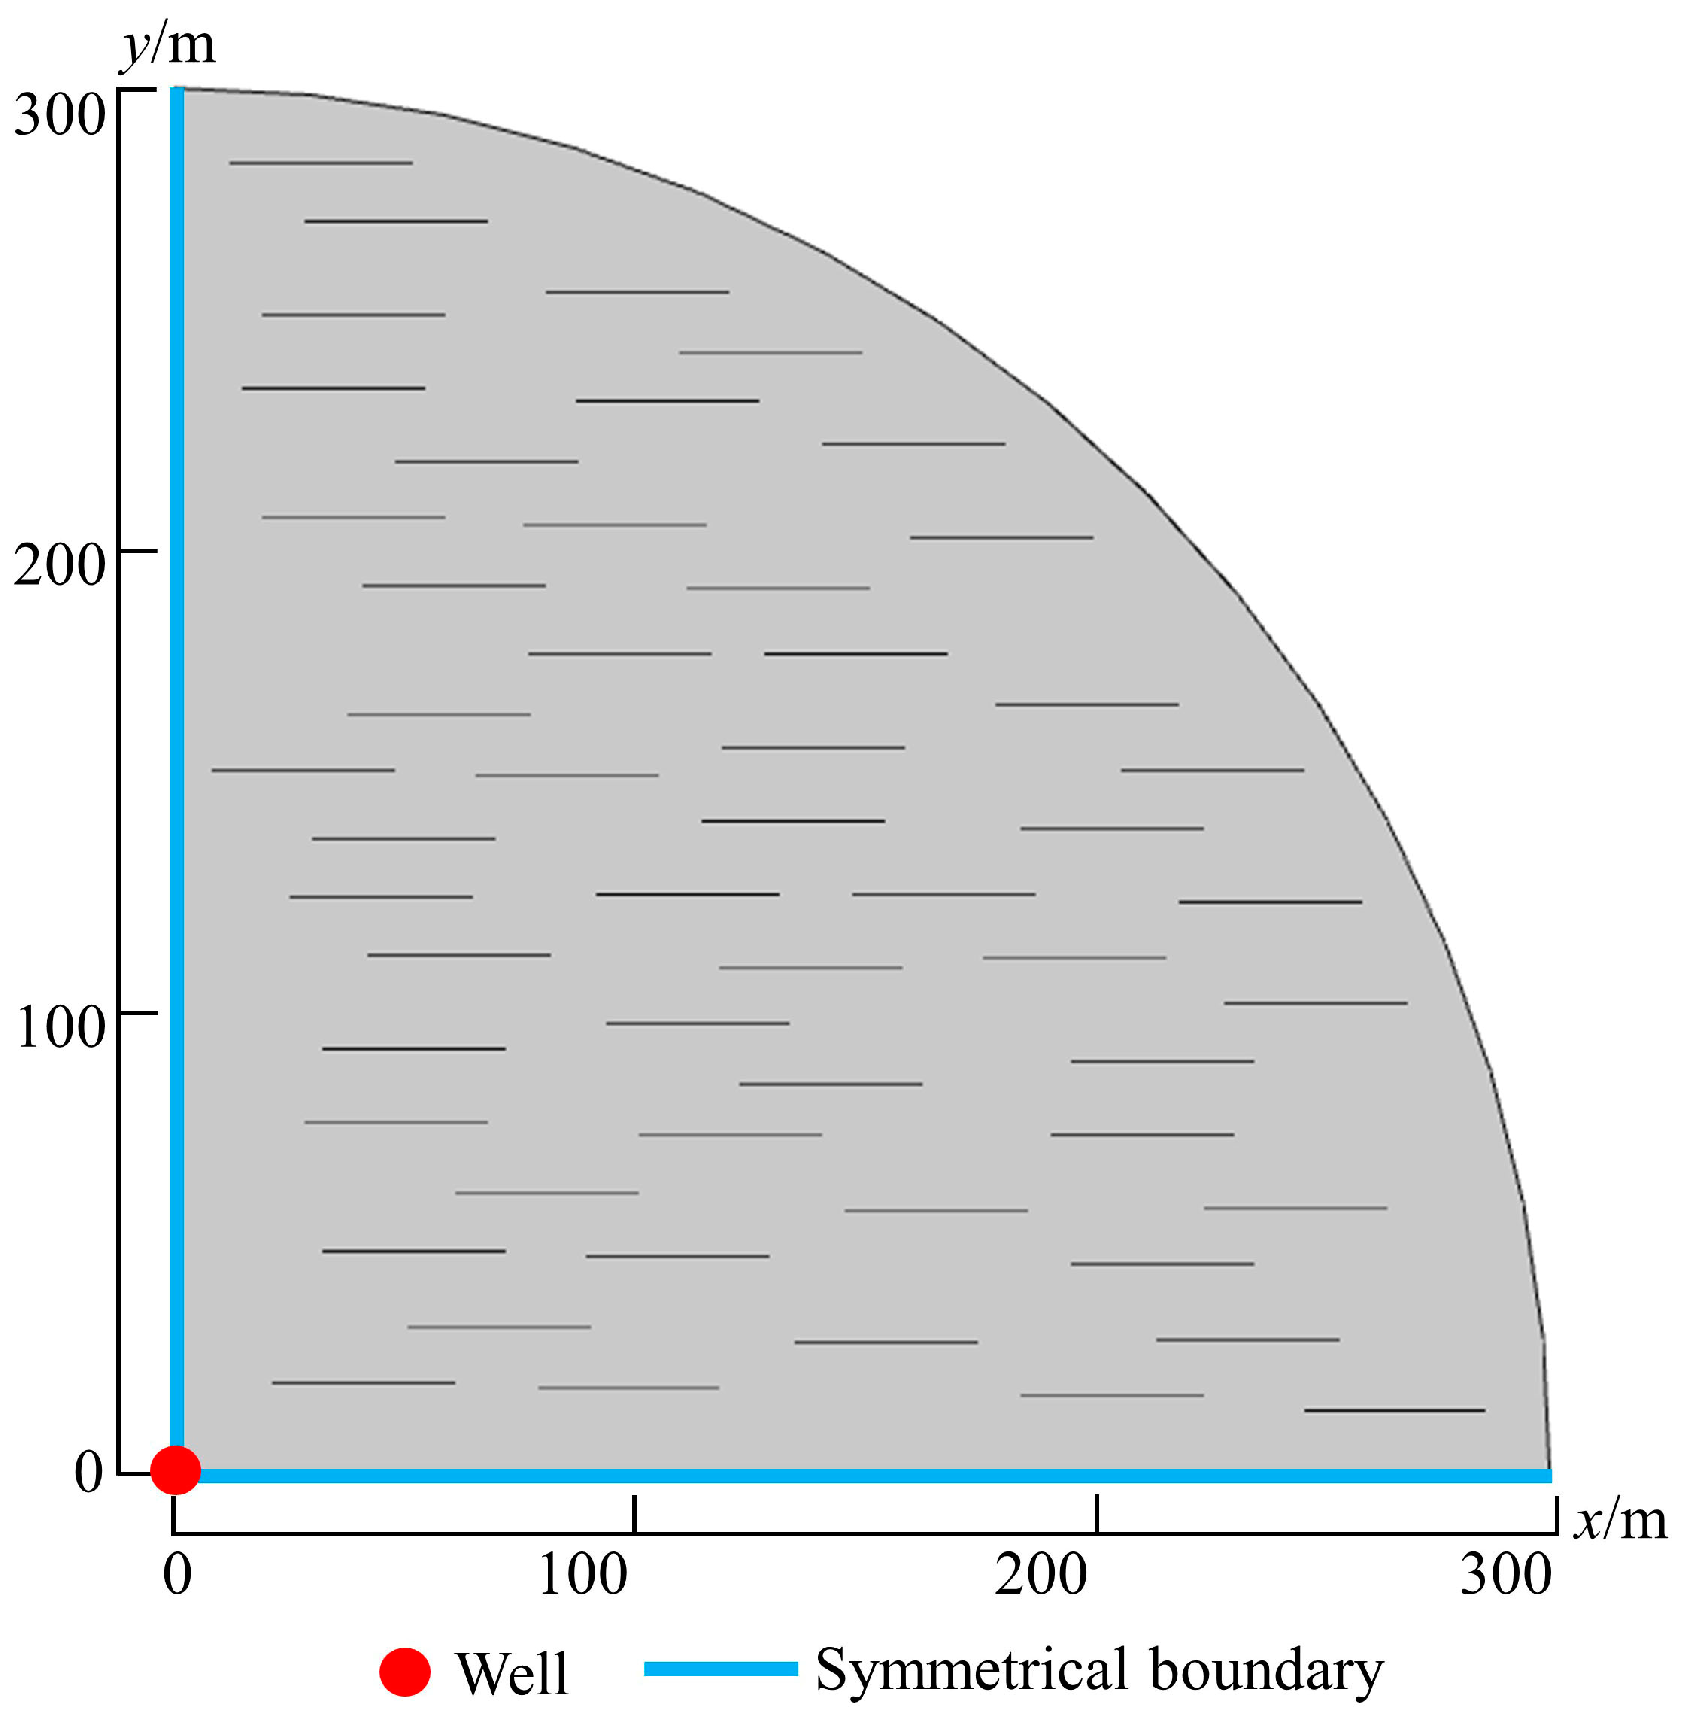
Figure 1. Formation model diagram.
Energies 16 00010 g001
Figure 2. Schematic diagram of four-zone flow model.
Energies 16 00010 g002
Figure 3. P-T phase diagram of formation fluid.
Energies 16 00010 g003
Figure 4. Dew pressure fitting diagram.
Energies 16 00010 g004
Figure 5. Relative volume fitting diagram.
Energies 16 00010 g005
Figure 6. Comparison of measured and calculated pressure data.
Energies 16 00010 g006
Figure 7. Formation pressure distribution at different times. (a) 500 d, (b) 1000 d, (c) 1250 d, (d) 1500 d.
Energies 16 00010 g007
Figure 8. Radial pressure distribution at different times.
Energies 16 00010 g008
Figure 9. Radial oil saturation distribution at different times.
Energies 16 00010 g009
Figure 10. Formation pressure distribution under different fracture permeabilities. (a) kf = 1.79 mD, (b) kf = 3.58 mD.
Energies 16 00010 g010
Figure 11. Radial condensate oil saturation under different fracture permeability.
Energies 16 00010 g011
Table 1. Formation statics parameters.
ParametersValue
Initial formation pressure/MPa51.3
Formation temperature/°C178.4
Matrix porosity0.0335
Fracture porosity0.0052
Matrix permeability/mD0.26
Fracture permeability/mD1.79
Disclaimer/Publisher’s Note: The statements, opinions and data contained in all publications are solely those of the individual author(s) and contributor(s) and not of MDPI and/or the editor(s). MDPI and/or the editor(s) disclaim responsibility for any injury to people or property resulting from any ideas, methods, instructions or products referred to in the content.