Article

Study on Shear Velocity Profile Inversion Using an Improved High Frequency Constrained Algorithm

1
State Key Laboratory of Petroleum Resources and Prospecting, China University of Petroleum, Beijing 102249, China
2
Cores and Samples Center of Natural Resources, China Geological Survey, Beijing 100083, China
*
Authors to whom correspondence should be addressed.
Energies 2023, 16(1), 59; https://doi.org/10.3390/en16010059
Submission received: 29 November 2022 / Revised: 14 December 2022 / Accepted: 19 December 2022 / Published: 21 December 2022

Abstract

:
The formation shear-wave (S-wave)’s velocity information around a borehole is of great importance in evaluating borehole stability, reflecting fluid invasion, and selecting perforation positions. Dipole acoustic logging is an effective method for determining a formation S-wave’s velocity radial profile around the borehole. Currently, the formation S-wave’s radial-profile inversion methods are mainly based on the impacts of radial velocity changes of formations outside the borehole on the dispersion characteristics of dipole waveforms, without considering the impacts of an acoustic tool on the dispersion curves in the inversion methods. Accordingly, the inversion accuracy is greatly impacted in practical data-processing applications. In this paper, a novel inversion algorithm, which introduces equivalent-tool theory into the shear-velocity radial profile constrained-inversion method, is proposed to obtain the S-wave’s slowness radial profile. Based on the equivalent-tool theory, the acoustic tool can be modeled using two parameters, radius and elastic modulus. The tool’s impact on the dipole waveform’s dispersion is eliminated first by using the equivalent-tool theory. Then, the corrected dispersion curve is used to carry out the constrained inversion processing. The results of this processing on the simulation data and the real logging data show the validity of the proposed algorithm.

Graphical Abstract

1. Introduction

The rock properties of formations around a borehole are of great significance in the exploration and development of oil and gas. The velocity information of the formations around the borehole, which is one of the most important rock properties, can be addressed with an acoustic logging method. However, abnormal in-situ stress, mud invasion, and borehole damage would result in radial changes in formation velocity around the borehole, thereby bringing inaccurate interpretation results [1]. Based on a dipole waveform obtained by multipole array acoustic logging data, a formation’s shear-velocity radial profile can be inverted for evaluating the borehole stability, estimating in-situ stress, and reflecting mud invasion [2,3,4,5,6,7]. Consequently, it is crucial to study the inversion method of the formation’s S-wave velocity radial profile around the borehole.
When the formation’s S-wave velocity changes with radial depth, the measured dipole’s S-wave dispersion characteristics will also change accordingly. The existing inversion methods regarding the formation’s S-wave velocity radial profile are mainly based on the above relationship. Generally, there are two inversion methods. One is Sinha’s method, which combines a perturbation method and the Backus–Gilbert (B-G) theory to invert the formation’s S-wave velocity radial profile [8]. This is a compromise method between radial distance and velocity change, resulting in an average radial velocity profile that is closest to the actual situation [9,10]. Subsequently, this inversion method is successfully applied in well completions, stress parameters, and velocity estimations of Transversely Isotropic with a Vertical axis of symmetry (TIV) media [11,12,13]. For example, some researchers have improved this method by using a parametric velocity-characterization equation, and this method was successfully implemented in many cased wells [14,15]. However, when the signal-to-noise ratio is low, there may be deviations between the inversion results and a real formation model, failing to reach a high resolution and high precision. Furthermore, the convergence of this algorithm is seriously affected by the selecting of the initial values. The other inversion method is the constrained inversion method using a high-frequency band, which obtains the conclusion that the radial shear profile is mainly affected by the formation’s shear velocity and with regards to the radial variation formation as a formation described by two parameters [16]. This method assumes that the radial change of the formation’s S-wave velocity is mainly controlled by two parameters, which are the velocity change and the thickness change of a transition zone (TZ), and an inversion objective function is constructed based on these two parameters. This method constrains a high-frequency band and increases the contribution of a high-frequency component in the objective function, which can effectively improve the accuracy of inversion the results, especially in the formation around the borehole. This constrained inversion method is then applied in a logging-while-drilling quadrupole waveform processing to obtain the formation radial velocity, and to assess the rock-brittleness and fracability of the near-borehole formation [4,5]. In real data processing, the acoustic tool in the borehole has a great impact on the dispersion characteristics of the dipole waveform. Meanwhile, the existing two inversion methods of the formation’s S-wave velocity radial profile do not consider the impacts of the tool on the dispersion, which affects the processing effect of the real data. In this case, an equivalent-tool theory was proposed to eliminate impacts of the tool on the flexural wave dispersion in the dipole acoustic logging, and it has been effectively applied in filed data processing and formation information-extraction [17,18].
In this paper, based on the equivalent-tool theory, an improved high-frequency constrained inversion method is proposed to invert the formation’s S-wave velocity radial profile around the borehole. The impacts of the tool on the dipole dispersion characteristics are eliminated by equivalently treating the acoustic tool as an elastic rod characterized by two parameters, which are the radius and the equivalent elastic modulus. The improved high-frequency constrained inversion method can eliminate the impacts of the tool and obtain a high-precision formation S-wave velocity radial profile. By processing and comparing the theoretical simulation data and the measured data, the reliability of the improved inversion method is validated.

2. High-Frequency Constrained Inversion Method of Formation Shear-Velocity Radial Profile

2.1. Basic Method Principle

Tang and Patterson found that a dispersion curve of a radially continuously changing formation is very similar to that of a single-layer altered formation [16]. According to this characteristic of the dispersion curve, the formation with a radial change of S-wave velocity is regarded as a double-layer medium formation with a thickness around the borehole and a velocity difference from the undisturbed formation. In cases of constantly changing values, multiple theoretical models were established, and then the dispersion curve of each theoretical model is compared with the dispersion curve of the real formation. When the comparison results are closest, it can be considered that the theoretical model in this case is the real formation, and an objective function can be constructed:
E ( Δ r , Δ V ) = Ω [ V m ( ω , Δ r , Δ V ) V d ( ω ) ] 2
where Vm is a dispersion curve calculated by the theoretical model established using Δr and ΔV; Vd is a dispersion curve of a real radially changing formation; Ω is a frequency range; and ω is the circular frequency. When the value of the objective function (1) is the smallest, the velocity variation ΔV and the TZ thickness Δr can be used to represent the velocity profile of the real radially changing formation.
The objective function (1) can be used to invert a relatively accurate velocity profile, but there is a large error for the model’s calculation of a near-borehole formation. In order to obtain more accurate results, Tang and Patterson delved into this study, and found that a phase velocity of a low-frequency part of the dispersion curve in a radially changing model is close to the shear-velocity of the undisturbed zone [16]. When the S-wave velocity of a homogeneous model is equal to the near-borehole S-wave velocity of an inhomogeneous formation model, the high-frequency parts of the dispersion curves of the two formation models are very close. This shows that the low-frequency part of the flexural wave is influenced by the undisturbed zone, and the high-frequency part is influenced by the formation near the borehole. This is because the bending wave is a dispersive wave, leading to a longer wavelength and a further detection range, whereas a shorter wavelength travels along the shallow formation area. From this, Tang and Patterson proposed the high-frequency constrained inversion method to reduce the near-bore error of the S-wave’s slowness profile by constraining the high-frequency band [16]. The objective function (1) is modified to:
E ( Δ r , Δ V ) = Ω [ V m ( ω , Δ r , Δ V ) V d ( ω ) ] 2 + λ Ω [ V m ( ω , Δ r , Δ V ) V h ( ω , V 1 ) ] 2
where Vh is the dispersion curve calculated by establishing a uniform formation model; V1 is the wellbore formation shear-velocity; Ω’ is the high-frequency range for constraint, usually (9~10 kHz); and λ is used to adjust the relative contribution of the high-frequency term.
The radial change of a formation’s S-wave velocity is usually monotonically increasing or monotonically decreasing. According to this phenomenon, the formation’s S-wave velocity radial-change model is established [4]:
V ( r ) = V 0 ( Δ V ¯ 1 e 1 ) exp ( r r 0 Δ r ) , ( r r 0 )
where V0 is the S-wave velocity of the undisturbed formation and r0 is the borehole’s radius. The shear-velocity profile can be obtained by substituting the result obtained from Equation (2) into Equation (3).

2.2. Theoretical Model Validation

A radial layered formation was modeled by the numerical simulation method, and the high-frequency constrained inversion method was used for the inversion calculation. The relevant parameters of this formation model are shown in Table 1. In the model, the number of sampling points for each receiver was 400, the spacing was 0.1524 m, the time-sampling interval was 36 μs, and the center frequency was 3 kHz. The velocity alteration schematic is shown in Figure 1.
For the model in Table 1, a real-axis-integration method was used to simulate its waveform [19], as shown in Figure 2:
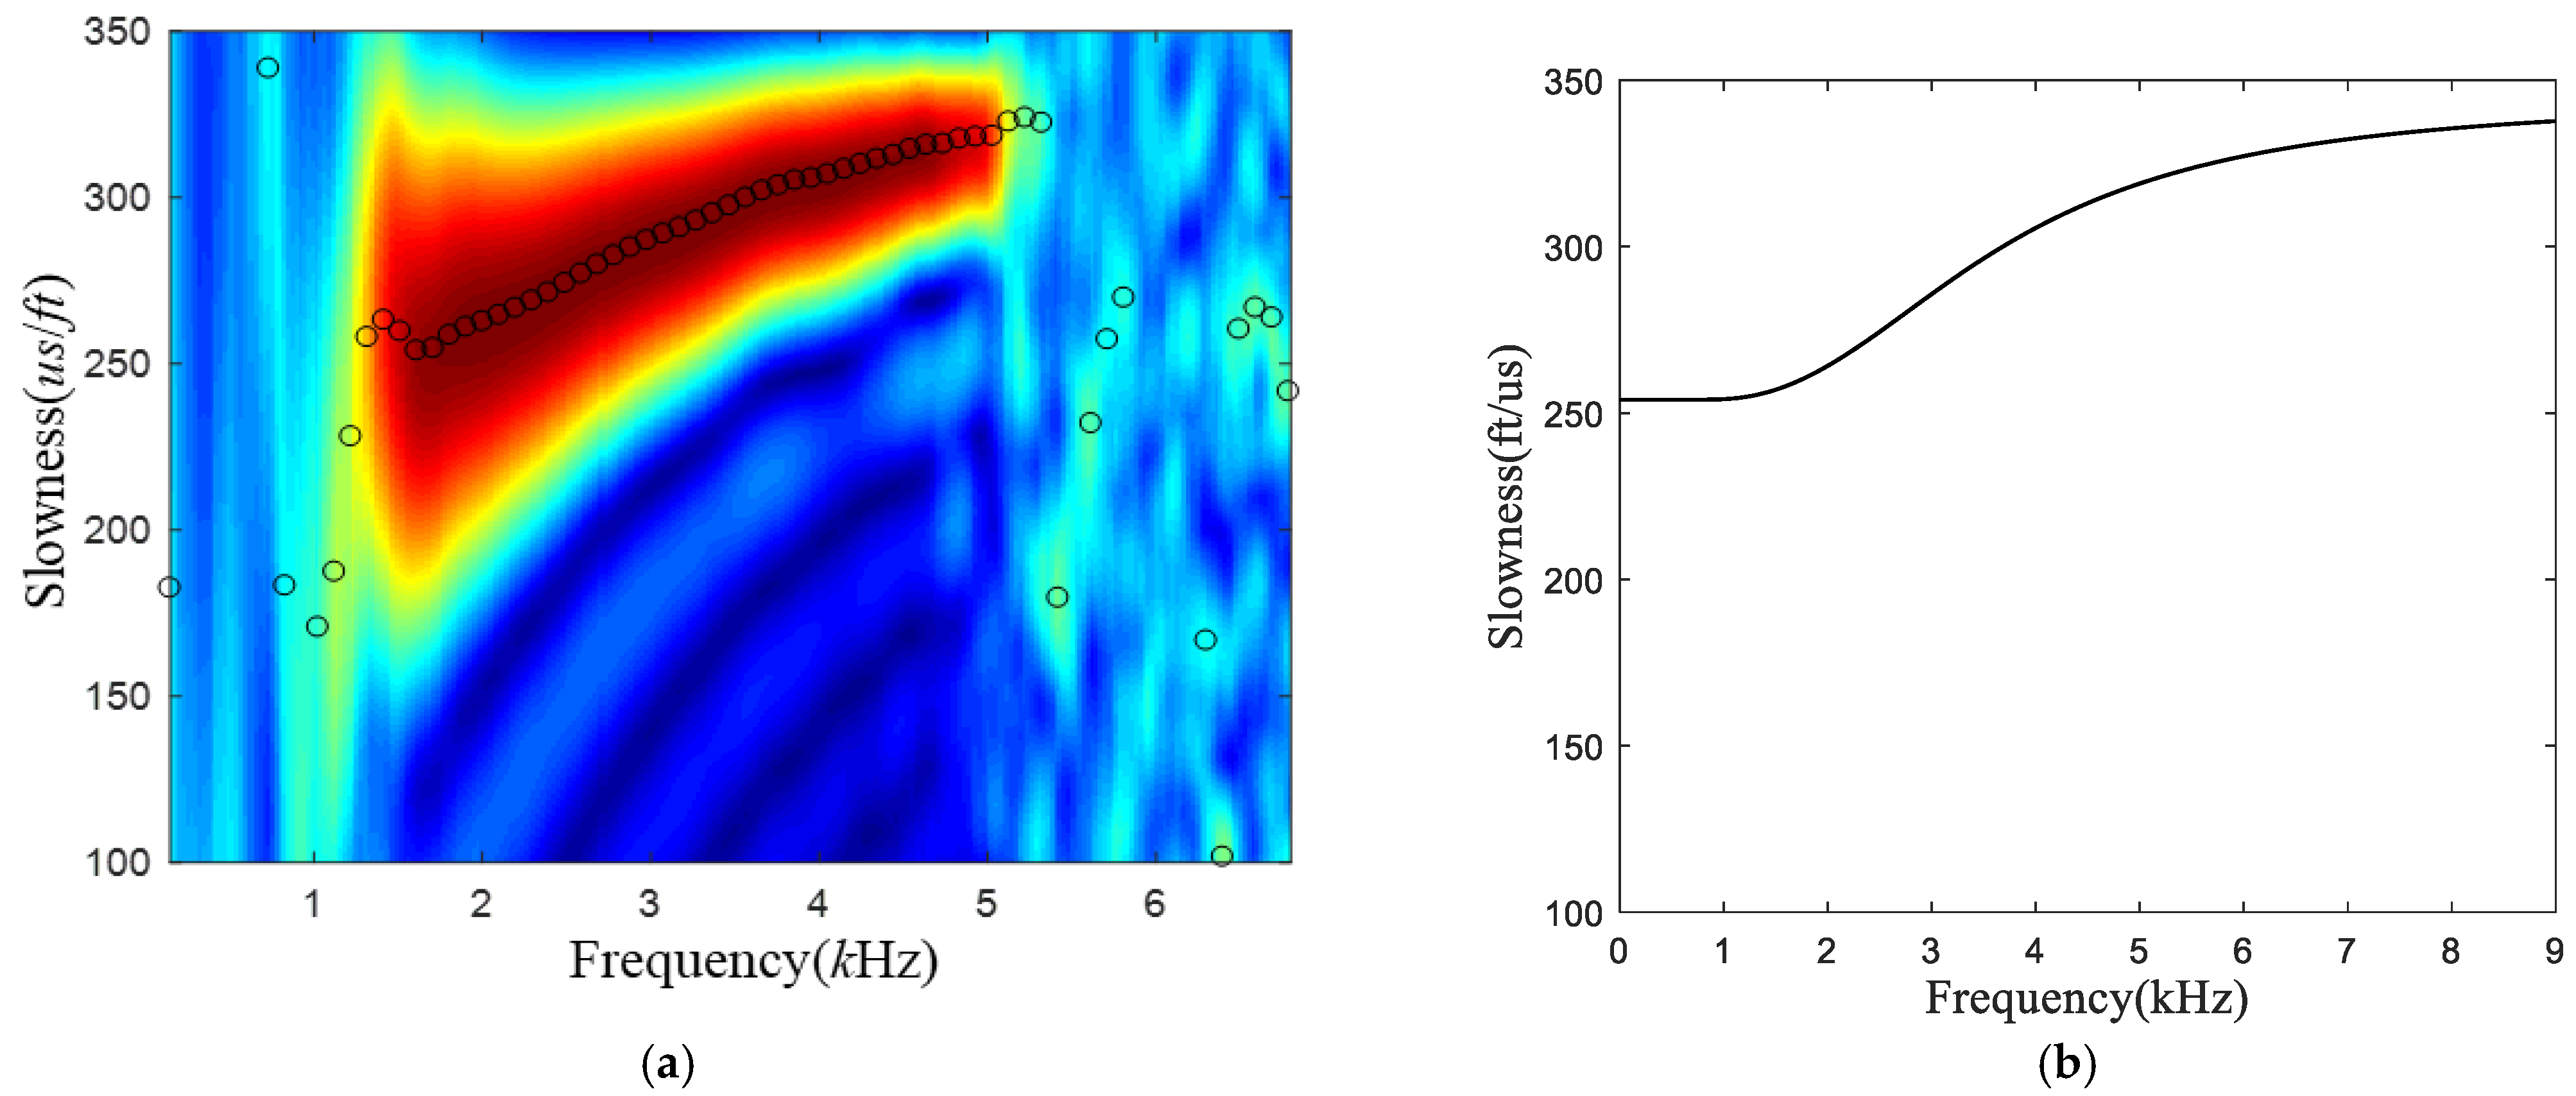
The dispersion curve was calculated using a weighted spectral semblance algorithm [19], and the results are as shown in Figure 3a. For the dispersion curve without a frequency range of 8~9 kHz, an arctangent function fitting should be applied to obtain the high frequency range (shown in Figure 3b).
According to the model parameters (Table 1), the velocity changes of the TZs during the inversion process were set to: 1000 m/s: 2 m/s: 1200 m/s, and the thickness changes of the TZs were set to: 0 m: 0.005 m: 0.3 m. Then, it was necessary to construct 101 × 61 theoretical models, calculate the dispersion curve of each theoretical model one by one, and substitute them into Equation (2). The full inversion frequency range was 3~9 kHz, and the high-frequency constraint range was 8~9 kHz. A two-dimensional image of the correlation coefficients of the objective function was obtained, as shown in Figure 4:
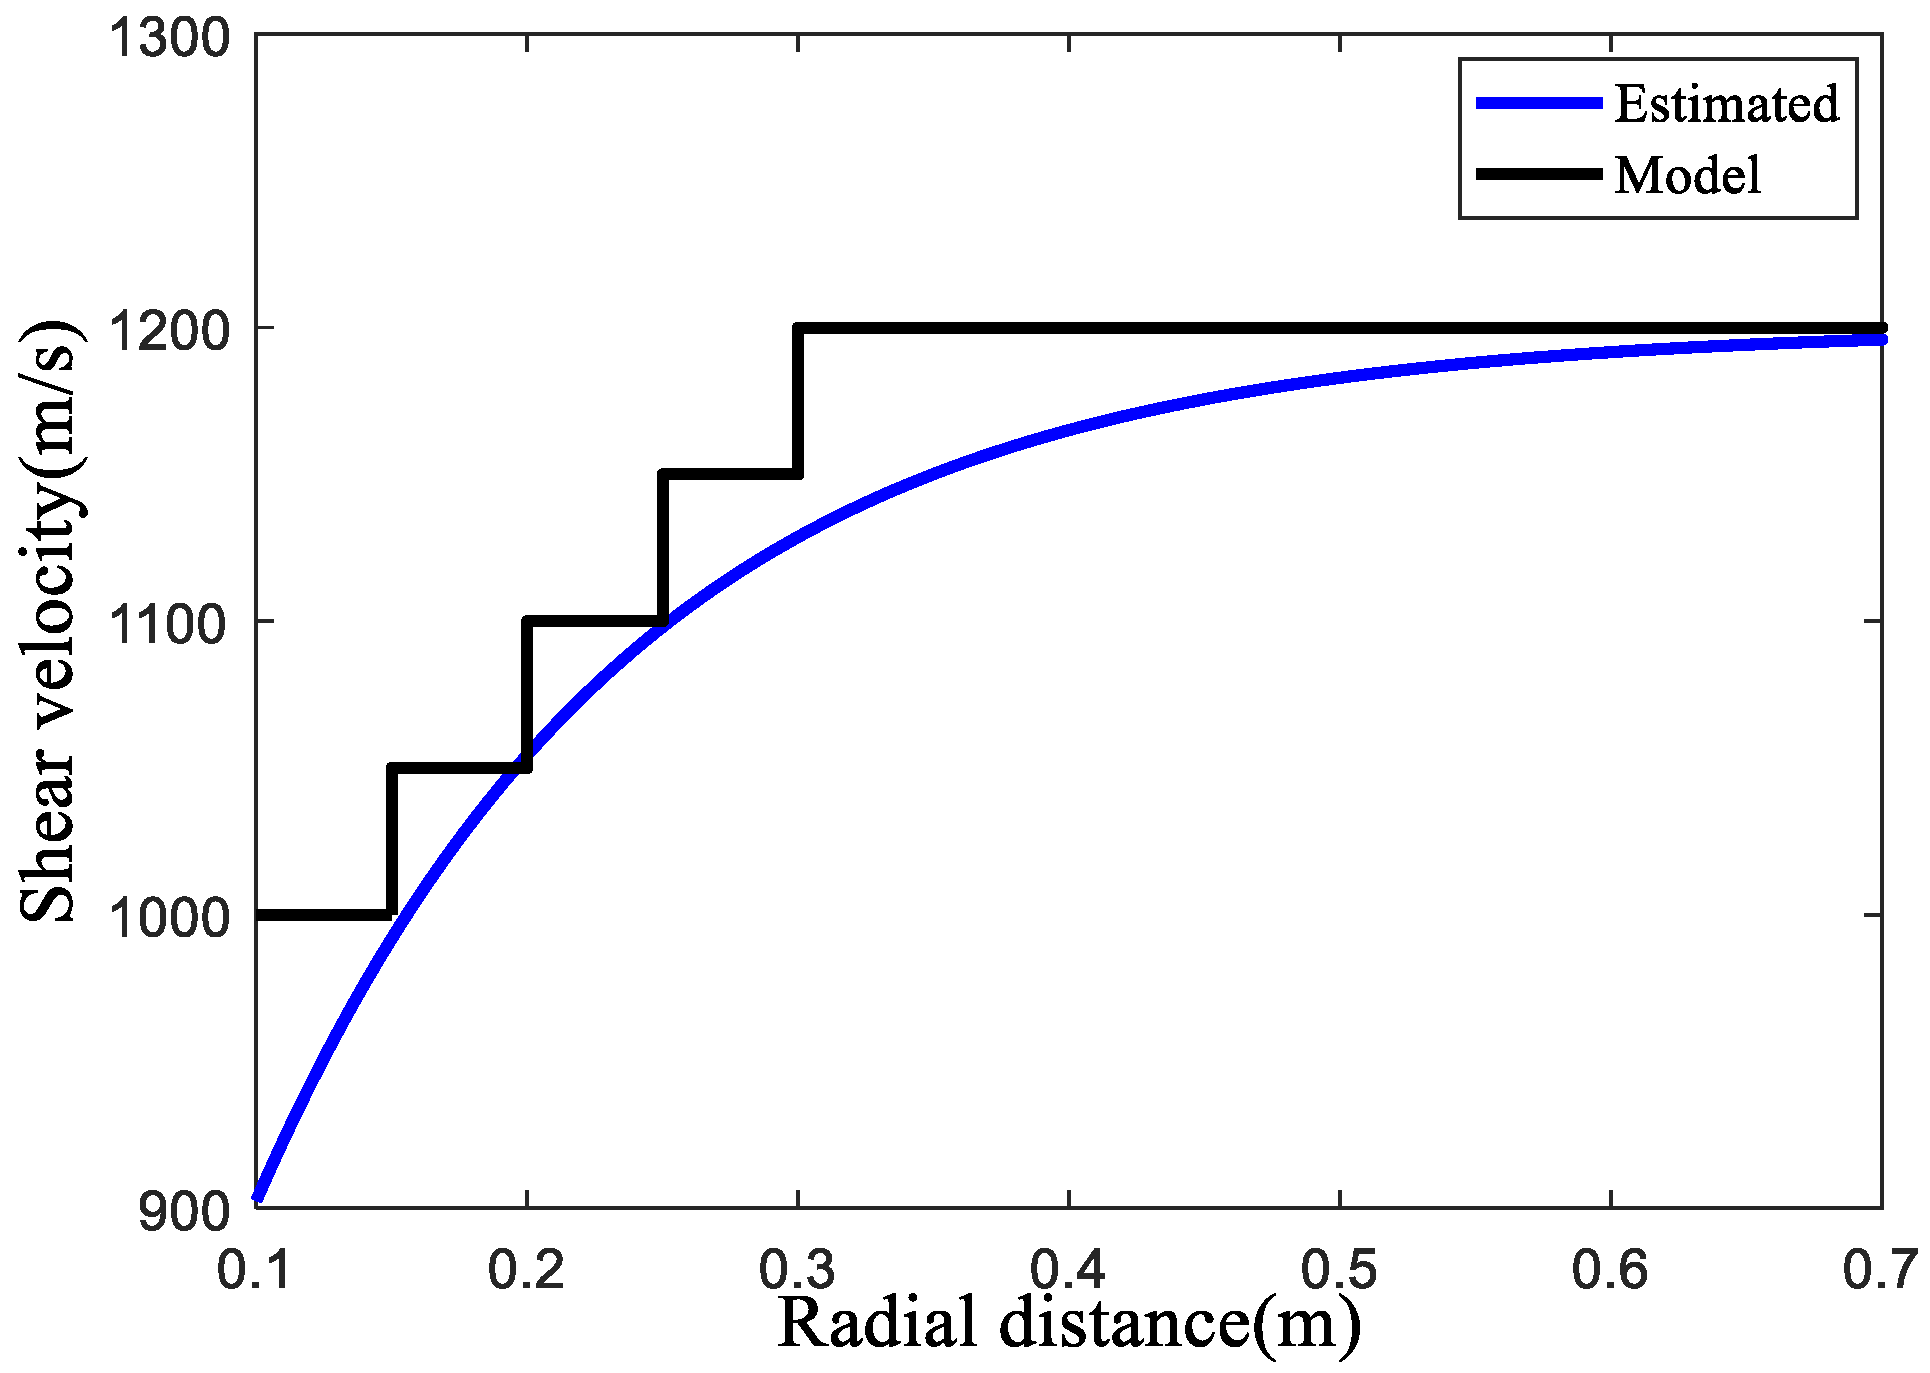
The ordinate of Figure 4 is the equivalent TZ thickness Δr, the abscissa is the velocity change ΔV, and the color represents the size of the objective function value. When the objective function value is the smallest, the corresponding ΔV and Δr are 146 m/s and 0.125 m, respectively. By putting these two parameters into Equation (3), the shear-velocity radial profile can be obtained, as shown in Figure 5, and its relative error is shown in Figure 6.
From Figure 6, due to the high-frequency constraints, the inversion method had a relatively high accuracy, and the overall error was basically below 4%, and especially in the near-borehole formation a high inversion-accuracy could be obtained.

3. Application of Equivalent-Tool Theory in Constrained Inversion

3.1. Equivalent-Tool Theory

When using real logging data to invert the formation’s S-wave velocity radial profile, the impacts of the acoustic logging tool cannot be ignored. Due to a complex structure, the equivalent-tool theory can be introduced to simulate the impact of the tool [17]. Assuming that the logging tool is a cylinder with a radius of a, no matter how complex the structure of the tool is, as long as the wavelength of the bending wave is greater than the radius of the tool, the tool can be equivalent to an elastic rod with an elastic modulus of MT. One parameter can used to simulate the impacts of multiple elastic parameters of the tool. Considering that there is a logging tool in center of the borehole, the displacement (u) and pressure (p) in the annular fluid between the tool and the borehole caused by the acoustic wave can be expressed as follows:
u = { A n [ n r I n ( f r ) + f I n + 1 ( f r ) ] + B n [ n r K n ( f r ) f K n + 1 ( f r ) ] } cos [ n ( θ ϕ ) ]
p = { A n [ ρ f ω 2 I n ( f r ) ] + B n [ ρ f ω 2 K n ( f r ) ] } cos [ n ( θ ϕ ) ]
where An is the amplitude coefficients of the incident wave; Bn is the amplitude coefficients of the outgoing wave; n is the sound-source order, n = zero for monopole, n = one for dipole, and n = two for quadrupole; In and Kn are the first-kind and second-kind of nth-order variant Bessel functions, respectively; f is the radial wave number of the fluid; k is the axial wavenumber of the mode wave; Vf and ρf are the velocity and density of the fluid, respectively; ω is the circular frequency; and θ − φ is the azimuth of the alignment of the multipoles to a reference azimuth φ [19].
The boundary conditions at the fluid–solid interfaces (fluid in the borehole and the logging tool’s surface, fluid in the borehole and borehole wall) are fully matched by the acoustic admittance (i.e., u/p). At longer wavelengths, the logging tool can be equivalent to the elastic rod with only one modulus. Norris studied the case of the solid elastic rod in the center of the borehole, and used the following acoustic admittance matching for the Stoneley wave between the elastic rod and the borehole wall, and the specific expression is [20]:
( u p ) r = a = a M T
Assuming that this result is still applicable to multipole waves, and extending Equation (6) to the frequency domain, it is only necessary to calculate the acoustic admittance of the elastic waves according to Equations (4) and (5) and then match it with the acoustic admittance of the logging tool at the tool surface. This gives the relationship between the unknown coefficients An and Bn:
E t o o l = B n A n = ( M T a ) [ n a I n ( f a ) + f I n + 1 ( f a ) ] + ρ f ω 2 I n ( f a ) ( M T a ) [ n a K n ( f a ) f K n + 1 ( f a ) ] + ρ f ω 2 K n ( f a )
where Etool represents the elastic parameter related to the tool, and it can be added to the dispersion equation for the simulation of the impacts of the tool on the dispersion curve. The specific method is: add the terms related to the equivalent tool to two matrix elements M11, M21 related to the sound field in the borehole in the dispersion equation, which is:
M 11 : n R I n ( f R ) + f I n + 1 ( f R ) [ n R I n ( f R ) + f I n + 1 ( f R ) ] + E tool [ n R K n ( f R ) f K n + 1 ( f R ) ] M 21 : I n ( f R ) I n ( f R ) + E t o o l K n ( f R )
where the symbol “→” in the above formula means to convert the expression on the left to the expression on the right. From this, the multipole dispersion equation when the logging tool is located in the center of the borehole is obtained:
D ( k , ω , V p , V s , ρ , V f , ρ f , R , M T , a ) = 0
where Vp, Vs, ρ are compressional velocity, shear velocity, and the density of the formation, respectively. The Newton–Raphson method is normally used to solve the dispersion equation [19]; thus, the multipole dispersion curve with the impact of the tool is obtained.
V ph = ω / k
In order to validate the feasibility of the equivalent-tool theory, an annular heavy-mud column is used to simplify and simulate the wireline dipole acoustic logging tool, and a formation model with the tool in the borehole is established; its parameters are shown in Table 2.
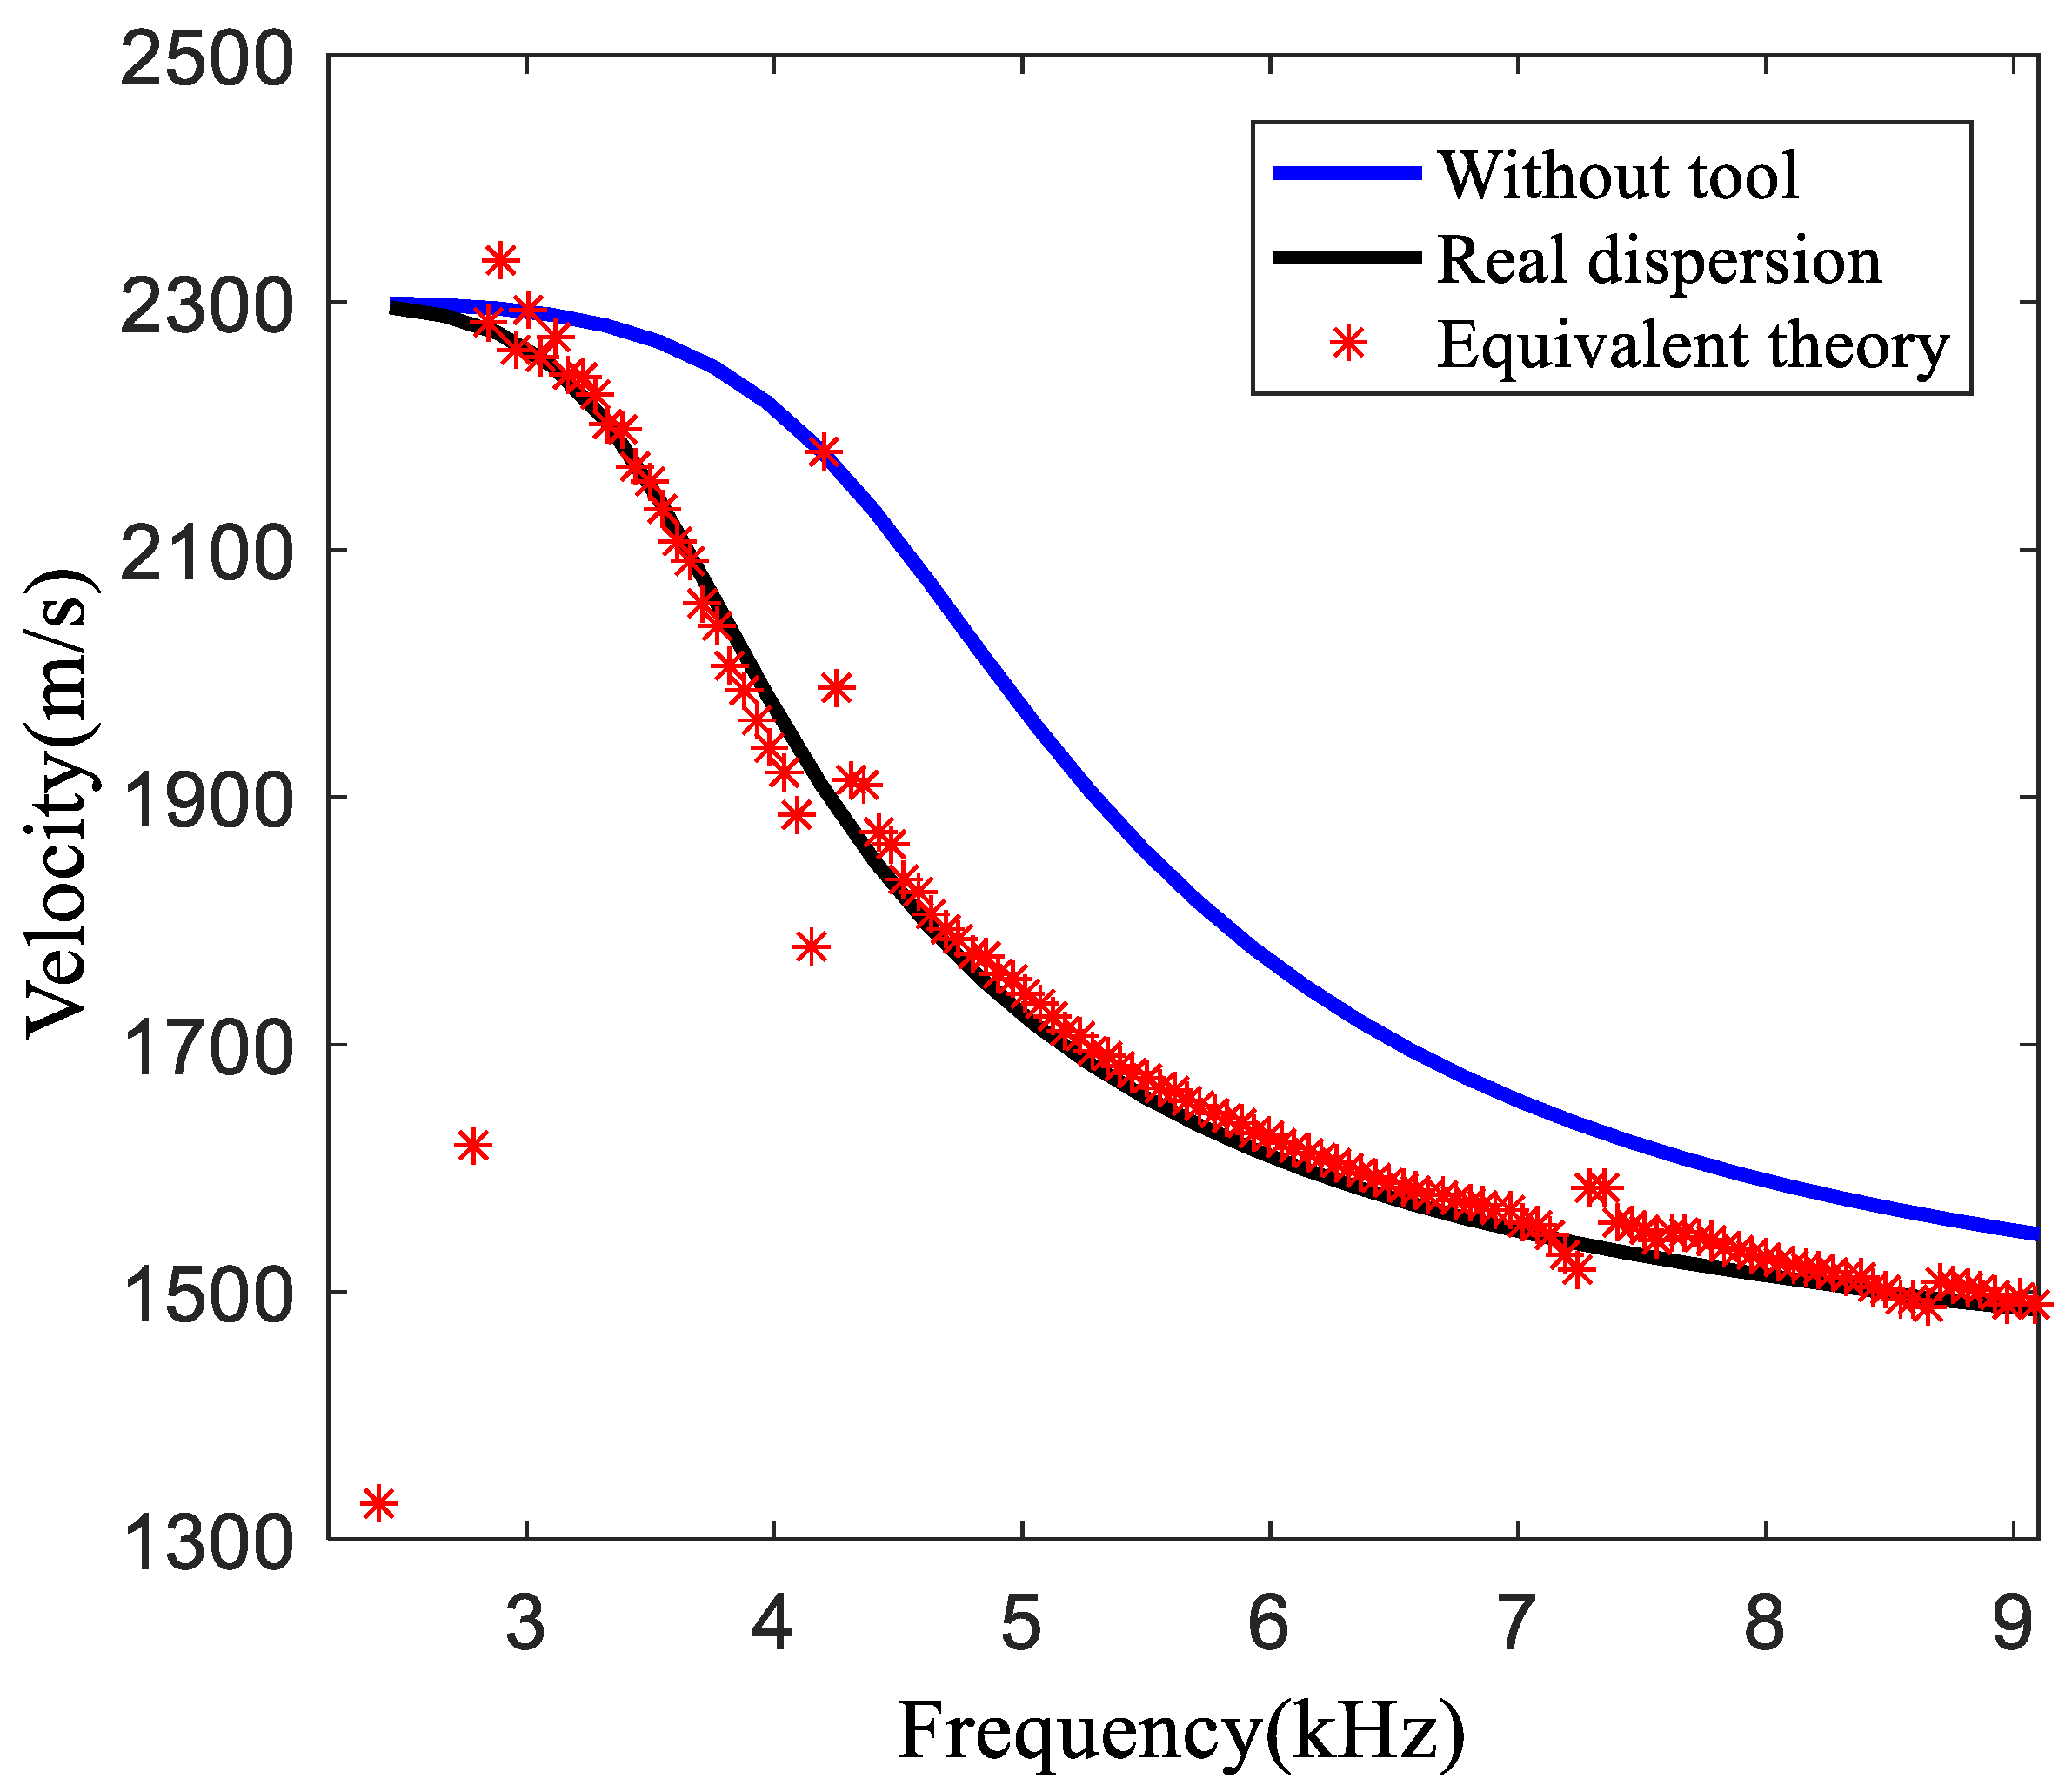
According to the parameters in Table 2, the real-axis integration method is used to simulate and calculate the corresponding waveforms and, respectively, calculate the reference dispersion curve without considering the impacts of the tool, the reference dispersion curve calculated by the equivalent-tool theory, and the dispersion curve calculated by simulating the waveform with the impacts of the tool. The results are shown in Figure 7.
In the calculation, the equivalent radius a of the tool is equal to the outer diameter of the heavy-mud column (0.045 m), and the value of the equivalent modulus of the tool MT is 32 GPa. It can be seen from Figure 7 that in the frequency range of 2–9 kHz, the calculation results using the equivalent-tool theory are consistent with the theoretical curve, which validates the applicability of the equivalent-tool theory. Furthermore, in the frequency band higher than the cutoff frequency, logging tools make the flexural wave dispersion curve shift to low frequencies, which indicates that the impact of the tool must be considered when we use the dipole dispersion curve to carry out any inversion processing.

3.2. Application of Equivalent-Tool Theory in Constrained Inversion Method

The parameters of the annular heavy-mud column in Table 2 are used to simulate the formation model with the impacts of the tool. The high-frequency constraint method is used for the inversion calculation. When calculating the dispersion curve of the theoretical model, the equivalent theory is used to calculate the dispersion curve with the impacts of the tool, and a two-dimensional image of the objective function is obtained by substituting it into Equation (2).
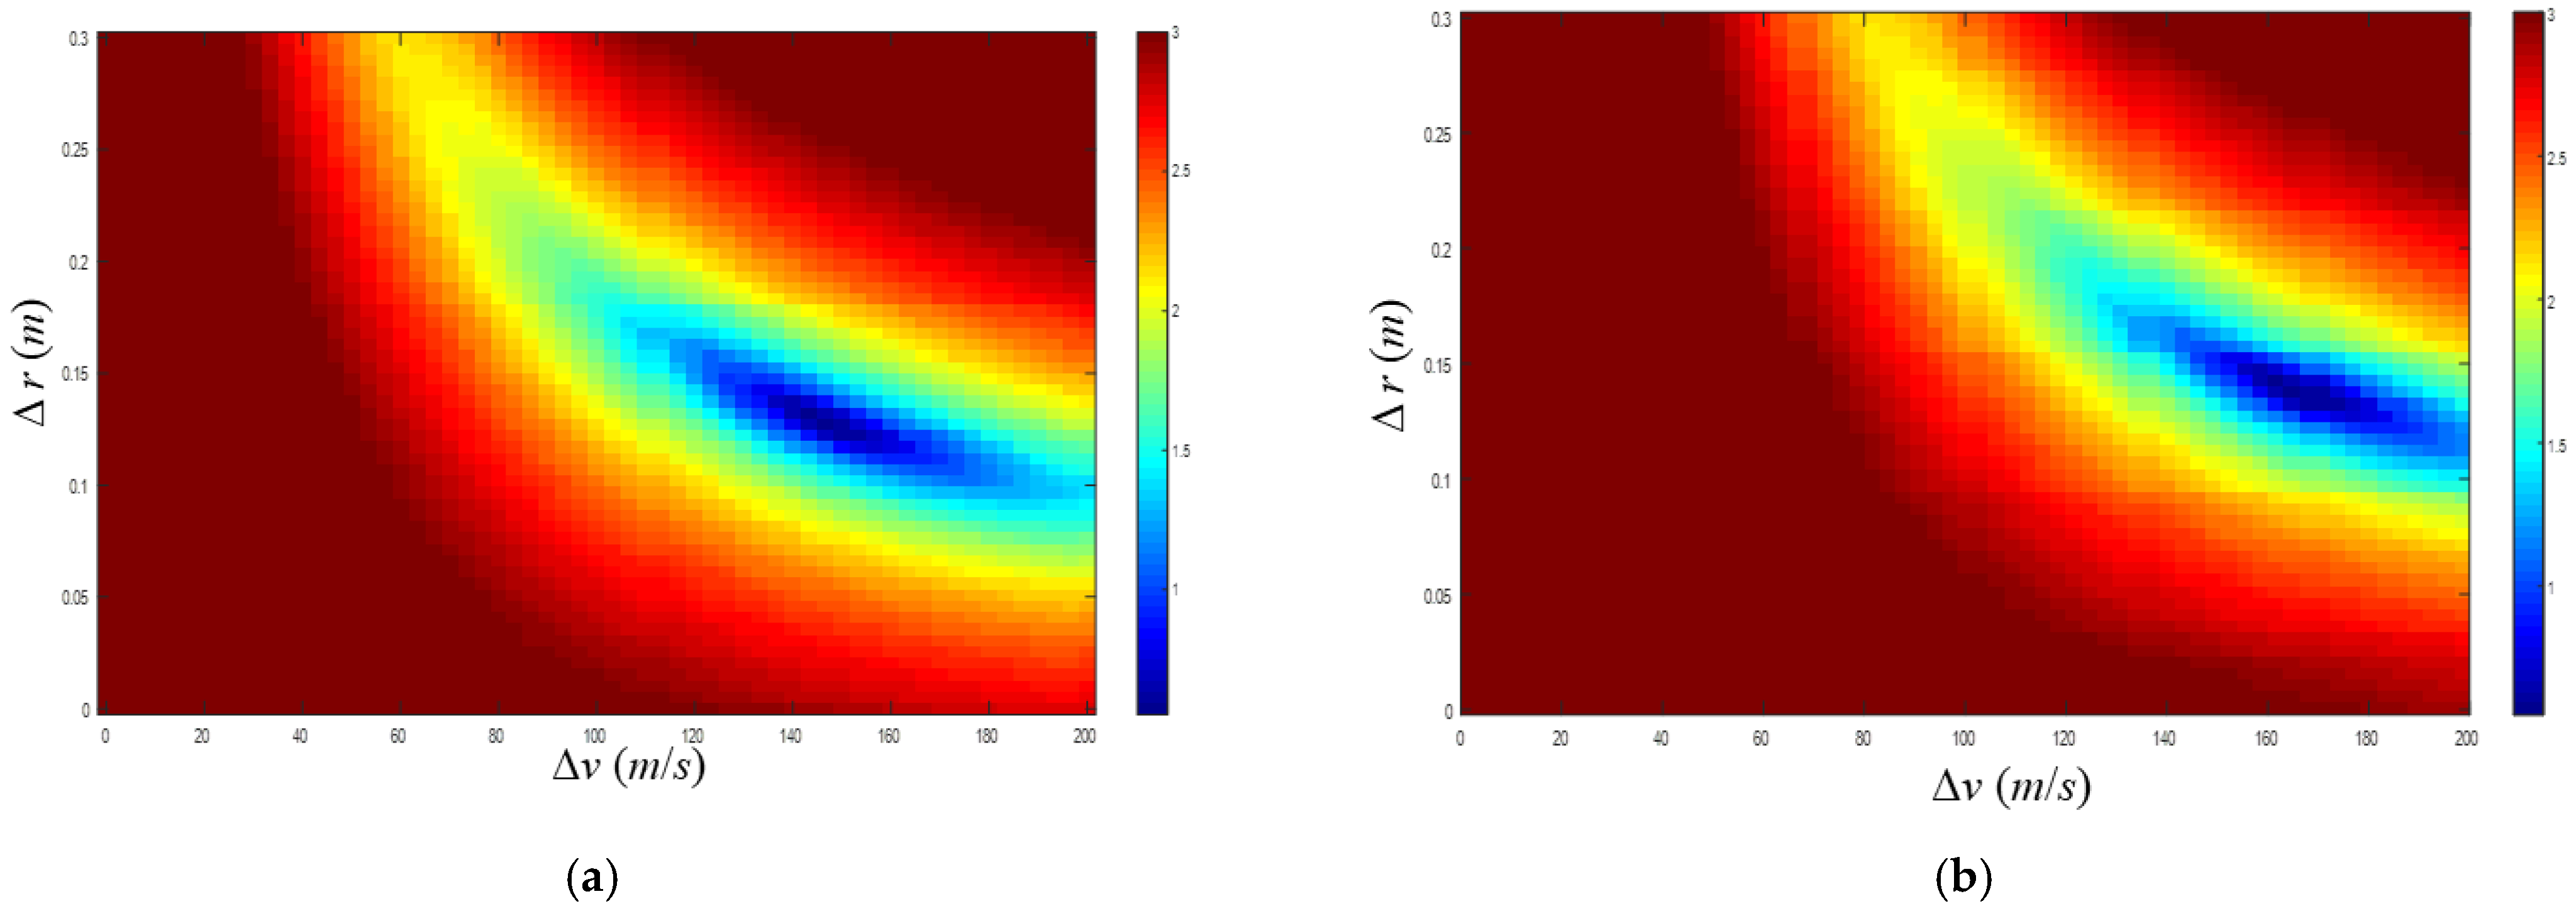
Figure 8a,b represents the two-dimensional images of the objective function using the equivalent-tool theory and without using the equivalent-tool theory, respectively. When the value of the objective function is the smallest, the velocity change and equivalent thickness using the equivalent-tool theory are 146 m/s and 0.125 m, respectively, and the velocity change and equivalent thickness without using the equivalent-tool theory are 171 m/s and 0.145 m, respectively. The impacts of the tool make the velocity change and the equivalent thickness larger. By bringing these two results into Equation (3), the obtained dipole formation S-wave velocity radial profile is as follows:
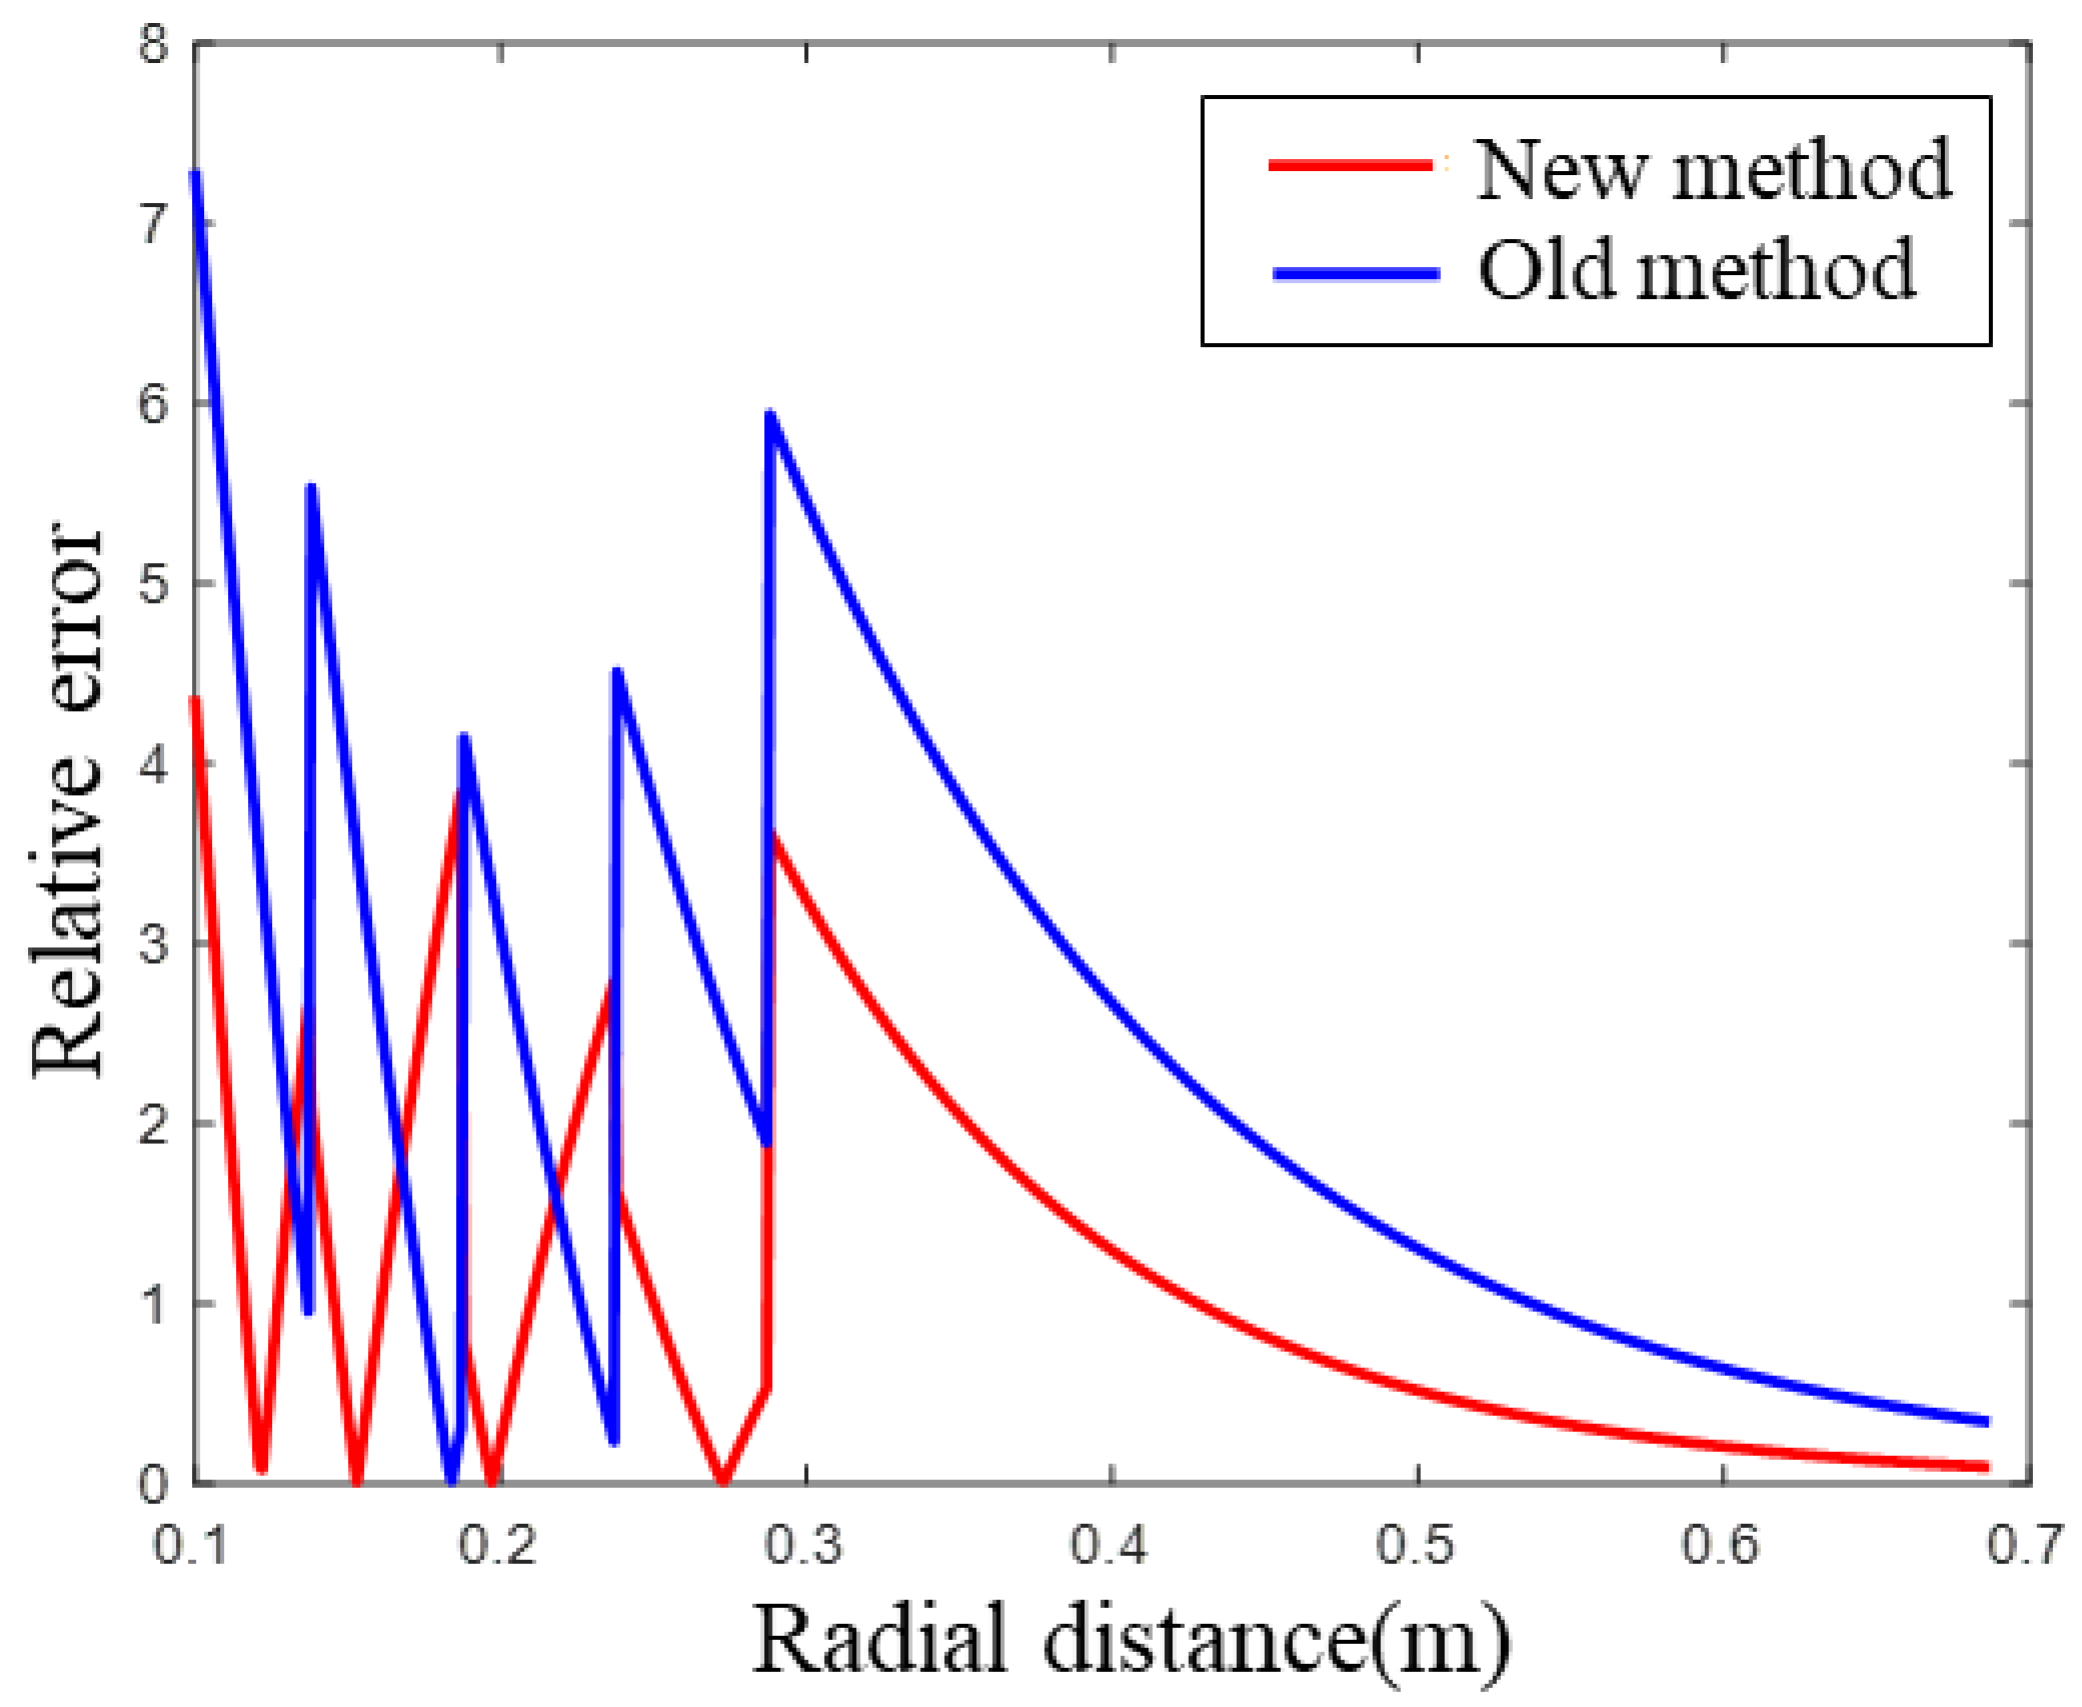
From Figure 9 and Figure 10, it can be seen that the relative error of the inversion results without considering the tool is larger. This is because the tool’s existence makes the dispersion curve shift to the low-frequency of the real formation, the velocity change, and the equivalent thickness increase when the objective function value is the smallest, resulting in a generally smaller radial S-wave velocity and a larger relative error. Therefore, the impact of the tool can be eliminated by using the equivalent-tool theory, and the result is more in line with true values.

4. Real Data Processing

Based on the previous theoretical analysis, we can identify that the existence of the acoustic tool affects the dipole dispersion characteristic dramatically. The impacts of the tool should be considered carefully when performing the formation S-wave velocity radial profile inversion. For the real data processing, due to unknown tool parameters, the tool would be different for different borehole-logging measurements, and thus constant parameters cannot be used as equivalent to tool impacts. The following procedure is adopted in real data processing:
  • Step 1, select the impermeable and tight interval, extract the dispersion curve of the measured dipole waveform, and compute the theoretical dispersion curve using the known formation velocity, density, and borehole parameters.
  • Step 2, invert the tool parameters MT and a by matching the real data and the synthetic curve based on the equivalent-tool theory in the impermeable and tight intervals.
  • Step 3, implement the formation’s S-wave velocity radial profile inversion algorithm corrected by the equivalent-tool theory in other intervals. The tool equivalent parameters MT and a in this step use the value from Step 2.
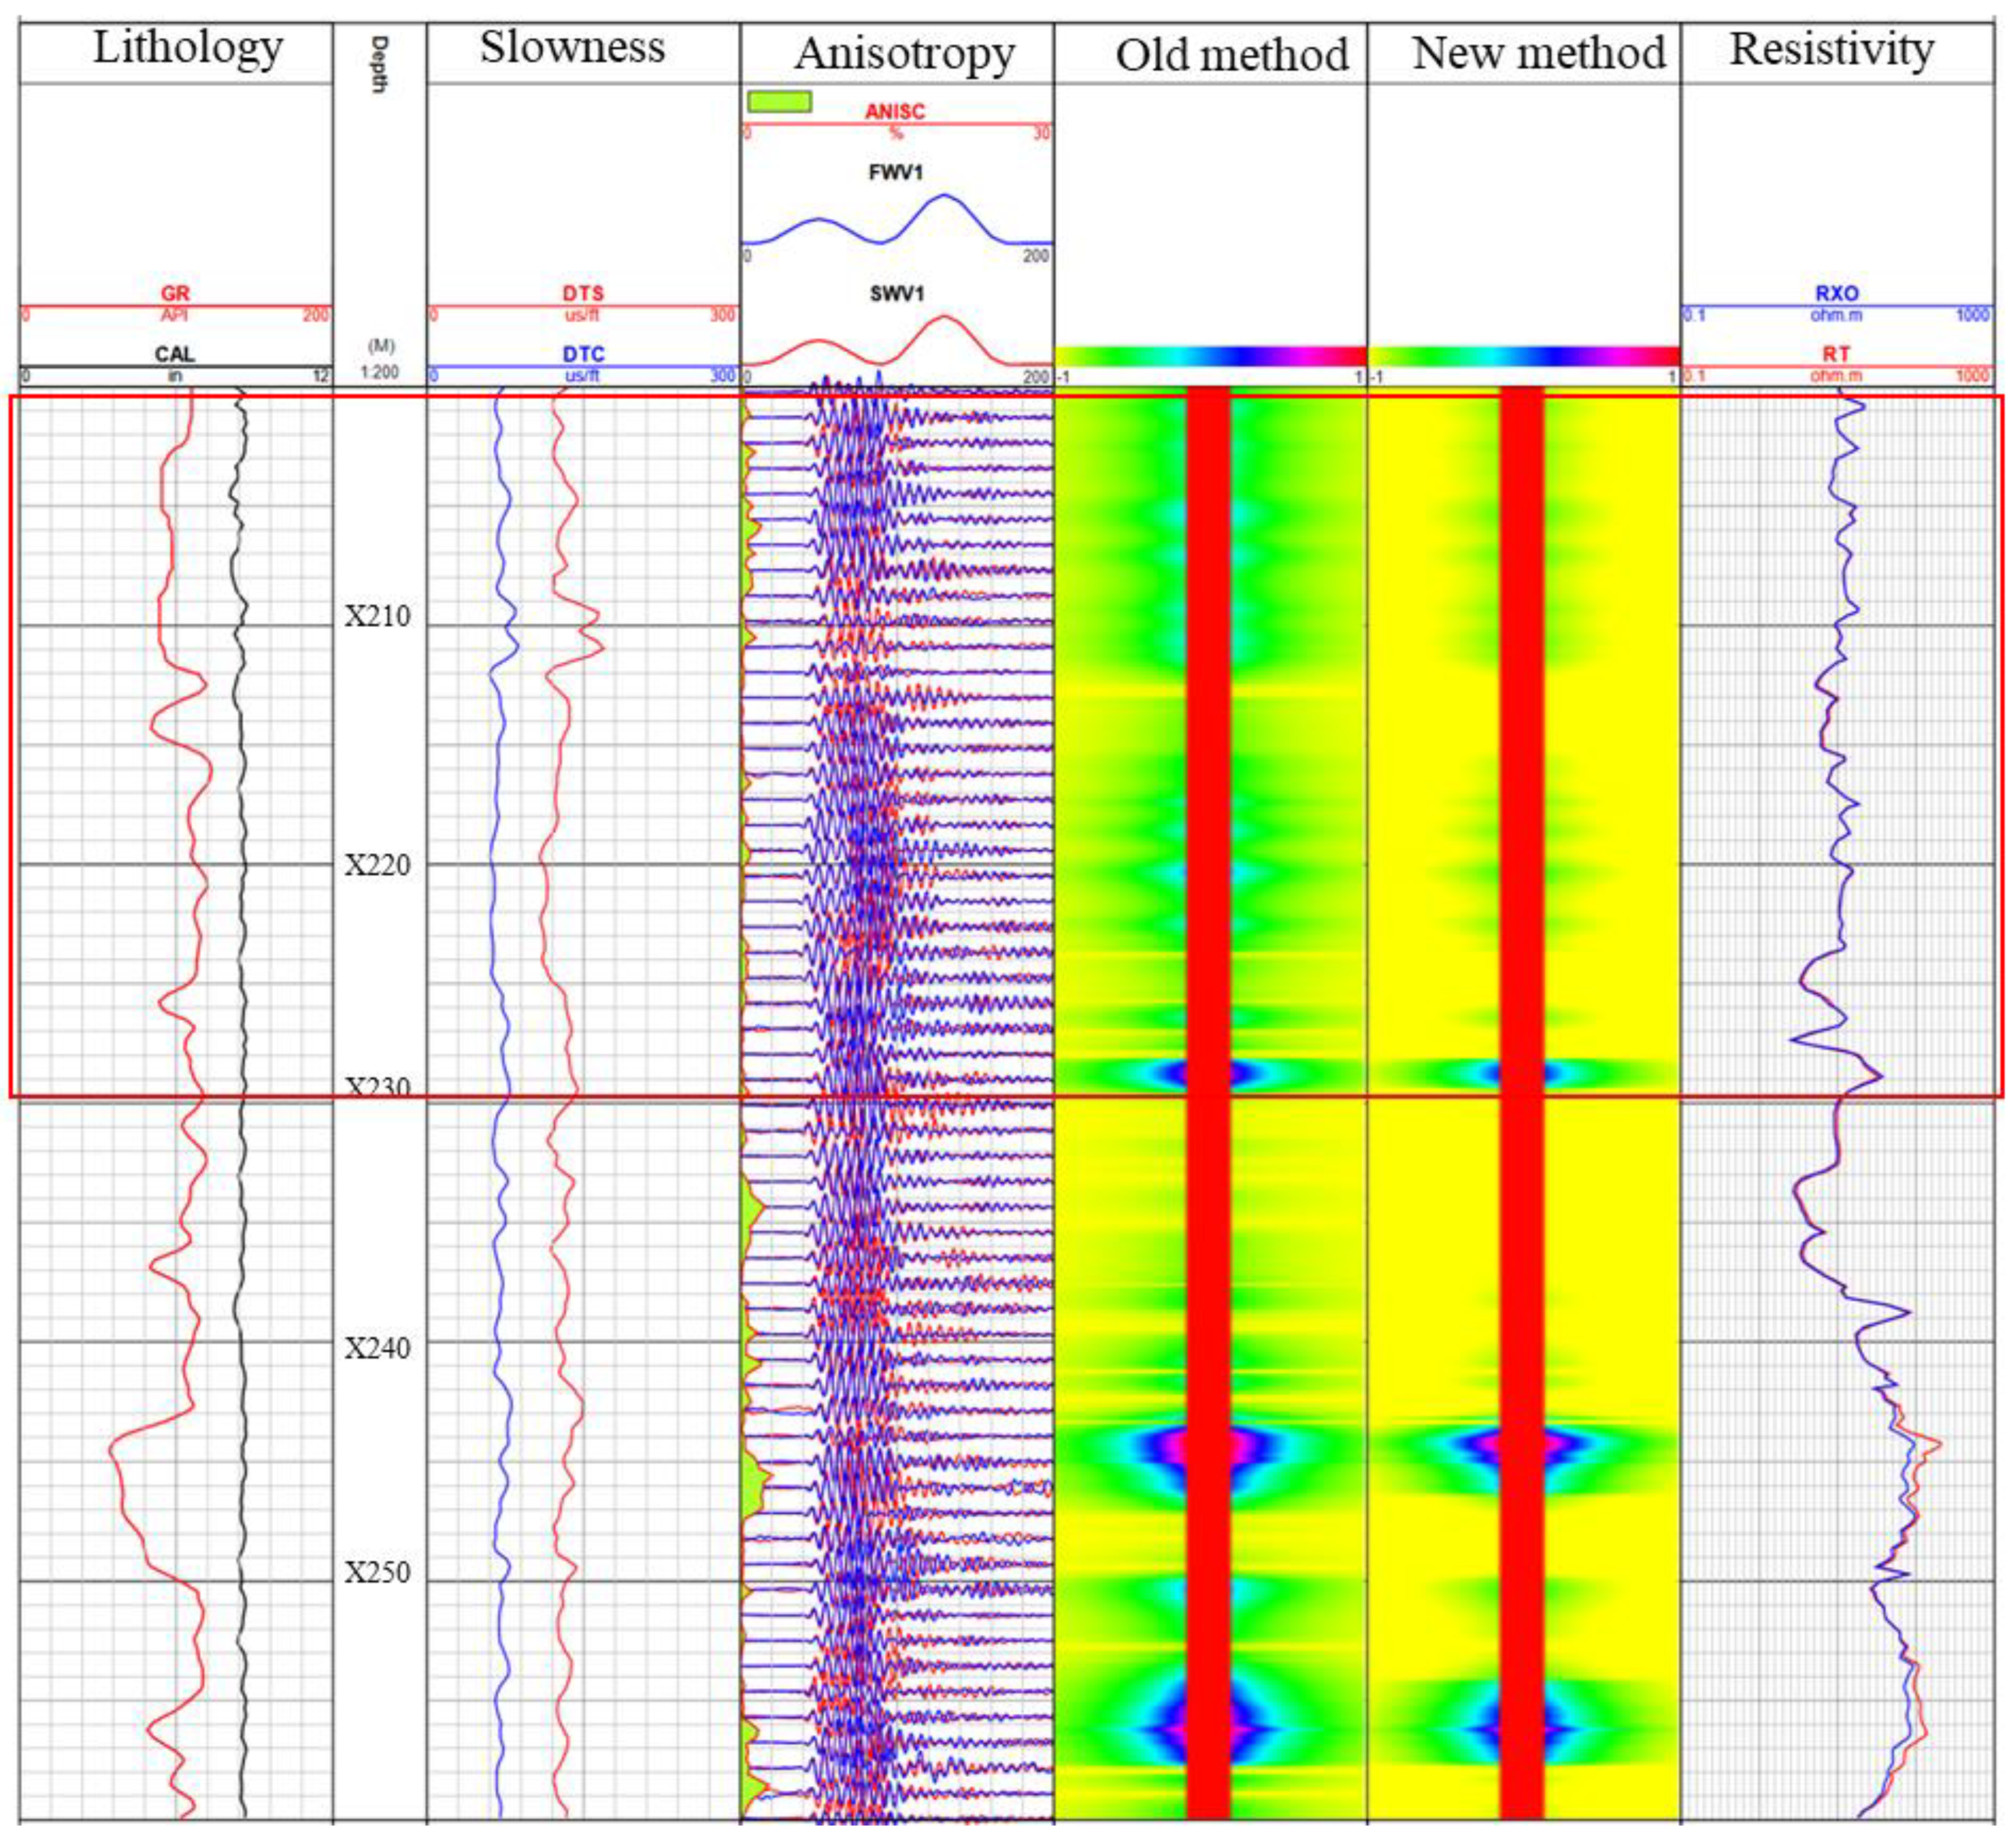
The formation’s S-wave velocity radial profile is processed for the real data of an oilfield in Western China, as shown in Figure 11.
The depth of the borehole is X200–X260 m. In Figure 11, Trace 1 is the well diameter curve (black line) and the natural gamma curve (red line), Trace 2 is the time difference between the formation’s P and S-waves in this interval, and Trace 3 gives the orthogonal dipole anisotropy analysis and fast and slow S-wave waveforms. Trace 4 is the formation’s S-wave velocity radial profile calculated by the high-frequency constrained inversion method. In Trace 4, the shade of color represents the difference with the undisturbed formation velocity. Trace 5 is the formation’s S-wave velocity profiles with the improved inversion method. Trace 6 gives the deep and shallow resistivity logging curves. From Figure 11, it can be seen that there are obvious differences between the two velocity profiles in the interval marked by the red frame. In this marked interval, there is no change in the borehole diameter, the anisotropy is not obvious, the GR value has no offset, there is no obvious difference between the deep and shallow resistivity curves, and thus the radial S-wave velocity should not change. Therefore, the result of Trace 5 is more in line with the real formation. At the interval between X245 m and X255 m, the radial S-wave velocity on Trace 5 has obvious changes, while the depth and shallow resistivity curves on Trace 6 are significantly different, the GR value on Trace 1 is small, and the borehole diameter (Trace 1) and anisotropy (Trace 3) have no obvious changes. This may be caused by mud invasion. The radial velocity changes are not obvious in other intervals, but the radial velocity change exists in the whole interval on Trace 4, which is obviously not in line with the actual situation.

5. Conclusions

In this paper, the basic theory of the high-frequency constrained inversion method for the formation’s S-wave velocity radial profile is studied, and examples of a forward and an inversion simulation are given to illustrate that this method has a large error in the case of considering the impacts of the acoustic logging tool. Then, the equivalent-tool theory is introduced to eliminate the impacts of the tool through theoretical and real data studies. Finally, an improved high-frequency constraint inversion method using the equivalent-tool theory is proposed and used to process the real logging data. The following conclusions are drawn:
  • The existence of the tool makes the dispersion curve of the dipole acoustic logging move to a low frequency. If the inversion calculation is carried out directly without considering the impacts of the tool, the velocity change and the equivalent thickness obtained by this inversion method will be larger, thereby increasing the error. The equivalent-tool theory can be used to calculate the dispersion curve of the theoretical model by considering the tool, thereby eliminating the impacts of the tool and reducing the inversion error.
  • The results obtained using the improved high-frequency constrained inversion method show that the radial velocity changes in the entire interval of the formation’s S-wave velocity radial profile without using the equivalent-tool theory are not in line with the actual situation, and the formation’s S-wave velocity radial profile using the equivalent-tool theory is in good agreement with other curves. This proves the effectiveness of the improved high-frequency constrained formation’s S-wave velocity radial profile-inversion method.

Author Contributions

Conceptualization, Q.Y. and B.W.; methodology, Q.Y.; software, H.S.; validation, Z.J.; writing—original draft preparation, Q.Y.; writing—review and editing, H.S.; visualization, Z.J.; supervision, B.W. All authors have read and agreed to the published version of the manuscript.

Funding

This research was funded by the National Natural Science Foundation of China, grant number 42274141.

Data Availability Statement

Not applicable.

Conflicts of Interest

The authors declare no conflict of interest.

References

  1. Baker, L.J. The effect of the invaded zone on full wavetrain acoustic logging. Geophysics 1984, 49, 686–847. [Google Scholar] [CrossRef]
  2. Sinha, B.K.; Asvadurov, S. Dispersion and radial depth of investigation of borehole modes. Geophys. Prospect. 2004, 52, 271–286. [Google Scholar] [CrossRef]
  3. Sinha, B.K.; Valero, H.; Ikegami, T.; Pabon, J. Borehole flexural waves in formations with radially varying properties. In Proceedings of the IEEE Ultrasonics Symposium, Rotterdam, The Netherlands, 18–21 September 2005; pp. 556–559. [Google Scholar] [CrossRef]
  4. Su, Y.-D.; Tang, X.-M.; Zhuang, C.-X.; Xu, S.; Zhao, L. Mapping formation shear-velocity variation by inverting logging-while-drilling quadrupole-wave dispersion data. Geophysics 2013, 78, D491–D498. [Google Scholar] [CrossRef]
  5. Tang, X.-M.; Xu, S.; Zhuang, C.-X.; Su, Y.-D.; Chen, X.-L. Assessing rock brittleness and fracability from radial variation of elastic wave velocities from borehole acoustic logging. Geophys. Prospect. 2016, 64, 958–966. [Google Scholar] [CrossRef]
  6. Li, J.; Innanen, K.A.; Tao, G.; Zhang, K.; Lines, L. Wavefield simulation of 3D borehole dipole radiation. Geophysics 2017, 82, D155–D169. [Google Scholar] [CrossRef] [Green Version]
  7. Liu, Y.; Chen, H.; Li, C.; He, X.; Wang, X.; Habibi, D.; Chai, D. Radial profiling of near-borehole formation velocities by a stepwise inversion of acoustic well logging data. J. Pet. Sci. Eng. 2021, 196, 107648. [Google Scholar] [CrossRef]
  8. Backus, G.; Gilbert, F. Uniqueness in the inversion of inaccurate gross Earth data. Philos. Trans. R. Soc. Lond., Math. Phys. Sci. 1970, 266, 123–192. [Google Scholar] [CrossRef] [Green Version]
  9. Burridge, R.; Sinha, B.K. Inversion for formation shear modulus and radial depth of investigation using borehole flexural waves. In Proceedings of the SEG Technical Program Expanded Abstracts 1996, Denver, CO, USA, 10–15 November 1996; pp. 158–161. [Google Scholar] [CrossRef]
  10. Sinha, B.K.; Burridge, R. Radial Profiling of Formation Shear Velocity from Borehole Flexural Dispersions. In Proceedings of the 2001 IEEE Ultrasonics Symposium, Atlanta, GA, USA, 7–10 October 2001; pp. 391–396. [Google Scholar] [CrossRef]
  11. Sinha, B.K.; Vissapragada, B.; Renlie, L.; Tysse, S. Radial profiling of the three formation shear moduli and its application to well completions. Geophysics 2006, 71, E65–E77. [Google Scholar] [CrossRef]
  12. Sinha, B.; Bratton, T.; Cryer, J.; Nieting, S.; Ugueto, G.; Bakulin, A.; Hauser, M. Estimation of near-wellbore alteration and formation stress parameters from borehole sonic data. SPE Reserv. Eval. Eng. 2008, 11, 478–486. [Google Scholar] [CrossRef]
  13. Sunaga, S.; Sinha, B.K.; Endo, T.; Walsh, J. Radial Profiling of Shear Slowness in TIV Formations. In Proceedings of the SEG Technical Program Expanded Abstracts 2009, Houston, TX, USA, 25–30 October 2009; pp. 3481–3485. [Google Scholar] [CrossRef]
  14. Yang, J.; Sinha, B.K.; Habashy, T.M. A theoretical study on formation shear radial profiling in well-bonded cased boreholes using sonic dispersion data based on a parameterized perturbation model. Geophysics 2012, 77, WA197–WA210. [Google Scholar] [CrossRef]
  15. Wang, B.; Ma, M.-M.; Liu, H.; Liu, Z.-J. Inversion of the shear velocity radial profile in a cased borehole. Chin. J. Geophys. 2016, 59, 4782–4790. [Google Scholar] [CrossRef]
  16. Tang, X.-M.; Patterson, D.J. Mapping formation radial shear-wave velocity variation by a constrained inversion of borehole flexural-wave dispersion data. Geophysics 2010, 75, E183–E190. [Google Scholar] [CrossRef]
  17. Su, Y.-D.; Tang, X.-M.; Hei, C.; Zhuang, C.-X. An equivalent-tool theory for acoustic logging and applications. Appl. Geophys. 2011, 8, 69–78. [Google Scholar] [CrossRef]
  18. Xu, S.; Tang, X.-M.; Su, Y.; Zhuang, C. Determining formation shear wave transverse isotropy jointly from borehole Stoneley- and flexural-wave data. Chin. J. Geophys. 2018, 61, 5105–5114. [Google Scholar] [CrossRef]
  19. Tang, X.M.; Cheng, A. Quantitative Borehole Acoustic Methods; Elsevier: Amsterdam, The Netherlands, 2004; pp. 120–125. [Google Scholar]
  20. Norris, A.N. The speed of a tube wave. J. Acoust. Soc. Am. 1990, 87, 414. [Google Scholar] [CrossRef]
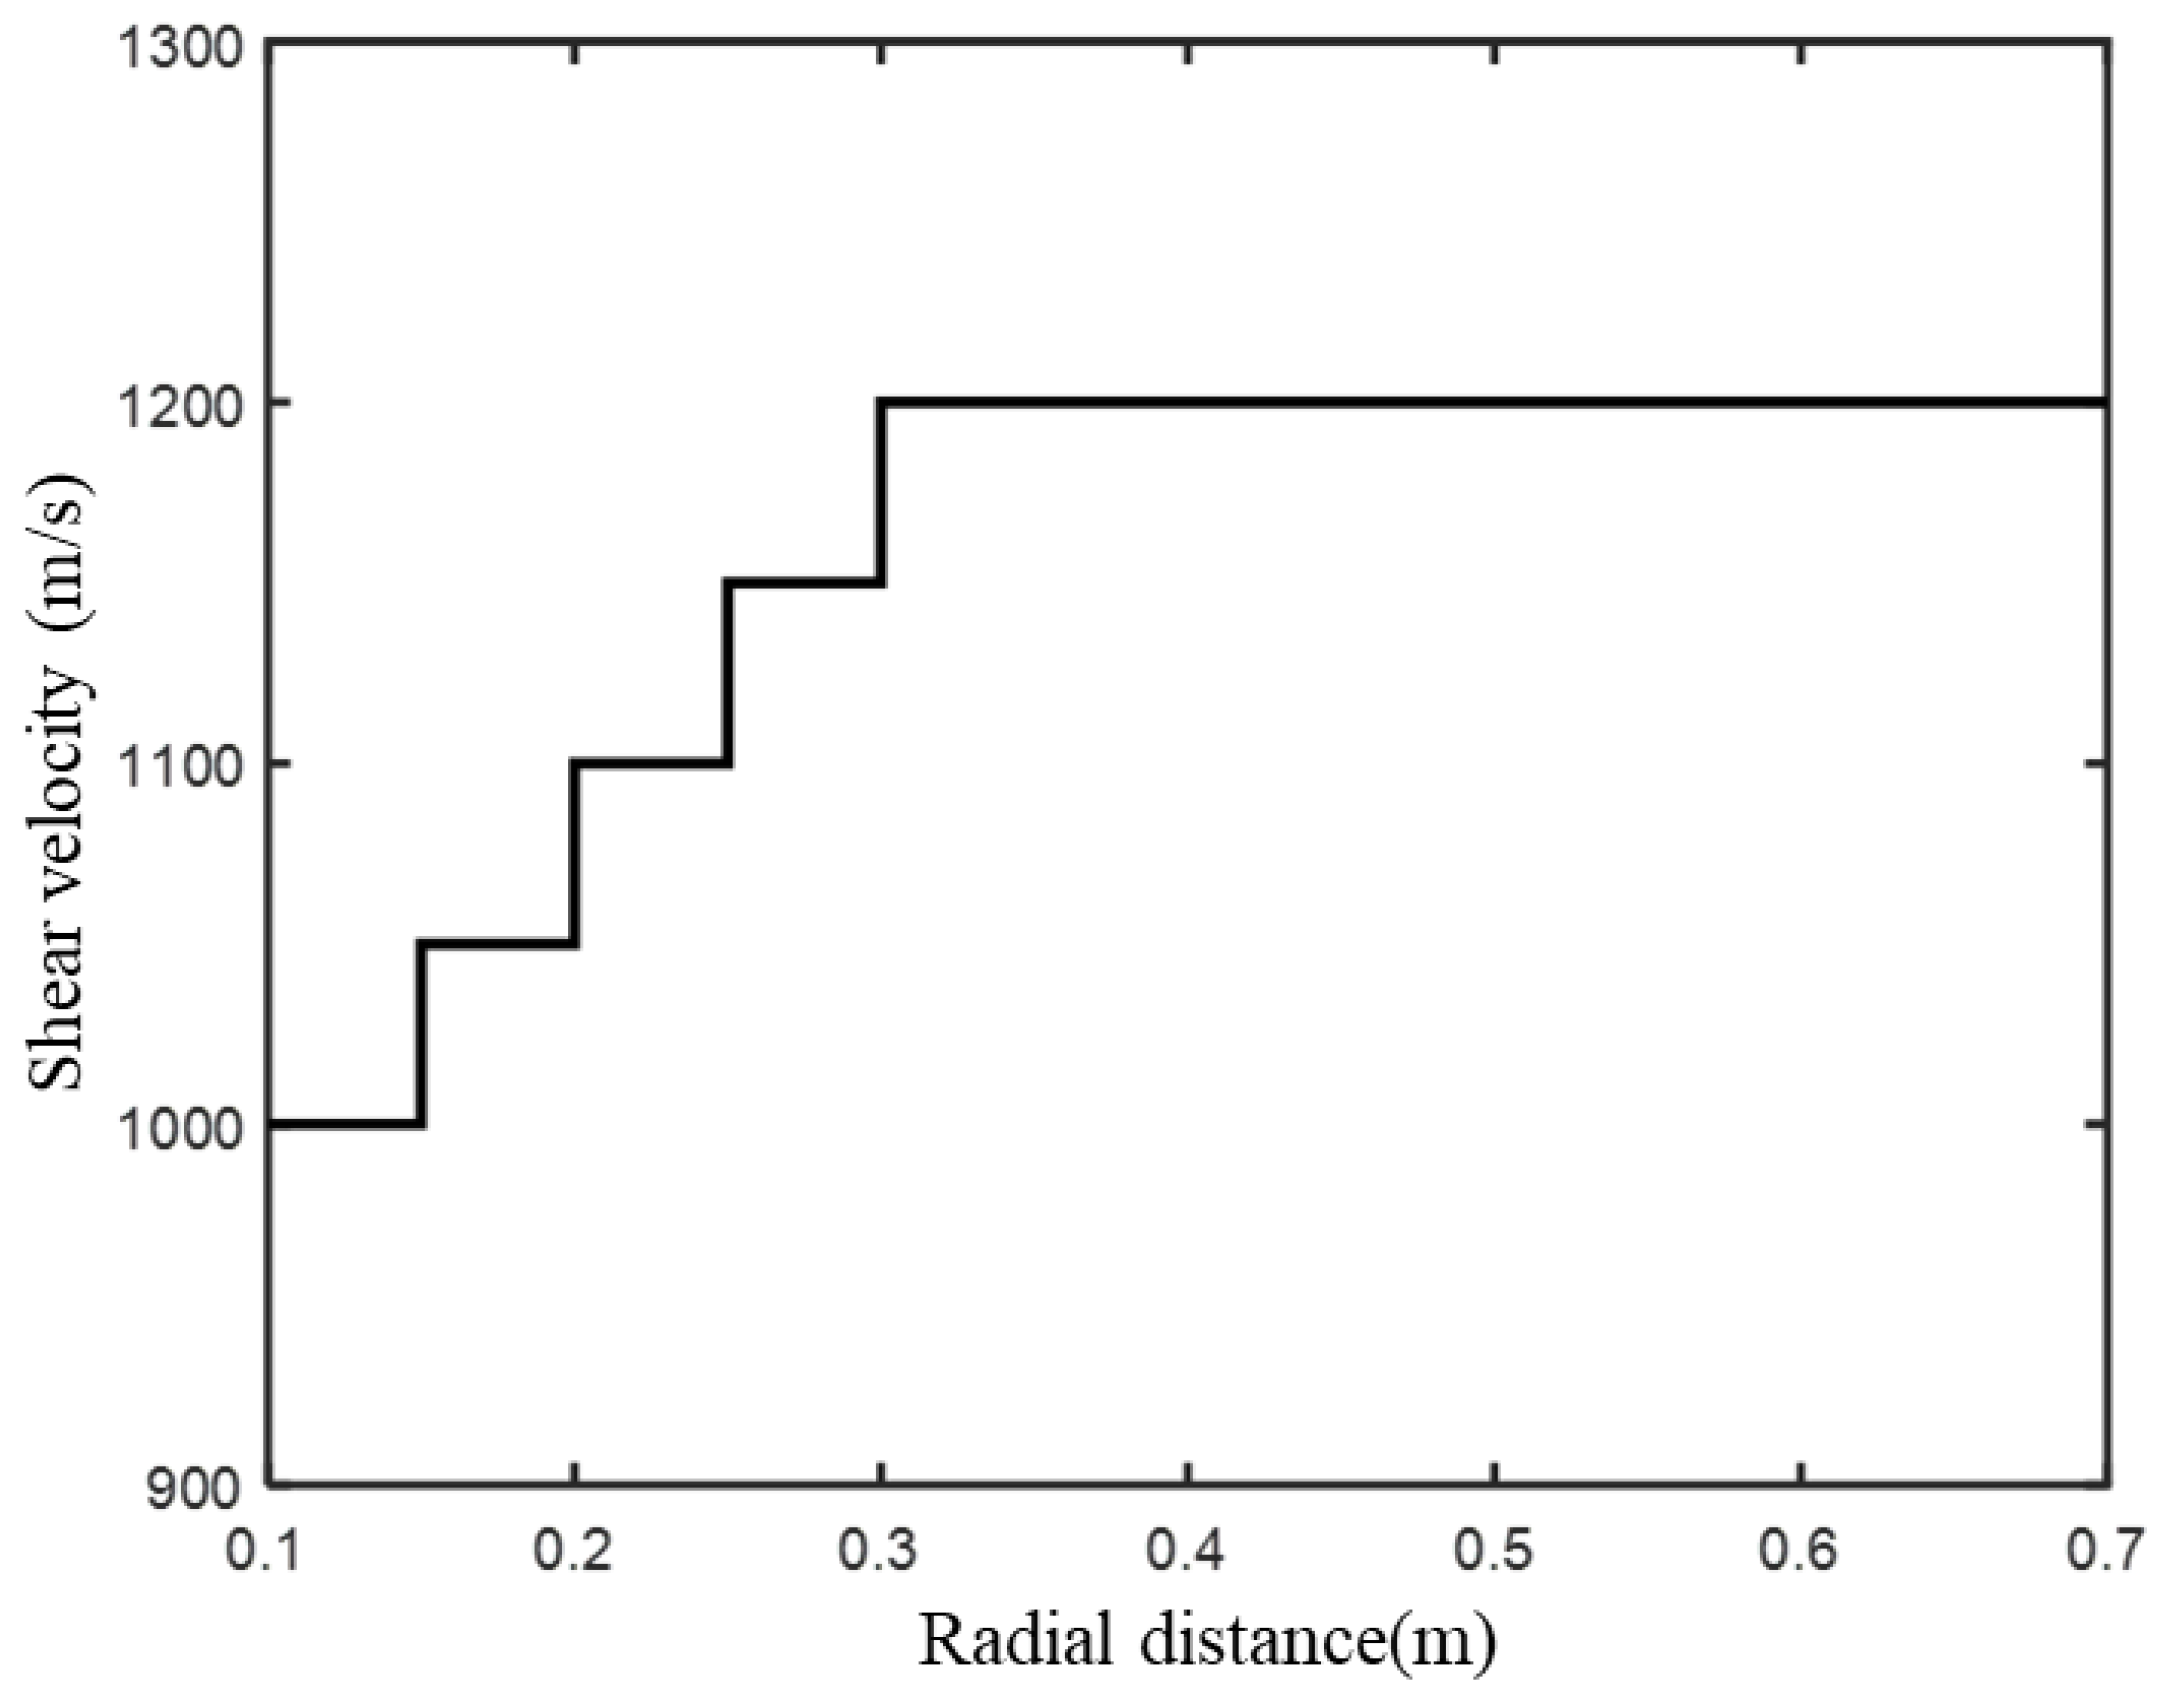
Figure 1. Structure diagram of numerical simulation model.
Energies 16 00059 g001
Figure 2. Waveforms of the numerical simulation model.
Energies 16 00059 g002
Figure 3. (a) Dispersion analysis by the weighted spectral semblance method and (b) the fitting results.
Energies 16 00059 g003
Figure 4. Two-dimensional correlation image of objective function in high-frequency constrained inversion.
Energies 16 00059 g004
Figure 5. Inversion result of high-frequency constrained inversion method.
Energies 16 00059 g005
Figure 6. Radial distribution of relative error between inversion result and real formation velocity.
Energies 16 00059 g006
Figure 7. Dispersion curve without tool impacts (blue); reference dispersion curve calculated by the equivalent-tool theory (black); dispersion curves of the waveform affected by the tool (red).
Energies 16 00059 g007
Figure 8. Two-dimensional image of objective function: (a) using equivalent-tool theory and (b) without using equivalent-tool theory.
Energies 16 00059 g008
Figure 9. Inversion results using equivalent-tool theory (red line) and without using equivalent-tool theory (blue line).
Energies 16 00059 g009
Figure 10. Relative error between inversion results and real values using equivalent-tool theory (red line) and without using equivalent-tool theory (blue line).
Energies 16 00059 g010
Figure 11. Comparison of formation shear-velocity profile radial with several logging results.
Energies 16 00059 g011
Table 1. Parameters of radial variation-formation model.
Formation PropertiesRadial Depth (m)P-Wave Velocity (m/s)S-Wave Velocity (m/s)Density (kg/m3)
Borehole fluidr < 0.11500-1000
TZ10.10 < r < 0.15240010002500
TZ20.15 < r < 0.20240010502500
TZ30.20 < r < 0.25240011002500
TZ40.25 < r < 0.30240011502500
Undisturbed Formationr > 0.30240012002500
Table 2. Parameters of simulated formation and tool.
Formation ParametersTool Parameters
P-wave velocity (m/s)3200Density (kg/m3)7850
S-wave velocity (m/s)2300Inner radius (m)0.01
Density (kg/m3)2500Outer radius (m)0.045
Radius (m)0.1
Disclaimer/Publisher’s Note: The statements, opinions and data contained in all publications are solely those of the individual author(s) and contributor(s) and not of MDPI and/or the editor(s). MDPI and/or the editor(s) disclaim responsibility for any injury to people or property resulting from any ideas, methods, instructions or products referred to in the content.