Article

Comparison of the Carbon Payback Period (CPP) of Different Variants of Insulation Materials and Existing External Walls in Selected European Countries

Faculty of Architecture, Wrocław University of Science and Technology, 50-317 Wrocław, Poland
Energies 2023, 16(1), 113; https://doi.org/10.3390/en16010113
Submission received: 12 November 2022 / Revised: 8 December 2022 / Accepted: 8 December 2022 / Published: 22 December 2022

Abstract

:
The EU “Fit for 55” legislative package provides for the introduction of regulations enabling the achievement of the emission reduction target by 55%. As part of the necessary actions, it is necessary to increase the energy efficiency of existing buildings. To achieve this, there are plans to increase the pace of the modernization of buildings, from 1% to 3% of buildings annually by 2030. However, this must be done with respect to the principles of sustainable development, circular economy and the conservation of buildings. This article presents a comprehensive comparison and calculation of carbon payback period (CPP) for selected insulation materials, combined with selected typical building partitions, and shows how quickly the payback period of greenhouse gases in the production of insulation materials is completed. Individual insulation materials (stone and glass wool, expanded polystyrene (EPS), extruded polystyrene (XPS), polyurethane (PUR) and cellulose) were analyzed in relation to different types of walls (seven types—including solid wall, diaphragm wall, large panel system (LPS), and concrete), in different locations (Poland, Germany, Czech Republic, Austria, Finland, Europe) and for various energy sources (electricity, gas, oil, biomass, district heating). After taking into account the carbon footprint embodied in the insulation materials, along with the potential reductions in the operational greenhouse gases emissions, the carbon payback period (CPP) was determined, resulting from the use of a given technology, insulation material and location. By comparing the CPPs for different insulations, this paper shows that the results vary significantly between EU countries, which have different embodied carbon factors for energy sources and materials, and that there is still a serious lack in the availability of reliable environmental information, which can limit research results.

1. Introduction

Due to climate change, the construction sector worldwide faces serious challenges, in terms of reducing energy consumption and reducing the environmental impact of buildings. Currently, it is estimated that buildings in the European Union (EU) consume 40% of final energy [1] and are responsible for 36% of greenhouse gas emissions [2], compared to, respectively, 35% and 38% worldwide [3]. According to the European Commission, better construction and use of buildings in the EU would remove 42% of our final energy consumption, about 35% of our greenhouse gas emissions, more than 50% of all extracted materials, and would enable water savings of up to 30% [4]. The European Commission recommends that Europe become climate-neutral by 2050, and the European Green Deal plan, presented in December 2019, assumes a reduction in greenhouse gas emissions by 55% (compared to 1990) by 2030 [5]. It should be remembered that energy consumption and greenhouse gas emissions are closely related and apply to both existing and new buildings. Requirements for energy efficiency and the reduction of energy consumption have been regulated in the EU for years, which has resulted in a reduction in household heating consumption in EU countries, in the years 2000–2018, by 29% [5,6]. Many countries have even more stringent regulation on the energy consumption of new buildings, known as “nearly zero-energy buildings” (NZEB) regulation, which have been mandatory from 1 January 2021 [1], while “zero-emission buildings” (ZEB) regulation is planned to be mandatory from 1 January 2030. EU energy consumption regulation also applies to existing buildings, which should be emission-free by 2050 [6]. In the case of the embodied and operational carbon footprint of buildings, in most EU countries there are no requirements for maximum values for these emissions, and there is no obligation to provide this value; however, according to the proposed amendment to the Energy Performance of Building Directive (EPBD), the global warming potential (GWP) value should be calculated for new buildings from 1 January 2030 [7].
One of the European Green Deal programs, designed to improve the energy performance of buildings and achieve more efficient use of resources, is the strategy for the “Renovation Wave”. Currently, more than 30% of buildings in the EU are more than 50 years old, and over 70% of the building stock is energy-inefficient [1]. According to the European Commission, for residential buildings, the annual weighted medium energy renovation rate (30–60% of savings) was estimated to be close to 1% within the European Union, and deep renovations (>60% of savings) were only 0.2% per year [8]. For light renovations (3–30% of savings) and below-threshold changes (<3% of savings), the degree of renovation was 3.9 and 7.1%, respectively. For non-residential buildings, annual weighted below-threshold, light, medium and deep energy renovation are estimated to promote savings around 4.1, 3.0, 2.1 and 0.3%, respectively.
Calculating the primary energy consumption, using the same primary energy factors for all Member States, the average energy renovation within the European Union is estimated to reduce a residential and non-residential building’s specific primary energy consumption by 14 and 47 kWh/(m2∙a), respectively. At the same time, the relative annual greenhouse gases (GHG) reduction per residential and non-residential renovation—based on the average of all energy renovations across the EU28 between 2012 and 2016—is estimated to be roughly 9 and 18%, respectively [8]. This is not enough, according to the EU’s statement [9].
The EU has a goal to double the ratio of medium energy renovations for residential and non-residential buildings, and even to increase it by 3% for public buildings. Thus, it is predicted that, by 2030, 35 million buildings could be renovated, which would help to address the problem of eliminating energy poverty [10,11]. Such renovations could reduce energy consumption by 66% for residential buildings and 65.8% for non-residential buildings, while it is also estimated that their carbon footprint will reduce by as much as 50–75% [12]. Thus, renovating existing buildings would enable the EU to meet its 2030 goals of 32.5% energy savings and a 40% GHG emissions reduction, compared to 1990 [11], although 97% of buildings must be renovated to accomplish the EU’s 2050 decarbonization goal [13].
It is important that buildings are not only energy-efficient, but also less carbon-intensive over their life cycle, and more sustainable. Therefore, the key principles of the Renovation Wave [10] proposal, in addition to energy efficiency, include:
life-cycle thinking and circularity, to minimize the footprint of buildings;
respect for aesthetics and architectural quality;
renovation must respect design, craftsmanship, heritage and public space conservation principles.
These key principles are particularly important in the case of the renovation of historic buildings: to reduce final energy consumption, reduce greenhouse gas emissions throughout the life cycle, maintain the historical and aesthetic value of buildings and ensure thermal comfort and a healthy environment for building users.
When considering life-cycle emissions, all such factors as operational emissions and embodied emissions in construction materials, thermal insulation materials and technical equipment should be taken into account. It is necessary to reduce all types of emissions, and due to the increasing contribution of embodied emissions, special attention should be paid to them. In the case of new buildings, estimates of the ratio of the embodied to the operational carbon footprint are about 10–40%, although they depend on many factors [13,14] and for different countries they can range from 2 to 80% [15]. Additionally, for energy-efficient buildings, the share of the embodied carbon footprint is growing [16] and can be 45% [17], 50% [18] or 57–74% [19], and for zero-energy buildings this share can even reach 75% [20]. Installations also significantly contribute to the built-in carbon footprint, as various studies have shown that installations in total can be responsible for approx. 5–30% of greenhouse gas emissions [21,22,23]).
In the case of renovation, the estimation is even more difficult, as the new embodied carbon footprint must be considered simultaneously together with the reduction in the operational carbon footprint resulting from energy renovation. It should also be emphasized that, in the case of non-energy renovation, there may be no reductions in operational greenhouse gas emissions. It is assumed that renovations can be divided into 29 types of activities, including energy-related and non-energy-related ones. They concern changes to the building envelope, the method of heating and hot water heating, ventilation, cooling, lighting, energy sources, interior finishes and others. For example, in Poland, on average, modernization works in 2010–2016 concerned [24]:
insulation of external walls—93%;
installing windows—36.5%;
modernization of the internal heating system—25.2%;
modernization of the hot water installation—13.3%;
modernization/replacement of the ventilation system—5.6%.
The data presented by Visiongain [25] also indicate the advantage of modernization works on external walls (47%) in relation to the roof (37%) and floor (15%).
In the case of insulation, which dominates the renovation works carried out, it is responsible for a significant reduction in energy consumption and operational carbon footprint. These reductions are very high and, depending on many factors, can reach 90% [26,27]. Regarding the wall insulation systems used in the renovation of buildings, in the literature, values can be found that range from a low of 34–36%, up to even 85% [28,29,30].
The impact of thermal insulation on the environment is usually considered in two regards. Firstly, the value of the embodied carbon footprint of individual building materials is analyzed, the results of which are very different and depend on many factors, including the adopted functional unit (FU). The FU is used in the form of kgCO2∙kg−1 of material, kgCO2∙m−2 of the surface with a specific resistance R, kgCO2∙m−3 of material or kgCO2∙m−2 of the usable area of the building [31,32]. Many authors compare different materials using the same functional unit: Hill et al. [33] compare global warming potential (GWP) and embodied energy (EE) values based on 60 environmental declarations; Su et al. [34] provide a life-cycle assessment (LCA) comparison of the eight most popular insulation materials; Pargana et al. [35] compare materials that are popular in Europe; Casini [36] and Biswas et al. [37] compare insulation materials present on the market, taking airgel into account. A particularly useful listing is provided by Grazieschi et al. [32], who compile information on materials obtained from 156 EPDs and compare the data in terms of GWP/FU and PER/FU (primary renewable energy) and PENR/FU (non-renewable primary energy). The results presented in that paper indicate that natural materials, such as cellulose, wood fibers, hemp, straw bale, flax, are very competitive in terms of GWP in relation to mineral materials (stone wool, glass wool, glass foam, expanded clay) and fossil materials (EPS, XPS, PUR/PIR). However, at the same time there are large discrepancies among such materials as wood fibers, cork, and vacuum insulated panels (VIP). These they may result from differences in the fabrication process due to the innovative nature of these materials.
The second, often discussed, aspect in modernization analyses is the degree of emission reduction in the life cycle after the use of thermal insulation. The reduction in emissions comes from reducing the demand for energy, but the embodied carbon footprint throughout a life cycle must be also taken into account. Aditya et al. [24] list emission reductions for cases analyzed in the literature, which range from 27 to 77%. Such large discrepancies resulted, for example, from the technologies used or the energy mix in a given location. Beccali et al. [38] analyze the example of 6 multi-family buildings in Italy in terms of emission reduction for variants of additional insulation in the form of mineral wool and cellulose. Reductions related to FU in the form of 1 m2 of residential floor were additionally divided into buildings made with construction technologies in different years. However, the results were similar and for both materials they averaged 27% for buildings from 1945–1969, an average of 23.6% for buildings from 1970–1989 and an average of 7.8% for buildings from 1990–2010. In these cases, the differences resulted from the technology in which the modernized building was built. However, this does not change the fact that insulating existing, energy-inefficient buildings is justified, both in terms of finances and environmental protection.
The payback period is therefore an important issue. The results of LCA and life-cycle cost (LCC) analyses can be presented for investment as investment payback period (IPP), energy as energy payback period (EPP) and carbon as carbon payback periods (CPP). The IPP is used to assess the economic attractiveness of an investment and is expressed as its payback period in years [38]. In the same way, the payback period of the energy invested in the building can be presented as the energy payback period (EPP) or the invested emissions can be depicted as the carbon payback period (CPP) [38,39,40,41,42]. The results of the IPP, EPP and CPP analyses are presented by Zhang et al. [43] on the example of prefabricated façade elements and for CPPs in different countries: Spain, the Netherlands and Sweden, respectively, with periods of 23.33, 16.78 and 8.58 years. After the introduction of recycled material for the production of panels, the CPP period shortened this time by approx. 40%. Using the example of public building in six European cities, energy and GWP payback time analyses (Ardente et al. [44]) were carried out for retrofits actions, attaining results from 0.5 to 26.5 years, depending on the city. In the case of a single-family house, the EmPT (emission payback time) was calculated for the insulation of external walls made of EPS boards to be 21.23 years (Beccali et al. [39]).
Since there are separate extensive analyses of the carbon footprint of insulation materials [31,32,33,34,35,36,37] and case studies [24,38,39,39,40,41,42,43,44,45] in the literature, and there are no analyses of typical partitions and insulation, the main object of this study is the presentation of carbon footprint analyses. These will be given in the form of the carbon payback period (CPP), specified for chosen states in EU, for the most popular variants of combining thermal insulation with a typical uninsulated wall, taking into account the savings of the operational carbon footprint in a given state with a specific energy mix. This way of presentation aims at helping investors, designers and contractors in choosing the most favorable variant of insulation material in terms of environmental impact.

2. Materials and Methods

2.1. Goal and Scope

Due to the main activity in the renovation of buildings consisting in insulating façades, it is important to analyze the environmental impact of the selected insulation system over its entire life cycle, together with the expected operational energy savings. The choice of a low-emission material, combined with its good thermal insulation performance, affecting operational energy savings, can significantly reduce the carbon footprint of a building throughout its life cycle.
The main goal of the study is:
comparison of the carbon footprint of the most popular thermal insulation materials in Europe;
comparison of operating energy savings using the analyzed insulation materials for typical building partitions and the resulting savings in carbon dioxide emissions;
comprehensive comparison and calculation of the CPP for insulation materials used in the modernization of typical building partitions in various locations.
The information on the impact of insulation materials on the environment was obtained thanks to EPD declarations (environmental product declaration, type III), defined in accordance with EN 15,804. These declarations were taken using the LCA Software OneClickLCA platform, which verifies and collects data from various EPD platforms (OneClickLCA, EPD Norge, IBU, CENIA, ITB, BRE, ECIA, Baubook, IBU, Okobaudat). OneClickLCA ensures the fulfillment of the following assumptions, guaranteeing comparability with life-cycle assessment results: comparable scope, comparable life-cycle phases for all compared options and technically comparable calculation data and assumptions. All information published in the OneClickLCA environmental product declaration (EPD) has been verified by an independent third party, which guarantees the accuracy and reliability of the EPD and its conformity to the requirements of the relevant product category rules (PCR) [46]. In order to calculate the operational energy savings and the resulting reduced emissions, information was taken from the data of the National Center for Balancing and Management of Emissions for Poland and from the literature for European countries (described in more detail in Section 2.4.2).

2.2. Functional Unit (FU)

According to ISO 14040, as the basis of the LCA standard, the functional unit (FU) describes a quantity of a product system [47,48] on the basis of the consistency of its performance with the objectives and scope of the system. For the purposes of this study, it was defined as 1 m2 of an insulated wall with a heat transfer coefficient compliant with the passive construction standard Uc = 0.15 W∙m−2K−1 (Rti, j = 6.(6) m2∙K∙W−1) [49]. As each wall consists of an existing part and insulation material, the total thermal resistance of the partition will be equal to:
Rt i , j = R si + R wall , i + R ins , i , j +   R se ,   [ m 2   K   W 1 ]
U c = 1 Rt i , j ,   [ m 2   K   W 1 ]
where Rwall.i is the thermal resistance of the existing wall (i), Rins,i,j is the expected thermal resistance of the given insulation (j) on a given wall (i), Rsi is the resistance of heat absorption on the internal surface (0.13 m2∙K∙W−1) and Rse is the resistance of heat absorption on the external surface of the wall (0.04 m2∙K∙W−1). The value of Rins,j has a different value each time depending on the resistance of the existing wall:
R ins , i , j = Rt i , j R si R wall , i   R se ,   [ m 2   K   W 1 ]
As each insulation material has a different value of the thermal conductivity coefficient (λj), the insulation thickness (di,j) will be different for each partition (i,j), and so each time it is necessary to convert the functional unit specified in the EPD declaration for each insulation (kg, m2, m3, etc.) to the required thickness (di,j).
d ins , i , j = λ ins . i , j   ·   ( Rt i . j R si R wall . i   R se ) ,   [ m ]
Note that the insulation system on specific wall, not the building, is the object of interest. The geographical boundaries of each studied state (Poland, Germany, Czech Republic, Austria, Finland, Europe, Europe (average from listed states) with their capitals were the system boundaries for this assessment. The climates and locations of these cities are explained in Section 2.7.

2.3. Carbon Payback Period (CPP)

While the economic valuation uses the payback method—the attractiveness of capital investments [50], the energy payback period (EPP) or carbon payback period (CPP) methods [43] can be used to assess the energy or environmental attractiveness related to, for example, the reduction of CO2 emissions (in other studies EPP is called energy payback time EPBT [39]). CPPi,j,k,S, which is the payback period for the selected wall (i), insulated with the selected material (j), in the selected location (S) and for the selected heat source (k), can be expressed as:
CPP i , j , k , S = C E , j , S C o , i , j , S ,   [ years ]
where CE,j,S is the embodied carbon reported as GWP (for the selected insulation material (j) in the selected location (S)) and Co,i,j,S is the annual operational CO2 savings (for the selected wall (i), insulated with the selected material (j) in the selected location (S)).
In this study, the CPP was used to evaluate and compare different insulation materials, in combination with different wall types, because it clearly shows how long the use of a given insulation material results in greater CO2 savings in relation to embodied carbon, and whether this period does not exceed its life-cycle time.
Note that CPP differs from CROI (carbon return of investment) [51], which indicates the ratio of GHG savings over the life cycle to embodied GHG for the analyzed investment. Values above 1 indicate the ecological attractiveness of the investment.

2.4. System Boundaries

The study takes into account the life cycle of the building according to EN 15,978 [52]. The boundaries of the system have been defined in terms of the scope and purpose of the study and have been divided into parts. These cover all the significant elements, materials and components affecting the CO2, a substance which reports the global warming potential (GWP) and is referred to as embodied carbon. The models under study will cover two stages of the life cycle: product stage and use stage. The EoL stage, which was described in Section 2.4.3, was not analyzed.

2.4.1. Life-Cycle Inventory Analysis of Product Stage

With regard to the system boundaries of the study, the environmental impact of materials related to the production stage (A1–A3 substages), including raw material supply (A1), transport (A2) and the manufacturing (A3) substages, was calculated. Transport (A4) to the construction site and assembly (A5) were neglected as they had no effect on the test result. The data contained in the life-cycle impact assessment (LCIA) were taken from available databases and EPD platforms compliant with the EN 15,804 standard and available in the LCA software OneClick LCA (OneClickLCA, EPD Norge, IBU, CENIA, ITB, BRE, ECIA, Baubook, IBU, Okobaudat) [46]. The inventory of the materials taken into account, both for the existing walls (Wi) and the insulation materials used (Insj), is presented in Section 2.6 and Section 2.7.

2.4.2. Life-Cycle Inventory Analysis of Use Stage

With regard to the system boundaries of the study, the environmental impact of materials related only to the operational energy use (B6 substage) was calculated. Other substages like use (B1), maintenance (B2), repair (B3), replacement (B4), refurbishment (B5) and operational water use (B7) were neglected, as they are not important for the calculation of the CPP indicator. Moreover, the lifetime of the system has not been determined because it is not needed in CPP calculations, although the lifetime of insulation materials equal to 25 years was taken into account in the conclusion.
Since the operational energy use and non-renewable primary energy factors (PEFn) values depend on the energy source, the PEFn values specific to the Member States’ data were taken into account [53,54]. Member States in colder climate conditions, such as Poland, Germany, the Czech Republic, Austria and Finland, were included in the analysis. This has been presented in detail in Table 1. Additionally, CO2 emissions of various energy sources have been adopted individually for the analyzed Member States, the data for which are presented in Table 2.

2.4.3. Life-Cycle Inventory Analysis for End of Life (EoL) Stage

With regard to the system boundaries of the study, the environmental impact of materials related to the EoL stage, including the deconstruction (C1), transport (C2), waste processing (C3) and disposal (C4) substages, was neglected because not all are available and analyzed EPDs with specified GWP values for phases C1–C4. In order to make the comparison of materials possible, this stage was omitted.

2.4.4. Life-Cycle Inventory Analysis for Reuse, Recovery, Recycling and Potential stage

The reuse, recovery, recycling and potential stage (D) were omitted because some materials do not contain biogenic carbon, the presented data are characterized by high uncertainty and most EPDs lack the indicator value for this stage.

2.5. Insulation Materials

As mentioned above, most renovations involve the insulation of external walls [24,25], in the form of assembling insulation material and attaching it to the external or internal surface of an existing wall. The construction market offers a lot of insulation materials that differ in physical properties, price and availability, and the materials which offer the best performance per unit cost are the most popular. There are also so-called environmentally friendly materials (renewable materials).
According to IAL Consultants (2020) [67], currently glass and stone wool represents 55.1% of the European thermal insulation market, with expanded polystyrene accounting for 24.7%, PU/PIR representing 11.7%, and XPS taking up 6.3%. These are the four dominant materials, although expanded polystyrene (EPS) foam is the most popular one used for external wall insulation because of its low price and the better performance characteristics. It is worth adding that Germany, France and Poland [68] are the leading countries in the EU market for thermal insulation materials.
Taking into account the purpose and scope of the study, the following materials were selected for analysis:
the most popular on the construction market;
the ones whose information on environmental impact is available in the form of EPD.
Table 3 presents selected materials with their basic properties.
The choice of insulating materials also results from the technologies used to insulate buildings and the types of insulated partitions. The ETICS/EIFS (external thermal insulation composite system/external insulation finishing system or light-wet method) is one of the most popular methods of thermal modernization of external walls. The thermal insulation material, with a thin layer of render as a finishing component, is assembled to an external wall (by means of gluing or dowelling). EPS, XPS and PUR boards are the most commonly used insulation materials in the use of this technology. External cladding, made from various materials like wood, metal, stone, ceramics, etc., attached to the insulation, and taking into account the ventilation gap (light-dry method), is another popular external wall finishing system. The insulation is also glued or pinned to the exterior wall, but the cladding material is fixed to a support structure of wood, steel or aluminium. Mineral wool (stone/rockwool or glass wool) belongs to the most popular materials in this technology. An additional system, used in wooden frame buildings or in walls with an air gap (some prefabricated systems from the so-called Large Panel Systems), fills the voids between the elements with filling materials such as PUR/PIR foam or cellulose, which are the most popular materials in this technology. It should be noted that the type of facade finishing system used was omitted in the analysis because most often they can be used interchangeably, regardless of the insulation material applied, and it is the area not included in the study. The technologies of internal insulation of buildings were also omitted.
The environmental impact of insulation materials is now an indicator of increasing importance. Due to the proposed changes in the EPBD directive, consisting of the calculation of the global warming potential for new buildings from 2030 [7] and, in the longer term, of the decorbanization of the building stock by 2050, it is necessary to acquire and disseminate knowledge about building materials. In particular, this impact relates to thermal insulation, which will be the main contribution to embodied GWP for existing buildings undergoing renovation.
Recently, we obtained information on the impact of insulation materials on the environment thanks to EPD declarations (Environmental Product Declaration, type III) defined in accordance with EN 15,804 [69]. Declared values vary for different and even for the same materials. According to Shrestha et al. [70], they encompass the following issues:
typology of the insulation materials (blown/expanding/loose material, panel itp.);
manufacturing methods and technologies;
energy mix of the countries where manufacturing processes happen;
percentage of recycled material introduced in the production chain;
origin of the raw material and distance from the manufacturing site.
Particularly large differences may result from the use of different energy mixes in different locations, characterized by a different share of renewable energy sources in relation to fossil fuels and thus different CO2 emissions. Even within a single production facility, there can be differences depending on the date of manufacture. Because the use of national energy mix and annual average values is often recommended [71], national emission factors, primary energy factors (Table 1 and Table 2) and the average EPD for a given material (also referred to in the context of EN 15,804 Sector EPD, Industry-wide EPD or Generic EPD) are presented. Table 4 summarizes the number of EPDs (both individual and generic) drawn from the analyzed databases [46] and the calculated average GWP values for cumulative stages (A1–A3) characteristic for a given location. All available EPDs for selected materials available on platforms in the analyzed locations were analyzed. In total, there were 270 of them, 247 of which were specific EPD and 23 were generic EPD. Additionally, the average value of Europe (aver.) was calculated, for which the values are the average ones from the analyzed locations. Figure 1 presents the comparison of GWP (kgCO2-eq) of FU = 1 m2 of material with resistance (R) of 1 m2∙K∙W−1 for insulation materials in different countries. Although the analyzed amount of EPD seems to be large, significant gaps in their availability have been found, as in many EU countries there are no generic EPDs or no EPDs at all. In this situation, the values of the average GWP calculated for the European average were used. This is, however, one of the elements limiting the results of this study.

2.6. Existing External Walls

According to the European Commission, more than 220 million building units, representing 85% of the EU’s building stock, were built before 2001 [8] and currently more than 30% of buildings in the EU are more than 50 years old [1]. Over 70% of the building stock is energy-inefficient and must be renovated [1]. One of the goals of the A Renovation Wave for Europe proposal is to at least double the annual energy renovation rate of residential and non-residential buildings by 2030 and to foster deep energy renovations [8]. This should result in 35 million building units being renovated by 2030.
The locations selected for the analysis are characterized by a similar geographical location (in colder climate conditions) and a similar age structure of the existing buildings. Data analyzed on the basis of statistical data available in Poland indicate that about 7.3% of buildings were built before 1918, 14.6% were built in 1918–1944, 24.6% in 1945–1970, 25.4% in the years 1971–1988, 12.1% in the years 1989–2002, and the remaining 10% in the 21st century (data from 2011 based on the National Population Census) [72].
When analyzing the existing types of walls, the age structure of the buildings, based on the example of Poland, and the structure of the material of the external walls, typical for various historical periods, were taken into account [71]. A detailed description of the analyzed walls and their parameters is presented in Table 5. The following types of walls were adopted for the analysis:
(Wwall.1): a massive wall, built of full ceramic bricks joined with lime or cement-lime mortars. It is one of the most popular type of walls in historical buildings. Walls with the thickness of 1.5 bricks were assumed for the analysis (Table 5, number 1). The assumed width of a brick commonly used in Europe equals 13 cm. Stone masonry walls used in earlier historical periods were omitted because their number among existing buildings is small;
(Wwall.2): perforated brick wall with the thickness of 1.5 bricks (Table 5, number 2). The brick is characterized by holes with rhomboid shapes perpendicular to the base and is widely used to this day;
(Wwall.3): cavity wall (Table 5, number 3). An air gap is used in the brick wall, which increases the thermal resistance of the wall, but it requires making connections between the layers of the wall;
(Wwall.4): slag concrete wall (Table 5, number 4). These types of walls, made of blast furnace slag formed during iron ore smelting or coal slag, were particularly popular after World War II;
(Wwall.5): aerated concrete wall (Table 5, number 5). Popular in Poland after 1954, but known in Europe since the beginning of the 20th century. Aerated concrete blocks are characterized by high thermal resistance and are still very popular today (in Poland, their market share at the end of the 20th century was approx. 40%),
(Wwall.6): prefabricated curtain wall from large panel systems (LPS) in the WWP system (Table 5, number 6). Precast concrete buildings were very popular from the 1960s to the 1990s, especially in Central and Eastern Europe (170 million apartments were built). Many different systems have been developed, mostly consisting of two layers of reinforced concrete (bearing and texture layer) with insulation between them. Due to the low thermal resistance of these walls and various manufacturing defects, they require comprehensive modernization [73]. The wall in the WWP system consists of a load-bearing layer of reinforced concrete with 15 cm thickness, insulation made of polystyrene or mineral wool of 6 cm thickness and a reinforced concrete textured layer of 6 cm thickness;
(Wwall.7): half-timbered wall (Table 5, number 7). This is a type of wooden frame wall, the filling of which is a mix of clay with chaff, sawdust or shavings, or a brick (half-timbered work). This type of wall was historically very popular in northern Europe until the 17th century, but also later in Alpine construction, in Sudetenland and in the Baltic Pomerania.

2.7. Calculation Methodology

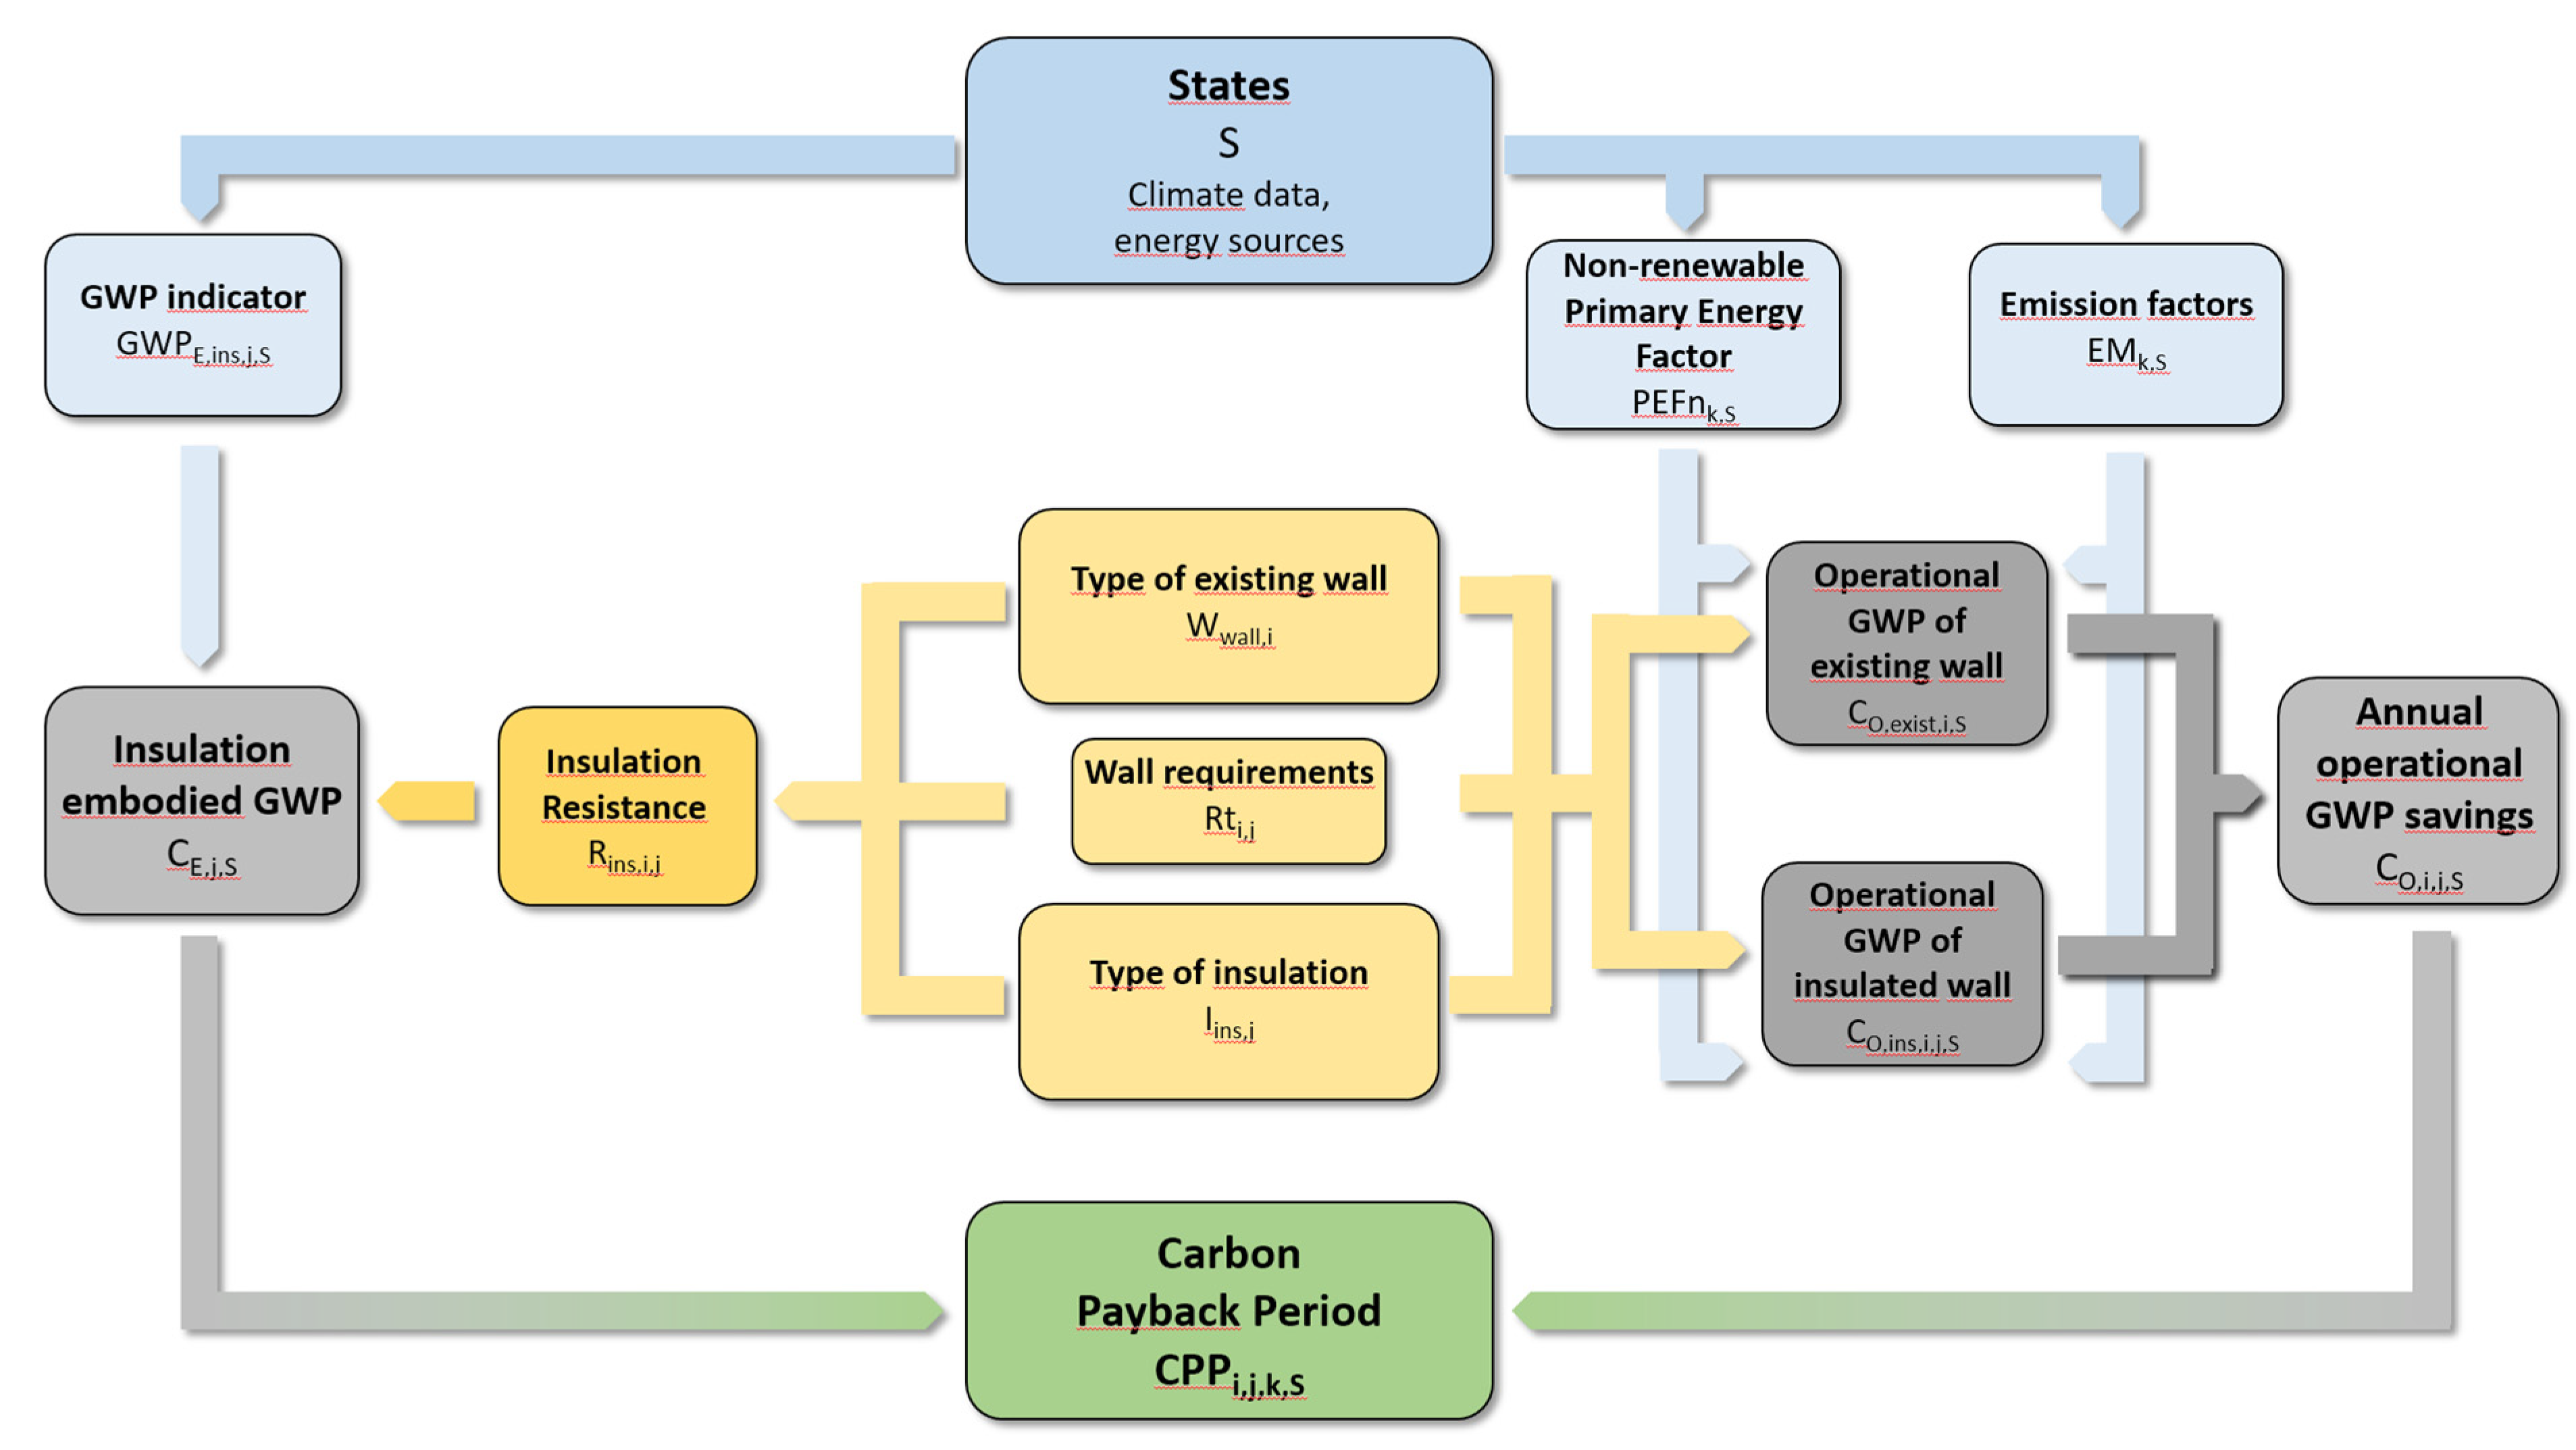
According to Section 2.3, carbon payback period (CPP) can be calculated according to the Formula (5) and following the methodology diagram shown in Figure 2.
CE,j,S depends on the thickness of the insulation used, which is calculated according to the Formula (4), and the expected insulation resistance, calculated according to the Formula (3). Since Table 4 shows the value of the embodied carbon for R = 1 m2∙K∙W−1, CE,j,S can be calculated for the expected resistance value for the entire partition equal to Rt = 6.(6) m2∙K∙W−1:
C E , j , S =   GWP E , ins , j , S · R ins , i , j ,   [ KgCO 2 -eq ]
where GWPE,ins,j,S means the value of GWP (embodied carbon) for the A1–A3 substages of 1 m2 of selected insulation material (j) with resistance R = 1 (m2∙K∙W−1) in the selected location (S) according to Table 4. Rins,j,S is the expected thermal resistance of the given insulation (j) on the existing wall (i).
Because CO,i,j,S values represent the annual operational GHG savings (for a selected wall (i) insulated with a selected material (j) in a selected location (S)), they can be calculated as the difference between heat losses and CO2 emissions for an existing wall, both without and with insulation:
C O , i , j , S =   C O , exist , i , S   C O , ins , i , j , S ,   [ KgCO 2 -eq ]
where CO,exist,i,S is the operational CO2 emission for 1 m2 of non-insulated, selected wall (i) in the selected location (S), and CO,ins,i,j,S is the operational CO2 emissions of the selected wall (i) insulated with the selected insulation material (j) in the selected location (S).
C O , exist , i , S =   Em k , S · PEFn k , S · 1 R wall , i , · HDD S · 0.024 · 10 3 ,   [ KgCO 2 -eq ]
C O , ins , i , j , S =   Em k , S · PEFn k , S · 1 Rt i , j · HDD S · 0.024 · 10 3 ,   [ KgCO 2 -eq ]
where:
Emk,S is the CO2 emission factor for the selected energy source (k) in the selected location (S);
PEFnk,S is the non-renewable primary energy factor for the selected energy source (k) in the selected location (S) according to Table 1;
Rwall,i is the thermal resistance of the selected wall (i) without insulation;
Rwall,i,j is the thermal resistance of the selected wall (i) with insulation;
HDDS—means the number of the heating degree days with the base temperature equal to 18 °C in capitals of the selected location (S): Europe—2671, Poland—3220, Germany—2962, Czech Republic—3328, Austria—2685, Finland—4318 [74].

2.8. Limitations of the Study

Before discussing the results, it should be emphasized that the findings of this study have to be seen in the light of some limitations. The study covers only the issues related to the calculation of the CPP for a given insulation material used in specific conditions, such as the place of its production, type of the insulated wall, method of heating the building, emission factors for a given location, etc. The study, however, does not indicate quantitative total LCA values of the built-in carbon footprint for the entire system (insulation and wall) and operational carbon footprint after thermomodernization. This may lead to a situation where insulation materials with a high GWP value, used on a building with a high operational carbon footprint, will have the same CPP value as materials with a low built-in carbon footprint used on the building with a low operational carbon footprint. This may lead to a misinterpretation of the results indicating that there is no difference between them, while in both cases the GHG emission values are diametrically different. It should therefore be emphasized that the comparison of the total carbon footprint values under the LCA for different insulation variants, used in buildings with different energy sources, is not within the scope of this study. Additionally, when analyzing the results, the entire planned modernization project should be referred to, also taking into account the change or lack thereof in the heat source.
Attention should also be paid to the limitation of this study, consisting of a selective analysis of a selected fragment of a wall with an area of 1 m2 without taking into account many other factors such as the impact of internal and solar heat gains on energy losses, the direction of partition orientation, exposure to external conditions as well as the method of installing insulation to walls, the presence of thermal bridges or the use of specific finishing materials. All this means that the actual heat losses will differ from the presented results. Nevertheless, the author omitted the impact of these factors, focusing on reducing additional parameters that could increase the number of analyzed variants and make the results illegible, although it should be borne in mind that the actual CPP, taking into account additional factors, may differ significantly.
The omission of the “rebound” and “prebound” effects, consisting of underestimating energy savings in existing buildings with low energy efficiency and overestimating savings in buildings after thermal modernization with high energy efficiency, may be another limitation of the research. According to the research results presented by Sunikka-Blank and Galvin [74], differences in actual energy consumption in relation to the calculated one may differ by 30% on average. Although this effect will have the same impact on each of the analyzed insulation materials, the CPP values taking it into account may increase.
When analyzing the use of selected insulating materials, the possibility of insulating partitions from the inside, which is often used in buildings of historical value, was not taken into account. Since the insulation of partitions from the inside is a technically complex issue, the analysis of such solutions may be the subject of further research. However, in this article, this range has been omitted, which makes it unviable to analyze the CPP for historic buildings where it is impossible to insulate partitions from the outside.
It should also be noted that there is a limitation resulting from the limited number of available EPDs. Although 247 declarations were analyzed, in relation to specific countries, there are cases where there are very few declarations or none at all. In addition, owing to their small number, it was necessary to include both specific EPDs and generic EPDs, which may affect the results. Due to the systematically growing number of declarations available in the databases, it will be necessary to include more of them in future research.

3. Results

3.1. CPP for Europe (Aver.)

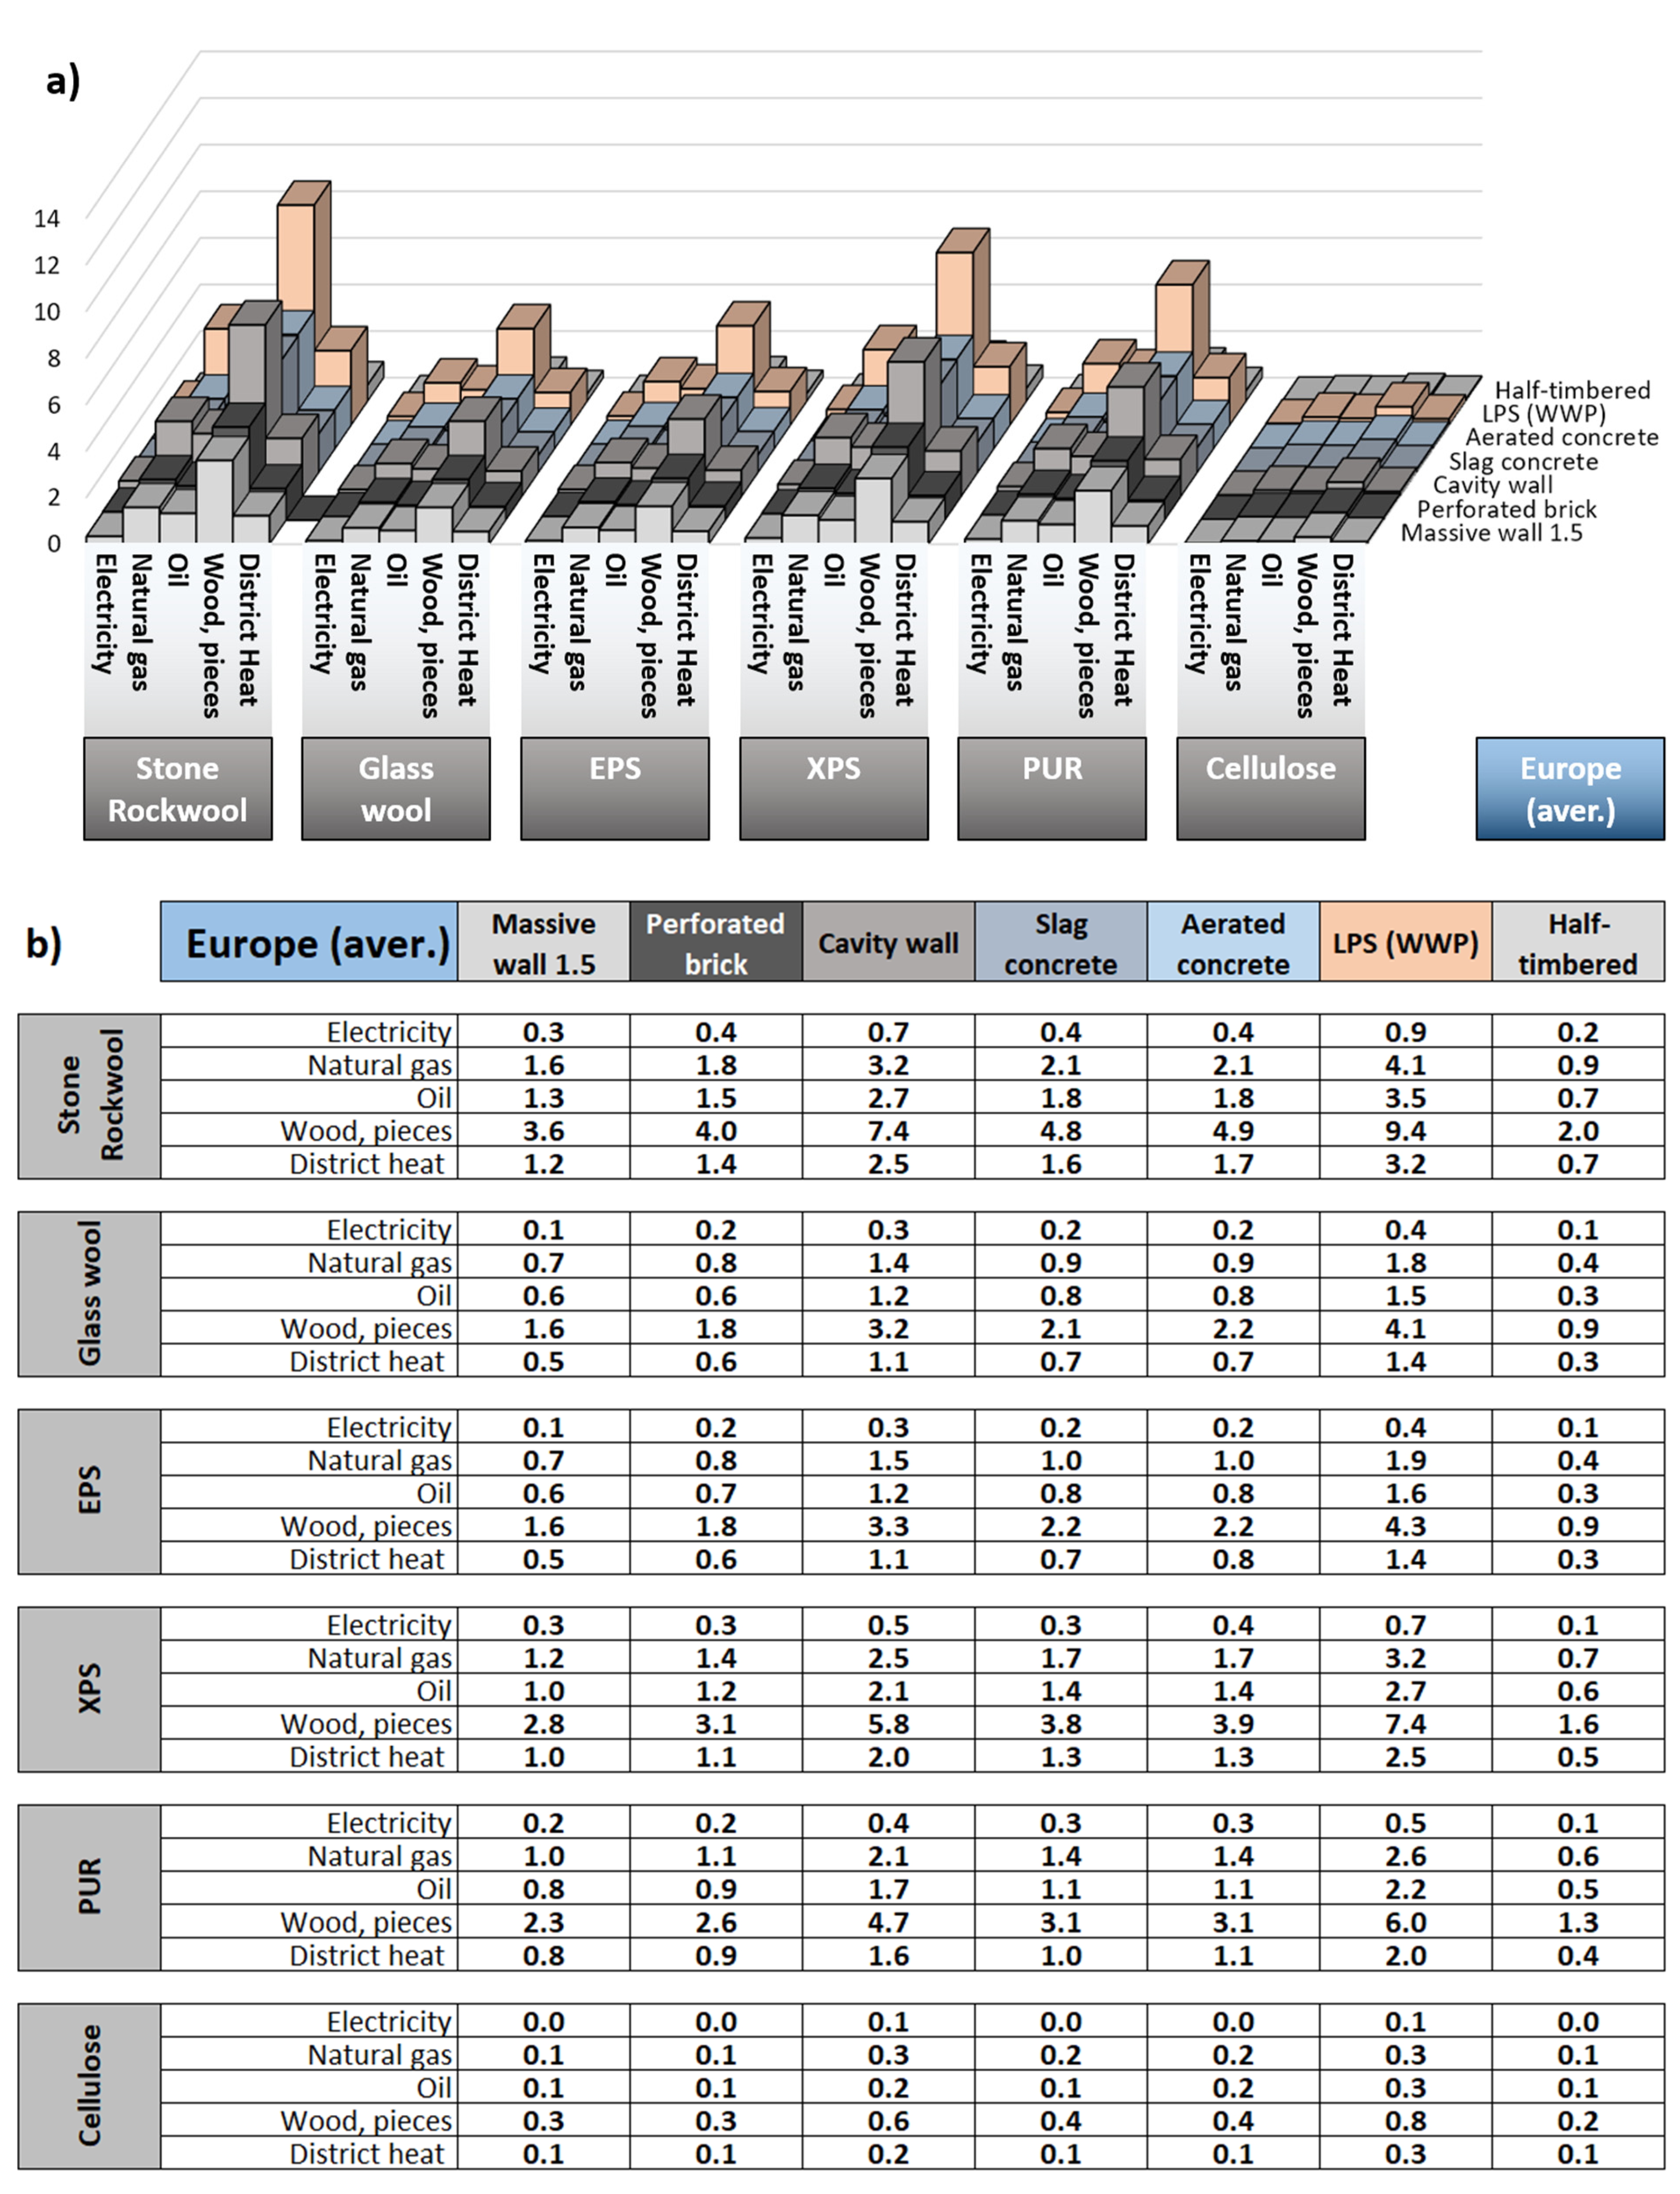
The average results for the analyzed countries in Europe (Europe aver.) are presented in Figure 3a,b.
After calculating the average values from the available 270 EPDs, averaged PEFn values, emission factors and climatic conditions, the longest CPP is found in stone-/rockwool-insulated walls (up to 9.4 years in the case of an LPS (WWP) wall with initially the highest resistance and in the space heated with biomass). Stone/rockwool has the highest CPP values due to the high value of embodied carbon (CE) for 1R∙m−2, owing to both high-density materials (used in Stone/Rockwool ETICS walls should be resistant to mechanical damage) and low-density materials (used in for walls with external cladding and a ventilation gap). Next, high CPP values are characteristic for XPS insulation (7.4 years) and PUR (6.0 years), especially for existing walls with high resistance and in situations of biomass heating. Lower CPP values have EPS (up to 4.3 years), glass wool (up to 4.1 years) and the lowest cellulose (maximum value is only 0.8 years), which is caused by the very low values of embodied carbon (CE). Depending on the energy source, the average CPP ranges from 0.3 for electricity to 2.9 for biomass and, depending on the type of insulation, it ranges from 0.2 for cellulose to 2.3 for stone/rockwool, as shown in Table 6a (CPP for various energy sources, regardless of the insulation method) and Table 6b (CPP for different insulation materials, regardless of heating method).
The following conclusions should also be noted:
for existing walls with higher resistance (Rwall) such as LPS (Wwall,6,) or cavity wall (Wwall,3), CPP values are higher;
in the case of space heating with biomass, the CPP values are much higher than the others;
the lowest CPP values are achieved for cases of space heating with electricity due to the high value of non-renewable primary energy factors (PEFnk,S) for electricity in all countries and high emission factors of gCO2∙kWh−1 (Emk,S);
materials with lower density, such as glasswool or EPS, and lower embodied carbon (CE) per 1R∙m−2 are characterized by lower CPP values (from 0.1 to 4.1 years for glass wool, from 0.1 to 4.3 years for EPS);
XPS and PUR due to the high value of embodied Carbon (CE) are characterized by a higher CPP value (from 0.1 to 7.4 years for XPS and from 0.1 to 6.0 years for PUR);
CPP values depend to a large extent on the energy source used for space heating: for electricity they are the lowest (from 0.1 to 0.9 years), for biomass they are the highest (from 0.2 to 9.4 years);
the lowest CPP values are achieved by Cellulose insulation due to the lowest embodied carbon (CE) values.

3.2. CPP for Europe

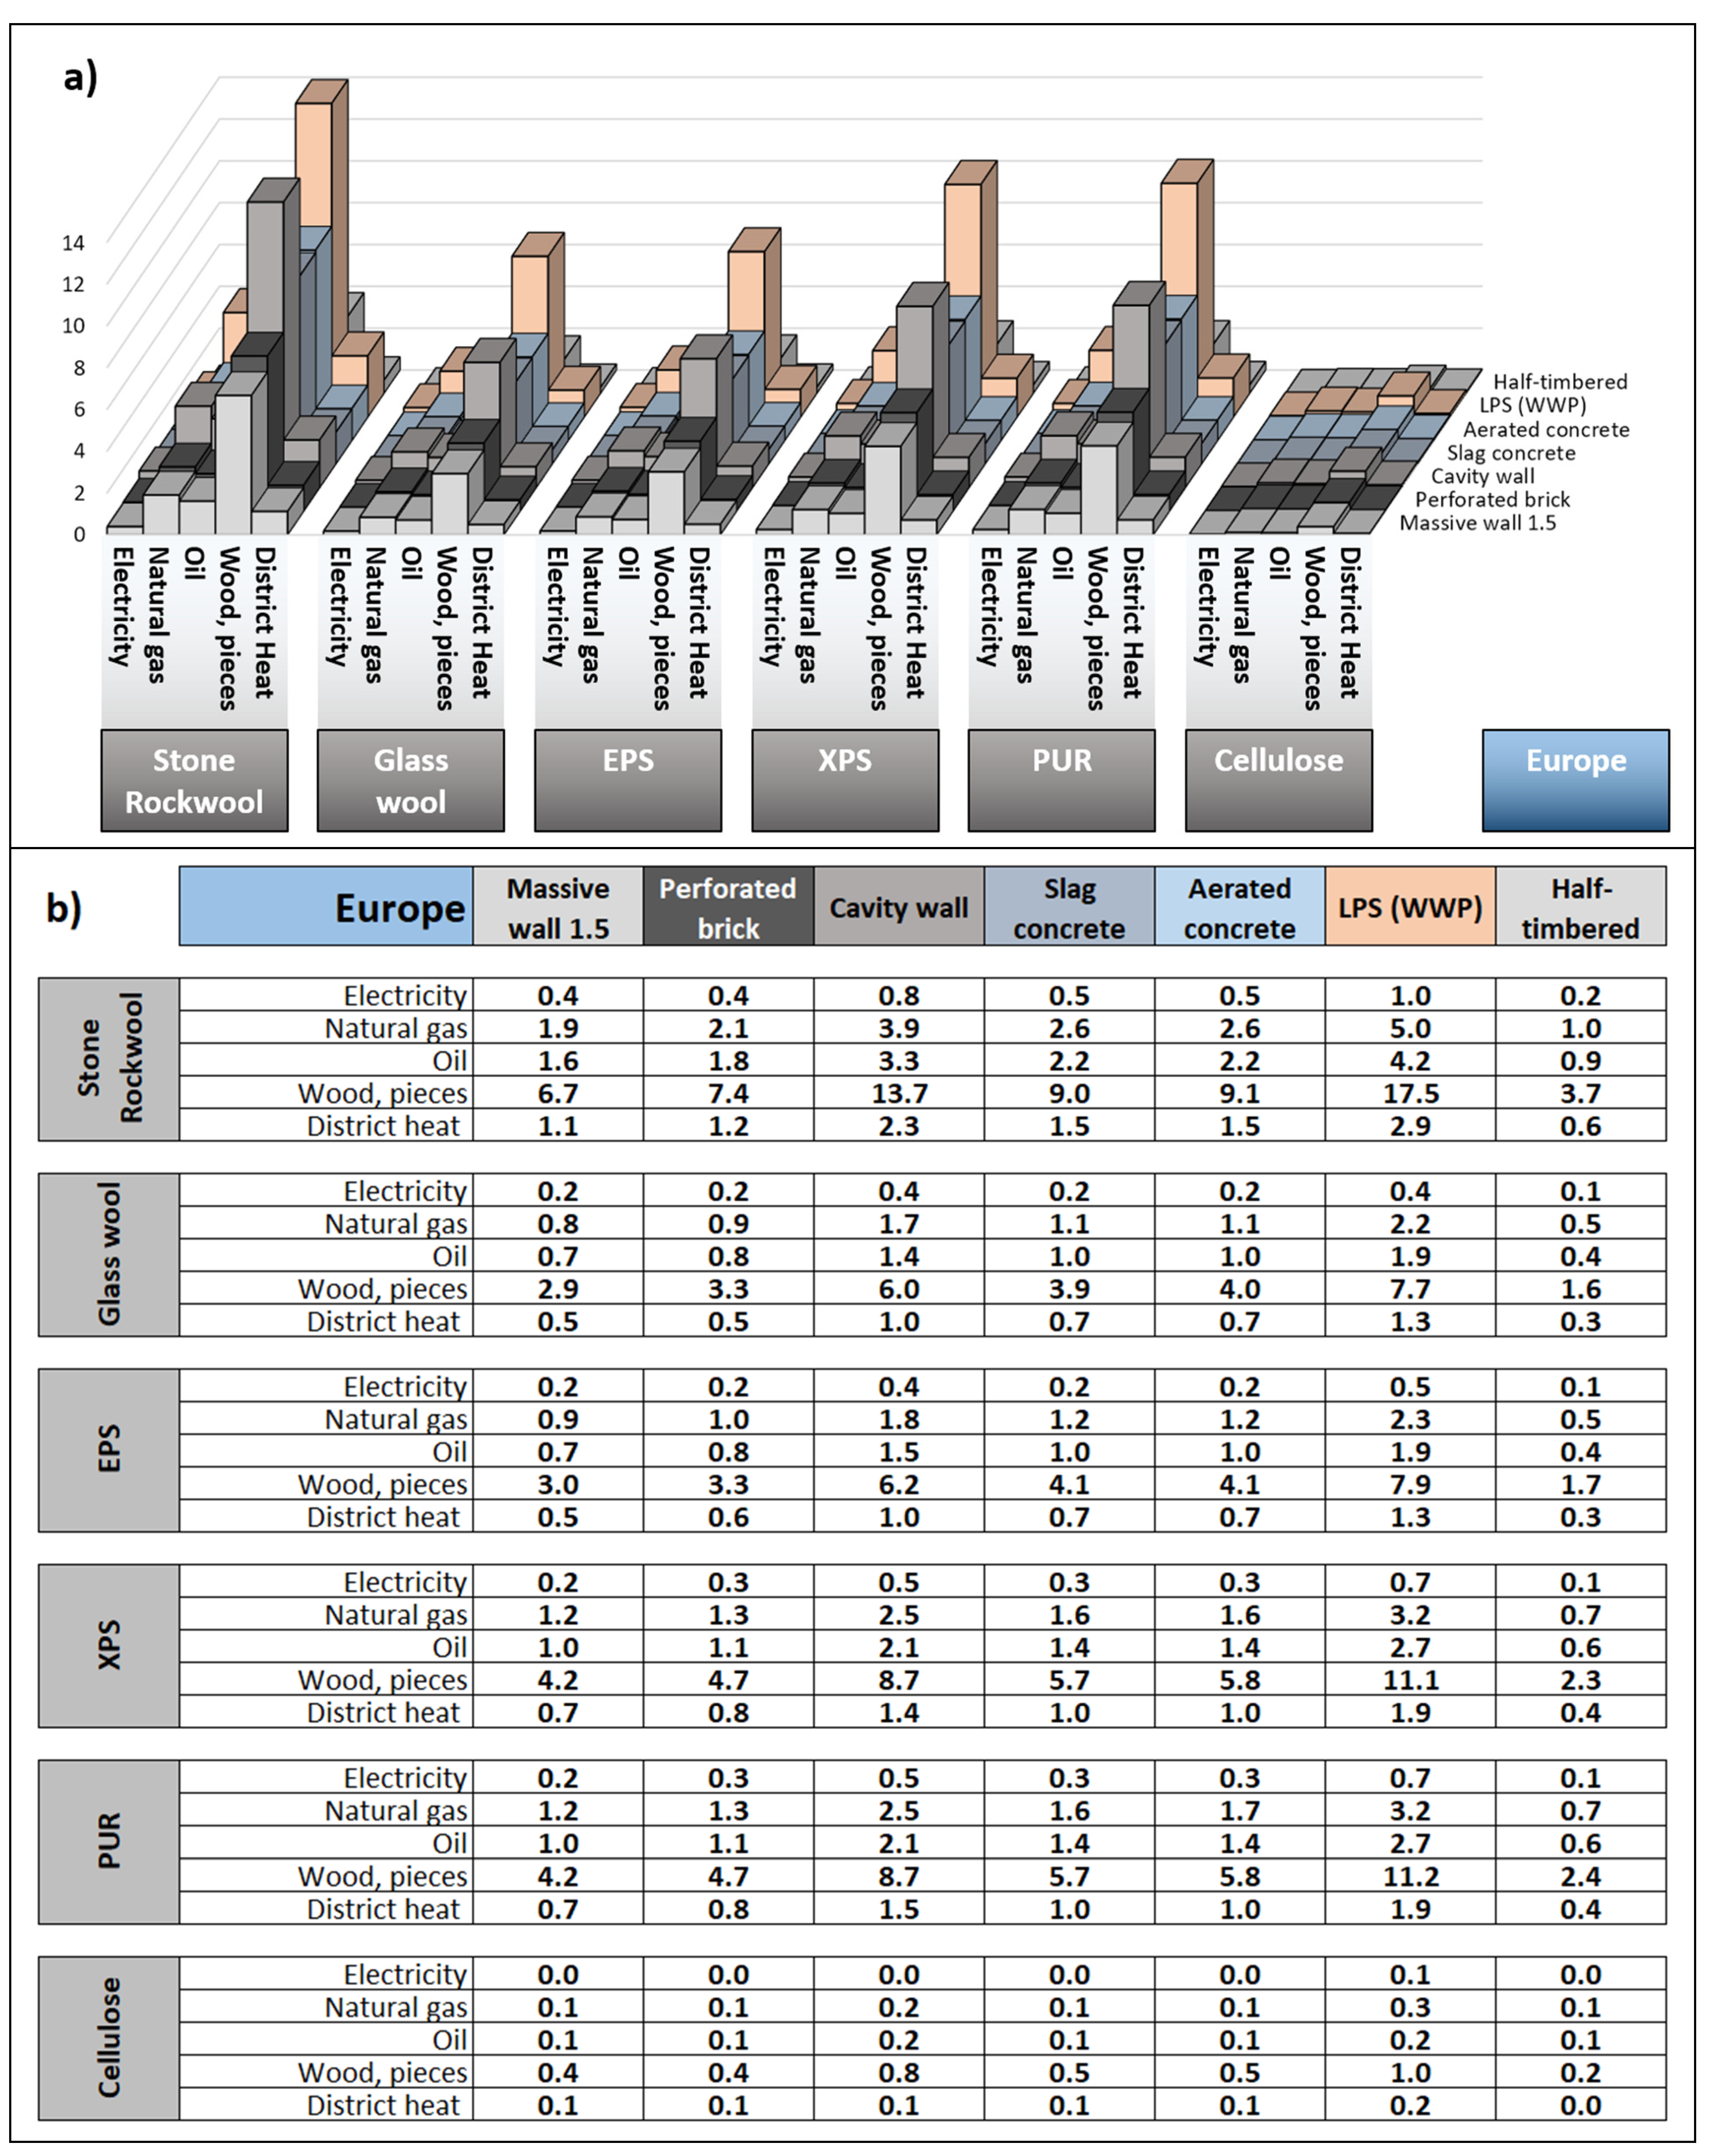
The results for Europe are shown in Figure 4a,b.
After averaging the data available from the EPDs available for the region of Europe, PEFn values for Europe, emission factors and climatic conditions for Brussels, the longest CPP is for stone/rockwool insulated walls (up to 17.5 years for LPS (WWP) walls and 13.7 for Cavity wall). As in the case of Europe (aver.), the highest CPP values can be found in the existing partitions with the greatest resistance, for spaces heated with biomass and for stone/rockwool insulation (up to 17.5 years), XPS (up to 11.1 years) and PUR (up to 11.2 years). The smallest CPP values can be found in the existing partitions with the smallest resistance, for spaces heated with electricity and for cellulose insulation (less than 0.1 year), glass wool (0.2 year) and EPS (0.2 year). Depending on the energy source, the average CPP ranges from 0.3 for electricity to 5.1 for biomass, and depending on the type of insulation, it ranges from 0.2 for cellulose to 2.3.4 for stone/rockwool, as shown in Table 7a (CPP for various energy sources, regardless of the insulation method) and Table 7b (CPP for different insulation materials, regardless of heating method).

3.3. PCC for Poland

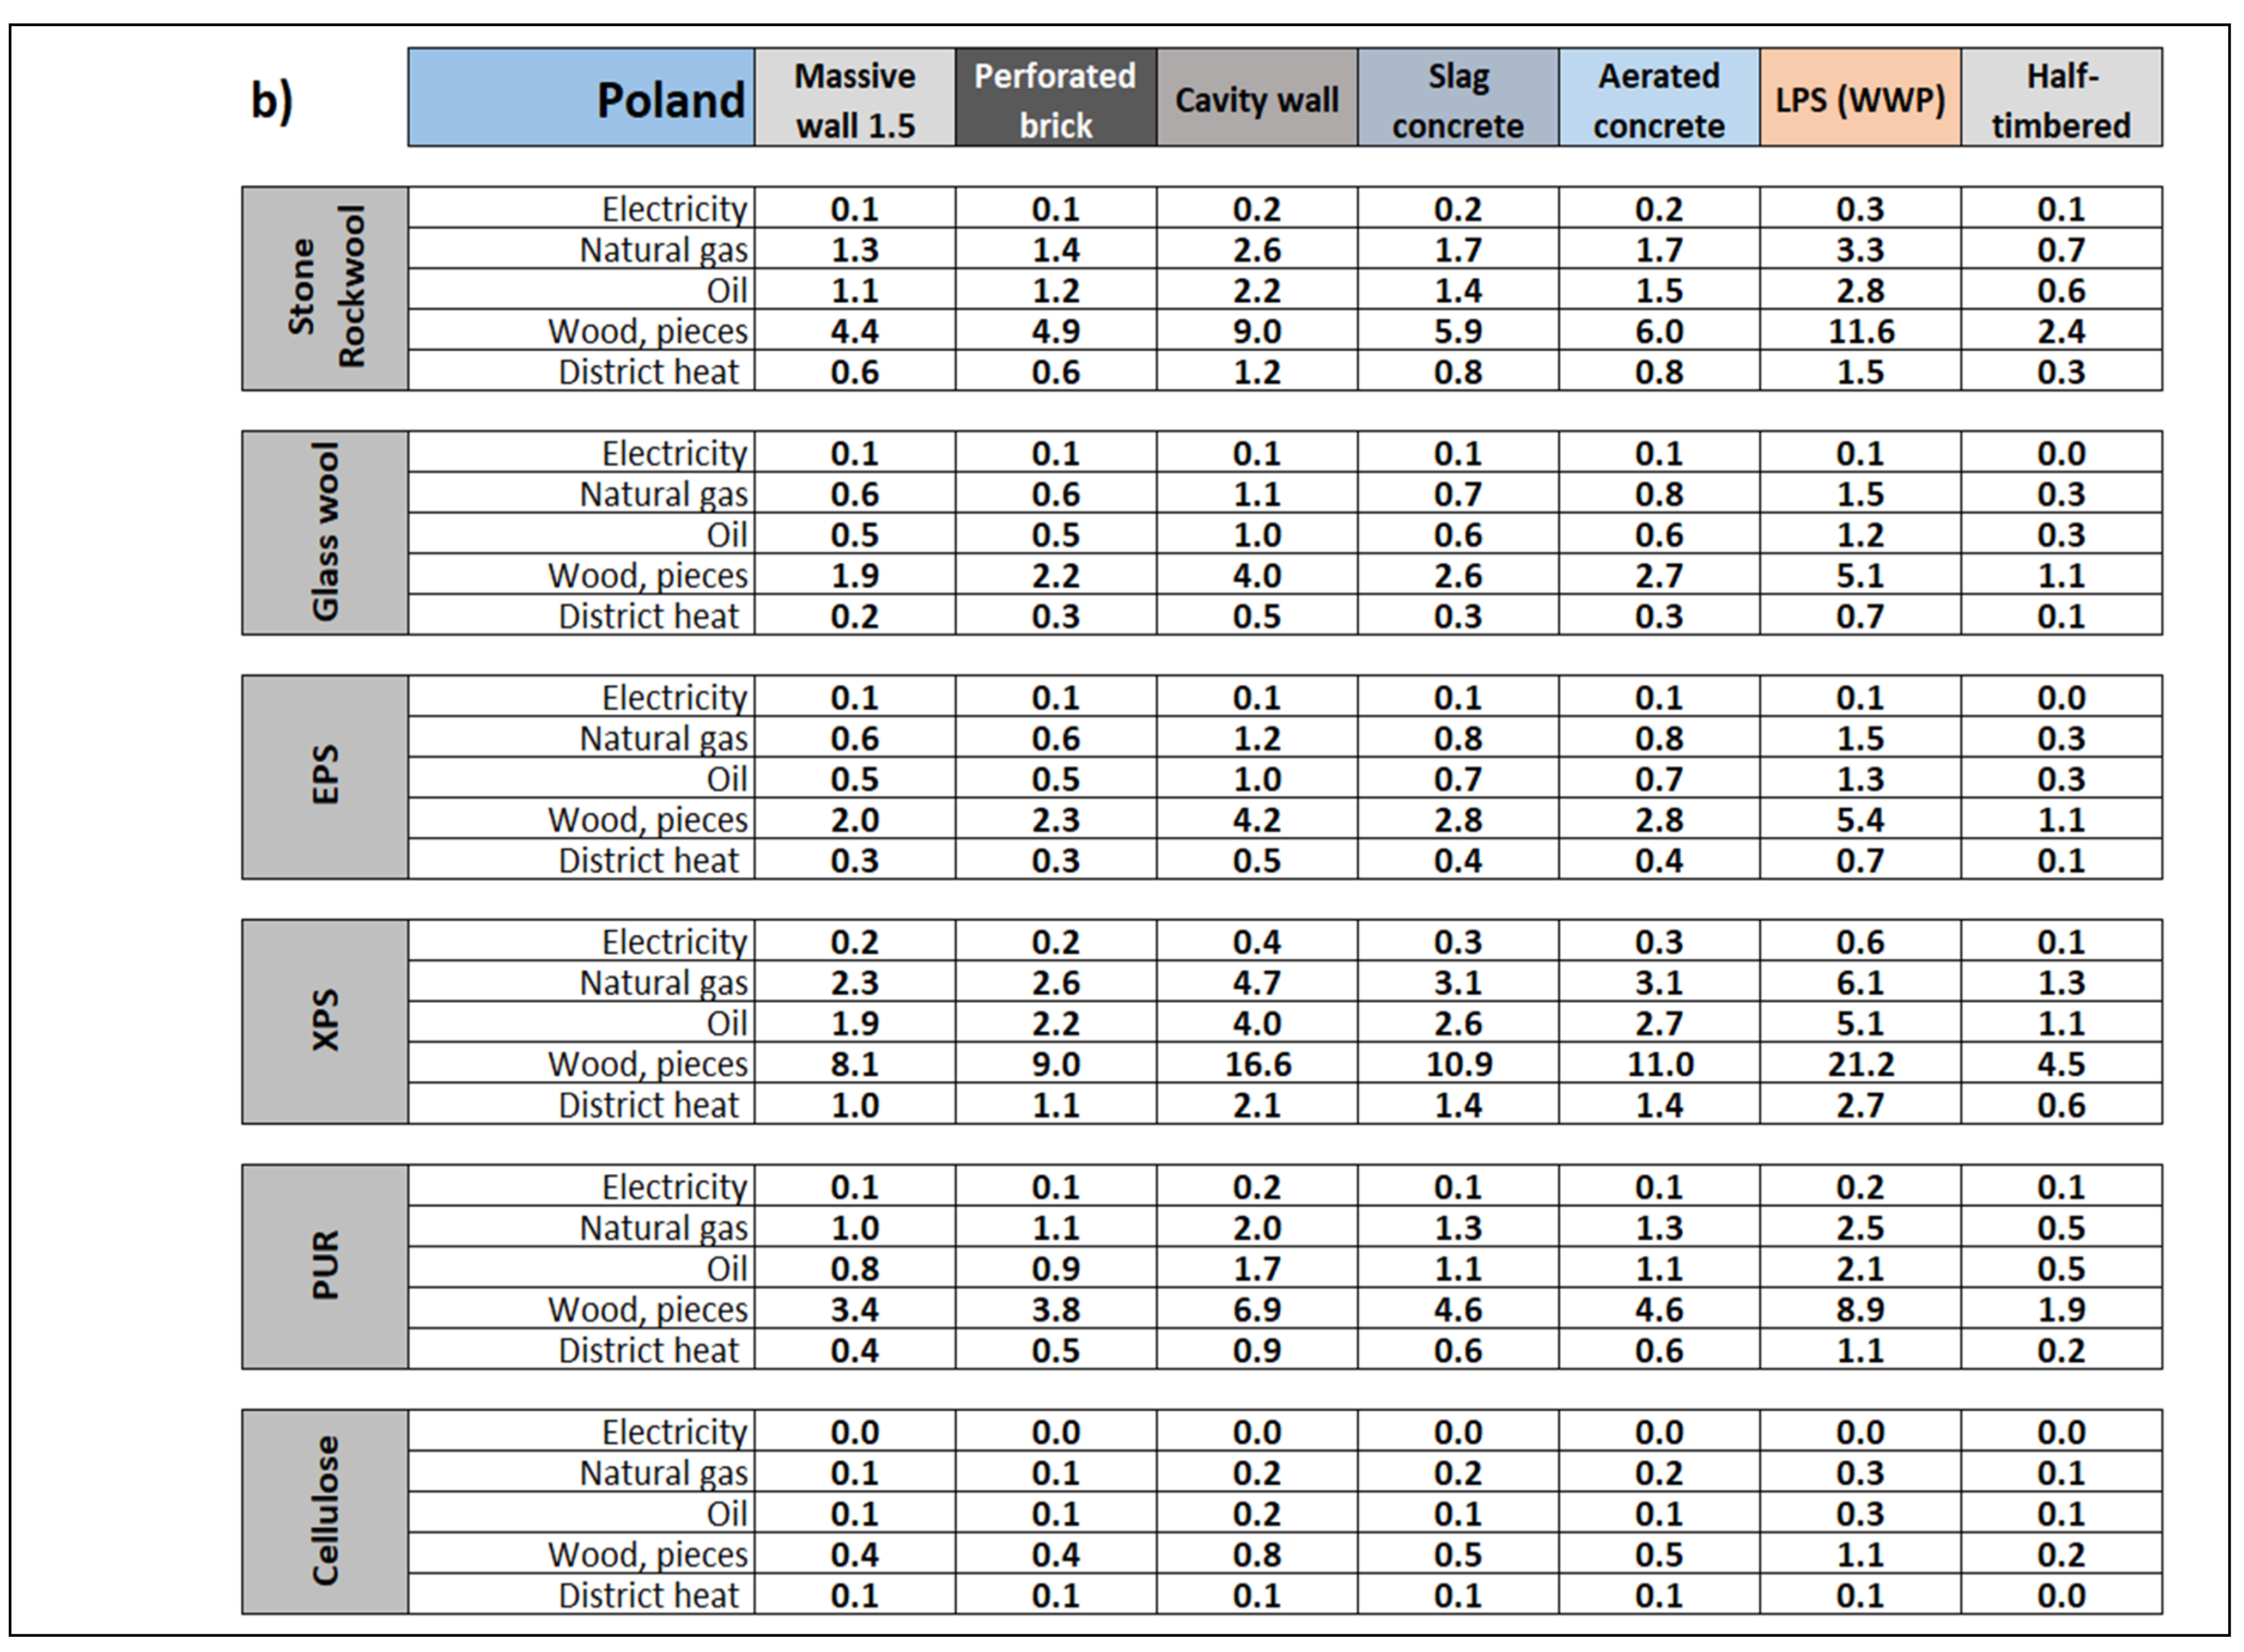
The results for Poland are presented in Figure 5a,b.
After averaging the data available from the EPD declarations available for Poland, PEFn values for Poland, emission factors and climatic conditions for Warsaw, we found that the highest CPP values occur for existing walls with the highest resistance, for spaces heated with biomass and for XPS insulation (up to 21.1 years), stone/rockwool (up to 11.6 years) and PUR (up to 8.9 years). The lowest CPP values occur for existing partitions with the lowest resistance, for spaces heated with electricity and for cellulose (less than 0.1 year), glass wool (0.1 year) and EPS (0.1 year). Depending on the energy source, the average CPP ranges from 0.1 for electricity to 4.9 for biomass and, depending on the type of insulation, it ranges from 0.2 for cellulose to 3.9 for XPS, the results of which are shown in Table 8a (CPP for various energy sources, regardless of the insulation method) and Table 8b (CPP for different insulation materials, regardless of the method of heating).

3.4. CPP for Germany

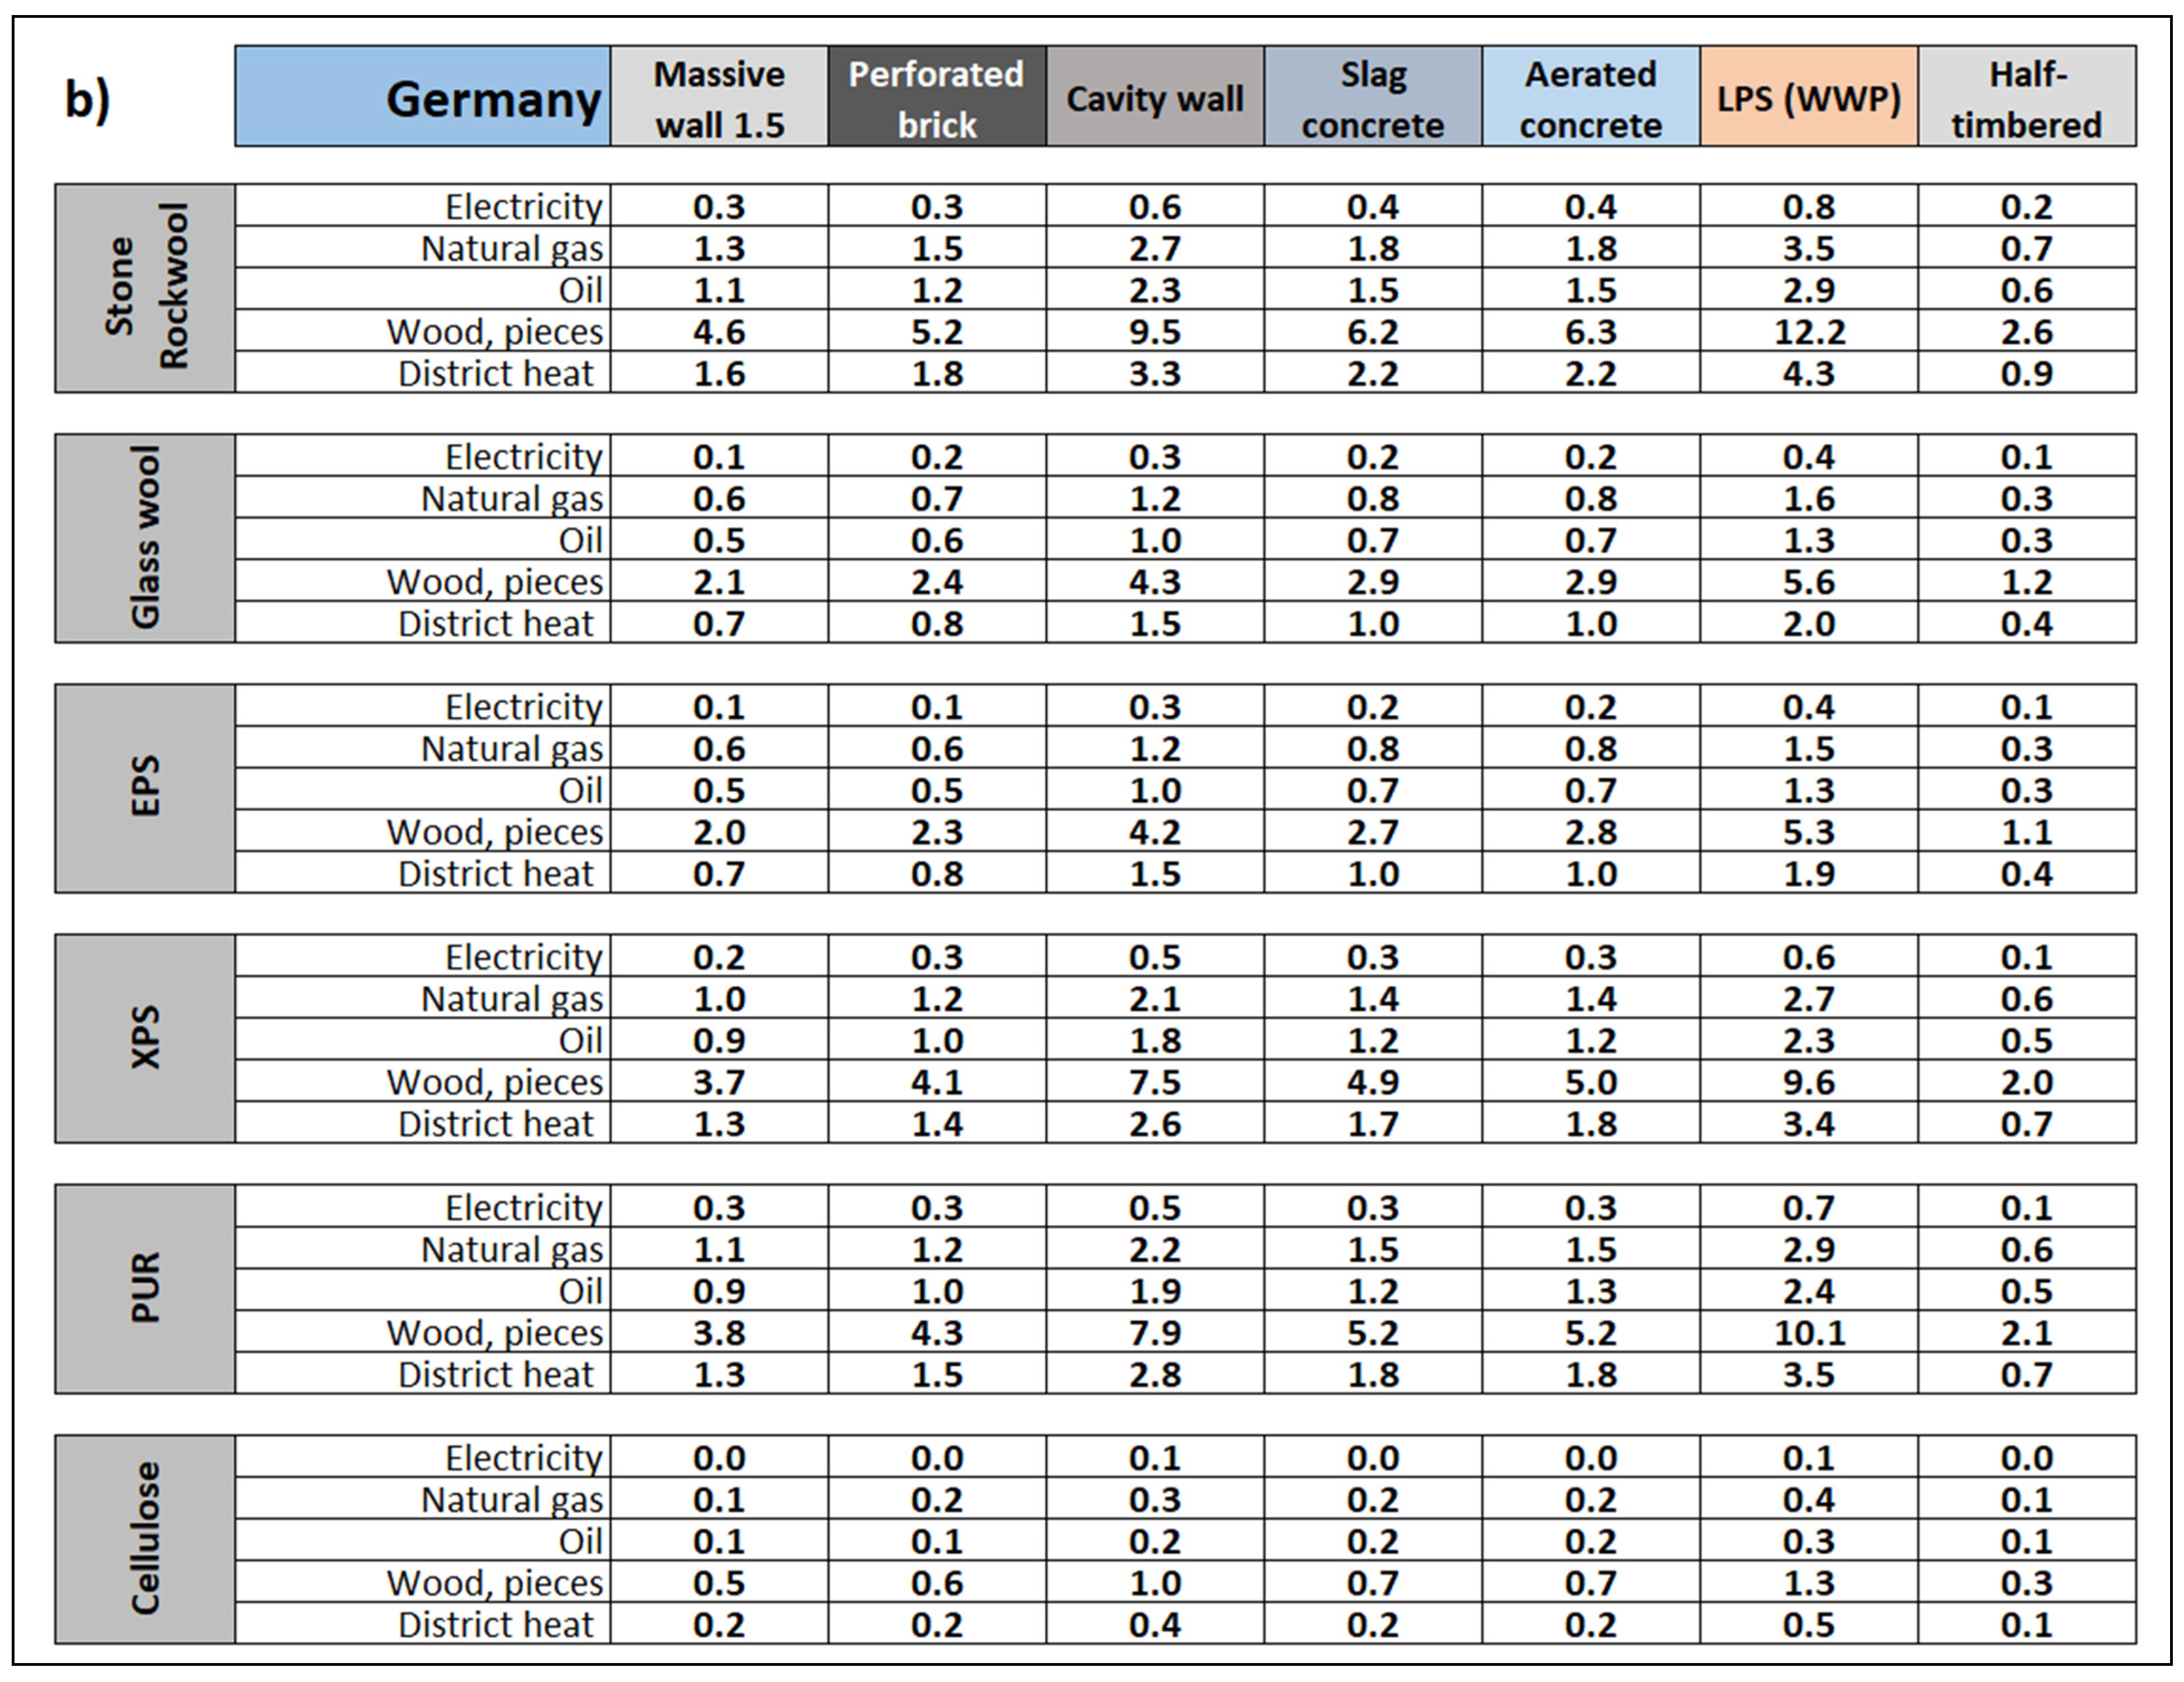
The results for Germany are presented in Figure 6a,b.
After averaging the data available from the EPDs available for Germany, the PEFn values for Germany, emission factors and climatic conditions for Berlin, the highest CPP values are for existing walls with the highest resistance, for spaces heated with biomass and for Stone/Rockwool insulation (up to 12.2 years), PUR (up to 10.1 years) and XPS (up to 9.6 years). The lowest CPP values are for the existing walls with the least resistance, for spaces heated with electricity and for cellulose (less than 0.1 year), glass wool (0.1 year) and EPS (0.1 year). Depending on the energy source, the average CPP ranges from 0.3 for electricity to 4.0 for biomass, and depending on the type of insulation, it ranges from 0.3 for cellulose to 2.6 for stone/rockwool, as shown in Table 9a (CPP for various energy sources, regardless of the insulation method) and Table 9b (CPP for different insulation materials, regardless of heating method).

3.5. CPP for Czech Republic

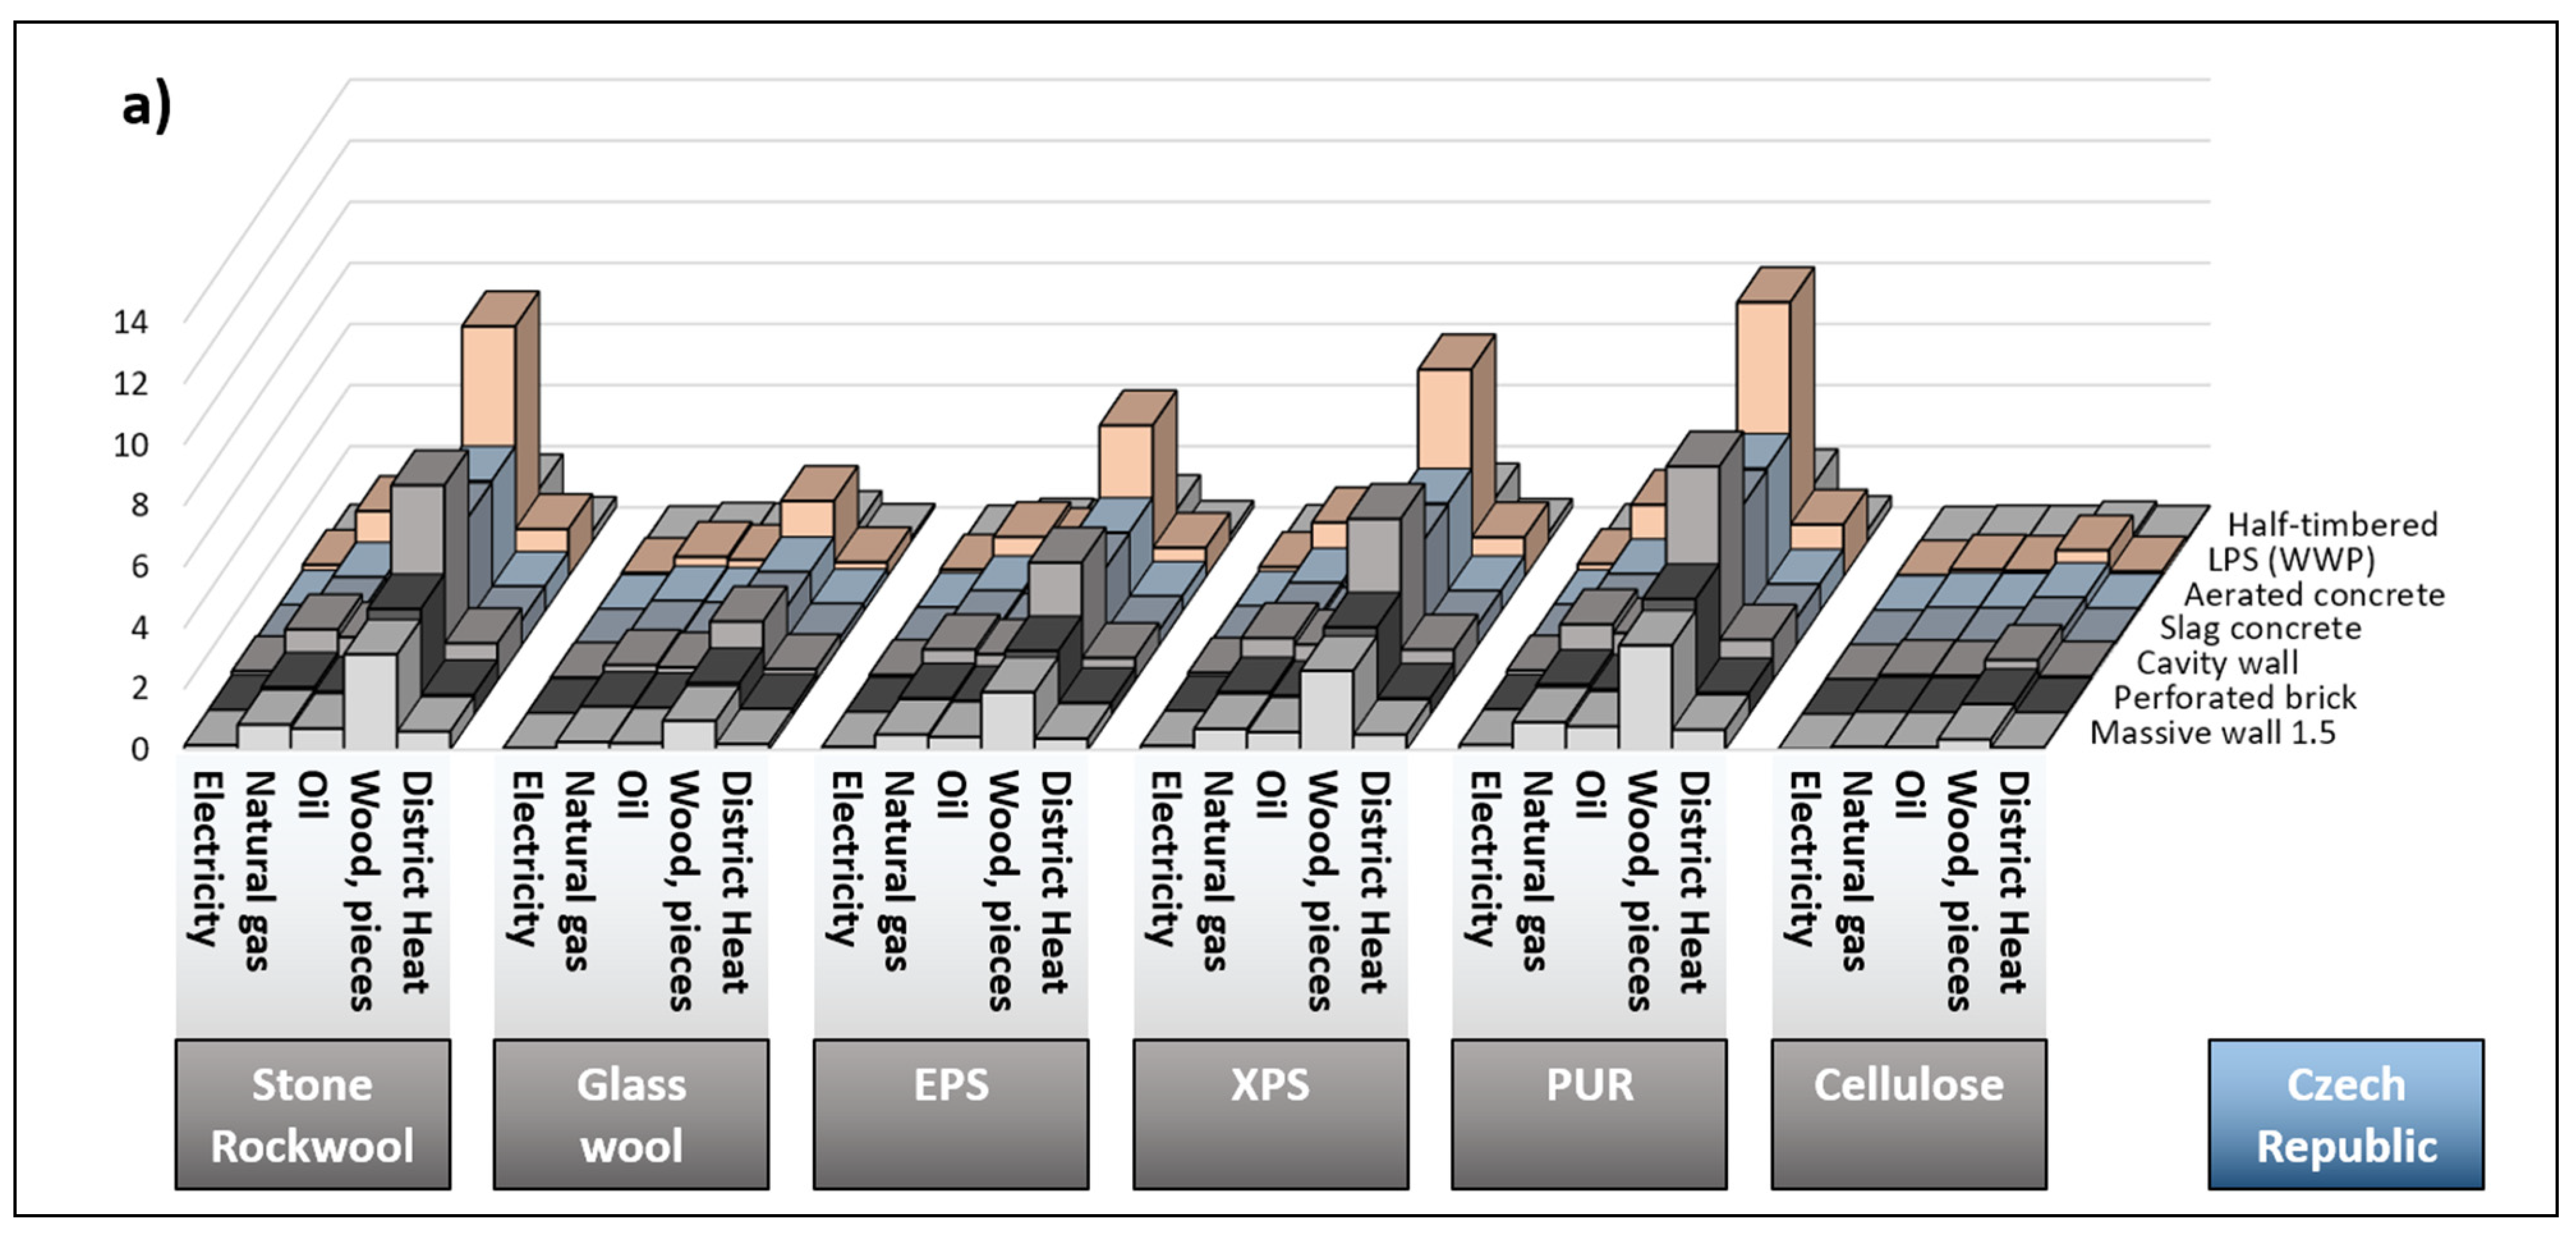
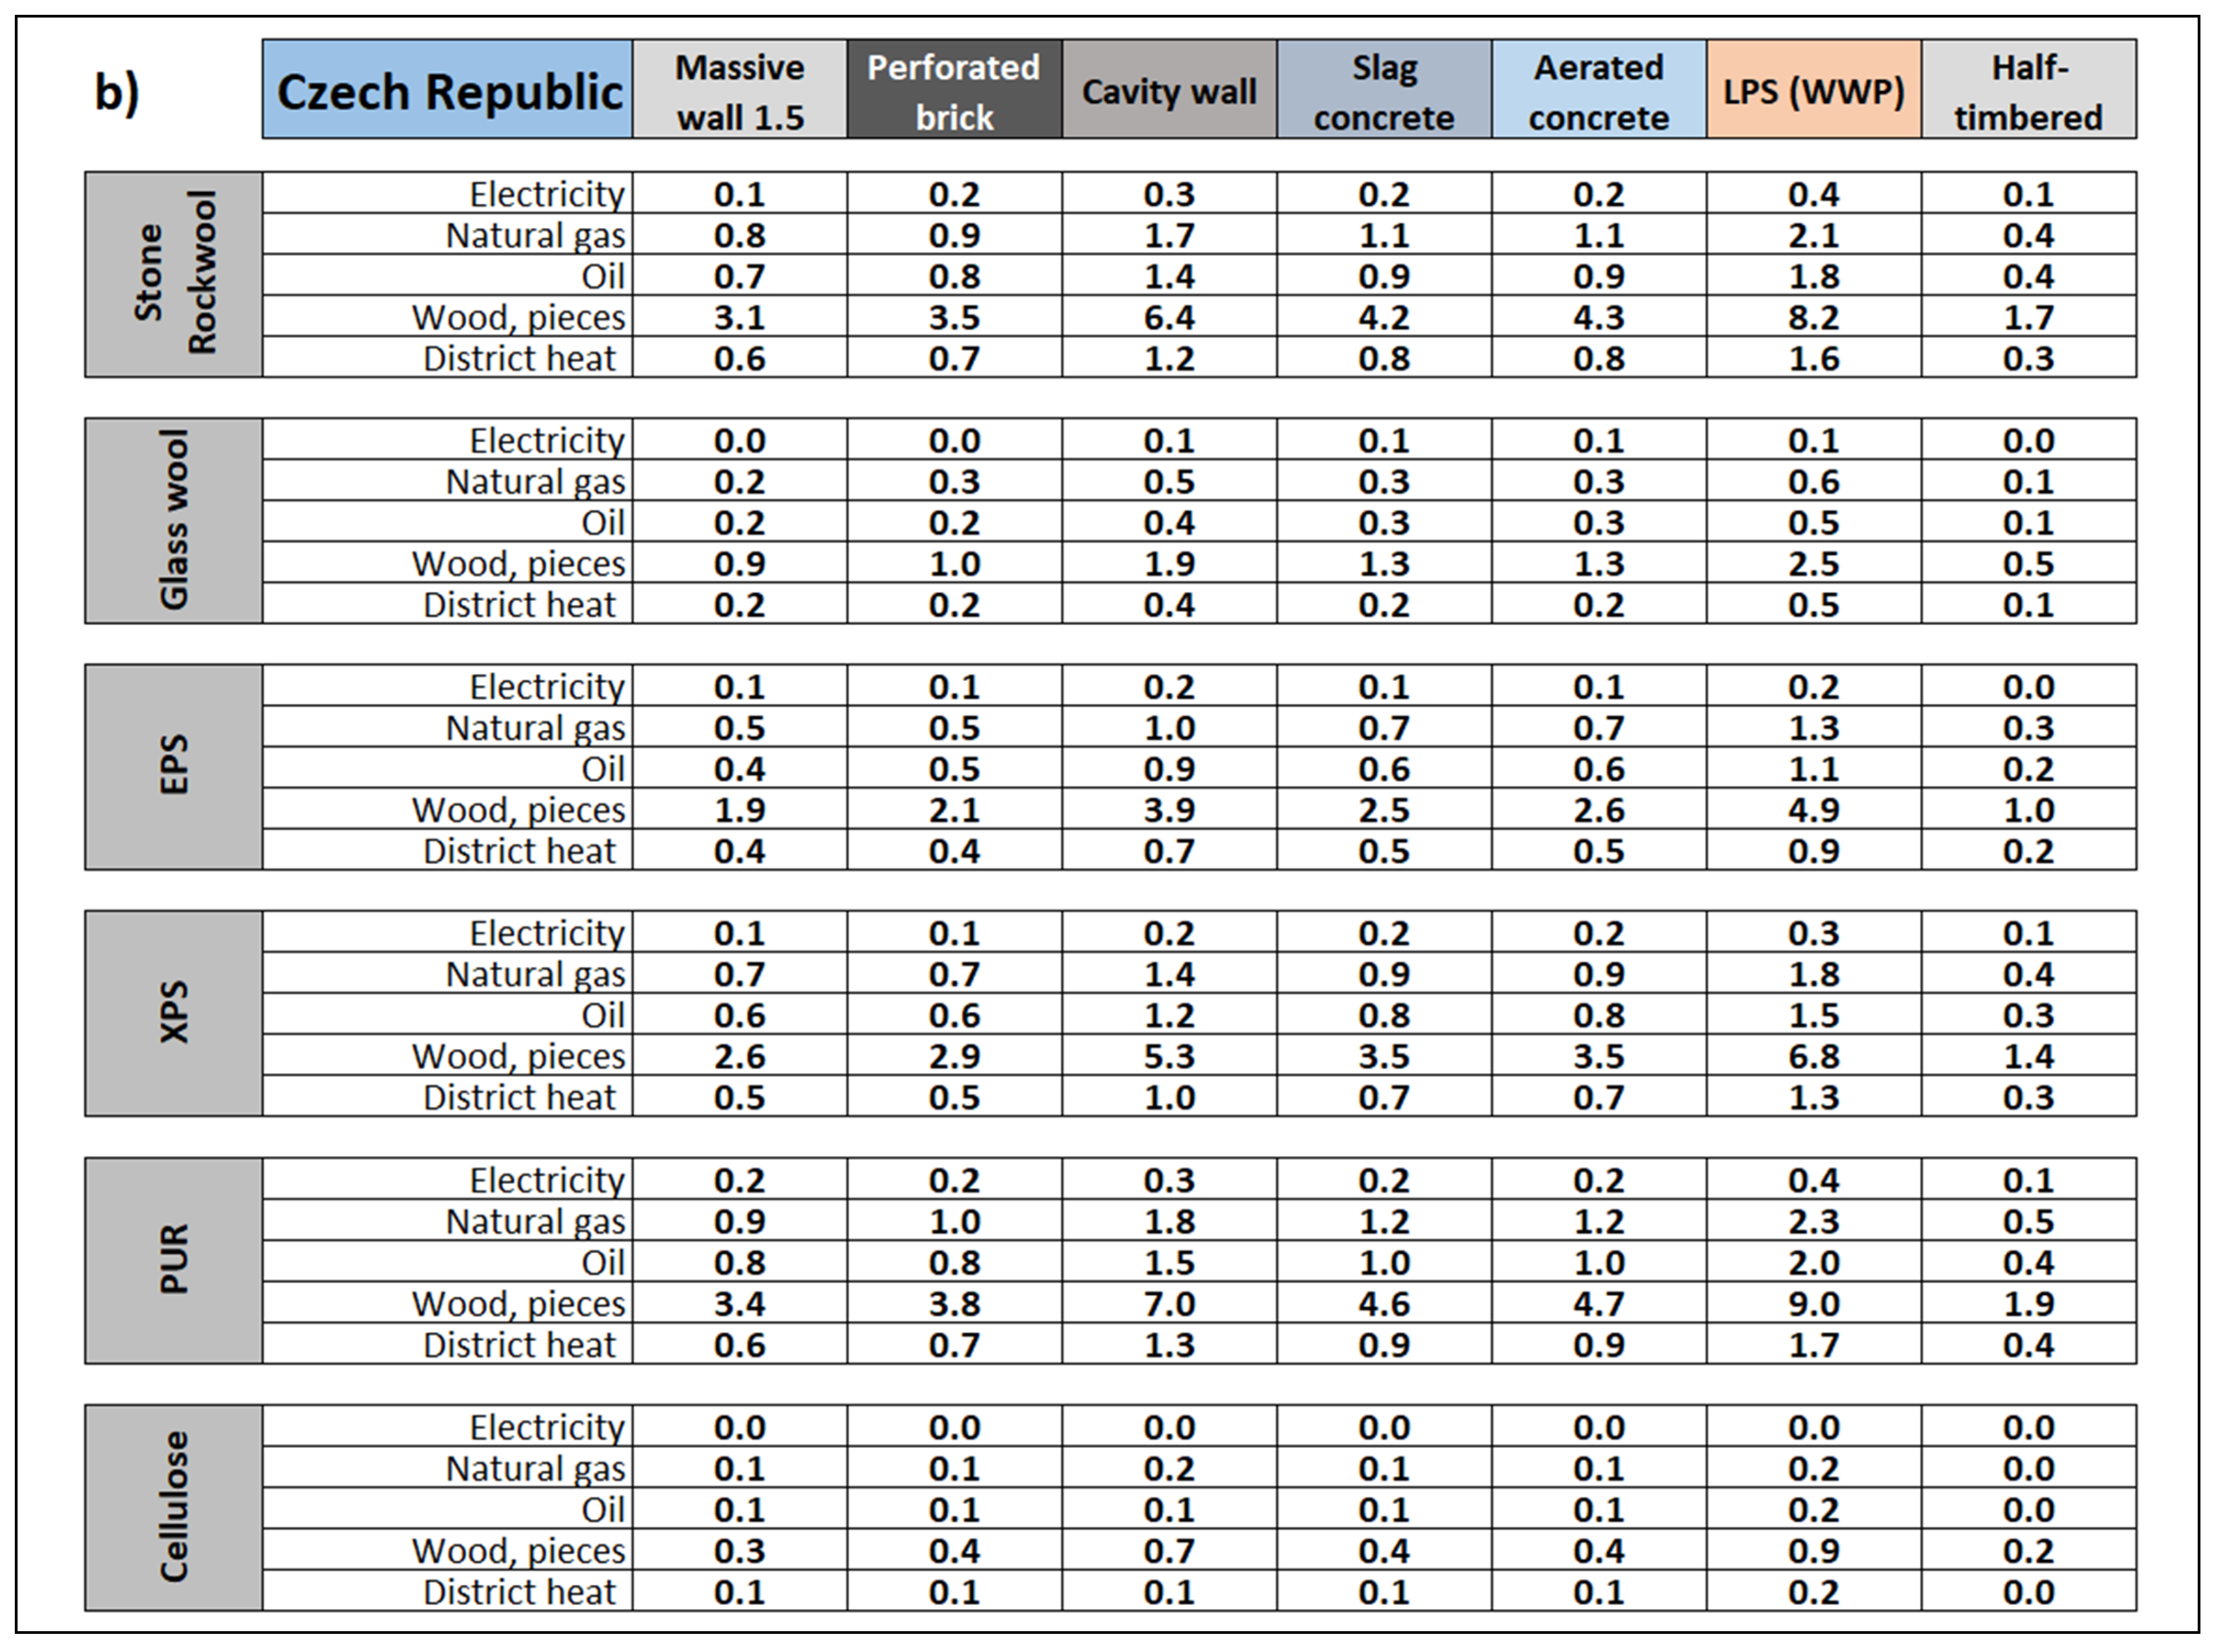
The results for the Czech Republic are presented in Figure 7a,b.
After averaging the data available from the EPDs available for the Czech Republic, PEFn values, emission factors and climatic conditions for Prague, the highest CPP values were found for the existing walls with the highest resistance, for spaces heated with biomass and for PUR insulation (up to 9.0 years), stone/rockwool (up to 8.2 years) and XPS (up to 6.8 years). The lowest CPP values are found for existing walls with the least resistance, for spaces heated with electricity and for cellulose, glass wool and EPS insulation (less than 0.1 year). Depending on the energy source, the average CPP ranges from 0.1 for electricity to 2.9 for biomass and, depending on the type of insulation, it ranges from 0.2 for cellulose to 1.7 for PUR, a phenomenon which is shown in Table 10a (CPP for various energy sources, regardless of the insulation method) and Table 10b (CPP for different insulation materials, regardless of the method of heating).

3.6. CPP for Austria

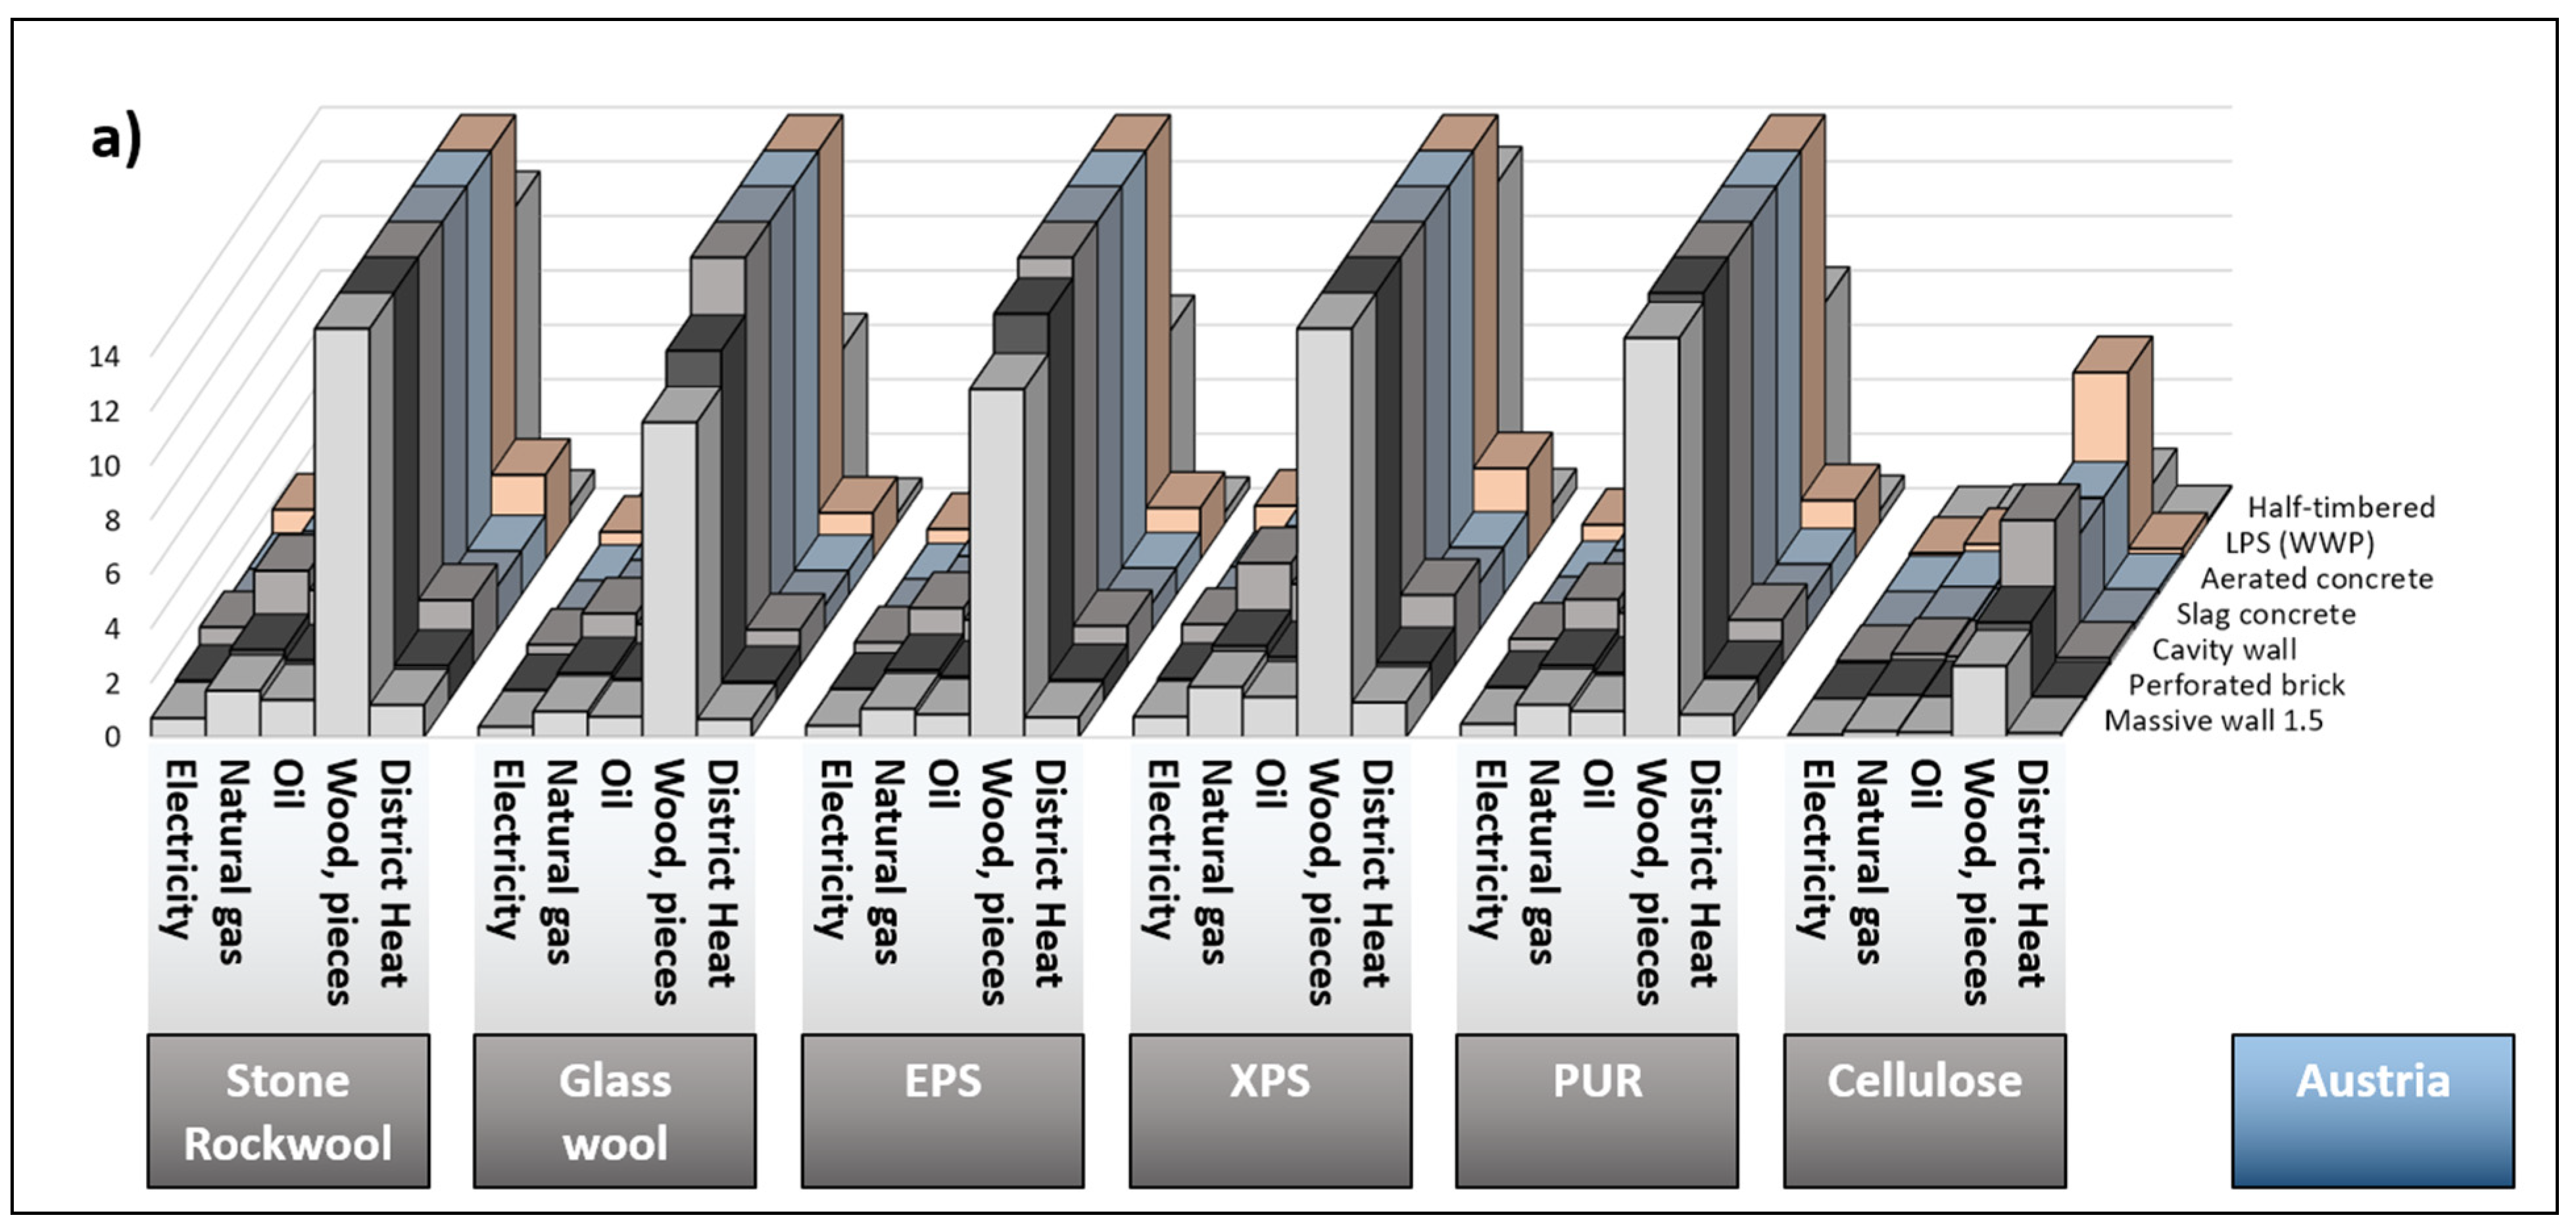
The results for Austria are shown in Figure 8a,b.
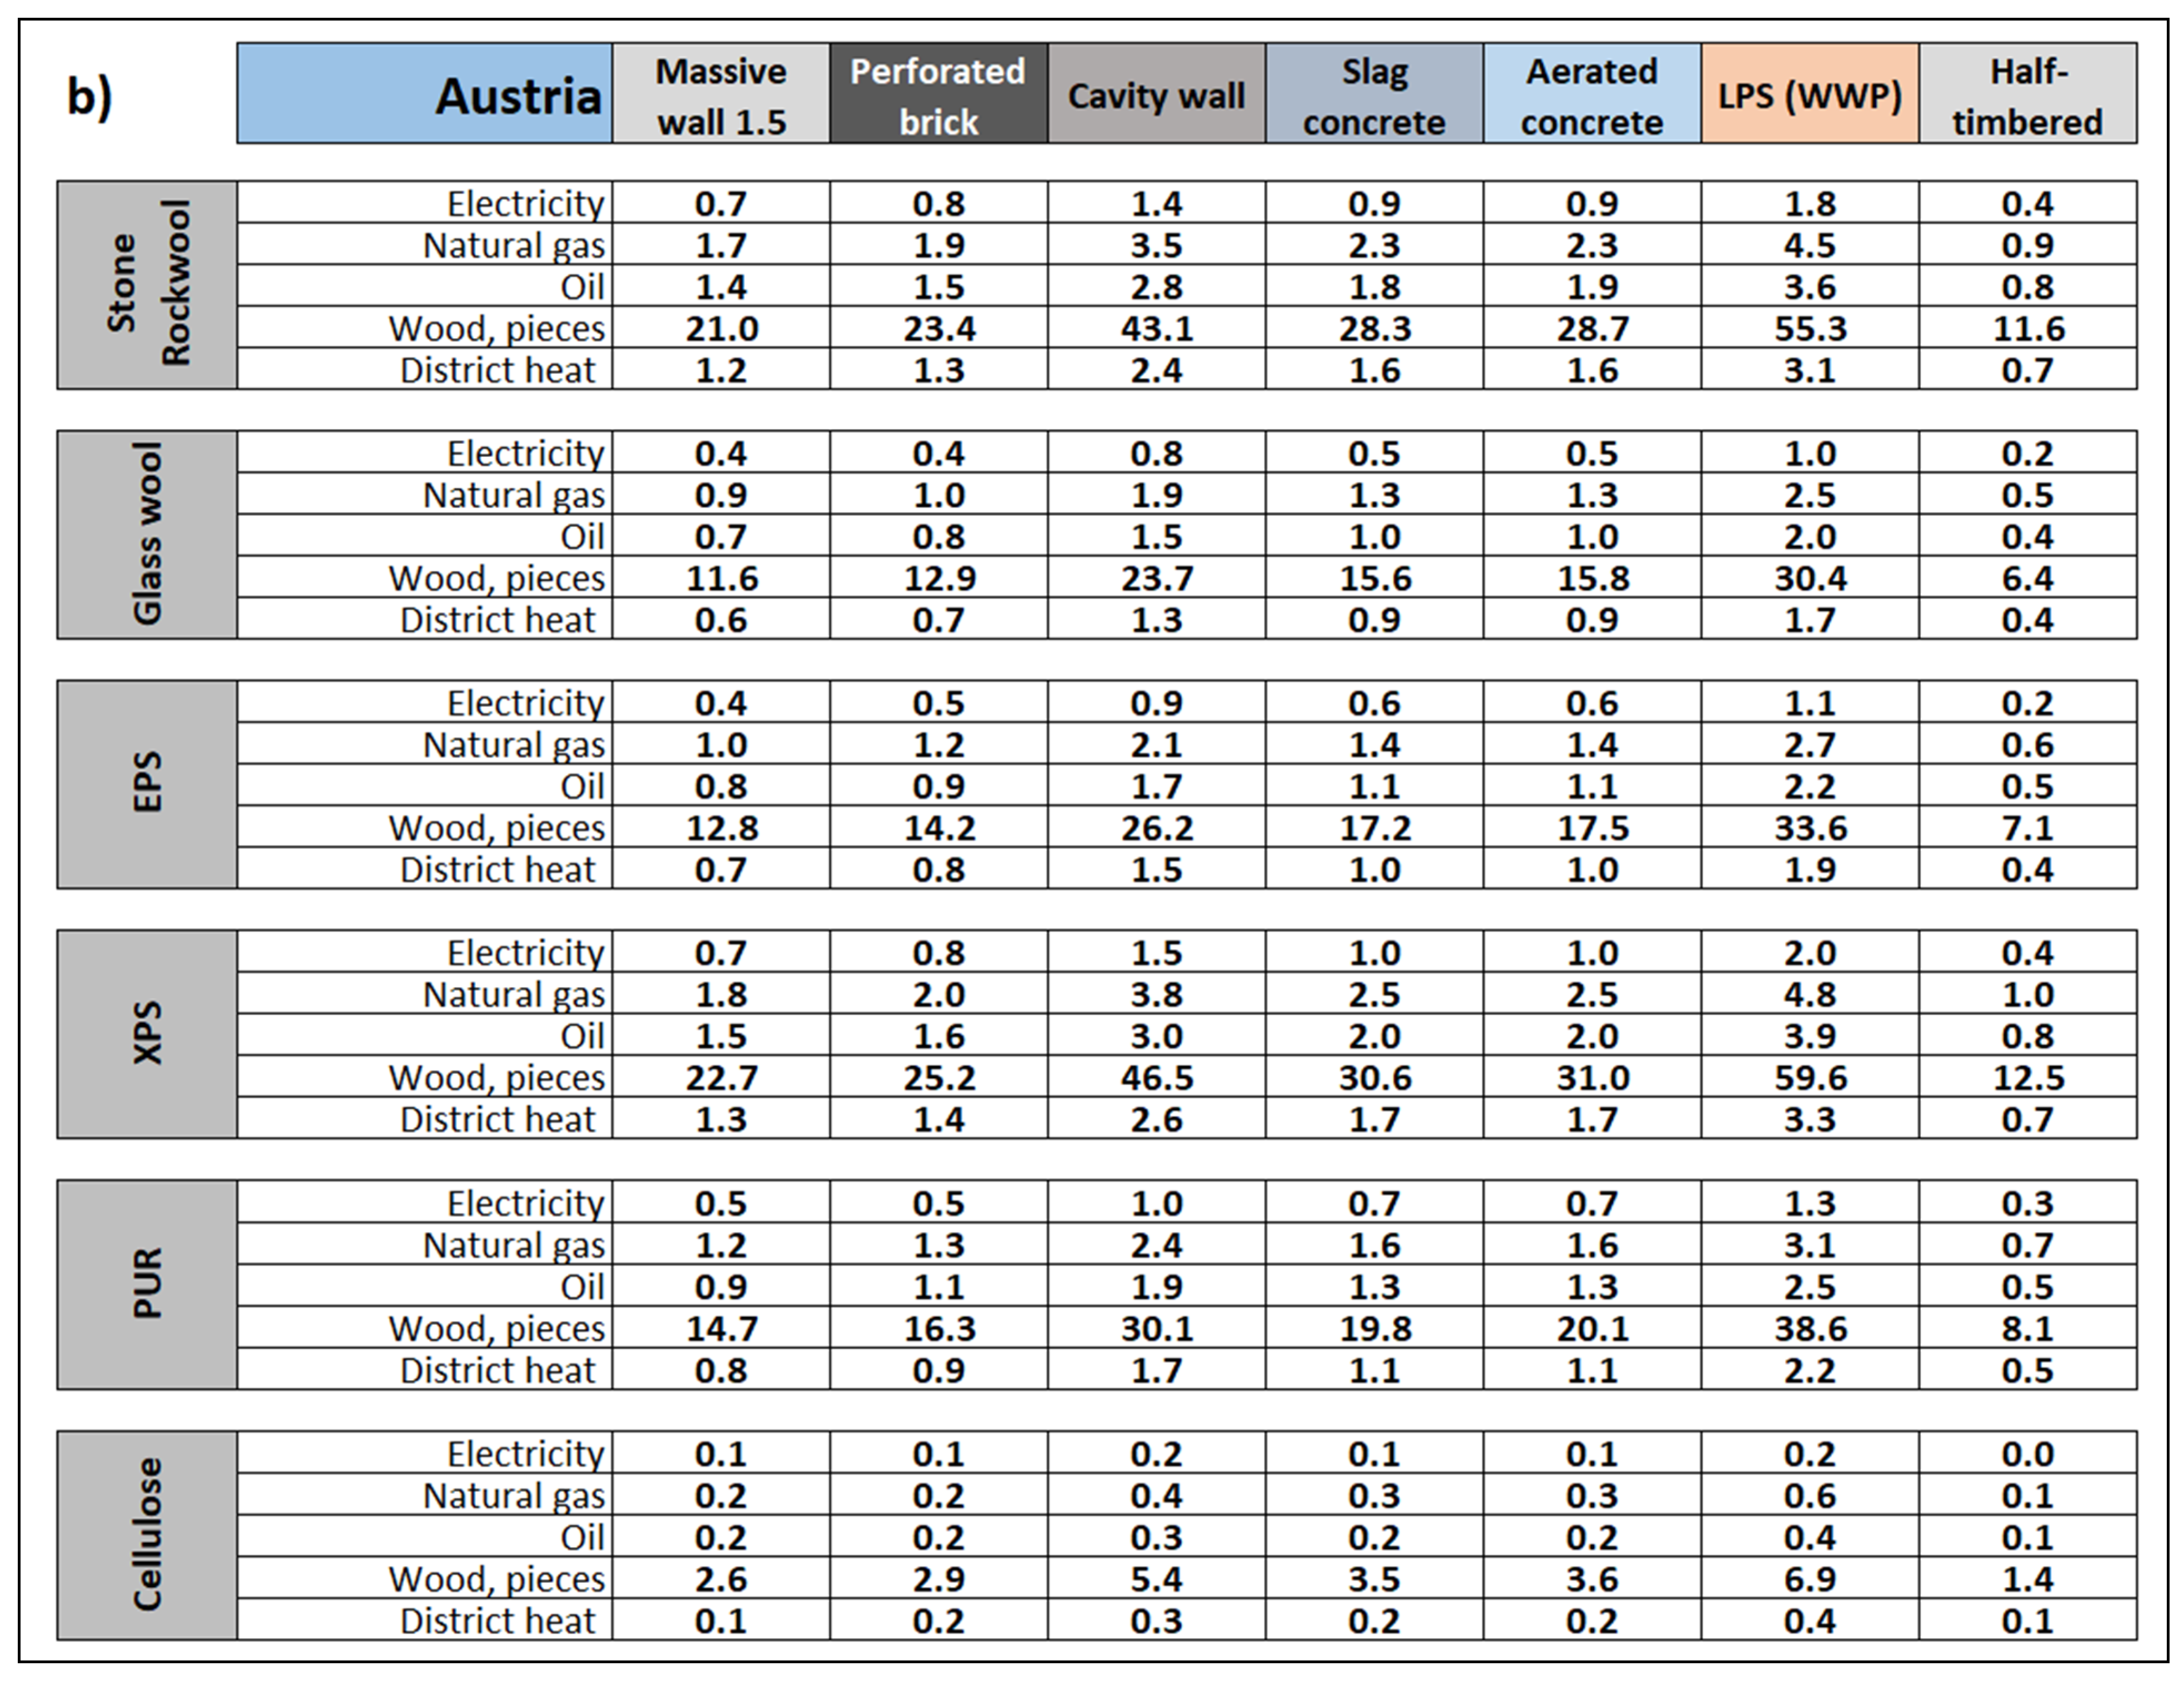
After averaging the data available from the EPDs available for Austria, the PEFn values, the emission factors and the climatic conditions for Vienna, the highest CPP values were found for existing walls with the greatest resistance, for spaces heated with biomass and for XPS insulation (up to 59.6 years), stone/rockwool (up to 55.3 years) and PUR (up to 38.6 years). Such high CPP values for biomass heating result from the very low PEFn value in Austria [59]. The lowest CPP values are observed in existing walls with the least resistance, for spaces heated with electricity and for Cellulose (0.1 year), glass wool and EPS (0.4 year). Depending on the energy source, the average CPP ranges from 0.7 for electricity to 20.4 for biomass, and depending on the type of insulation, it ranges from 0.9 for cellulose to 8.0 for XPS, something which is shown in Table 11a (CPP for various energy sources, regardless of the insulation method) and Table 11b (CPP for different insulation materials, regardless of the method of heating). The higher CPP values for various insulation materials are due to the higher embodied carbon (CE) values resulting from the EPD declaration for materials available in Austria.

3.7. CPP for Finland

The results for Finland are presented in Figure 9a,b.
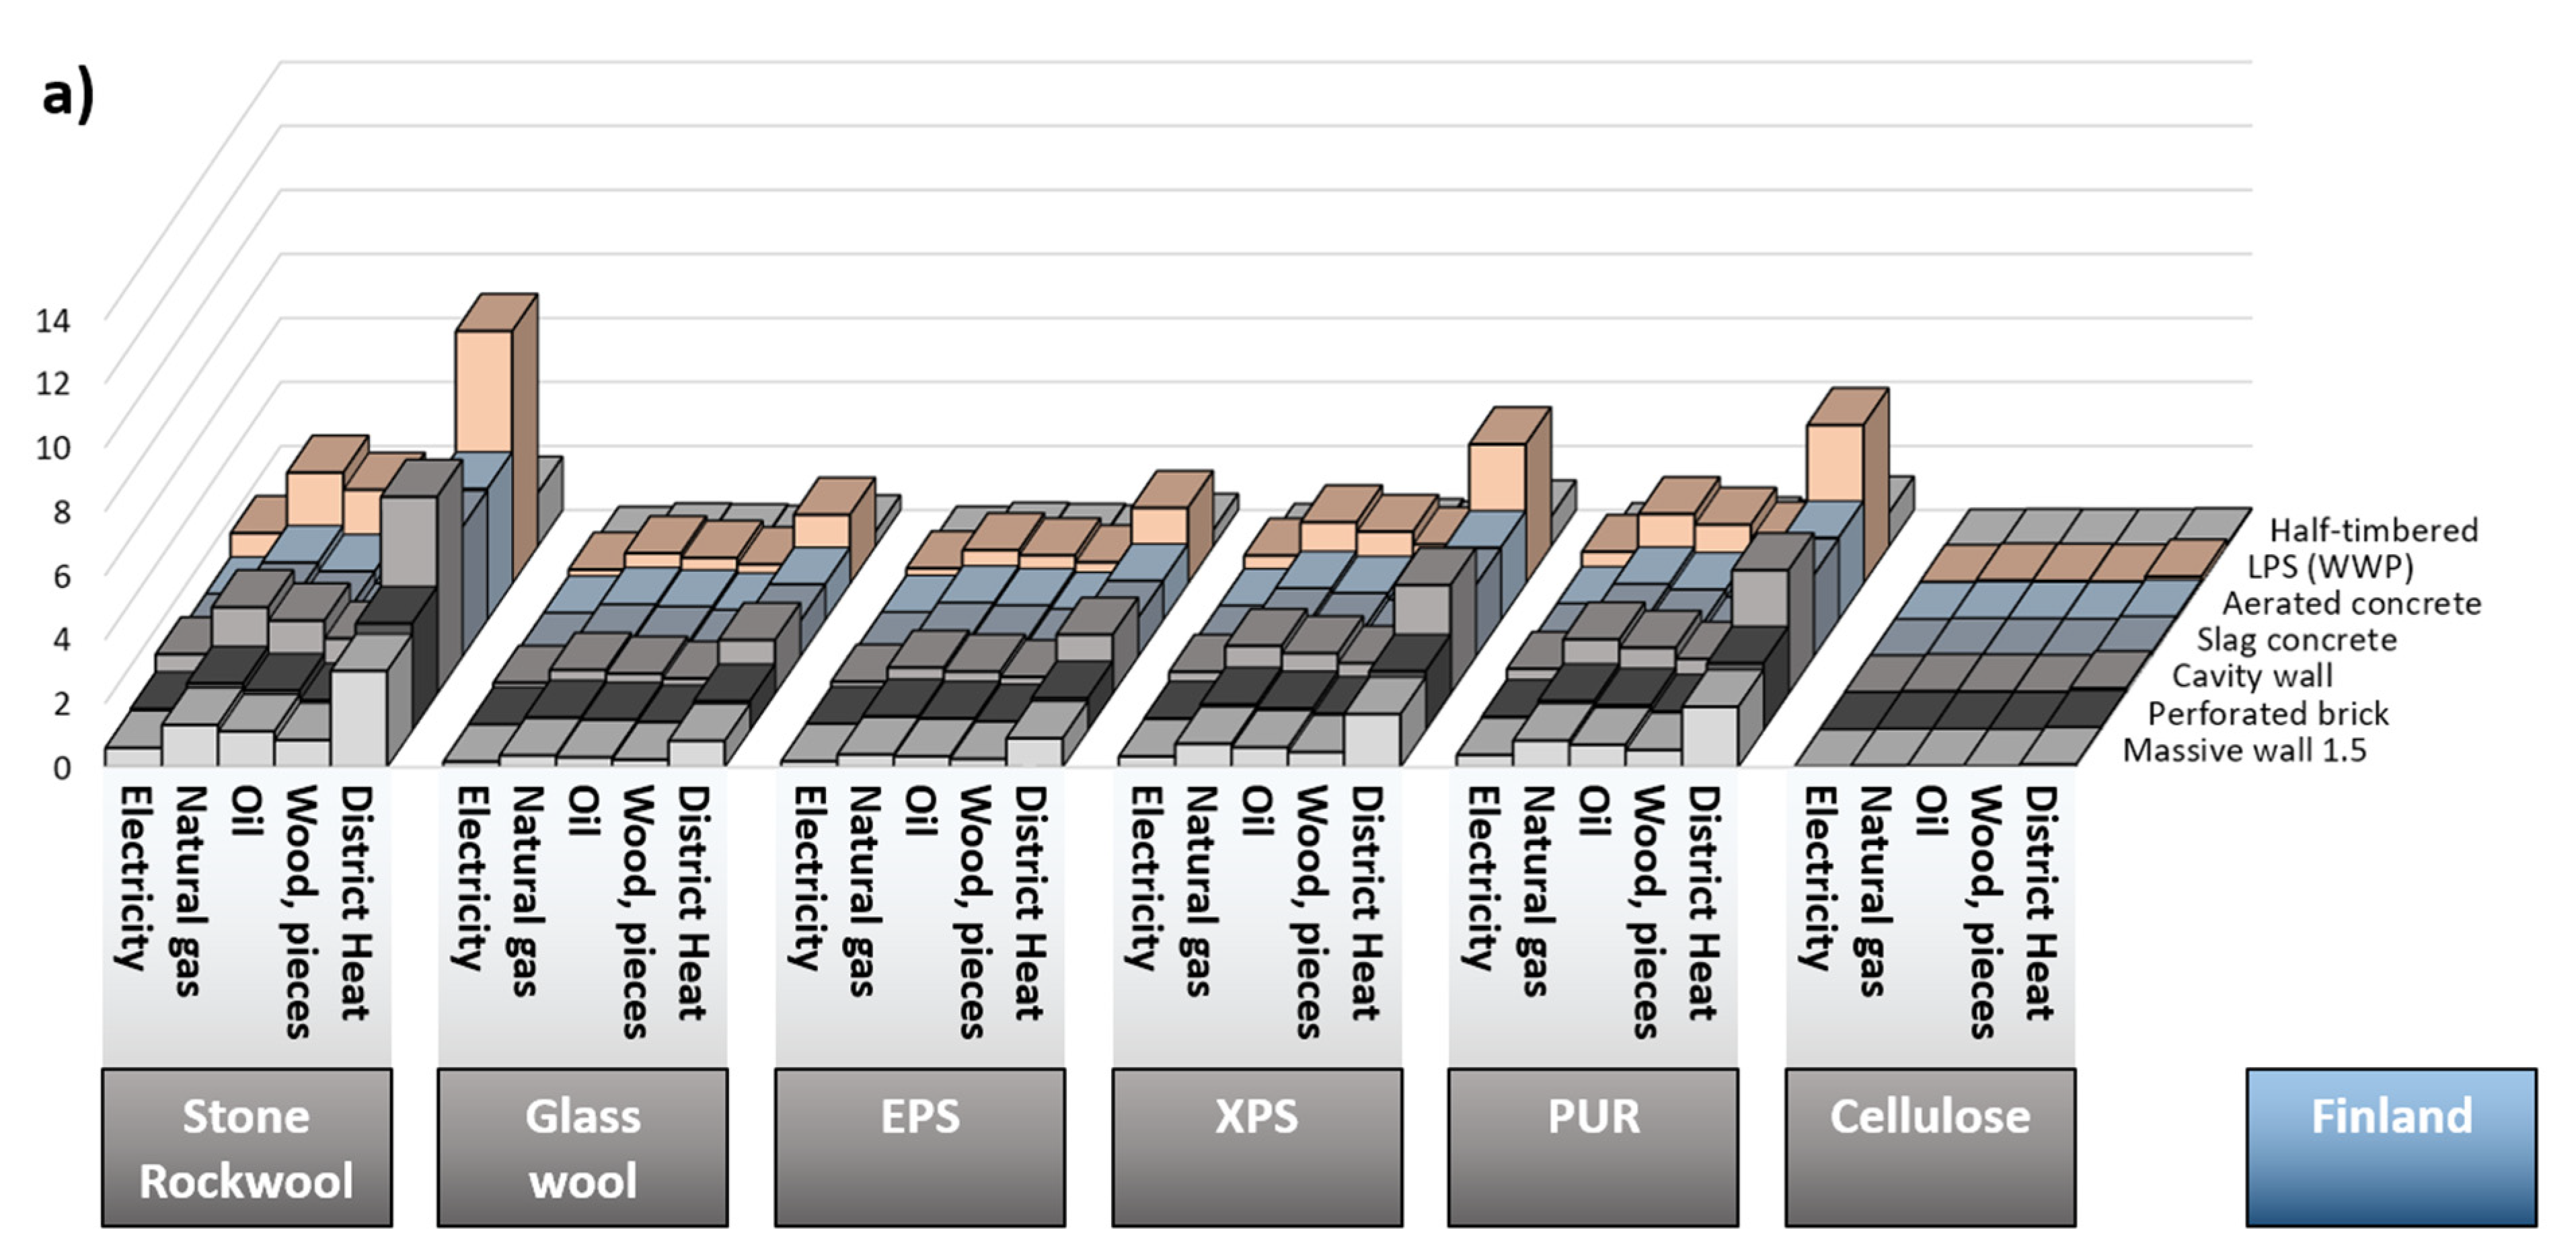
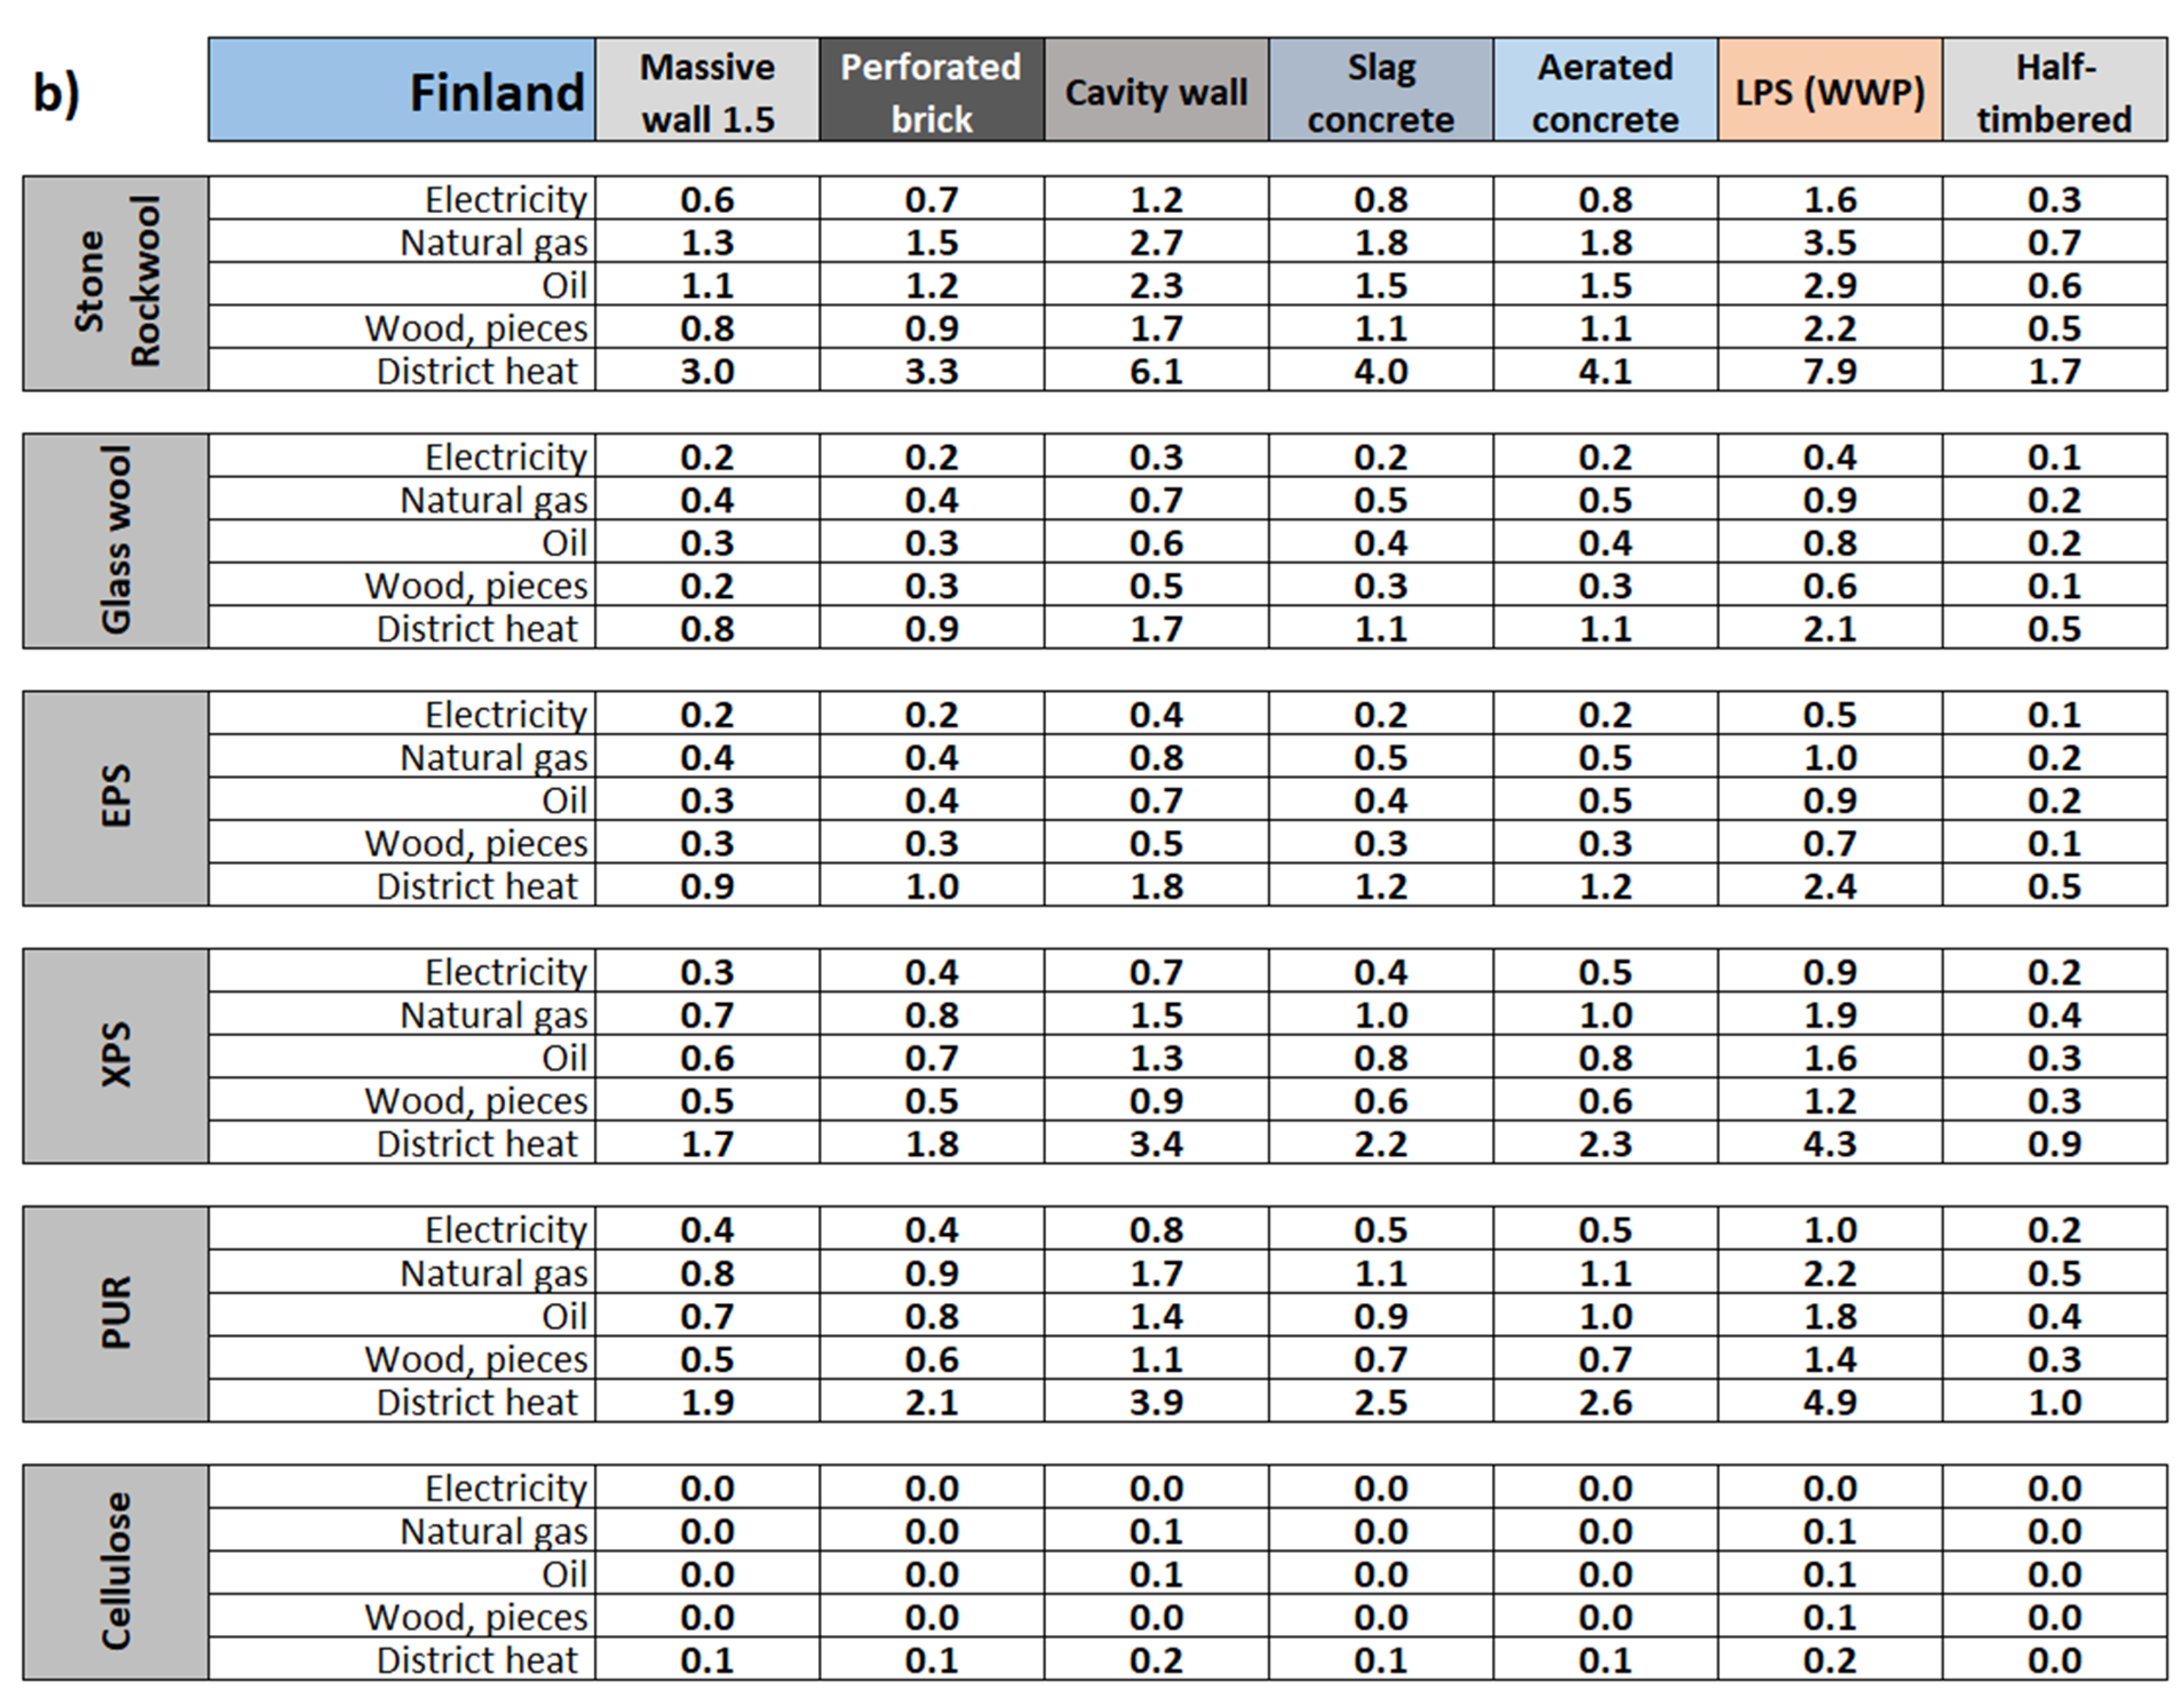
After averaging the data available from the EPDs available for Finland, PEFn values, emission factors and climate conditions for Helsinki, the highest CPP values were found in existing walls with the highest resistance, for district heating spaces and for stone/rockwool insulation (up to 7.9 years), PUR (up to 4.9 years) and XPS (up to 4.3 years). High CPP values for district heating result from the low PEFn value in Finland for this energy source [60,61]. The lowest CPP values occur in existing walls with the least resistance, for spaces heated by electricity and for cellulose (less than 0.1 year), glass wool and EPS (0.2 year). Depending on the energy source, the average CPP ranges from 0.4 for electricity to 2.0 for district heating and, depending on the type of insulation, it ranges from 0.1 for cellulose to 2.0 for stone/rockwool, as shown in Table 12a (CPP for various energy sources, regardless of insulation) and Table 12b (CPP for different insulation materials, regardless of heating method). The low CPP values result from approximately 30% higher annual heat losses related to Helsinki’s latitude.

4. Conclusions

The aim of this paper was to present the value of CPP of various variants of thermal insulation of existing external walls in residential buildings. Not only were different locations taken into account, but so were different energy sources, and it was assumed that insulation materials should have an EPD for the country in which they are analyzed. In addition, CPP values for various types of external walls that require thermal insulation, popular in Central and Eastern Europe, are shown.
The very extensive results obtained vary depending on the type of existing wall, the selected insulation material and the location, and range from less than 0.1 year to even several decades, depending on the parameters taken into account. However, the main conclusion is that the European average CPP values do not exceed 2.9 years, which means that external wall insulation is definitely a desirable action and that the carbon footprint embodied in the insulation material is quickly returned in the form of savings on the operational carbon footprint. The study also showed that in specific cases, the carbon footprint payback can be either very long (especially when heating with partially renewable energy sources such as biomass) or very short (e.g., for materials with a low carbon footprint or when heating spaces with high-emission electricity). There are also specific conditions for selected locations, such as high PEFn value or climatic differences, making the results for different EU countries very different. Indeed, comparing them, for example, is inappropriate due to the transport of materials between countries. In addition, the study showed large gaps in the availability of selected materials to EPDs at the level of selected EU countries, something which also affects the limitation of the study and the accuracy of the results. Therefore, in each case, the available solutions and insulation materials should be analyzed individually. Nevertheless, in this paper, it has been shown that the CPP for thermal renovation of existing walls in the vast majority of cases is relatively short and that this study can help in choosing the most environmentally friendly solution.

Funding

This research received no external funding.

Institutional Review Board Statement

Not applicable.

Informed Consent Statement

Not applicable.

Data Availability Statement

Not applicable.

Conflicts of Interest

The author declare that he have no known competing financial interests or personal relationships that could have appeared to influence the work reported in this paper.

Abbreviations

CE,j,Sembodied carbon reported as GWP for the selected insulation material (j) in the selected location (S), [kgCO2-eq]
CO,i,j,Sannual operational CO2 savings for the selected wall (i) insulated with the selected material (j) in selected location (S), [kgCO2-eq]
CO,ins,i,j,Sannual operational CO2 emissions of the selected wall (i) insulated with the selected insulation material (j) in the selected location (S), [kgCO2-eq]
CO,exist,i,Sannual operational CO2 emission of non-insulated, selected wall (i) in the selected location (S), [kgCO2-eq]
CPPi,j,k,SCarbon Payback Period for the selected wall (i) insulated with the selected material (j) in selected location (S) and for the selected heat source (k), [years]
di,jinsultation thickness, [m]
EEEmbodied Energy
EIFSExternal Insulation Finishing System
EMk,SCO2 emissions for selected heat sources (k) in selected location (S), [gCO2∙kWhdelivered−1]
EPBDEnergy Performance of Building Directive
EPDEnvironmental Product Declaration
EPPEnergy Payback Period, [years]
EPSexpanded polystyrene
ETICSExternal Thermal Insulation Composite System
FUfunctional unit
GWPGlobal Warming Potential [kgCO2-eq]
GWPE,ins,j,Svalue of GWP for A1-A3 substages for 1 m2 of selected insulation material (j) with resistance R = 1 (m2∙K∙W−1) in selected location (S), [kgCO2-eq]
GHGgreenhouse gases
HDDSnumber of the heating degree days with the base temperature equal to 18 °C in capitals of the selected location (S)
IPPInvestment Payback Period, [years]
λjthermal conductivity coefficient of insulation (j), [W∙m−1∙K−1]
LCALife-Cycle Assessment
LCIALife-Cycle Impact Assessment
LCCLife-Cycle Cost
LPSLarge Panel System
NZEBNearly Zero Energy Buildings
PCRProduct Category Rules
PEFnk,SNon-renewable Primary Energy Factors, for selected heat souces (k) in selected location (S), [kWhprimary/kWhdelivered]
PENRnon-Renewable Primary Energy
PERPrimary Renewable Energy
PIRpolyisocyanurate
PURpolyurethane
Rins,i,jexpected thermal resistance of the given insulation (j) on a given wall (i), [m2∙K∙W−1]
Rsithermal resistance on the internal surface, [m2∙K∙W−1]
Rsethermal resistance on the external surface, [m2∙K∙W−1]
Rti,jtotal thermal resistance of an insulated wall, [m2∙K∙W−1]
Rwall.ithermal resistance of the existing wall, [m2∙K∙W−1]
Ucheat transfer coefficient, [W1∙m−2∙K−1]
XPSextruded polystyrene
ZEBZero Emmisopn Buildings

References

  1. European Parliament and the Council Directive (EU) 2010/31 of the European Parliament and of the Council of 19 May 2010 on the Energy Performance of Buildings (Recast). Available online: http://data.europa.eu/eli/dir/2010/31/oj (accessed on 29 August 2022).
  2. European Parliament and the Council Directive (EU) 2018/844 of the European Parliament and of the Council of 30 May 2018 Amending Directive 2010/31/EU on the Energy Performance of Buildings and Directive 2012/27/EU on Energy Efficiency. Available online: http://data.europa.eu/eli/dir/2018/844/oj/eng (accessed on 29 August 2022).
  3. United Nations Environment Programme. 2020 Global Status Report for Buildings and Construction: Towards a Zero-emission, Efficient and Resilient Buildings and Construction Sector; Communication Division, United Nations Environment Programme: Nairobi, Kenya, 2020. [Google Scholar]
  4. COM(2011) 571 Final, Communication from the Commission to the European Parliament, the Council, the European Economic and Social Committee and Committee of the Regions, the Roadmap to a Resource Efficient Europe. Available online: https://eur-lex.europa.eu/legal-content/EN/TXT/?uri=CELEX%3A52011DC0571 (accessed on 29 August 2022).
  5. European Commission. 2050 Long-Term Strategy. Available online: https://ec.europa.eu/clima/policies/strategies/2050_en (accessed on 29 August 2022).
  6. Rousselot, M.; Pinto Da Rocha, F. Energy Efficiency Trends in Buildings in the EU, Odyssee-Mure, Policy Brief. 2021. Available online: https://www.odyssee-mure.eu/publications/policy-brief/buildings-energy-efficiency-trends.html (accessed on 30 August 2022).
  7. COM (2021) 802 Final, Proposal for a Directive 2010/31/EU of the European Parliamen and of the Council on the Energy Performance of Buildings (Recast). Available online: https://eur-lex.europa.eu/legal-content/EN/TXT/?uri=celex:52021PC0802 (accessed on 29 August 2022).
  8. COM(2020) 662 Final, Communication from the Commission to the European Parliament, the Council, the European Social and Economic Committee and the Committee of the Regions, A Renovation Wave for Europe—Greening Our Buildings, Creating Jobs, Improving Lives. Available online: https://eur-lex.europa.eu/legal-content/EN/TXT/?uri=CELEX%3A52020DC0662 (accessed on 30 August 2022).
  9. European Commission. Directorate-General for Energy, Comprehensive Study of Building Energy Renovation Activities and the Uptake of Nearly Zero-Energy Buildings in the EU: Final Report, Publications Office. 2019. Available online: https://data.europa.eu/doi/10.2833/14675 (accessed on 30 August 2022).
  10. European Commission. Renovation Wave: Doubling the Renovation Rate to Cut Emissions, Boost Recovery and Reduce Energy Poverty. Available online: https://ec.europa.eu/commission/presscorner/detail/en/ip_20_1835 (accessed on 30 August 2022).
  11. COM (2021) 558, Proposal for a Directive 2012/27/EU of the European Parliament and the Council on Energy Efficiency (Recast). Available online: https://eur-lex.europa.eu/legal-content/EN/TXT/?uri=CELEX:52021PC0558 (accessed on 31 August 2022).
  12. The American Institute of Architects. 10 Steps to Reducing Embodied Carbon. Available online: https://www.aia.org/articles/70446-10-steps-to-reducing-embodied-carbon:2976 (accessed on 10 August 2022).
  13. BPIE. Factsheet 97% of Buildings in the EU Need to Be Upgraded. 2017. Available online: http://bpie.eu/wp-content/uploads/2017/12/State-of-the-building-stock-briefing_Dic6.pdf (accessed on 1 September 2022).
  14. Ramesh, T.; Prakash, R.; Shukla, K.K. Life cycle energy analysis of buildings: An overview. Energy Build 2010, 42, 1592–1600. [Google Scholar] [CrossRef]
  15. Ibn-Mohammed, T.; Greenough, R.; Taylor, S.; Ozawa-Meida, L.; Acquaye, A. Operational vs. embodied emissions in buildings—A review of current trends. Energy Build 2013, 66, 232–245. [Google Scholar] [CrossRef]
  16. Ürge-Vorsatz, D.; Khosla, R.; Bernhardt, R.; Chan, Y.; Vérez, D.; Hu, S.; Cabeza, L.F. Advances Toward a Net-Zero Global Building Sector. Annu. Rev. Environ. Resour. 2020, 45, 227–269. [Google Scholar] [CrossRef]
  17. Thormark, C. A low energy building in a life cycle—Its embodied energy, energy need for operation and recycling potential. Build. Environ. 2022, 37, 429–435. [Google Scholar] [CrossRef]
  18. Blengini, G.A.; Di Carlo, T. Energy-saving policies and low-energy residential buildings: An LCA case study to support decision makers in piedmont (Italy). Int. J. Life Cycle Assess. 2010, 15, 652–665. [Google Scholar] [CrossRef]
  19. Chastas, P.; Theodosiou, T.; Bikas, D. Embodied energy in residential buildings towards the nearly zero energy building: A literature review. Build. Environ. 2016, 105, 267–282. [Google Scholar] [CrossRef]
  20. Kjendseth, W. Marianne & Fufa, Selamawit & Kristjansdottir, Torhildur & Andresen, Inger, Lessons learnt from embodied GHG emission calculations in zero emission buildings (ZEBs) from the Norwegian ZEB research centre. Energy Build. 2018, 165, 25–34. [Google Scholar] [CrossRef]
  21. Statistics Poland. Development of Methodology and Realisation of a Survey of a Thermo-Modernization Activity Scale in Multi-Dwelling Residential Buildings. 2018. Available online: https://stat.gov.pl/download/gfx/portalinformacyjny/pl/defaultaktualnosci/6336/1/1/1/przeprowadzenie_badania_skali_dzialan_termomodernizacyjnych_budynkow_mieszkalnych.pdf (accessed on 2 September 2022).
  22. 2017. Available online: https://www.visiongain.com/report/building-thermal-insulation-market-analysis-forecasts-2017-2027/ (accessed on 2 September 2022).
  23. Luo, Z.; Yang, L.; Liu, J. Embodied carbon emissions of office building: A case study of China’s 78 office buildings. Build. Environ. 2016, 95, 365–371. [Google Scholar] [CrossRef] [Green Version]
  24. Aditya, L.; Mahlia, T.M.I.; Rismanchi, B.; Ng, H.M.; Hasan, M.H.; Metselaar, H.S.C.; Muraza, O.; Aditiya, H.B. A review on insulation materials for energy conservation in buildings. Renew. Sustain. Energy Rev. 2017, 73, 1352–1365. [Google Scholar] [CrossRef]
  25. Mohsen, M.S.; Akash, B.A. Some prospects of energy savings in buildings. Energy Convers. Manag. 2001, 42, 1307–1315. [Google Scholar] [CrossRef]
  26. Filate, S.S. Investigation of an Energy Refurbishment Concept for Office Building Using Nanogel/Aerogel Insulation Plaster and Replaced Windows by Building Simulation. Master Programme in Energy Technology; Uppsala Universitet: Uppsala, Sweden, 2014; Available online: https://www.diva-portal.org/smash/get/diva2:772909/ATTACHMENT01.pdf (accessed on 14 September 2016).
  27. Evola, G.; Margani, G. Energy retrofit towards net zeb, Application of BIPV on an Apartment Block in Southern Italy. In Proceedings of the Architectural Research through to Practice: 48th International Conference of the Architectural Science Association, Genoa, Italy, 10–13 December 2014. [Google Scholar]
  28. Hoxha, E.; Habert, G.; Lasvaux, S.; Chevalier, J.; Le Roy, R. Influence of construction material uncertainties on residential building LCA reliability. J. Clean. Prod. 2017, 144, 33–47. [Google Scholar] [CrossRef]
  29. Passer, A.; Kreiner, H.; Maydl, P. Assessment of the environmental performance of buildings: A critical evaluation of the influence of technical building equipment on residential buildings. Int. J. Life Cycle Assess. 2012, 17, 1116–1130. [Google Scholar] [CrossRef]
  30. Hoxha, E.; Jusselme, T. On the necessity of improving the environmental impacts of furniture and appliances in net-zero energy buildings. Sci. Total Environ. 2017, 596–597, 405–416. [Google Scholar] [CrossRef] [PubMed]
  31. Kunič, R. Carbon footprint of thermal insulation materials in building envelopes. Energy Effic. 2017, 10, 1511–1528. [Google Scholar] [CrossRef]
  32. Grazieschi, G.; Asdrubali, F.; Thomas, G. Embodied energy and carbon of building insulating materials: A critical review. Clean Environ. Syst. 2021, 2, 100032. [Google Scholar] [CrossRef]
  33. Hill, C.; Norton, A.; Dibdiakova, J. A comparison of the environmental impacts of different categories of insulation materials. Energy Build. 2018, 162, 12–20. [Google Scholar] [CrossRef]
  34. Su, X.; Luo, Z.; Li, Y.; Huang, C. Life cycle inventory comparison of different building insulation materials and uncertainty analysis. J. Clean. Prod. 2016, 112, 275–281. [Google Scholar] [CrossRef]
  35. Pargana, N.; Pinheiro, M.D.; Silvestre, J.D.; de Brito, J. Comparative environmental life cycle assessment of thermal insulation materials of buildings. Energy Build. 2014, 82, 466–481. [Google Scholar] [CrossRef]
  36. Casini, M. Insulation materials for the building sector: A review and comparative analysis. In Encyclopedia of Renewable and Sustainable Materials; Elsevier: Amsterdam, The Netherlands, 2020; pp. 121–132. [Google Scholar] [CrossRef]
  37. Biswas, K.; Shrestha, S.S.; Bhandari, M.S.; Desjarlais, A.O. Insulation materials for commercial buildings in North America: An assessment of lifetime energy and environmental impacts. Energy Build. 2016, 112, 256–269. [Google Scholar] [CrossRef]
  38. Yard, S. Developments of the payback method. Int. J. Prod. Econ. 2000, 67, 155–167. [Google Scholar] [CrossRef]
  39. Ardente, F.; Beccali, M.; Cellura, M.; Mistretta, M. Energy and environmental benefits in public buildings as a result of retrofit actions. Renew. Sustain. Energy Rev. 2011, 15, 460–470. [Google Scholar] [CrossRef]
  40. Asdrubali, F.; Ballarini, I.; Corrado, V.; Evangelisti, L.; Grazieschi, G.; Guattari, C. Energy and environmental payback times for an NZEB retrofit. Build Environ. 2019, 147, 461–472. [Google Scholar] [CrossRef]
  41. Berggren, B.; Hall, M.; Wall, M. LCE analysis of buildings—Taking the step towards net zero energy buildings. Energy Build 2013, 62, 381–391. [Google Scholar] [CrossRef]
  42. Lu, L.; Yang, H.X. Environmental payback time analysis of a roof-mounted building-integrated photovoltaic (BIPV) system in Hong Kong. Appl Energy 2010, 87, 3625–3631. [Google Scholar] [CrossRef]
  43. Huang, Y.; Niu, J.L.; Chung, T.M. Energy and carbon emission payback analysis for energy-efficient retrofitting in buildings-overhang shading option. Energy Build 2012, 44, 94–103. [Google Scholar] [CrossRef]
  44. Zhang, C.; Hu, M.; Laclau, B.; Garnesson, T.; Yang, X.; Tukker, A. Energy-carbon-investment payback analysis of prefabricated envelope-cladding system for building energy renovation: Cases in Spain, the Netherlands, and Sweden. Renew. Sustain. Energy Rev. 2021, 145, 111077. [Google Scholar] [CrossRef]
  45. Beccali, M.; Cellura, M.; Fontana, M.; Longo, S.; Mistretta, M. Energy retrofit of a single-family house: Life cycle net energy saving and environmental benefits. Renew. Sustain. Energy Rev. 2013, 27, 283–293. [Google Scholar] [CrossRef]
  46. Dylewski, R.; Adamczyk, J. 12—Life cycle assessment (LCA) of building thermal insulation materials. Eco-efficient Construction and Building Materials; Pacheco-Torgal, F., Cabeza, L.F., Labrincha, J., de Magalhães, A., Eds.; Woodhead Publishing: Sawston, UK, 2014; pp. 267–286. ISBN 9780857097675. [Google Scholar] [CrossRef]
  47. EN 15804:2012; Sustainability of Construction Works—Environmental Product Declarations—Core Rules for the Product Category of Construction Products. The European Committee for Standardization: Brussels, Belgium, 2012.
  48. ISO 14040; Environmental Management–Life Cycle Assessment–Principles and Framework. International Organisation for Standardisation: Geneva, Switzerland, 2006. Available online: https://www.iso.org/standard/37456.html (accessed on 10 September 2022).
  49. Passive House Requirements, Passive House Institute. Available online: https://passivehouse.com/02_informations/02_passive-house-requirements/02_passive-house-requirements.htm (accessed on 12 September 2022).
  50. Singh, U.; Colosi, L.M. The case for estimating carbon return on investment (CROI) for CCUS platforms. Appl. Energy 2021, 285, 116394. [Google Scholar] [CrossRef]
  51. ISO 14044; Environmental management—Life cycle assessment—Requirements and guidelines. International Organisation for Standardisation: Geneva, Switzerland, 2006. Available online: https://www.iso.org/standard/38498.html (accessed on 10 September 2022).
  52. EN 15978:2011; Sustainability of construction works—Assessment of environmental performance of buildings—Calculation method. The European Committee for Standardization: Geneva, Switzerland. Available online: https://www.oneclicklca.com/ (accessed on 10 September 2022).
  53. European Commission. Commission Delegated Regulation (EU) No 811/2013 of 18 February 2013 Supplementing Directive 2010/30/EU of the European Parliament and of the Council with Regard to the Energy Labelling of Space Heaters, Combination Heaters, Packages of Space Heater, Temperature Control and Solar Device and Packages of Combination Heater, Temperature Control and Solar Device. Available online: http://eur-lex.europa.eu/legal-content/EN/TXT/PDF/?uri=CELEX:32013R0811&from=E (accessed on 10 September 2022).
  54. Sartori, I.; Napolitano, A.; Voss, K. Net zero energy buildings: A consistent definition framework. Energy Build. 2012, 48, 220–232. [Google Scholar] [CrossRef] [Green Version]
  55. EN 52000-1:2017-10; Energy Performance of Buildings—Overarching EPB assessment—Part 1: General Framework and Procedures. International Organization for Standardization: Geneva, Switzerland, 2017.
  56. Regulation of the Minister of Infrastructure and Development of 27 February 2015 on the Methodology for Determining the Energy Performance of a Building or Part of a Building and Energy Performance Certificates. J. Laws 2015, 376, 6.
  57. DIN V 18599:2007-02; Energy efficiency of buildings - Calculation of the net, final and primary energy demand for heating, cooling, ventilation, domestic hot water and lighting - Part 1: General balancing procedures, terms and definitions, zoning and evaluation of energy sources. Beuth: Berlin, Germany, 2009. Available online: https://www.beuth.de/en/pre-standard/din-v-18599-1/96921476 (accessed on 10 September 2022).
  58. Ministry of the Environment of Czech Republic. National Greenhouse Gas Inventory Report of the Czech Republic (reported inventories 1990–2018), Table 3-11. 2020. Available online: https://unfccc.int/sites/default/files/resource/cze-2020-nir-7may20.pdf (accessed on 10 September 2022).
  59. International Energy Agency. Czech Republic 2021. Energy Policy Review; International Energy Agency: Paris, France, 2021. [Google Scholar]
  60. Předpis, č. 78/2013 Sb.Vyhláška o energetické náročnosti budov, 22.03.2013, Czech Republic. Available online: https://www.zakonyprolidi.cz/cs/2013-78 (accessed on 10 September 2022).
  61. Österreichisches Institut für Bautechnik: Richtlinie 6 Energieeinsparung und Wärmeschutz. 2015. Available online: https://www.oib.or.at/sites/default/files/richtlinie_6_26.03.15.pdf (accessed on 10 September 2022).
  62. National Building Code of Finland. Part D3 Energy-Efficiency; Ministry of the Environment: Helsinki, Finland, 2018. [Google Scholar]
  63. Haakana, M.; Laitila, P.; Forssell, K.M.; Motiva, O.Y. Implementation of the EPBD in Finland, 2016, The Concerted Action EPBD (CA EPBD). 2016. Available online: https://epbd-ca.eu/ca-outcomes/outcomes-2015-2018/book-2018/countries/finland (accessed on 14 September 2022).
  64. National Center for Emissions Management and Balancing. Available online: https://www.kobize.pl/pl/fileCategory/id/28/wskazniki-emisyjnosci, (accessed on 12 September 2022).
  65. IPCC. Annex I: Properties of CO2 and Carbon-Based Fuels. In Special Report on Carbon dioxide Capture and Storage; IPCC: Geneva, Switzerland; Available online: https://www.ipcc.ch/site/assets/uploads/2018/03/srccs_annex1-1.pdf (accessed on 12 September 2022).
  66. Calculation Criteria Used In The Sitra Lifestyle Test, SISTRA. 2021. Available online: https://lifestyletest.sitra.fi/ (accessed on 14 September 2022).
  67. Blagoeva, D.; Pavel, C.C. Competitive Landscape of the EU’s Insulation Materials Industry for Energy-Efficient Buildings; EUR 28816 EN; Publications Office of the European Union: Luxembourg, 2018; ISBN 978-92-79-96383-4. [Google Scholar] [CrossRef]
  68. IAL Consultants. Press release: The European Market for Thermal Insulation Products. 2022. Available online: www.ialconsultants.com/media/1090/thermal-insulation-press-release-2021.pdf (accessed on 14 September 2022).
  69. Shrestha, S.S.; Biswas, K.; Desjarlais, A.O. A protocol for lifetime energy and environmental impact assessment of building insulation materials. Environ. Impact Assess. Rev. 2014, 46, 25–31. [Google Scholar] [CrossRef]
  70. Central Statistical Office. Inhabited buildings. National Census of Population and Housing, Warsaw. 2013. Available online: https://warszawa.stat.gov.pl/publikacje-i-foldery/spisy-powszechne/narodowy-spis-powszechny-ludnosci-i-mieszkan-2011-zamieszkane-budynki,8,1.html (accessed on 16 October 2022).
  71. Wójcik, R. Docieplanie Budynków od Wewnątrz; Grupa Medium: Warszawa, Poland, 2018. [Google Scholar]
  72. Onyszkiewicz, J.; Sadowski, K. Proposals for the revitalization of prefabricated building facades in terms of the principles of sustainable development and social participation. J. Build. Eng. 2022, 46, 103713. [Google Scholar] [CrossRef]
  73. Available online: https://www.degreedays.net/# (accessed on 1 September 2022).
  74. Sunikka-Blank, M.; Galvin, R. Introducing the prebound effect: The gap between performance and actual energy consumption. Build. Res. Inf. 2012, 40, 260–273. [Google Scholar] [CrossRef]
Figure 1. Value of GWP (embodied carbon) for different materials in different locations.
Energies 16 00113 g001
Figure 2. Scheme of the CPP calculation methodology.
Energies 16 00113 g002
Figure 3. (a) CPP values chart for Europe (aver.), (b) CPP values for Europe (aver.).
Energies 16 00113 g003
Figure 4. (a) CPP values chart for Europe. (b) CPP values for Europe.
Energies 16 00113 g004
Figure 5. (a) CPP values chart for Poland, (b) CPP values for Poland.
Energies 16 00113 g005aEnergies 16 00113 g005b
Figure 6. (a) CPP values chart for Germany. (b) CPP values for Germany.
Energies 16 00113 g006aEnergies 16 00113 g006b
Figure 7. (a) CPP values chart for Czech Republic. (b) CPP values for Czech Republic.
Energies 16 00113 g007aEnergies 16 00113 g007b
Figure 8. (a) CPP values chart for Austria. (b) CPP values for Austria.
Energies 16 00113 g008aEnergies 16 00113 g008b
Figure 9. (a) CPP values chart for Finland. (b) CPP values for Finland.
Energies 16 00113 g009aEnergies 16 00113 g009b
Table 1. Non-renewable Primary Energy Factors PEFnk,S [kWhprimary/kWhdelivered].
Energy CarrierEurope [55]Poland [56]Germany [57]Czech Republic [58]Austria [59]Finland [60,61]
Electricity2.33.02.63.01.321.2
Natural gas1.11.11.11.21.161.0
Oil1.11.11.11.21.231.0
Wood, pieces0.20.20.20.20.061.0
District heating1.31.30.7 (FF > 70%)1.01.380.5
Table 2. CO2 emissions factors EMk,S [gCO2∙kWhdelivered−1].
Energy CarrierEuropePolandGermanyCzech Republic AustriaFinland
Electricity420 [55]698 [62]331 [59]406 [58,63,64]389 [59]329.62 [65]
Natural gas180 [66]180 [66]180 [66]180 [66]180 [66]180 [66]
Oil213 [66]213 [66]213 [66]213 [66]213 [66]]213 [66]
Wood, pieces282 [66]282 [66]282 [66]282 [66]282 [66]282 [66]
District heating260 [55]340 [62]230 [59]298 * [63,64]219 [59]158 [65]
* the value was calculated by taking into account the energy sources for district heating (coal—58%, natural gas—29%, bioenergy—11%, Oil—1%, Solar—1% [64].
Table 3. Properties of insulation materials.
MaterialDensity (kg∙m−3)Thermal Conductivity (W∙m−1∙K−1)
Iins,1Stone wool35–1300.033–0.040
Iins,2Glass wool12–640.031–0.045
Iins,3EPS
(expanded polystyrene)
15–300.031–0.044
Iins,4XPS
(extruded polystyrene)
24–380.030–0.040
Iins,5PUR
(polyurethane foam)
31.5–350.022–0.040
Iins,6Cellulose30–800.037–0.042
Table 4. Value of GWP (embodied carbon) for insulation materials (ind.—individual EPD, gen.—generic EPD, GWP of FU = 1 m2 of material with resistance (R) of 1 m2∙K∙W−1).
Member State Europe (Aver.)EuropePolandGermanyCzech RepublicAustriaFinland
Ind.Gen.Ind.Gen.Ind.Gen.Ind.Gen.Ind.Gen.Ind.Gen.Ind.Gen.
Stone woolnumb.474003390120130101
GWP4.036.09--1.446.623.90-2.95-4.82-5.224.47
Glass woolnumb.6340015440170170420
GWP1.542.88--1.492.881.78-0.89-2.65-1.40-
EPSnumb.4950010432040022
GWP2.681.89--1.87-1.571.901.78-2.93-1.201.88
XPSnumb.3480310841023010
GWP4.563.58-3.217.39-2.883.512.44-5.19-2.84-
PURnumb.1010001000010000
GWP3.363.10---3.10----3.36---
Cellulosenumb.122201100018010
GWP0.470.370.29-0.300.44---0.310.60-0.14-
Table 5. Characteristics of existing walls.
NoType of WallCharacteristicSection
1. Wwall.1Massive wall made of solid brickThickness: 44 cm
Composition: 1.5 bricks, joint and internal cement-lime plaster
Thermal resistance (R): 0.735 m2∙K∙W−1
Energies 16 00113 i001
2. Wwall.2Massive wall made of perforated brickThickness: 41 cm
Composition: 1.5 bricks, joint and internal cement-lime plaster
Thermal resistance (R): 0.820 m2∙K∙W−1
Energies 16 00113 i002
3. Wwall.3Cavity wallThickness: 45 cm
Composition: 1.5 solid bricks, joint and internal cement-lime plaster
Thermal resistance (R): 1.515 m2∙K∙W−1
Energies 16 00113 i003
4. Wwall.4Slag concrete wallThickness: 40 cm
Composition: slag concrete (ρ = 1200 kg/m3) with internal cement-lime plaster.
Thermal resistance (R): 0.993 m2K/W
Energies 16 00113 i004
5. Wwall.5Wall of autoclaved aerated concreteThickness: 25.5 cm
Composition: aerated concrete blocks (ρ = 600 kg/m3) with internal cement-lime plaster.
Thermal resistance (R): 1.007 m2∙K∙W−1
Energies 16 00113 i005
6. Wwall.6Large panel system (LPS) WWP curtain wallThickness: 28.5 cm
Composition: reinforced concrete structural part 14 cm, insulation made of polystyrene or mineral wool 6 cm, the textural reinforced concrete part 6 cm, with internal cement-lime plaster.
Thermal resistance (R): 1.950 m2∙K∙W−1
Energies 16 00113 i006
7. Wwall.7Half-timbered work wallThickness: 14.5 cm
Composition: timber frame wall with the filling of clay mixed and made with chaff, sawdust or shavings, or a 0.5 brick, internal cement-lime plaster.
Thermal resistance (R): 0.406 m2∙K∙W−1
Energies 16 00113 i007
Table 6. (a) Average CPP values for different energy sources. (b) Average CPP values for various insulation materials.
(a)
Source of EnergyCPP
Electricity0.3
Natural gas1.3
Oil1.1
Wood, pieces2.9
District Heat1.0
(b)
Insulation MaterialCPP
Stone/Rockwool2.3
Glass wool1.0
EPS1.0
XPS1.8
PUR1.5
Cellulose0.2
Table 7. (a) Average CPP values for different energy sources. (b) Average CPP values for various insulation materials.
(a)
Source of EnergyCPP
Electricity0.3
Natural gas1.5
Oil1.2
Wood, pieces5.1
District Heat0.9
(b)
Insulation MaterialCPP
Stone/Rockwool3.4
Glass wool1.5
EPS1.5
XPS2.1
PUR2.1
Cellulose0.2
Table 8. (a) Average CPP values for different energy sources. (b) Average CPP values for various insulation materials.
(a)
Source of EnergyCPP
Electricity0.1
Natural gas1.4
Oil1.2
Wood, pieces4.9
District Heat0.6
(b)
Insulation MaterialCPP
Stone/Rockwool2.1
Glass wool0.9
EPS1.0
XPS3.9
PUR1.6
Cellulose0.2
Table 9. (a) Average CPP values for different energy sources. (b) Average CPP values for various insulation materials.
(a)
Source of EnergyCPP
Electricity0.3
Natural gas1.1
Oil1.0
Wood, pieces4.0
District Heat1.4
(b)
Insulation MaterialCPP
Stone/Rockwool2.6
Glass wool1.2
EPS1.1
XPS2.0
PUR2.1
Cellulose0.3
Table 10. (a) Average CPP values for different energy sources. (b) Average CPP values for various insulation materials.
(a)
Source of EnergyCPP
Electricity0.1
Natural gas0.8
Oil0.6
Wood, pieces2.9
District Heat0.6
(b)
Insulation MaterialCPP
Stone/Rockwool1.5
Glass wool0.5
EPS0.9
XPS1.3
PUR1.7
Cellulose0.2
Table 11. (a): Average CPP values for different energy sources. (b): Average CPP values for various insulation materials.
(a)
Source of EnergyCPP
Electricity0.7
Natural gas1.7
Oil1.3
Wood, pieces20.4
District Heat1.1
(b)
Insulation MaterialCPP
Stone/Rockwool7.5
Glass wool34.1
EPS3.4.5
XPS6.8.0
PUR5.2
Cellulose0.9
Table 12. (a) Average CPP values for different energy sources. (b) Average CPP values for various insulation materials.
(a)
Source of EnergyCPP
Electricity0.4
Natural gas0.9
Oil0.7
Wood, pieces0.6
District Heat2.0
(b)
Insulation MaterialCPP
Stone/Rockwool2.0
Glass wool0.5
EPS0.6
XPS1.1
PUR1.2
Cellulose0.1
Disclaimer/Publisher’s Note: The statements, opinions and data contained in all publications are solely those of the individual author(s) and contributor(s) and not of MDPI and/or the editor(s). MDPI and/or the editor(s) disclaim responsibility for any injury to people or property resulting from any ideas, methods, instructions or products referred to in the content.