Abstract
The heterogeneous network (HetNet) is a specified cellular platform to tackle the rapidly growing anticipated data traffic. From a communications perspective, data loads can be mapped to energy loads that are generally placed on the operator networks. Meanwhile, renewable energy-aided networks offer to curtailed fossil fuel consumption, so to reduce the environmental pollution. This paper proposes a renewable energy based power supply architecture for the off-grid HetNet using a novel energy sharing model. Solar photovoltaics (PV) along with sufficient energy storage devices are used for each macro, micro, pico, or femto base station (BS). Additionally, a biomass generator (BG) is used for macro and micro BSs. The collocated macro and micro BSs are connected through end-to-end resistive lines. A novel-weighted proportional-fair resource-scheduling algorithm with sleep mechanisms is proposed for non-real time (NRT) applications by trading-off the power consumption and communication delays. Furthermore, the proposed algorithm with an extended discontinuous reception (eDRX) and power saving mode (PSM) for narrowband internet of things (IoT) applications extends the battery lifetime for IoT devices. HOMER optimization software is used to perform optimal system architecture, economic, and carbon footprint analyses while the Monte-Carlo simulation tool is used for evaluating the throughput and energy efficiency performances. The proposed algorithms are validated through the practical data of the rural areas of Bangladesh from which it is evident that the proposed power supply architecture is energy-efficient, cost-effective, reliable, and eco-friendly.
1. Introduction
The world is heading into an era of highly dense wireless networks which demand specific requirements, such as tens of Gbps data rates and around 10 years of battery life for low powered IoT devices. Cellular base stations are the main consumers of the energy used by mobile operators, e.g., around 57%, as mentioned in [1]. A recent estimate of energy consumption and greenhouse gas (GHG) emissions by mobile networks are around 130 TWh and 110 per year, respectively. The total annual carbon footprint is about 200 , when the mobile phone emissions are included [2], and this amount has been increasing at a yearly rate of 10% [3]. According to [4], 11% of the world’s energy generation source are renewable energy sources (RESs). At this rate, annually at least 12.1 GHG emissions have been reduced due to the use of RESs in the mobile industry. Furthermore, according to the International Energy Agency, worldwide energy demand is estimated to increase by around 9% from 2019 to 2030, which is equivalent to 1870 million tons of oil [5]. However, the reservations of global coal, oil, and natural gas remaining, warrant the needs for alternative sources of energy [6], e.g., renewable energies. High QoS at low costs is a challenge for cellular industry services because the pricing of cellular services has been reducing gradually [7]. The use of RES for powering the BSs can be a solution to this challenge. As such, efficient energy usage is one of the crucial foci of mobile industries aiming at the reduction of costs and emission-intensive carbon footprints while maintaining a guaranteed QoS. Therefore, bringing in renewable energy (RE) from the locally available sources has become an important aspect [8,9,10].
Bangladesh is a developing country, located between 33 N and 39 N latitude and between 124 E and 130 E longitude, where about 63.37% of the population live in the rural areas but only 59% of them have access to electricity [11,12]. At present, Bangladesh has 181.32 million mobile connections [13] and around 90 million unique subscriptions, where the 4G network coverage reaches 95 percent of the population [14]. Mobile operators in Bangladesh have invested 898.2 million US$ for the combined 4G spectrum in March 2021 [15]. According to [16], Bangladesh had more than 36679 GSM BSs until 2017, which consumed around 642 million kWh of energy. A total of 14% of the total BSs are off-grid and 81% of those off-grid BSs are powered by a diesel generator (DG) plus battery system [17]. The country has immense prospects of RESs such as solar, wind, biomass (agriculture residue), and geothermal [11,18]. As a result, it can be an ideal area to propose a RES based power generation infrastructure. Bangladesh has an average sunlight intensity within the range of 4–5 kWh/ per day as well as more than 350 prospective oil-bearing crops that harvest biodiesel, for example, J. curcas, sunflower, sesame, castor, cottonseed, and groundnut oils [19]. According to [20], potential biomass sources in Bangladesh are 213.81 million tons, where energy content is 1344.99 PJ and possible electricity generation from the source is 373.71 TWh, which is equivalent to the consumption of 45.91 million tons coal or 34.01 billion cubic meters of gas. With the proper modeling and help from modern technologies, Bangladesh can harvest around 70 PWh and 7682 GWh electrical energy per year from the solar and biomass resources, respectively, by 2030 [21,22]. Therefore, by integrating solar and biomass energy sources with adequate energy storage devices can be used to ensure a reliable RE-based supply system.
The use of renewable energy efficiently in the field of mobile cellular communication is one of the trending research topics. Moreover, research on large scale deployment of energy-efficient IoT devices will highly influence the future mobile industry. A standalone solar photovoltaic (PV) with sufficient storage device powered cellular BS has been introduced in [1,9,23,24], considering real-time dynamic solar radiation profile. Although in these studies energy efficiency (EE) is critically justified with both technical criteria and financial viability, in the issue of reliability it has some drawbacks. Therefore, authors in [25,26] have suggested the incorporation of diesel generator (DG) as a non-renewable energy source with solar PV for fueling the off-grid cellular BSs. But this system increases the carbon footprint. Moreover, transportation of fuel for DG in remote areas is not economically efficient. An integration of multiple RESs has been proposed in [27,28,29]. In [27], a solar PV and BG based hybrid supply model has been proposed for an off-grid homogeneous cellular network. In [28], proposed a hybrid solar PV/wind turbine (WT)/biomass generator (BG) powered energy supply system has been proposed for macro BSs in Bangladesh. The works in [29,30] use a solar PV and WT coupled supply system framework with and without an energy sharing policy for a homogeneous BSs setup. It is clear from [31], an integration of hybrid RESs with storage devices can assure reliability and minimize the gap between consumption and generation of energy. For example, in an urban area in Germany, Nokia Siemens has established a mobile BS setup powered by hybrid solar PV/WT [32].
Energy sharing between the adjacent cells through resistive power lines or smart grid has been used in [33,34,35]. Agglomerative and divisive hierarchical clustering algorithms are established with average energy affinity (AEA) and stochastic energy affinity (SEA) metrics to propose an energy sharing model among BSs in [33]. A RE-based community scale energy planning has been proposed by [36] to get a reasonable reduction in energy use and GHG emissions. In [37], the authors proposed an optimized community-shared solar PV framework. An optimal energy cooperation framework among cellular BSs has been proposed in [34], where both RE and grid have been incorporated using physically connected resistive power lines. An energy cooperation model between macro BSs has been demonstrated in [35]. From the aforementioned research articles, it is clear that the on-site green energy sharing between BS’s is affordable and it makes the systems reliable and cost-effective.
An efficient resource scheduling algorithm can optimize the tradeoff between different QoS requirements for specific applications. A minimum guaranteed throughput scheduling algorithm for NRT applications has been introduced in [38]. One of the most popular solutions for the resource scheduling of NRT applications is the proportional fair (PF) scheduler, which successfully incorporates the cell throughput and fairness. However, it ignores the queue size and does not attempt to improve the power saving from the DRX operation. A channel-adapted and buffer aware (CABA) packet scheduling algorithm has been proposed [39], which considers the queue size. However, this stand-alone proposal cannot take all the advantages of the popular PF scheduler. The work in [40] considers energy metrics at the base station, with a certain rate guarantee for each mobile station. A radio resource allocation framework is proposed in [41] to ensure proportional fairness among the user equipment (UE). A few solutions that make such resource allocators capable of supporting both guaranteed bit-rate and best-effort traffic are proposed in [42]. A new scheduling scheme, named the proportional equal throughput (PET) [43], which offers better fairness among users without reducing average user throughput, in comparison with other scheduling algorithms.
In [44], a context-conscious sleep and wake-up cycle of the fog nodes have been proposed in the target of energy minimization at the fog layer. Authors in [45,46] analyzed the effects of the DRX parameter on UE’s energy saving and latency. Nokia has an exploration on industrial DRX, which is illustrated in [47]. It is well recognized that power-saving and delays are always a tradeoff. To optimize the tradeoff, several DRX algorithms have been introduced in [48,49,50,51,52]. On the other hand, PSM and eDRX are two solutions to optimize the device power consumption proposed for EC-GSM, LTE-M, and NB-IoT technologies for delayed insensitive but energy sensitive applications, which have been introduced in 3GPP Rel.12. In [53], the authors have conducted an energy consumption analysis over an NB-IoT device under different traffic intensities and coverage areas. However, to the best of our knowledge, there is no such algorithm proposed, where both PSM and eDRX have been jointly analyzed to ensure optimum battery lifetime.
Therefore, this work is a combined proposal of energy efficient techniques from the perspective of both energy generation and consumption sides. From the generation point of view, we propose PV/BG system architecture for operating a rural Long Term Evolution(LTE) HetNet with a reliable and novel energy sharing policy. To validate the model, a rural area named Saldanga Union Parishad of Debiganj Upazila under the district Panchagarh in Bangladesh has been selected, which is located at North, East. From the energy consumption point of view, a sleep mode-based resource scheduling algorithm has been proposed for both NRT and IoT applications. The key contributions of this study are summarized below:
- A novel off-grid hybrid solar PV/BG system is proposed for operating an LTE HetNet in a rural area with reliable services.
- An energy sharing model through an external low loss resistive power line is proposed for the HetNet cellular environment that ensures the reliability and efficient utilization of RESs.
- A resource scheduling algorithm is proposed for the NRT and specifically IoT applications that achieve a large amount of power-savings through permissible delay in comparison with the existing model.
- HOMER optimization software is used to obtain optimal system architecture of the proposed framework and to perform the energy yield analysis, cost analysis and carbon footprint analysis.
- A Monte-Carlo-based simulation is used to evaluate the model in terms of throughput and energy efficiency under different bandwidths (BWs), allowing the possibility of dynamic traffic demand, inter-cell interference, and shadow fading.
The rest of the paper is organized as follows: Section 2 presents the system architecture and mathematical models of the proposed HetNet architecture. Section 3 summarises the system implementation and cost modeling. Section 4 analyses the results with the simulation setup. Finally, Section 5 concludes the paper by summarizing the main outcomes.
2. System Architecture and Mathematical Modeling
To serve a large number of users and to run the massive volume of data traffic with a diverse quality of service (QoS) requirements, mobile operators have introduced the simultaneous operations of macro, micro, pico, and femtocells, which together form heterogeneous networks (HetNet). The typical coverage area radius for macro, micro, pico and femtocells is 5–30 km, 1–2 km, 200 m and 10 m, respectively. Large-scale deployment and supervision of IoT devices are becoming a crucial topic in the present day. To facilitate internet connectivity for the enormous amount of low throughput devices, the 3rd Generation Partnership Project (3GPP) has proposed a new radio technology standard well-known as the narrowband IoT (NB-IoT). This NB-IoT specification can implement the power saving mode (PSM) and extended discontinuous reception (eDRX) mechanisms to attain a long battery life. This eDRX is an extended form of the discontinuous reception (DRX) operation. DRX operation was included in 4G to achieve the power saving and prolonged battery life. With the intelligent and optimum use of eDRX, PSM, and DRX mechanisms, a resource scheduling algorithm can be proposed for IoT and NRT applications with an optimal tradeoff between latency and power saving.
A schematic diagram of the proposed hybrid solar PV/BG powered rural area-based off-grid HetNet is illustrated in Figure 1.
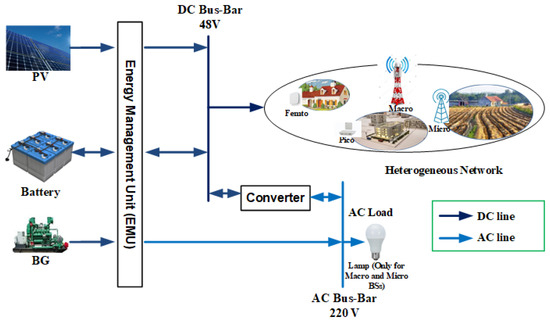
Figure 1.
A schematic diagram of the proposed system.
The HetNet consists of macro, micro, pico, femto type BSs, where each type of BS has its specific size, power consumption, and data rate requirements according to the required QoS. Generally, a small size of BS requires small radiated power due to its small coverage area. Hence, pico and femto BSs require low power consumption; they are supplied with solar PV alone. In contrast, macro and micro BSs require high power consumption. As such, they are connected to both solar PV and BG, with the BG only activated if PV cannot supply enough power. To ensure a continuous power supply, a battery bank is connected for each BS to overcome the shortage or outage of the generation from RES. Here, the power supply to each base station is controlled via an energy management unit (EMU). The EMU is also connecting renewable energy sources and energy storage devices. EMU primarily collects the generated power from renewable energy sources and distributes the generated energy according to the respective base station requirements. EMU also has the built-in capacity to reduce overvoltage and overcurrent problems. It consequently improves battery life by minimizing the intense discharge from the storage unit. A BS is a DC load. However, there are some AC loads such as a lamp and air cooler that need to be powered. Converters are used to convert DC into AC and vice versa, as needed. This section presents the proposed system model along with the renewable energy generation model, BS power consumption model, and energy sharing algorithm in the context of off-grid LTE cellular networks. Symbols and notations that are used in the subsequent sections are summarised in Table 1.

Table 1.
A list of the symbols and notations.
An overview of the energy-efficient techniques from the prospective of both energy generation and consumption are shown in Figure 2. We illustrate an overall architecture of the proposed system and methods to establish our proposed energy-efficient techniques from the perspective of both energy generation and consumption sides. By integrating RES and HetNet deployment, we make the system energy-efficient from the power generation perspective. Moreover, in an off-grid condition, energy sharing in a heterogeneous network can ensure the reliability with efficient RES design. Radio resource scheduling optimizes the end device energy consumption. Extensive use of heterogeneous networks and optimum resource scheduling are two important aspects of the most modern cellular technology (5G/6G). As the proposed system includes these aspects, it can help us to cope with 5G/6G. Overall, the energy-efficient technique has been demonstrated using a triangle sign to consider these three aspects.
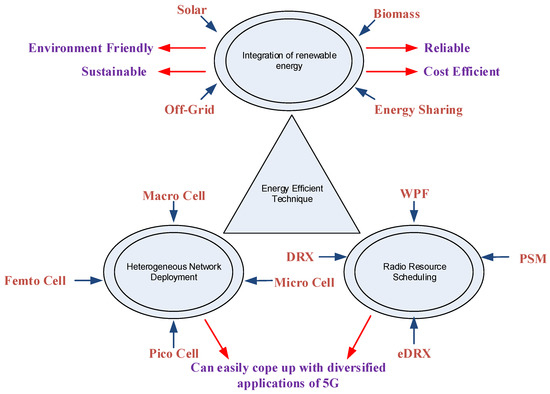
Figure 2.
An overview of the energy-efficient techniques of the proposed model.
2.1. Solar PV Panel
Solar PV produces electricity from solar energy directly. The amount of solar energy generation heavily depends on the geographic location (availability of direct sunlight), beam radiation, panel materials, and tracking mode. On focusing the specifications and capital cost ‘Sharp ND-250QCs (poly crystalline)’ is selected in this work. Additional information of the Sharp ND-250QCs (poly crystalline) solar module can be found in [54]. The temporal variation of solar power generation is calculated using the System Advisory Model (SAM) for 1 kW PV module size, as shown in Figure 3 [55].
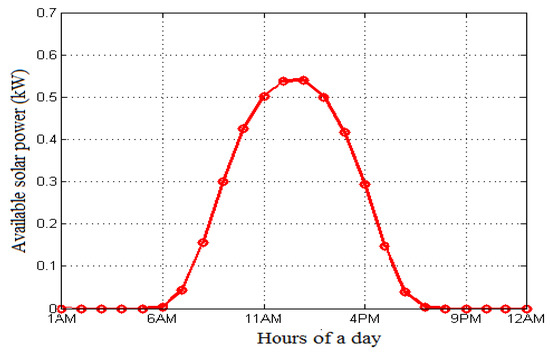
Figure 3.
Average hourly solar power production over a day for 1 kW PV module size.
2.2. Biomass Generator
The amount of energy generated by the BG mostly depends on the average biomass availability, the calorific value of the biomass, the efficiency of the BG, and its running hours. The combination of the BG with the solar PV panel plays an important role in compensating the BS energy demand during the malfunction of RES.
2.3. Battery Bank
Battery storage is considered an essential component in the sustainable energy. The battery bank autonomy () specifies the credible time limit, up to the storage setup that can deliver the necessary electricity to run BS as a load if the RES is unavailable. It can be calculated as follows [28,56]:
The capacity of the battery bank () can be expressed as follows [28,56]:
2.4. Reliability Analysis
Annual capacity storage () or ‘annual capacity shortage’ is a variable used to quantify the system’s reliability. It can be calculated as:
can be expressed as follows and calculated in kWh/yr:
where is the generated electricity, which can be written for macro and micro BSs:
For pico and femto BSs, the above equation can be modified as follows:
To ensure reliability of the system, the proposed scheme is designed with sufficient backup power reserve over the entire project duration. The excess electricity, generated as backup power, can be estimated by:
where and represent the losses associated with the converter and battery, respectively.
2.5. Energy-Sharing Model
This section proposes an energy-sharing algorithm to ensure green, optimal, and uninterrupted power supply for an off-grid HetNet configuration. The basic features of the macro, micro, pico, and femto cells are presented in Table 2.
Table 2.
Cell size and transmitted power for a heterogeneous network [57].
To propose the algorithm, an energy sharing model is used, which is illustrated in Figure 4. In the core of HetNet, there are cells. A cell is formed with a macro base station (BS) placed at the centre and one or more micro BSs are connected to the macro BS in a star topology. There can be multiple micro BSs inside the cell of a macro BS. Because of the star connection arrangement, each of these smaller BSs is directly connected to the central macro BS. As such, a macro BS can share energy with all other micro BSs in the cell. A macro BS can also share energy with other adjacent macro BSs directly connected in the network. All the connections for energy sharing between the BSs has been intended to do through low resistive power lines, and in every case it is half-duplex. In the HetNet, different types of cells are required for various applications, with various qualities of service (QoS) requirements. The distance between the cells is small in the heterogeneous network. As a result, the low resistive power line method can be practicable for sharing energy [58]. This connection for energy sharing may effectively use BSs’ renewable energy sources.
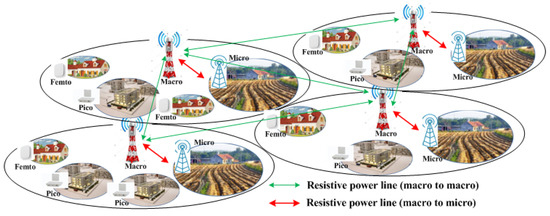
Figure 4.
Energy-sharing model among the adjacent BSs of HetNet.
Through the energy sharing policy, the excess electricity will be shared according to the flow diagram illustrated in Figure 5. Here, is the amount of excess electricity that is 10% greater than the load requirement. The resistive value of the proposed connection has been taken from the American Wire Gauge (AWG) standard conductor size table [59].
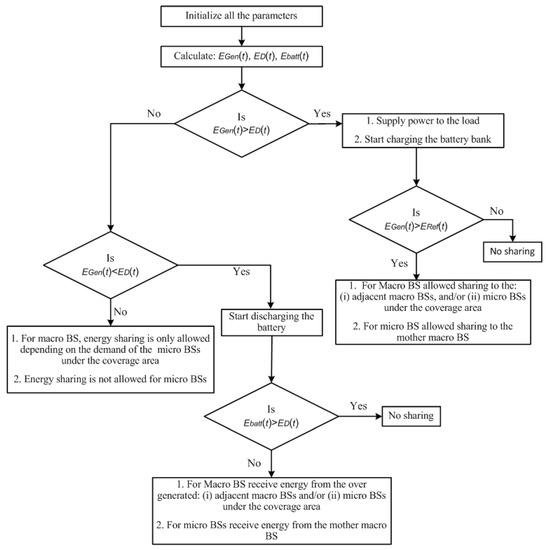
Figure 5.
Flow diagram of the proposed energy sharing model.
The total shared energy () to the adjacent BSs can be calculated as [25]:
where is the path loss because of the resistance of the conductor, which can be calculated as [25]:
The percentage of energy savings because of the energy sharing policy can be calculated as [25]:
2.6. Throughput and Energy Efficiency Model
The performance of the wireless network is evaluated in terms of throughput and EE metrics. According to Shanon’s information capacity theorem, total achievable throughput in a network at time t can be expressed by [25]:
where, is the system bandwidth and is the Signal-to-interference plus-noise-ratio at kth user equipment from ith BS.
EE is defined as the ratio of total network throughput and total power consumed by the network. Thus, the EE metric denoted as for time t is defined as [25]:
Here, the received signal to interference plus noise ratio (SINR) at kth user equipment from ith BS can be given by
where is the intra-cell interference, is the inter-cell interference is the transmitted power in dBm, is the additive white Gaussian noise (AWGN) power given by in dBm, and with BW is the bandwidth in Hz.
2.7. Mathematical Model of Costs
Net present cost (NPC) is the total cost of the proposed system during the full life cycle, which can be calculated as follows [56]:
where is the capital cost, is the replacement cost, is the operation and maintenance cost, is the fuel cost, and is the salvage value.
Whereas the total annualized cost (TAC) and capital recovery factor (CRF) can be expressed by Equations (15) and (16), respectively [56].
Here, L expresses the lifespan of the proposed project and i expresses the every twelve months interest rate. Instead, the salvage value, only applicable for those components which have a longer lifespan than project lifespan, can be expressed by [56],
2.8. Problem Formulation and Optimization
The proposed hybrid energy generation model is considered as an optimization problem, where the target is to minimize NPC by ensuring maximum utilization of RESs. The number of solar PV, biomass generator, battery bank, and converter is optimized according to the operational constraints and load demands. Specifically, each watt of generated energy should be utilized. For an effective performance of the optimization process to formulate the optimal hybrid power system, a number of parameters for system components, such as operational lifecycle, component efficiency, and associated cost, are taken into account. At each hour, using the HOMER optimization software, we determine how to satisfy the electricity demand using HetNet infrastructure, including losses, as well as provide backup power. It also calculates the BS load demand to the input power supply in each iteration, and the optimization phase follows all simulations. Finally, we identify the least expensive component combination that meets the BS load while ensuring no power shortage. The following optimization process was maintained during the simulation process. For macro and micro BSs:
minimize NPC
subject to EPV + EBG > EBS
EPV + EBG + Ebatt = EBS + El,
EShare = EGen + Ebatt − EBS − El − EExcess
Ebattmin ≤ Ebatt ≤ Ebattmax,
For pico and femto BSs:
where is the sum of converter losses, battery bank losses, and surplus energy transfer losses in kWh/yr. For the macro and microcell configuration, the hybrid solar PV and BG can support the BS energy demand, as mentioned in (18b). In the case of pico and femtocell configuration, the surplus energy transfer losses is zero and the standalone solar PV system can fulfill the BS entire energy requirement, as mentioned in (19b). The constraint in (18c) and (19c) ensures that the annual energy obtained by the renewable energy sources carries the annual BS energy consumption with the associated losses. The amount of surplus electricity is preserved for future use during the abnormal condition or shared among the neighboring BS due to scarcity of energy, and is described by the constraint (18d). Constraint (18e) and (19d) indicates that the battery bank storage capacity should not exceed the maximum limit and does not reach below the threshold level.
minimize NPC
subject to EPV > EBS
EPV + Ebatt = EBS + El,
Ebattmin ≤ Ebatt ≤ Ebattmax,
2.9. Resource Scheduling Algorithm
A resource scheduling algorithm attempts to make an appropriate apportionment of the resources with fulfilling application-wise QoS requirements. Some general requirements are optimized with spectral efficiency ensuring cell throughput, fairness, minimum interference for cell-edge users, and optimum load balancing. PF is one of the well-known schedulers, especially for NRT applications. It deals with two competing qualities, and not only maximizes the total throughput of the network but also ensures at least a minimal level of service. However, better latency, user energy efficiency, and application wise priority cannot be assured by PF. LTE establishes separate resource blocks (RBs) for RT and NRT applications. The RT application includes voice, live streaming video, and online gaming. The NRT application includes buffered streaming video, web browsing, e-mail, chat, FTP, and P2P file sharing. The BSs are fully conscious of the bearers.
In our proposed model, the available resources are divided into two parts for the use of RT and NRT services depending on the data rate demand of the users. For RT applications, resources can be scheduled using the existing VT-M-LWDF scheduler, M-LWDF scheduler, or any other popular solution that considers the packet delay. In the proposed model, the main focus has been given on NRT applications. A weighted proportional fair (WPF) scheduling algorithm has been proposed for NRT applications; where the DRX mechanism has been applied, weight will be determined based on the applications and queue size.
The amount of pending data or queue size can be used to indicate the data rate requirement. represents the priority of the user applications. is the inactivity timer that represents the way of power-saving for the resource allocation. In the case of the downlink (DL), the queue size is already known to BS. On the other side, the UE sends the pending data status or buffer status report (BSR) to the BS in the case of uplink (UL). BSR index represents the buffer content in between a minimum and a maximum range. In our proposed model, is the average of the maximum and minimum buffer size, as follows:
The DRX mechanism is incorporated in LTE to attain power-saving and prolonged battery life of the UE. Algorithm 1 is proposed only for NRT applications, so that significant improvement in power saving attained the allowing limited latency. In the algorithm, a novel DRX model has been proposed. NRT applications can support more delay than RT applications. According to [60], a permissible delay for NRT applications after the re-transmission delay is 107ms. UE has to be in the ‘ON’ state all the time even if there is no traffic. It is because UE has to keep listening or be ready to decode the Physical Downlink Control Channel (PDCCH). The Physical Downlink Control Channel (PDCCH) is primarily used to carry the scheduling information to individual UEs, i.e., resource assignments for uplink and downlink data and control information. However, continuous ON state increases battery consumption drastically. DRX is a solution to address this problem. Algorithm 1 describes the proposed communication procedure between BS and NRT applications. We assumed an M/G/1 queue, where the packet arrival rate () follows the Markovian process (Poisson process), and the service rate () follows a general distribution. Traffic intensity can be calculated from . To calculate the percentage of power saving, we have used the following equation, which has been modified from [61].
| Algorithm 1 Algorithm for the communication between the ith NRT application-based device and BS |
| 1: Initialize: , , , , , , , , , , and 2: for //k is the number of total users 3: while //data transfer request is present between i user and BS 4: Start data transfer () 5: update 6: enable inactivity timer () 7: if && //more data to transmit within the inactivity timer 8: Go to Step 3 9: else 10: enable 11: for 12: for 13: if && 14: Go to Step 3 15: else 16: 17: for 18: if && 19: Go to Step 3 20: else 21: 22: |
In our proposed model, an algorithm has also been presented based on PSM and eDRX, which are two solutions to optimize the device power consumption for the NB-IoT technologies for delay insensitive but energy sensitive applications. As soon as an end device is powered on, it goes for the frequency and time synchronization with some necessary configurations from the network. This Radio Resource Control (RRC) connection setup is an important step, after which the end device can exchange data with the network. When the RRC connection is established, the device is said to be in the RRC Connected state. In NB-IoT, there are two RRC states for devices, namely, RRC Connected and RRC Idle, as shown in Figure 6. When the device releases its active RRC connection, it moves to the RRC Idle state. The RRC connected state consists of the mobile originated (MO) or mobile terminated (MT) data transfer, tracking area update (TAU), and an inactivity timer. In this state, the device consumes more energy, as it obtains dedicated bearers established to begin the data transmission and needs to monitor the DL channel. The expiration of the inactivity timer makes the device switch from the RRC Connected to RRC Idle state. In the RRC Idle state, NB-IoT defines two power-saving schemes, i.e., eDRX and PSM. A summary of PSM and eDRX are described below, and the details of the RRC states are illustrated in Figure 6.
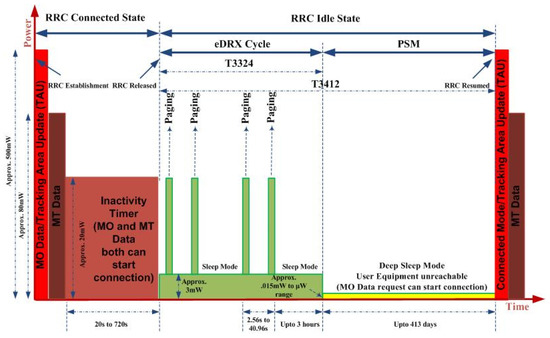
Figure 6.
Illustration of user device’s behavior in NB-IoT (PSM and eDRX).
2.9.1. Edrx (Extended Discontinuous Reception) Model
eDRX is an extended form of DRX to keep on longer in the idle or power-saving state between two pages. At first, it starts with some short active cycles and then enters into the long deep sleep cycles, which minimize the device power consumption. In the eDRX mode, devices are periodically available for DL or MT data transfer requests. From LTE Release 13 specifications, it is defined that the eDRX idle mode can be extended up to 3 h.
2.9.2. Psm (Power Saving Mode)
PSM permits UE to reduce power consumption to the most bottom level by transferring its circuitry into a deep sleep mode. However, still, the device is registered to the system. DL or MT data transfer requests cannot be scheduled in this mode because the device is inaccessible for the BS. On the other hand, for MO or UL data, the transfer device leaves the PSM mode at an instance. Moreover, it also wakes up if a request comes for a routing area update (RAU) or TAU. After every entry of PSM mode, at first the device runs some active timers when MT data transfer can also be scheduled by monitoring the paging channel. For NB-IoT applications, the battery lifetime is a vital issue. On the other side, the downlink latency does not have any significant importance for NB-IoT applications and infrequent paging is sufficient to monitor it. For NB-IoT applications, the PSM cycle timer supports deep sleep up to 413 days.
In this paper, a scheduling algorithm for the communication between BS and NB-IoT application devices using PSM and eDRX is proposed in Algorithm 2. After the end of the data transfer, an inactivity timer will start. If the inactivity timer can reach its end without any data packet arrival, the eDRX cycle will start. The eDRX cycle consists of some short and some extended long cycles. If the eDRX cycle can run-up to the end, the PSM will start. The UL data transfer request of TAU during the sleep period can restart the full cycle by starting the ON or data transfer active period. DL/MT data transfer can start the ON period if and only if it can reach the inactivity timer or paging period. To calculate the percentage of power saving, we have used the following equation, which has been modified from [61].
| Algorithm 2 Algorithm for the communication between ith IoT device and BS |
| 1: Initialize: , , , , , , , , , , , , and 2: for 3: while 4: Start data transfer () 5: update 6: enable inactivity timer () 7: if && 8: Go to Step 3 9: else 10: enable 11: for j=1:N 12: check in every interval 13: if 14: Go to Step 3 15: else 16: j=j+1 17: check in every interval 18: if && 19: Go to Step 3 20: else 21: Continue () 22: enable Power Saving Mode ( 23: if 24: Go to Step 3 25: else 26: Continue ( 27: |
3. System Configurations and Mathematical Model
In this section, all the input data or parameters, necessary for HOMER and Matlab simulation, are briefly described.
3.1. System Configurations
3.1.1. Solar PV
The average daily solar radiation profile of the selected area throughout a year is illustrated in Figure 7.
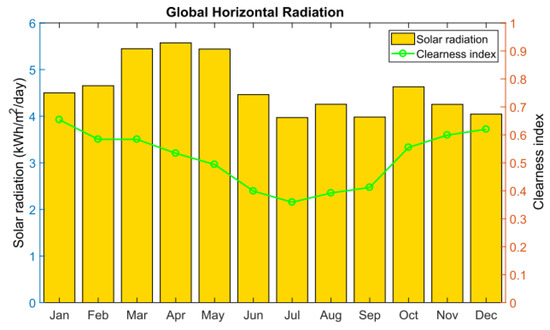
Figure 7.
Solar radiation profile and clearness index of the study region.
The total amount of energy generation using solar PV panels can be calculated by HOMER using the following equation [56,62]:
3.1.2. BG
The average biomass available in the selected area is 9 tons/day [63]. The output power of the BG can be expressed as follows [63,64].
The amount of renewable energy harvested by the biomass generator can be expressed as follows [63,64]:
where is the capacity factor that is the ratio between the actual and maximum possible electrical energy.
3.1.3. Battery
In this work, the Trojon L16P battery model has been used due to its large size, low cost, high reliability, low self-discharge, and low maintenance requirements. Battery lifetime () is a directly related variable for the cost analysis, which can be calculated using the following equation [28]:
3.2. Simulation Setup for HOMER and Resource Scheduling
The proposed hybrid power supply system has been focused on meeting the power consumption of the BSs of a HetNet. As a result, estimating the proper dimensions of macro, micro, pico, and femto-cell power consumption is important. The total power consumption of a BS is mainly dependent on traffic demand; we formulated the discrete power consumption considering 10MHz bandwidth from paper [65] using the following equation. Then, on that basis, we designed and optimised the overall power generation and sharing architecture, considering the energy, cost and environmental aspects. The assumed traffic demand profile for the proposed model is shown in Figure 8.
where, .
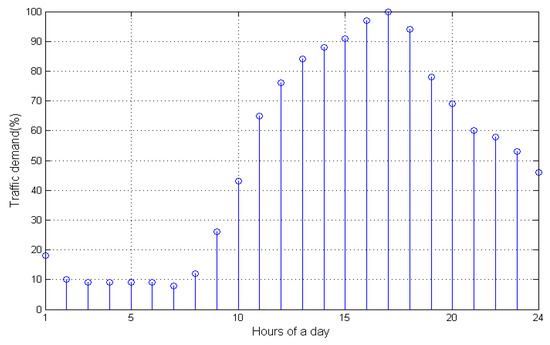
Figure 8.
Assumed traffic profile for the simulation.
The discrete power consumption by the macro, micro, pico, and femto cellular LTE BSs considering the 10 MHz bandwidth are obtained from [65]. It implies that a smaller BS needs lower power due to the smaller radiated power and coverage area.
The power consumption of the BSs that is directly connected to the related loss factors, and can be calculated as [65,66]:
where , and , respectively, refer to the baseband, power amplifier and RF power consumption scaled with the transmission bandwidth.
We first study the techno-economic feasibility of the proposed system. In the simulation setup, we assume a project duration is 20 years and the yearly interest rate is 6.75% [67]. The HOMER platform was used for this study. The system architecture of the proposed heterogeneous network is shown in Figure 9 and Figure 10. The initial values of the main parameters are listed in Table 3.
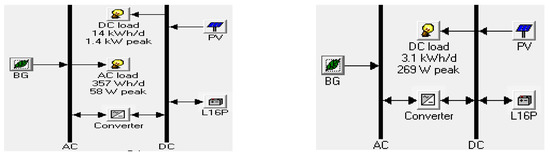
Figure 9.
System architecture in the HOMER platform for macro (left) and micro (right) BSs.
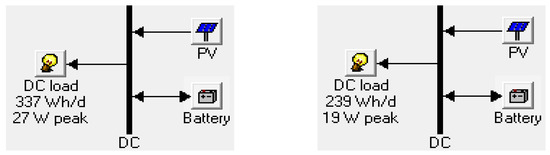
Figure 10.
System architecture in the HOMER platform for pico (left) and femto (right) BSs.
Table 3.
Key parameters and their values for HOMER simulation setup [63,64].
Monte-Carlo simulation parameters has shown in Table 4. For the simulation setup of Algorithm 1, the assumed value of the parameters are shown in Table 5. The parameters for the simulation setup of Algorithm 2 are listed in Table 6.
Table 4.
Key parameters for MATLAB-based Monte-Carlo simulation setup [68].
Table 5.
Simulation parameters for Algorithm 1.
Table 6.
Simulation parameters for Algorithm 2.
4. Results’ Analysis
The simulation output from HOMER was thoroughly analyzed using the MATLAB simulation from the following key perspectives: (i) Optimization standard, (ii) energy generation and consumption, (iii) energy sharing, (iv) economic, (v) energy efficiency, (vi) power saving for NRT and IoT devices, and (vii) carbon footprint.
4.1. Optimization Standard
An optimal size of the components used for the proposed hybrid RES for the HetNet is summarized in Table 7. The proposed system is based on off-grid energy sharing and in terms of the consumed energy, the macro, and micro BSs will be served by solar PV and BG with battery storage and converter. Due to small energy requirements, pico and femto BSs will only be aided by solar PV and backup storage devices, and, as a consequence, no converter is needed to support the DC load. The proposed model has been simulated on the HOMER platform, taking the dynamic behavior of traffic and RES into account. It is recognized that a higher value of the component size is required for the bigger cell sizes due to the higher amount of energy consumption. With the change of system bandwidth, the optimal size of the BG, battery units, and converters are remaining unchanged. On the other hand, the optimal size of the solar PV increase with the increment of system BW for both macro and micro BS configurations to cope up with the higher energy demand. As such, the proposed system is compatible under dissimilar BS network requirements.
Table 7.
An optimal size of the hybrid solar PV/BG system.
4.2. Energy Generation and Consumption
The yearly energy consumption (DC and AC load) including excess energy for the macro, micro, pico, and femto-cell networks under 10MHz bandwidth are summarised in Table 8. This excess energy is used as a backup, either for charging the battery or for sharing in need of other BSs. DC load is the main energy consumer. It is assumed that a bulb as an AC load is the only connected macro BS.
Table 8.
Energy consumption breakdown for 10 MHz system bandwidth.
The individual energy generation breakdown of the proposed off-grid hybrid system is illustrated in Figure 11. For the simulation, the dynamic profile of the RES (Figure 3 and Figure 7) has been considered. Here, the results are only shown for the 10MHz system BW. For all cases, the solar PV is the main energy contributor. In the proposed model, macro BSs can share energy to another macro, micro, pico, and femto BSs. Consequently, more excess electricity has been generated in the case of the macro BSs. The rest of the BSs use the excess electricity as a backup in case of a shortage or outage of RES. In the case of shortage, these BSs can share excess electricity only to the mother macro BS.
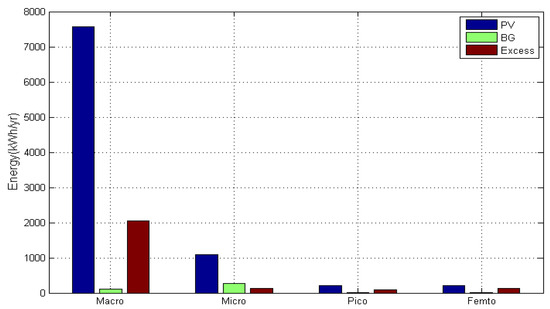
Figure 11.
Individual energy breakdown for 10 MHz system bandwidth.
The periodic monthly statistics of the power generation by the different RES for different BSs are separately illustrated in Figure 12 and Figure 13. Solar PV is the main contributor throughout the year and BG contributes to that period when solar intensity is relatively low. It is clear that the proposed system can minimize the capital costs and carbon contents because the solar PV generates a large of consumed energy for the overall heterogeneous setup. On the other hand, the system is also reliable because of the presence of BG and the energy sharing technique.
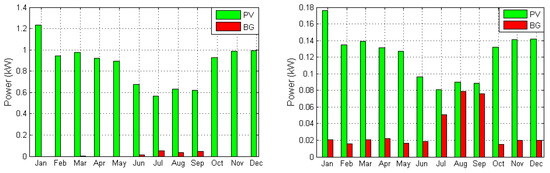
Figure 12.
Monthly power contribution by the RES under 10 MHz for macro (left) and micro (right) BS.
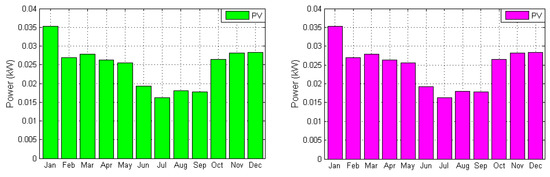
Figure 13.
Monthly power contribution by the RESs under 10 MHz for pico (left) and femto (right) BS.
A broad evaluation of the annual energy contributed by the different sources under various system BWs has been illustrated in Figure 14 and Figure 15, where it is clear that with an increase in system bandwidth, the generation is increased. If the solar PV cannot bear the load because of cost efficiency, BG will take its place. In the case of pico and femto-cells, with the increment of the system BW, the excess electricity will decrease to cope up with the load. It is better for the system performance, as the setup will not change under different system BWs.
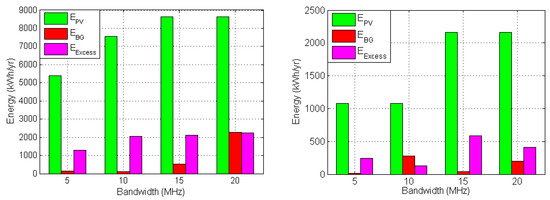
Figure 14.
Energy breakdown under different system BW for the macro (left) and micro (right) BS.
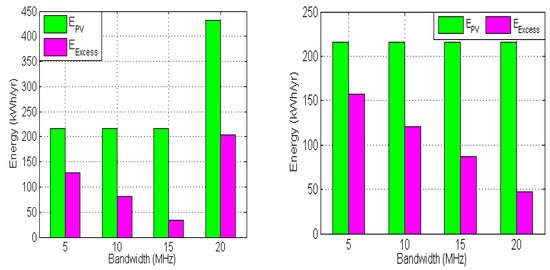
Figure 15.
Energy breakdown under different system BW for the pico (left) and femto (right) BS.
4.3. Economic
The requirement of the total battery for the proposed model has increased with the growth of the total load. As macro BSs has to deal with the highest load, a total of 32 of the batteries for the energy storage purpose is required. The number of batteries required for micro, pico, and femtocells are 16, 8, and 8, respectively, to back the load request of the BS throughout the shortage or absence of RES. The number of batteries are not feasible less than 8 because the proposed model uses the “Trojan L16P” battery. The DC bus bar voltage is 48V. The terminal voltage of each battery is 6V. HOMER calculates the battery bank autonomy using Equation (1). The annual battery bank autonomy under different network configurations are illustrated in Figure 16. The battery bank autonomy is inversely proportional to the BS load or energy demand. For the same reason, higher system bandwidth reveals lower battery autonomy. For a reliable and cost-effective supply system, these results are justified.
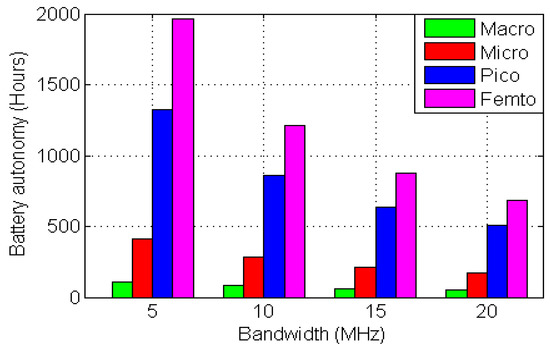
Figure 16.
Battery autonomy under different system bandwidth.
Bio-feedstock is the raw material of BG. In our proposed system, only macro and micro BSs are connected to both Solar PV and BG, so they are liable for bio-feedstock consumption. Bio-feedstock consumption is linearly proportional to the amount of energy harvested from the BG, and for our proposed model, the annual consumption has shown in Figure 17. It is clear from the previous energy breakdown figures that total energy consumption has proportionally been increased with the increases in BW, but BG is not the only source for the energy generation of macro and micro BSs. As a result, bio-feedstock consumption has not proportionally increased with the BW, though macro BSs’ average bio-feedstock consumption is far more than micro BSs.
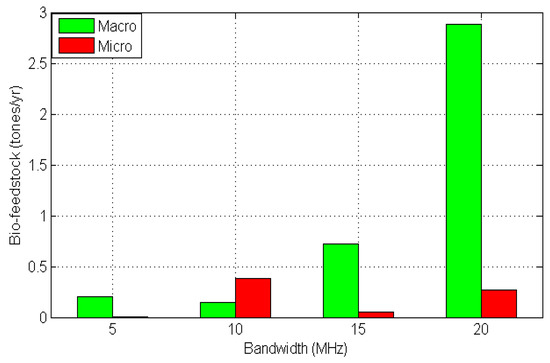
Figure 17.
Bio-feedstock consumption.
4.4. Energy Sharing
According to the flow diagram in Figure 5, excess energy has been shared through a low resistive physical line among the adjacent BSs. The value of the resistance of the interconnected line has been taken from the American Wire Gauge (AWG) standard conductor size table, which is 3.276 /km [59]. The inter-cell distance is calculated as times of the cell radius (i.e., R) and the cell radius is 1000m for = 20 W. The total resistance of the transmission line between the two BSs is 5.67 . We use the cell radius of macro, micro, pico and femto BSs as 1000m, 500m, 200m and 10m, respectively. This energy sharing among the BSs for the heterogeneous network ensures the optimum use of RES and avoids any type of blackout or power shortage. The percentage of energy savings with the total amount of shared energy for different system bandwidth and sharing policies is demonstrated in Table 9 and Table 10, respectively. The results demonstrate that around 10% to 21% of the total energy can be saved every year by applying the proposed macro-macro energy-sharing technique. The proposed system ensures energy efficiency () under dynamic traffic profile and can save a considerable amount of energy loss by the energy sharing technique.
Table 9.
Annual energy savings due to energy sharing mechanism between two adjacent macro BSs.
Table 10.
Amount of shared energy and percentage of energy-saving for inter BS sharing mechanism under 10 MHz.
A critical analysis of the associated costs to the proposed system has been represented in this section. These analyses have been conducted via the HOMER optimisation software to propose a reliable and optimum cost-efficient green supply system. Nominal cash flow summary for the proposed system of macro, micro, and pico BSs have been respectively shown under the 10MHz system BW in Figure 18, Figure 19 and Figure 20. The cash flow summary of femto BS is identical to pico BS. For all the demonstrated configurations, the capital cost (CC) has the highest value, and the replacement cost (RC) has the second-highest value. For macro BS, CC for the PV array is $3,500 (panel size 3.5 kW, cost $500/0.5 kW), operation and maintenance cost (OMC) is $378 (panel size 3.5 kW, cost around $10/1 kW), RC is zero because the PV array has a lifespan of 25 years, which is more prolonged than the project lifespan. The salvage value for that extra five years is $190. For other BSs, different costs of PV array have been calculated in the same fashion. For both macro and micro BS configurations, a single BG is required, which costs $660. OMC and fuel cost (FC) vary in generation. The salvage value is inversely proportional to the BG use. The number of batteries is always a multiple of 8 because the DC bus bar voltage is 48V (Each battery’s nominal voltage is 6V). CC for each battery is $300. RC depends on battery lifetime. Battery lifetime can be calculated from Equation (24). RC of each battery is also $300. Less use of battery extends the battery lifetime. Higher battery lifetime minimizes the overall RC of the battery for the system. The OMC of the battery is $10/unit/year. Thus, 32 batteries cost $320 per year. However, due to the discount factor, this costs less in the long run. The CC, RC, and OMC of the converter depend upon the quantity of use. CC and RC are both $.4/Watt and OMC is $.01/Watt/year. More BG generation costs more for the converter. For pico and femto BSs, there is no BG need for the system. As a consequence, no converter is needed either. In comparison with other components, the battery bank is responsible for the highest amount of CC, RC, and OMC in all configurations.
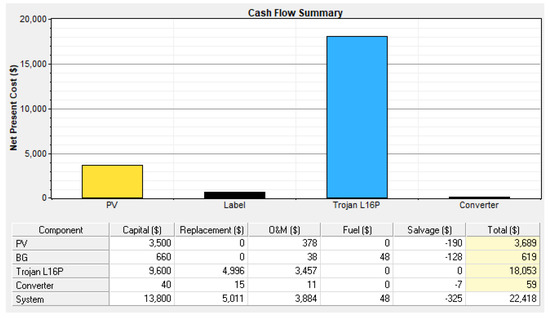
Figure 18.
Cash flow summary of the proposed system for macro BS.
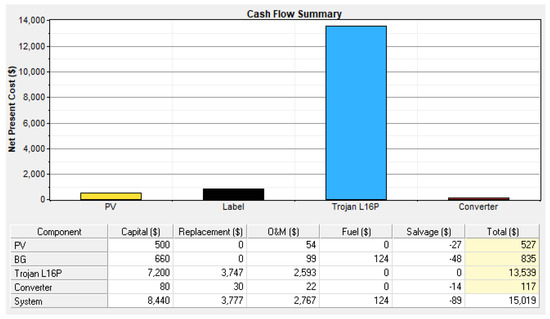
Figure 19.
Cash flow summary of the proposed system for micro BS.
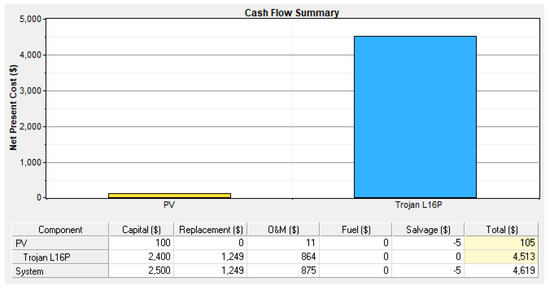
Figure 20.
Cash flow summary of the proposed system for pico BS.
Cost is linearly proportional to the load or energy demand. The Cost of Electricity (CoE) is generally referred to as a ‘usage charge’ measured in kilowatt-hours (kWh). A widespread comparison of the NPC and Cost of Electricity (CoE) under different network configurations has been illustrated in Figure 21 and Figure 22, respectively. With the increment of the system BW, the load or energy demand has increased. As a consequence, a clear surge has been observed in NPC. In contrast, a higher rate of service ensures a lower CoE. In terms of NPC, pico and femtocell configurations have demonstrated an identical value due to a low load but identical system requirements. However, the excess electricity has been used automatically for sharing (only for macro and micro) or storage purposes based on the real-time requirement. As a result, the CoE is not same in the case of pico and femto BSs.
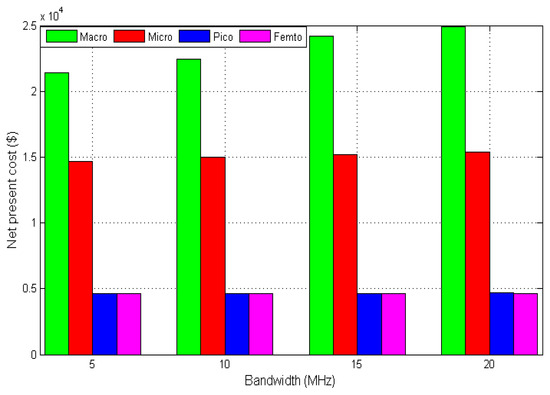
Figure 21.
NPC under different system bandwidth.
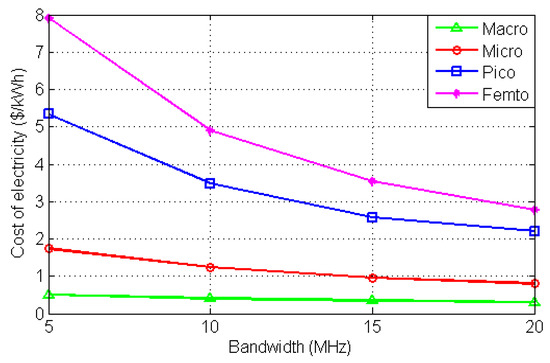
Figure 22.
CoE under different system bandwidth.
4.5. Energy Efficiency
User throughput and the system’s energy efficiency are two vital variables in the case of performance analysis of the system model. Daily throughput variation under different BS configurations has been illustrated in Figure 23, which is in line with the traffic intensity. To evaluate the throughput and energy efficiency performance under a different system bandwidth, a two-tier LTE cellular network has been considered. With the increment of system bandwidth, both throughput and energy efficiency has increased. With the increment of cell size, the required throughput has been achieved for all the cases. In the case of energy efficiency, the small cell has demonstrated a better output. These performances are illustrated in Figure 24 and Figure 25.
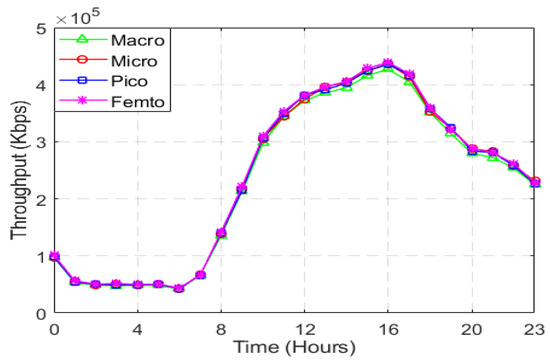
Figure 23.
Throughput performance for two-tier HETNET.
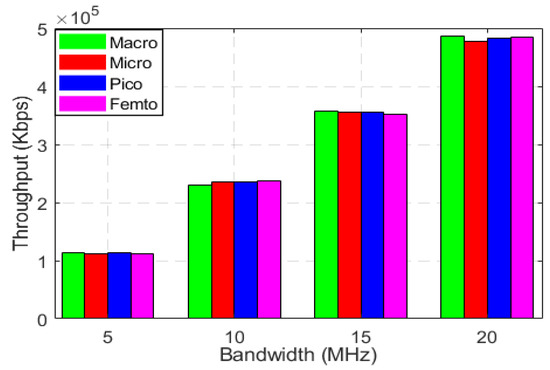
Figure 24.
Throughput performance under different system bandwidths.
Figure 25.
Energy efficiency under different system bandwidths.
4.6. Power Saving Issue for NRT and IoT Devices
Applying the proposed resource scheduling algorithm for NRT applications, the system has achieved better power saving with a permissible delay, which has shown in Figure 26 and Figure 27. Although for N = 1, when the no. of the short cycle is 1, the existing model shows better power-saving only for a very low packet arrival rate. However, for that specific case, the downlink latency does not permit resource allocation. In all other cases, our proposed scheduling model shows a better performance than the existing model. Overall, it is observed that there is a trade-off between the downlink latency (delay) and the rate of power-saving.
Figure 26.
Percentage of power-saving over packet arrival rate (Packets/ms).
Figure 27.
Downlink latency over packet arrival rate (Packets/ms).
On the other hand, simulating the proposed eDRX and PSM-assisted resource scheduling algorithm for IoT applications, the percentage of power-saving over packet arrival rate is shown in Figure 28. From Figure 28, it is clearly observed that, the more the eDRX sleep mode (T3324) timer runs, the more power it will save.
Figure 28.
Percentage of power saving vs. packet arrival rate (IoT applications).
4.7. Carbon Footprints
To make a sustainable future, one of the sustainable development goals is known as SDG7, which targets affordable and clean energy. The proposed energy generation is dependent mostly upon solar PV, which does not discharge any carbon content. The emission of total carbon contents from the proposed model under 10MHz BW are shown in Table 11. Although to achieve reliability, BG has been added to the system in the case of macro and micro BS, but it can minimize the carbon emission indirectly by reducing the burning of rice husk, as shown in Table 12. It is worth mentioning that rice husk can be treated as the primary resource of biomass, which is generally used for cooking purposes in the proposed rural areas. However, generation from BG is directly proportional to the emission, which has been demonstrated in Figure 29. This figure shows the GHG emissions produced by the macro, micro, pico, and femto BSs under a dissimilar system bandwidth. With the increment of system BW, the data of emission demonstrate a clear proportional result with the bio feedstock consumption for BG. The proportional increment of GHG based on the operating hours of BG is shown in Figure 30. GHG Emissions from different primary resources of BG is shown in Table 12. Overall, the proposed system is an example of the maximum use of clean energy effectively.
Table 11.
Carbon contents for the hybrid solar PV/BG system under 10 MHz bandwidth.
Table 12.
GHG Emissions from different primary resources of BG [69].
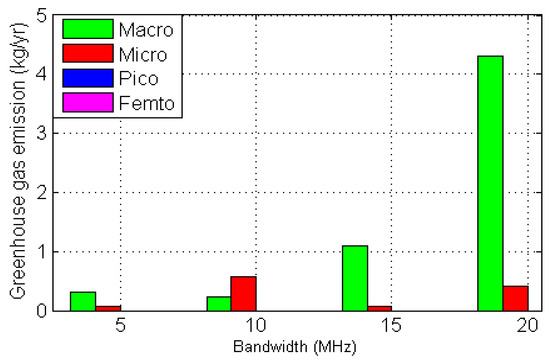
Figure 29.
GHG emission for different system bandwidth.
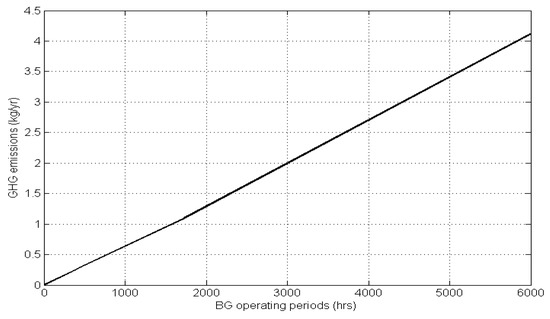
Figure 30.
GHG emissions concerning BG operating hours.
4.8. Feasibility Analysis
Though it has been claimed in the literature, standalone solar PV and hybrid solar PV/WT supply systems perform better [70,71,72]. It is less reliable since it depends on a single renewable energy source. The hybrid solar PV/WT system is not a reasonable solution because of the unfavorable wind profile in the chosen area. Due to the massive volumes of fossil fuel burned and the high fuel delivery costs in remote places, the standalone DG and hybrid solar PV/DG perform poorly, as we had expected. A hybrid solar PV/BG system is a desirable option for the isolated off-grid places, where the biomass energy potential is enough despite releasing a very small quantity of carbon dioxide. Additionally, by limiting the biomass burning for cooking purposes, the suggested approach indirectly lowers the greenhouse gas emissions.
5. Conclusions
In this paper, a green energy-supplied off-grid heterogeneous cellular network along with IoT devices has been proposed and thoroughly analyzed. The feasibility of the proposed system has been evaluated through various key performance parameters, such as the per unit electricity generation cost, throughput, energy saving, energy efficiency, and carbon footprints. To find out the optimal criteria, wide-ranging simulations are accomplished using the HOMER optimization software under different network conditions. From the simulation results, it is well established that locally available RESs are sufficient for powering the heterogeneous cellular network without any external support. The proposed system shows its cost efficiency by endeavoring the minimum NPC and CoE. In addition, compared to other power supply solutions, the proposed system leads to negligible carbon emissions (0% form solar PV and around 0.2% form BG) that ensures the improved eco-sustainability through green engineering solutions. Moreover, adequate energy storage devices and proper energy co-operation techniques enhance the system’s reliability by maintaining the zero percent shortage/outage of energy. Quantitative results also reveal that the inter-BSs green energy-sharing mechanism system can save energy up to 27.98%. Furthermore, the throughput and energy efficiency analysis guarantee the fulfillment of the spectral efficiency and data rate requirement through the efficient usage of energy. Finally, the proposed resource scheduling algorithm for the NRT application achieved a large amount of power-saving through the permissible delay in comparison with the existing model. The novel eDRX and PSM-assisted power-saving algorithm achieves a better battery lifetime for IoT devices. One future improvement of this work can be an autonomous droop controlled energy sharing policy. Additionally, for NRT and IoT applications, the proposed sleep mode algorithms can be optimized for specific applications.
Directions for Further Research
At the current stage of the proposed research, the developed hybrid solar PV and fuel cell-focused macro cellular network without energy sharing mechanisms have much room for being improved and extended in several interesting directions. Future extensions of this research work are summarized below:
- Developing a prototype system to ensure the effectiveness of the hybrid solar PV/H/ FC-based green mobile communication.
- Developing a generic algorithm and control system for sharing green energy across surrounding BSs and industry/power grid by maximizing the use of renewable energy in the heterogeneous cellular networks.
- Developing a cell zooming technique for running the heterogeneous cellular networks based on the amount of green energy generated and the rate of incoming traffic.
- For enhancing energy efficiency performance, the renewable energy cooperation of cloud radio access network (C-RAN) heterogeneous networks paradigm may be examined.
- For a better compromise between data rate and fairness, an efficient resource and energy scheduling technique can be implemented.
Additionally, Australia can be included in this study in the future. Australia generated 29% of its total electricity from renewable sources in 2021. Over the past ten years, renewable electricity generation has more than doubled. Australia has a total of 171.2 PJ of biomass and 99.8 PJ of solar PV accessible as energy sources [73].
Author Contributions
Conceptualization, K.Z.I., M.S.H. and B.M.R.A.; methodology, B.M.R.A. and K.Z.I.; software, K.Z.I.; validation, M.S.H. and F.S.; formal analysis, M.S.H.; investigation, G.M.S. and F.S.; resources, M.S.H.; data curation, B.M.R.A.; writing—original draft preparation, K.Z.I. and M.S.H.; writing—review and editing, K.Z.I., G.M.S. and F.S.; visualization, K.Z.I.; supervision, F.S. and G.M.S.; project administration, F.S. and G.M.S.; funding acquisition, F.S. and G.M.S. All authors have read and agreed to the published version of the manuscript.
Funding
There is no external fund for this work.
Data Availability Statement
Not Applicable.
Conflicts of Interest
The authors declare no conflict of interest.
References
- Alsharif, M.H. Techno-Economic Evaluation of a Stand-Alone Power System Based on Solar Power/Batteries for Global System for Mobile Communications Base Stations. Energies 2017, 10, 392. [Google Scholar] [CrossRef]
- Ericsson Mobility Report 2020. Available online: https://www.ericsson.com/4adc87/assets/local/mobility-report/documents/2020/november-2020-ericsson-mobility-report.pdf (accessed on 5 February 2021).
- World’s Leading Mobile Operators to Disclose Climate Impacts as Part of New GSMA-Led Climate Action Roadmap. Available online: https://www.gsma.com/latinamerica/worlds-leading-mobile-operators-to-disclose-climate-impacts-as\-part-of-newgsma-led-climate-action-roadmap/ (accessed on 25 January 2021).
- World Energy Consumption. Available online: https://en.wikipedia.org/wiki/World_energy_consumption (accessed on 25 January 2021).
- World Energy Outlook 2020. Available online: https://www.iea.org/reports/world-energy-outlook-2020 (accessed on 9 February 2021).
- Our World in Data. 2016. Available online: https://ourworldindata.org/grapher/years-of-fossil-fuel-reserves-left?time=earliest.latest (accessed on 28 January 2021).
- Dutta, S.; Geiger, T.; Lanvin, B. The Global Information Technology Report: ICTs for Inclusive Growth; World Economic Forum: Geneva, Switzerland, 2015. [Google Scholar]
- Hossain, M.S.; Jahid, A.; Ziaul Islam, K.; Alsharif, M.H.; Rahman, M.F. Multi-Objective Optimum Design of Hybrid Renewable Energy System for Sustainable Energy Supply to a Green Cellular Networks. Sustainability 2020, 12, 3536. [Google Scholar] [CrossRef]
- Chamola, V.; Sikdar, B. Solar powered cellular base stations: Current scenario, issues and proposed solutions. IEEE Commun. Mag. 2016, 54, 108–114. [Google Scholar] [CrossRef]
- Ismail, M.; Zhuang, W.; Serpedin, E.; Qaraqe, K. A Survey on Green Mobile Networking: From The Perspectives of Network Operators and Mobile Users. IEEE Commun. Surv. Tutor. 2015, 17, 1535–1556. [Google Scholar] [CrossRef]
- Share of Rural Population in Bangladesh from 2009 to 2018. Available online: https://www.statista.com/statistics/760934/bangladesh-share-of-rural-population/#:~:text=In%202018%2C%20approximately%2063.37%20percent,were%20residing%20in%20rural%20areas (accessed on 4 February 2021).
- Bangladesh Increases Rural Access to Electricity Five-Fold in Two Decades. Available online: https://www.dhakatribune.com/bangladesh/power-energy/2019/04/21/bangladesh-increases-rural-access-to-electricity-five-fold-\in-\two-decades#:~:text=Rural%20areas%20in%20Bhutan%2C%20Pakistan,India%20(78%20percent).%E2%80%9D” (accessed on 28 January 2021).
- Mobile Phone Subscribers in Bangladesh October. 2021. Available online: http://www.btrc.gov.bd/content/mobile-phone-subscribers-bangladesh-october-2021, (accessed on 28 December 2021).
- Achieving Mobile-Enabled Digital Inclusion in Bangladesh. Available online: https://www.gsma.com/mobilefordevelopment/resources/achieving-mobile-enabled-digital-inclusion-in-bangladesh/ (accessed on 28 December 2021).
- Mobile Network Experience Report July 2021. Available online: https://www.opensignal.com/reports/2021/07/bangladesh/mobile-network-experience (accessed on 28 December 2021).
- Extending the Grid: Bangladesh Market Analysis. Available online: http://www.gsma.com/mobilefordevelopment/wp-content/uploads/2013/03/GPM-MarketAnalysis-Bangladesh.pdf (accessed on 28 December 2021).
- Alsharif, M.H.; Kim, J.; Kim, J.H. Green and sustainable cellular base stations: An overview and future research directions. Energies 2017, 10, 587. [Google Scholar] [CrossRef]
- Hossain, M.S.; Jahid, A.; Rahman, M.F. Dynamic Load Management Framework for Off-Grid Base Stations with Hybrid Power Supply. In Proceedings of the 2018 4th International Conference on Electrical Engineering and Information Communication Technology (iCEEiCT), Dhaka, Bangladesh, 13–15 September 2018; pp. 336–341. [Google Scholar] [CrossRef]
- Dhall, R.; Agrawal, H. An Improved Energy Efficient Duty Cycling Algorithm for IoT based Precision Agriculture. Procedia Comput. Sci. 2018, 141, 135–142. [Google Scholar] [CrossRef]
- Halder, P.; Paul, N.; Joardder, M.; Sarker, M. Energy scarcity and potential of renewable energy in Bangladesh. Renew. Sustain. Energy Rev. 2015, 51, 1636–1649. [Google Scholar] [CrossRef]
- Alam Hossain Mondal, M.; Sadrul Islam, A. Potential and viability of grid-connected solar PV system in Bangladesh. Renew. Energy 2011, 36, 1869–1874. [Google Scholar] [CrossRef]
- Huda, A.; Mekhilef, S.; Ahsan, A. Biomass energy in Bangladesh: Current status and prospects. Renew. Sustain. Energy Rev. 2014, 30, 504–517. [Google Scholar] [CrossRef]
- Jahid, A.; Hossain, M.S. Feasibility analysis of solar powered base stations for sustainable heterogeneous networks. In Proceedings of the 2017 IEEE Region 10 Humanitarian Technology Conference (R10-HTC), Dhaka, Bangladesh, 21–23 December 2017; pp. 686–690. [Google Scholar] [CrossRef]
- Almasoud, A.; Gandayh, H.M. Future of solar energy in Saudi Arabia. J. King Saud-Univ.-Eng. Sci. 2015, 27, 153–157. [Google Scholar] [CrossRef]
- Jahid, A.; Islam, M.S.; Hossain, M.S.; Hossain, M.E.; Monju, M.K.H.; Hossain, M.F. Toward Energy Efficiency Aware Renewable Energy Management in Green Cellular Networks With Joint Coordination. IEEE Access 2019, 7, 75782–75797. [Google Scholar] [CrossRef]
- Alsharif, M.; Nordin, R.; Ismail, M. Energy optimisation of hybrid off-grid system for remote telecommunication base station deployment in Malaysia. J. Wirel. Com. Netw. 2015, 64, 1–15. [Google Scholar] [CrossRef]
- Hossain, M.; Rahman, M.F. Hybrid solar PV/Biomass powered energy efficient remote cellular base stations. Int. J. Renew. Energy Res. (IJRER) 2020, 10, 329–342. [Google Scholar]
- Hossain, M.S.; Ziaul Islam, K.; Jahid, A.; Rahman, K.M.; Ahmed, S.; Alsharif, M.H. Renewable Energy-Aware Sustainable Cellular Networks with Load Balancing and Energy-Sharing Technique. Sustainability 2020, 12, 9340. [Google Scholar] [CrossRef]
- Jahid, A.; Monju, M.K.H.; Hossain, M.E.; Hossain, M.F. Renewable Energy Assisted Cost Aware Sustainable Off-Grid Base Stations With Energy Cooperation. IEEE Access 2018, 6, 60900–60920. [Google Scholar] [CrossRef]
- Ahmed, F.; Naeem, M.; Ejaz, W.; Iqbal, M.; Anpalagan, A.; Kim, H.S. Renewable Energy Assisted Traffic Aware Cellular Base Station Energy Cooperation. Energies 2018, 11, 99. [Google Scholar] [CrossRef]
- Al-Ghussain, L.; Samu, R.; Taylan, O.; Fahrioglu, M. Sizing renewable energy systems with energy storage systems in microgrids for maximum cost-efficient utilization of renewable energy resources. Sustain. Cities Soc. 2020, 55, 102059. [Google Scholar] [CrossRef]
- E-plus, Nokia Siemens Networks Build Germany First Offgrid Base Station. 2011. Available online: http://www.nokiasiemensnetworks.com (accessed on 5 February 2021).
- Farooq, M.J.; Ghazzai, H.; Kadri, A.; ElSawy, H.; Alouini, M. A Hybrid Energy Sharing Framework for Green Cellular Networks. IEEE Trans. Commun. 2017, 65, 918–934. [Google Scholar] [CrossRef]
- Chia, Y.; Sun, S.; Zhang, R. Energy Cooperation in Cellular Networks with Renewable Powered Base Stations. IEEE Trans. Wirel. Commun. 2014, 13, 6996–7010. [Google Scholar] [CrossRef]
- Jahid, A.; Ahmad, A.S.; Hossain, M.F. Energy efficient BS Cooperation in DPS CoMP based cellular networks with hybrid power supply. In Proceedings of the 2016 19th International Conference on Computer and Information Technology (ICCIT), Shenzhen, China, 18–19 April 2016; pp. 93–98. [Google Scholar] [CrossRef]
- Ugwoke, B.; Corgnati, S.; Leone, P.; Borchiellini, R.; Pearce, J. Low emissions analysis platform model for renewable energy: Community-scale case studies in Nigeria. Sustain. Cities Soc. 2021, 67, 102750. [Google Scholar] [CrossRef]
- Awad, H.; Gül, M. Optimisation of community shared solar application in energy efficient communities. Sustain. Cities Soc. 2018, 43, 221–237. [Google Scholar] [CrossRef]
- Kim, D.H.; Kim, H.S.; Lee, D.W. Packet scheduling algorithm for NRT service in wireless system supporting integrated services of RT and NRT applications. In Proceedings of the 2007 International Symposium on Communications and Information Technologies, Sydney, Australia, 17–19 October 2007; pp. 500–504. [Google Scholar] [CrossRef]
- Lin, Y.; Yue, G. Channel-Adapted and Buffer-Aware Packet Scheduling in LTE Wireless Communication System. In Proceedings of the 2008 4th International Conference on Wireless Communications, Networking and Mobile Computing, Dalian, China, 12–17 October 2008; pp. 1–4. [Google Scholar] [CrossRef]
- Ye, Y.; Wen, H.; Zhuo, Y.; Xu, S.; Wu, B. Energy efficient resource allocation in LTE-A. In Proceedings of the 2013 IEEE/CIC International Conference on Communications in China (ICCC), Xi’an, China, 12–14 August 2013; pp. 496–501. [Google Scholar] [CrossRef]
- Li, Q.; Hu, R.Q.; Qian, Y.; Wu, G. A proportional fair radio resource allocation for heterogeneous cellular networks with relays. In Proceedings of the 2012 IEEE Global Communications Conference (GLOBECOM), Anaheim, CA, USA, 3–7 December 2012; pp. 5457–5463. [Google Scholar] [CrossRef]
- Cicalò, S.; Tralli, V. Fair resource allocation with QoS support for the uplink of LTE systems. In Proceedings of the 2015 European Conference on Networks and Communications (EuCNC), Paris, France, 29 June–2 July 2015; pp. 180–184. [Google Scholar] [CrossRef]
- Sudheep, S.; Rebekka, B. Proportional equal throughput scheduler—A very fair scheduling approach in LTE downlink. In Proceedings of the International Conference on Information Communication and Embedded Systems (ICICES2014), Chennai, India, 27–28 February 2014; pp. 1–6. [Google Scholar] [CrossRef]
- Reddy, K.H.K.; Luhach, A.K.; Pradhan, B.; Dash, J.K.; Roy, D.S. A genetic algorithm for energy efficient fog layer resource management in context-aware smart cities. Sustain. Cities Soc. 2020, 63, 102428. [Google Scholar] [CrossRef]
- Zhou, L.; Xu, H.; Tian, H.; Gao, Y.; Du, L.; Chen, L. Performance Analysis of Power Saving Mechanism with Adjustable DRX Cycles in 3GPP LTE. In Proceedings of the 2008 IEEE 68th Vehicular Technology Conference, Calgary, Canada, 21–24 September 2008; pp. 1–5. [Google Scholar] [CrossRef]
- Wang, H.; Tseng, C.; Chen, G.; Kuo, F.; Ting, K. Power saving by LTE DRX mechanism using a mixture of short and long cycles. In Proceedings of the 2013 IEEE International Conference of IEEE Region 10 (TENCON 2013), Xi’an, China, 22–25 October 2013; pp. 1–6. [Google Scholar] [CrossRef]
- Fowler, S.; Bhamber, R.S.; Mellouk, A. Analysis of adjustable and fixed DRX mechanism for power saving in LTE/LTE-Advanced. In Proceedings of the 2012 IEEE International Conference on Communications (ICC), Ottawa, OT, Canada, 10–15 June 2012; pp. 1964–1969. [Google Scholar] [CrossRef]
- Jha, S.C.; Koç, A.T.; Vannithamby, R. Optimization of Discontinuous Reception (DRX) for Mobile Internet Applications over LTE. In Proceedings of the 2012 IEEE Vehicular Technology Conference (VTC Fall), Quebec City, QC, Canada, 3–6 September 2012; pp. 1–5. [Google Scholar] [CrossRef]
- Koc, A.T.; Jha, S.C.; Vannithamby, R.; Torlak, M. Optimizing DRX configuration to improve battery power saving and latency of active mobile applications over LTE-A network. In Proceedings of the 2013 IEEE Wireless Communications and Networking Conference (WCNC), Shanghai, China, 7–10 April 2013; pp. 568–573. [Google Scholar] [CrossRef]
- Liu, Y.; Huynh, M.; Mangla, A.; Ghosal, D. Performance analysis of adjustable discontinuous reception (DRX) mechanism in LTE network. In Proceedings of the 2014 23rd Wireless and Optical Communication Conference (WOCC), Newark, NJ, USA, 9–10 May 2014; pp. 1–6. [Google Scholar] [CrossRef]
- Rajesh, A.; Nakkeeran, R. Performance analysis of enhanced DRX mechanism in LTE networks. In Proceedings of the 2014 International Conference on Computer Communication and Informatics, Coimbatore, India, 3–5 January 2014; pp. 1–5. [Google Scholar] [CrossRef]
- Karthik, R.M.; Chakrapani, A. Practical algorithm for power efficient DRX configuration in next generation mobiles. In Proceedings of the 2013 Proceedings IEEE INFOCOM, Turin, Italy, 14–19 April 2013; pp. 1106–1114. [Google Scholar] [CrossRef]
- Andres-Maldonado, P.; Ameigeiras, P.; Prados-Garzon, J.; Navarro-Ortiz, J.; Lopez-Soler, J.M. Narrowband IoT Data Transmission Procedures for Massive Machine-Type Communications. IEEE Netw. 2017, 31, 8–15. [Google Scholar] [CrossRef]
- Sharp ND-250QCS (250W) Solar Panel. 2021. Available online: http://www.solardesigntool.com/components/module-panel-solar/Sharp/2260/ND-250QCS/specification-data-sheet.html?fbclid=IwAR3XENhPdn2wkIbCEqtc99AfBj75nhITmt7DLeYJYSy0Ol_19KB6iQDyrEI, (accessed on 14 February 2021).
- System Advisor Model (SAM). 2020. Available online: https://sam.nrel.gov/ (accessed on 5 February 2021).
- Alsharif, M.H.; Kim, J.; Kim, J.H. Energy Optimization Strategies for Eco-Friendly Cellular Base Stations. Energies 2018, 11, 1500. [Google Scholar] [CrossRef]
- Auer, G.; Blume, O.; Giannini, V. Energy Efficiency Analysis of the Reference Systems, Areas of Improvements and Target Breakdown. EARTH Project Report, Deliverable D2.3. 2012, pp. 1–68. Available online: https://cordis.europa.eu/docs/projects/cnect/3/247733/080/deliverables/001-EARTHWP2D23v2.pdf (accessed on 15 October 2022).
- Han, D.; Li, S.; Peng, Y.; Chen, Z. Energy sharing-based energy and user joint allocation method in heterogeneous network. IEEE Access 2020, 8, 37077–37086. [Google Scholar] [CrossRef]
- Solaris Technology Industry Inc. American Conductor Wire Size. 2020. Available online: https://www.solarisshop.com/content/AmericanWireGauge,ConductorSizeTable.pdf (accessed on 5 February 2021).
- 3GPP TS 23.203, “Policy and cHarging Control Architecture.” Rel. 12, v. 12.9.0. 2014. Available online: https://portal.3gpp.org/desktopmodules/Specifications/SpecificationDetails.aspx?specificationId=810 (accessed on 5 February 2021).
- Jin, S.; Qiao, D. Numerical Analysis of the Power Saving in 3GPP LTE Advanced Wireless Networks. IEEE Trans. Veh. Technol. 2012, 61, 1779–1785. [Google Scholar] [CrossRef]
- Hossain, M.S.; Jahid, A.; Islam, K.Z.; Rahman, M.F. Solar PV and Biomass Resources-Based Sustainable Energy Supply for Off-Grid Cellular Base Stations. IEEE Access 2020, 8, 53817–53840. [Google Scholar] [CrossRef]
- Islam, M.S.; Akhter, R.; Rahman, M.A. A thorough investigation on hybrid application of biomass gasifier and PV resources to meet energy needs for a northern rural off-grid region of Bangladesh: A potential solution to replicate in rural off-grid areas or not? Energy 2018, 145, 338–355. [Google Scholar] [CrossRef]
- Chauhan, A.; Saini, R. A review on Integrated Renewable Energy System based power generation for stand-alone applications: Configurations, storage options, sizing methodologies and control. Renew. Sustain. Energy Rev. 2014, 38, 99–120. [Google Scholar] [CrossRef]
- Auer, G.; Giannini, V.; Desset, C.; Godor, I.; Skillermark, P.; Olsson, M.; Imran, M.A.; Sabella, D.; Gonzalez, M.J.; Blume, O.; et al. How much energy is needed to run a wireless network? IEEE Wirel. Commun. 2011, 18, 40–49. [Google Scholar] [CrossRef]
- Holtkamp, H.; Auer, G.; Giannini, V.; Haas, H. A Parameterized Base Station Power Model. IEEE Commun. Lett. 2013, 17, 2033–2035. [Google Scholar] [CrossRef]
- Bangladesh Bank Monetary Policy. 2021. Available online: https://tradingeconomics.com/country-list/interestrate?continent=asia (accessed on 4 February 2021).
- Coordinated Multi-Point Operation for LTE Physical Layer Aspects. 2011. Available online: https://portal.3gpp.org/desktopmodules/Specifications/SpecificationDetails.aspx?specificationId=2498 (accessed on 7 October 2022).
- Halder, P.; Paul, N.; Beg, M. Assessment of biomass energy resources and related technologies practice in Bangladesh. Renew. Sustain. Energy Rev. 2014, 39, 444–460. [Google Scholar] [CrossRef]
- Jahid, A.; Monju, K.H.; Hossain, S.; Hossain, F. Hybrid power supply solutions for off-grid green wireless networks. Int. J. Green Energy 2019, 16, 12–33. [Google Scholar] [CrossRef]
- Jahid, A.; Islam, K.Z.; Hossain, M.S.; Hasan Monju, M.K.; Rahman, M.F. Performance Evaluation of Cloud Radio Access Network with Hybrid Power Supplies. In Proceedings of the 2019 International Conference on Sustainable Technologies for Industry 4.0 (STI), Dhaka, Bangladesh, 24–25 December 2019; pp. 1–5. [Google Scholar] [CrossRef]
- Alsharif, M.H. Comparative analysis of solar-powered base stations for green mobile networks. Energies 2017, 10, 1208. [Google Scholar] [CrossRef]
- Australian Energy Statistics—2022 Edition. Available online: https://www.energy.gov.au/news-media/news/australian-energy-statistics-2022-edition (accessed on 28 November 2021).


Disclaimer/Publisher’s Note: The statements, opinions and data contained in all publications are solely those of the individual author(s) and contributor(s) and not of MDPI and/or the editor(s). MDPI and/or the editor(s) disclaim responsibility for any injury to people or property resulting from any ideas, methods, instructions or products referred to in the content. |
© 2022 by the authors. Licensee MDPI, Basel, Switzerland. This article is an open access article distributed under the terms and conditions of the Creative Commons Attribution (CC BY) license (https://creativecommons.org/licenses/by/4.0/).