
An Experimental and Numerical Study on Charged 21700 Lithium-Ion Battery Cells under Dynamic and High Mechanical Loads
 ,
,  ,
,
Abstract
:1. Introduction
2. Materials and Methods
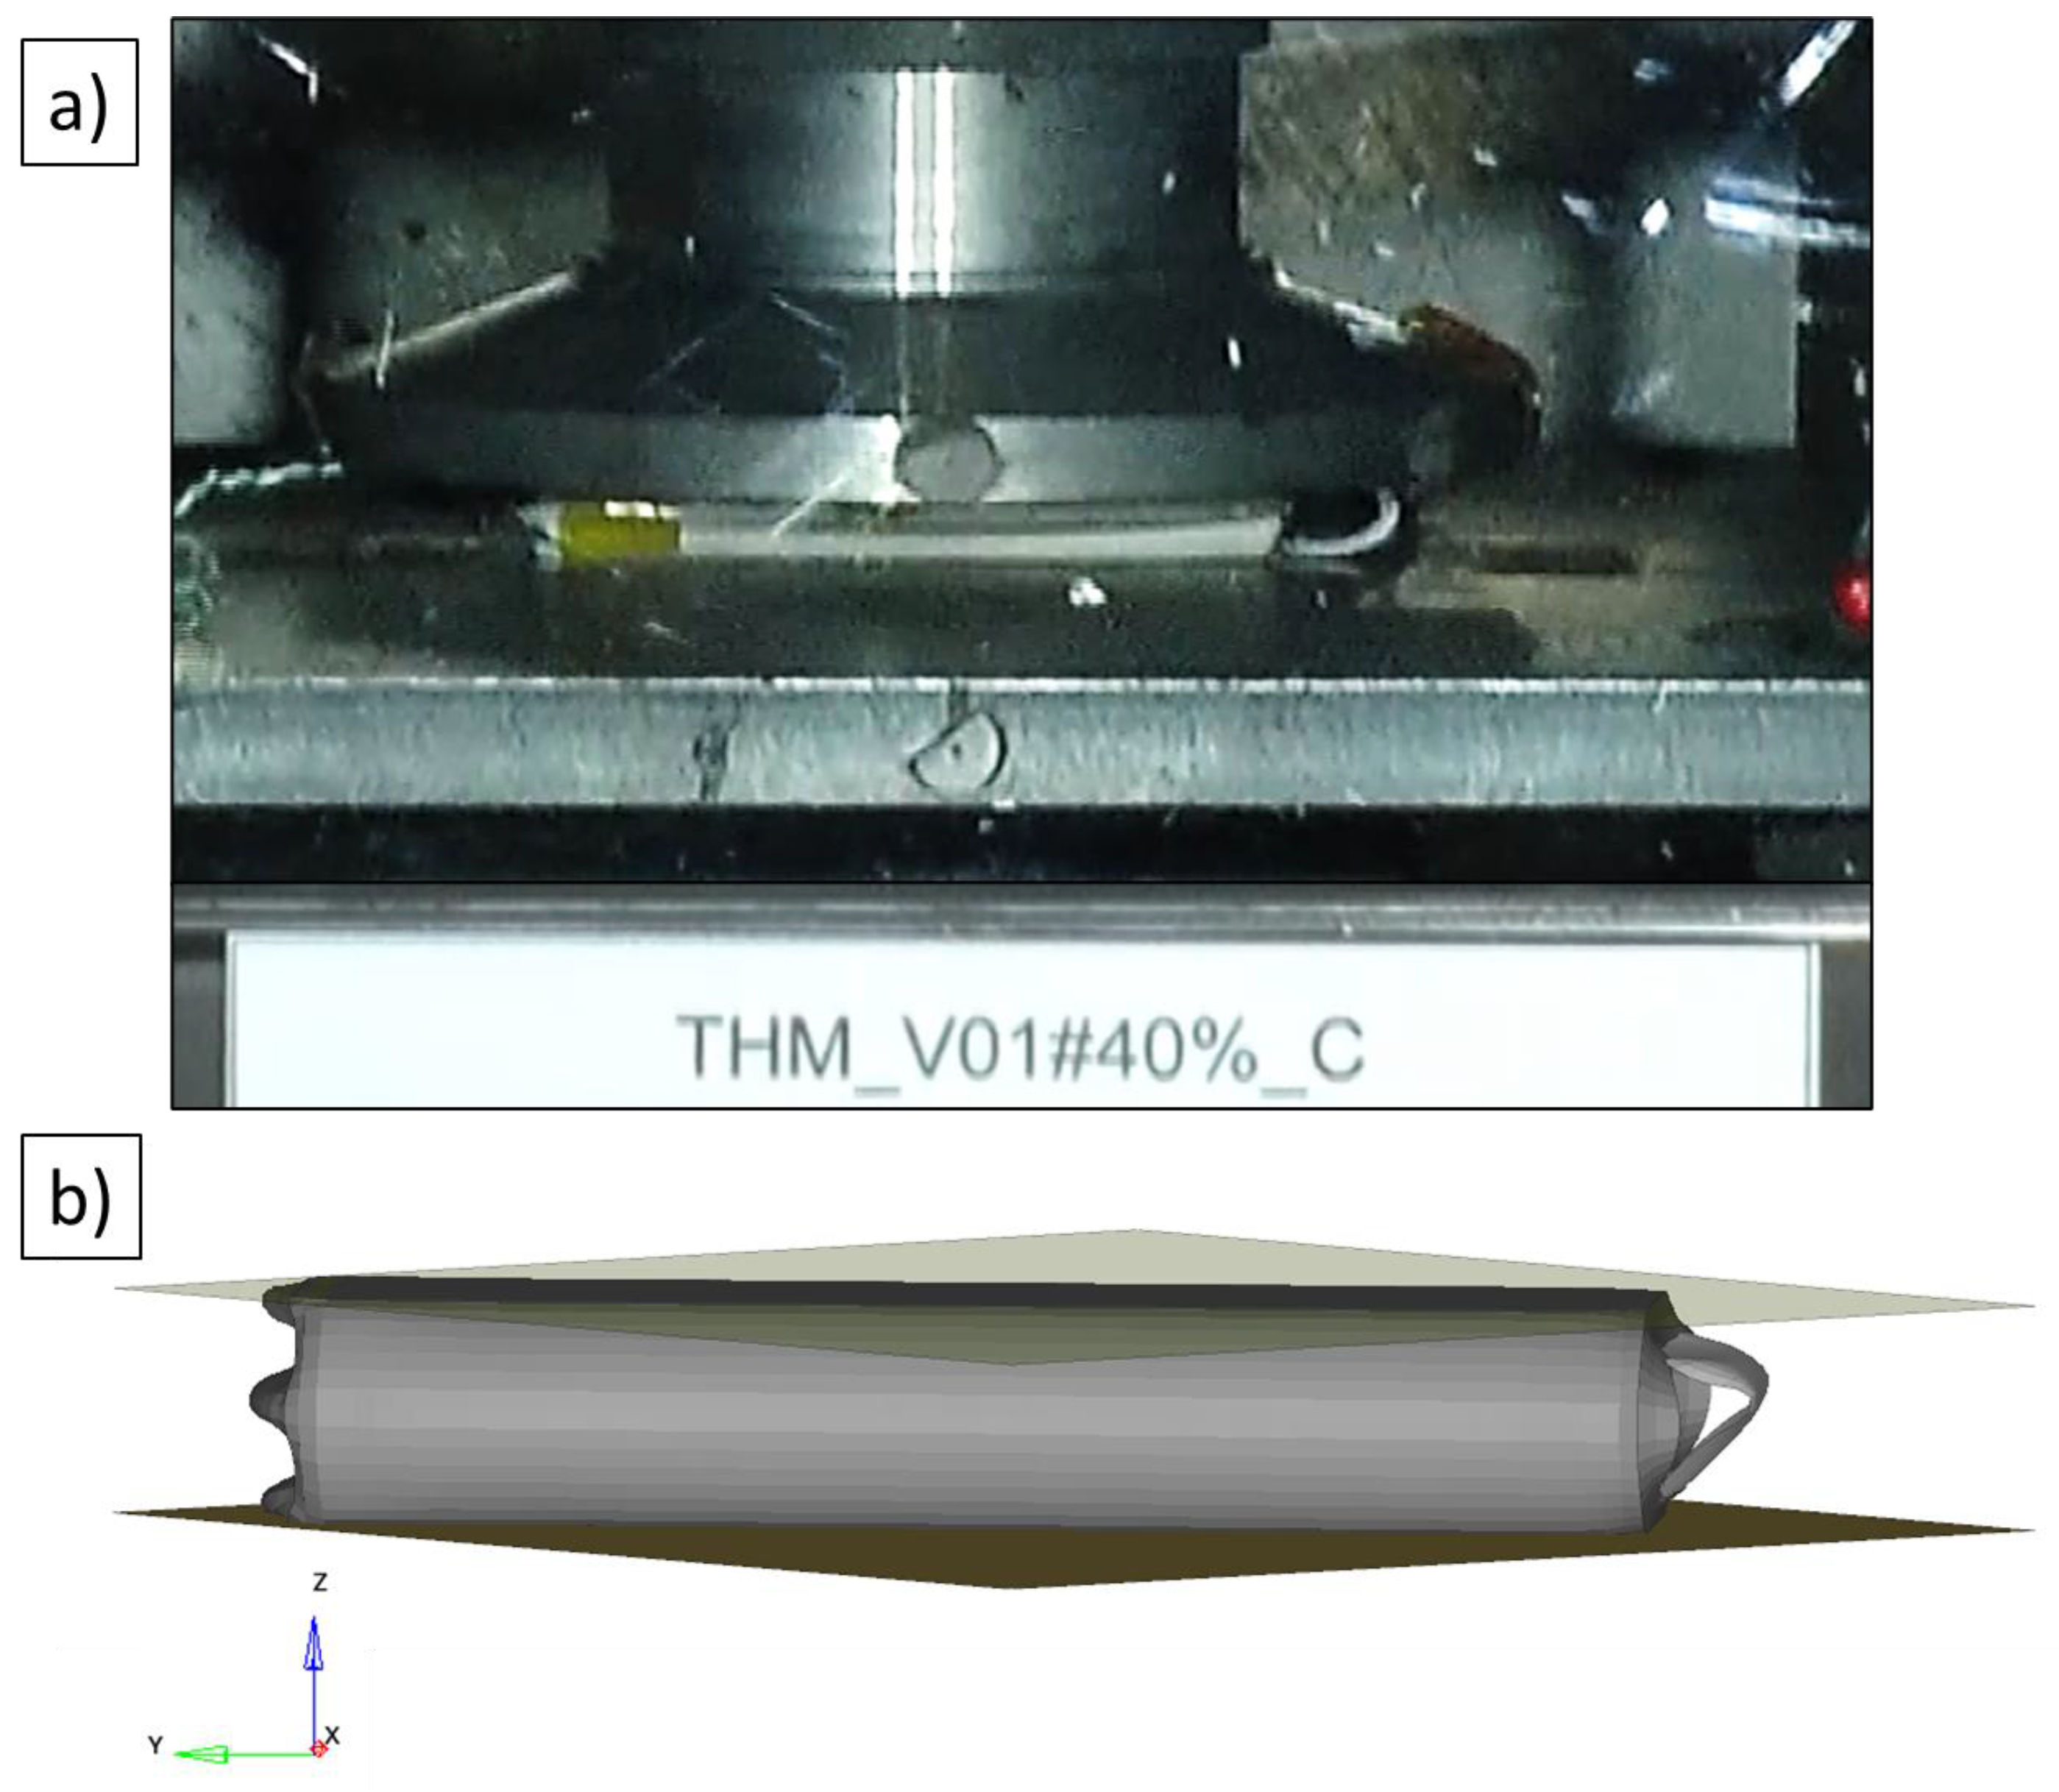
2.1. Test Preparation
- The cells were delivered with a SoC of around 40–50%.
- All cells were discharged to the cut-off voltage (0% SoC).
- All cells were fully charged until full nominal capacity (100% SoC).
- After these steps, two full cycles were carried out to bring the cells to the normal mode.
- Then, a full discharge was performed until cut-off (0%).
- Finally, the cells were charged to the specified SoC by measuring the input current, according to the test program.
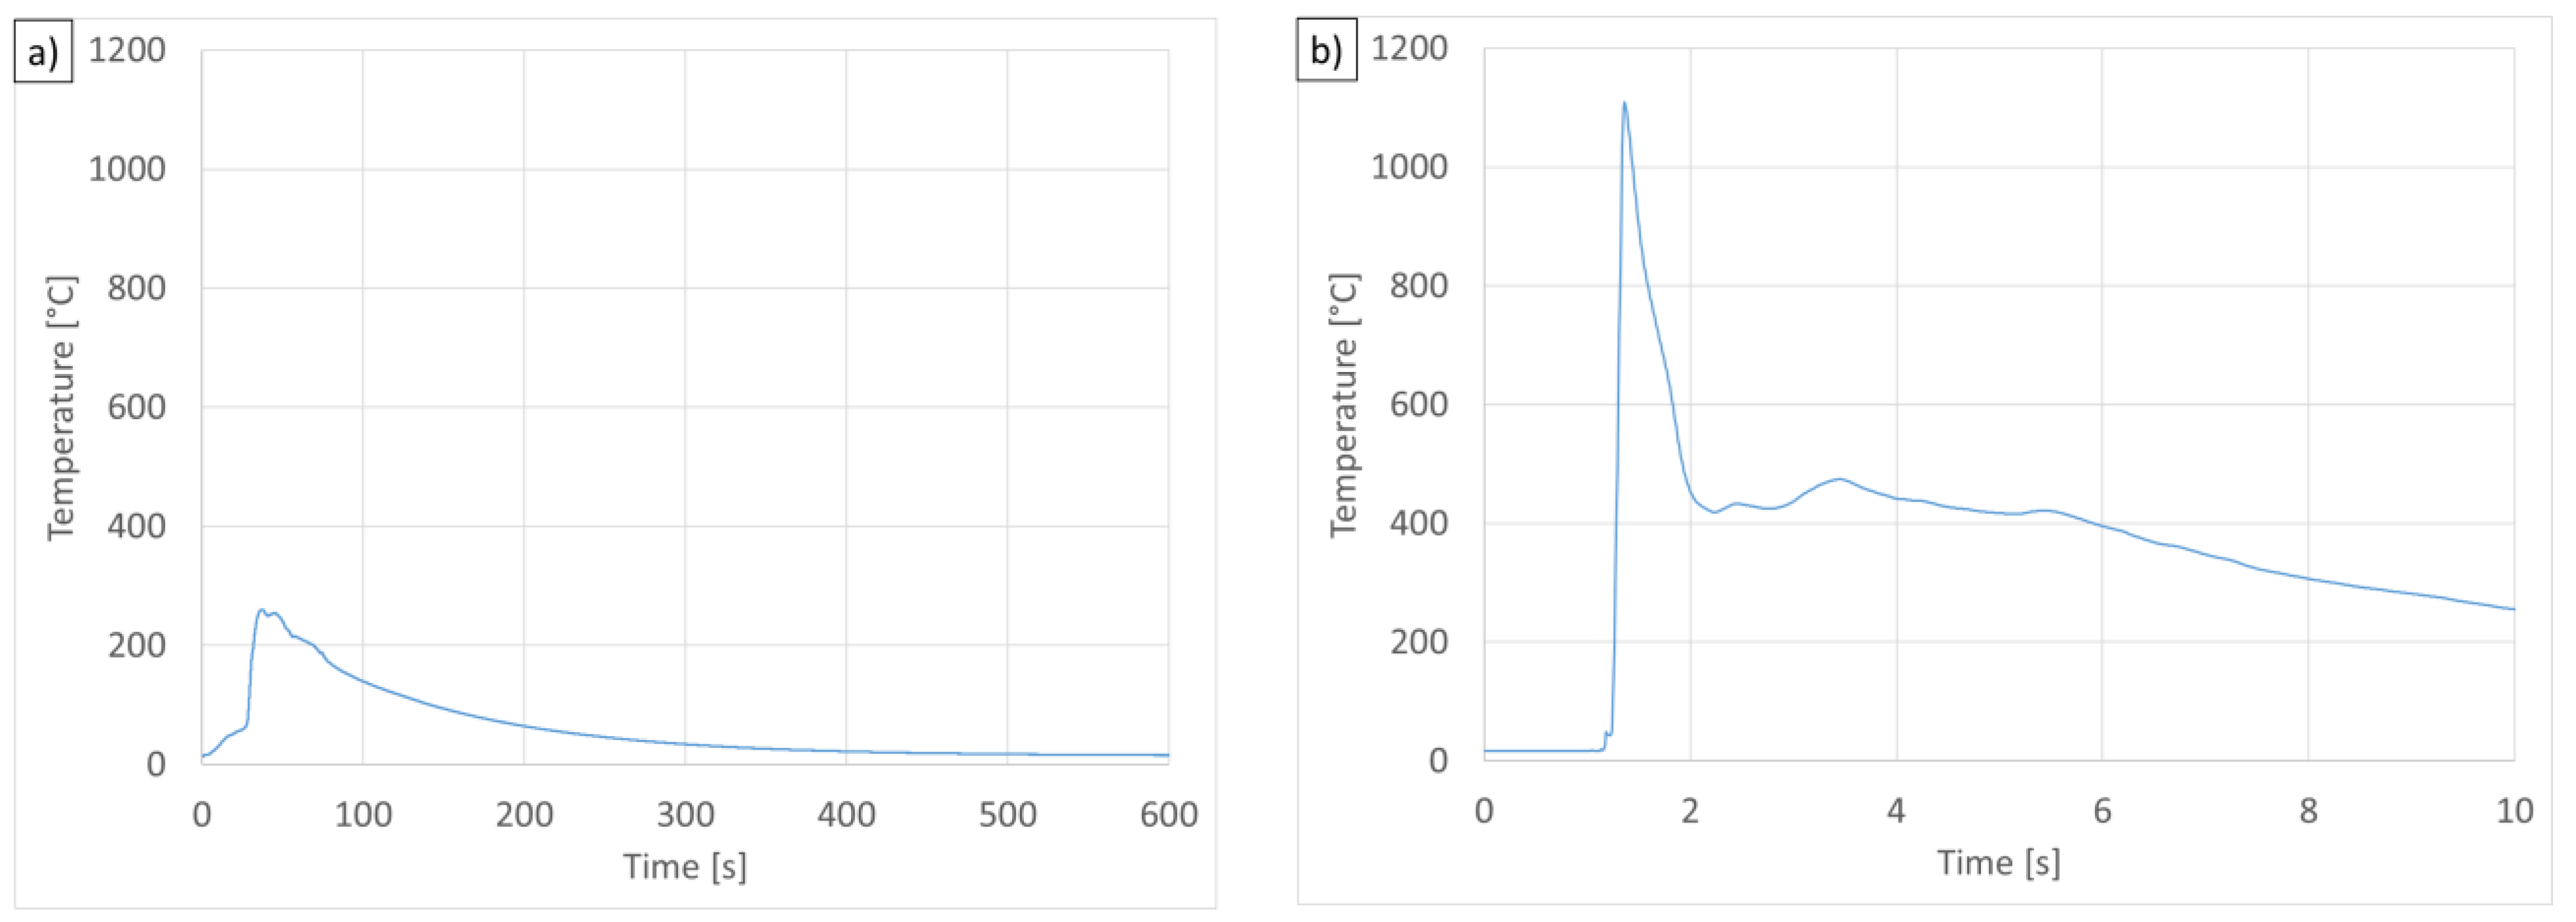
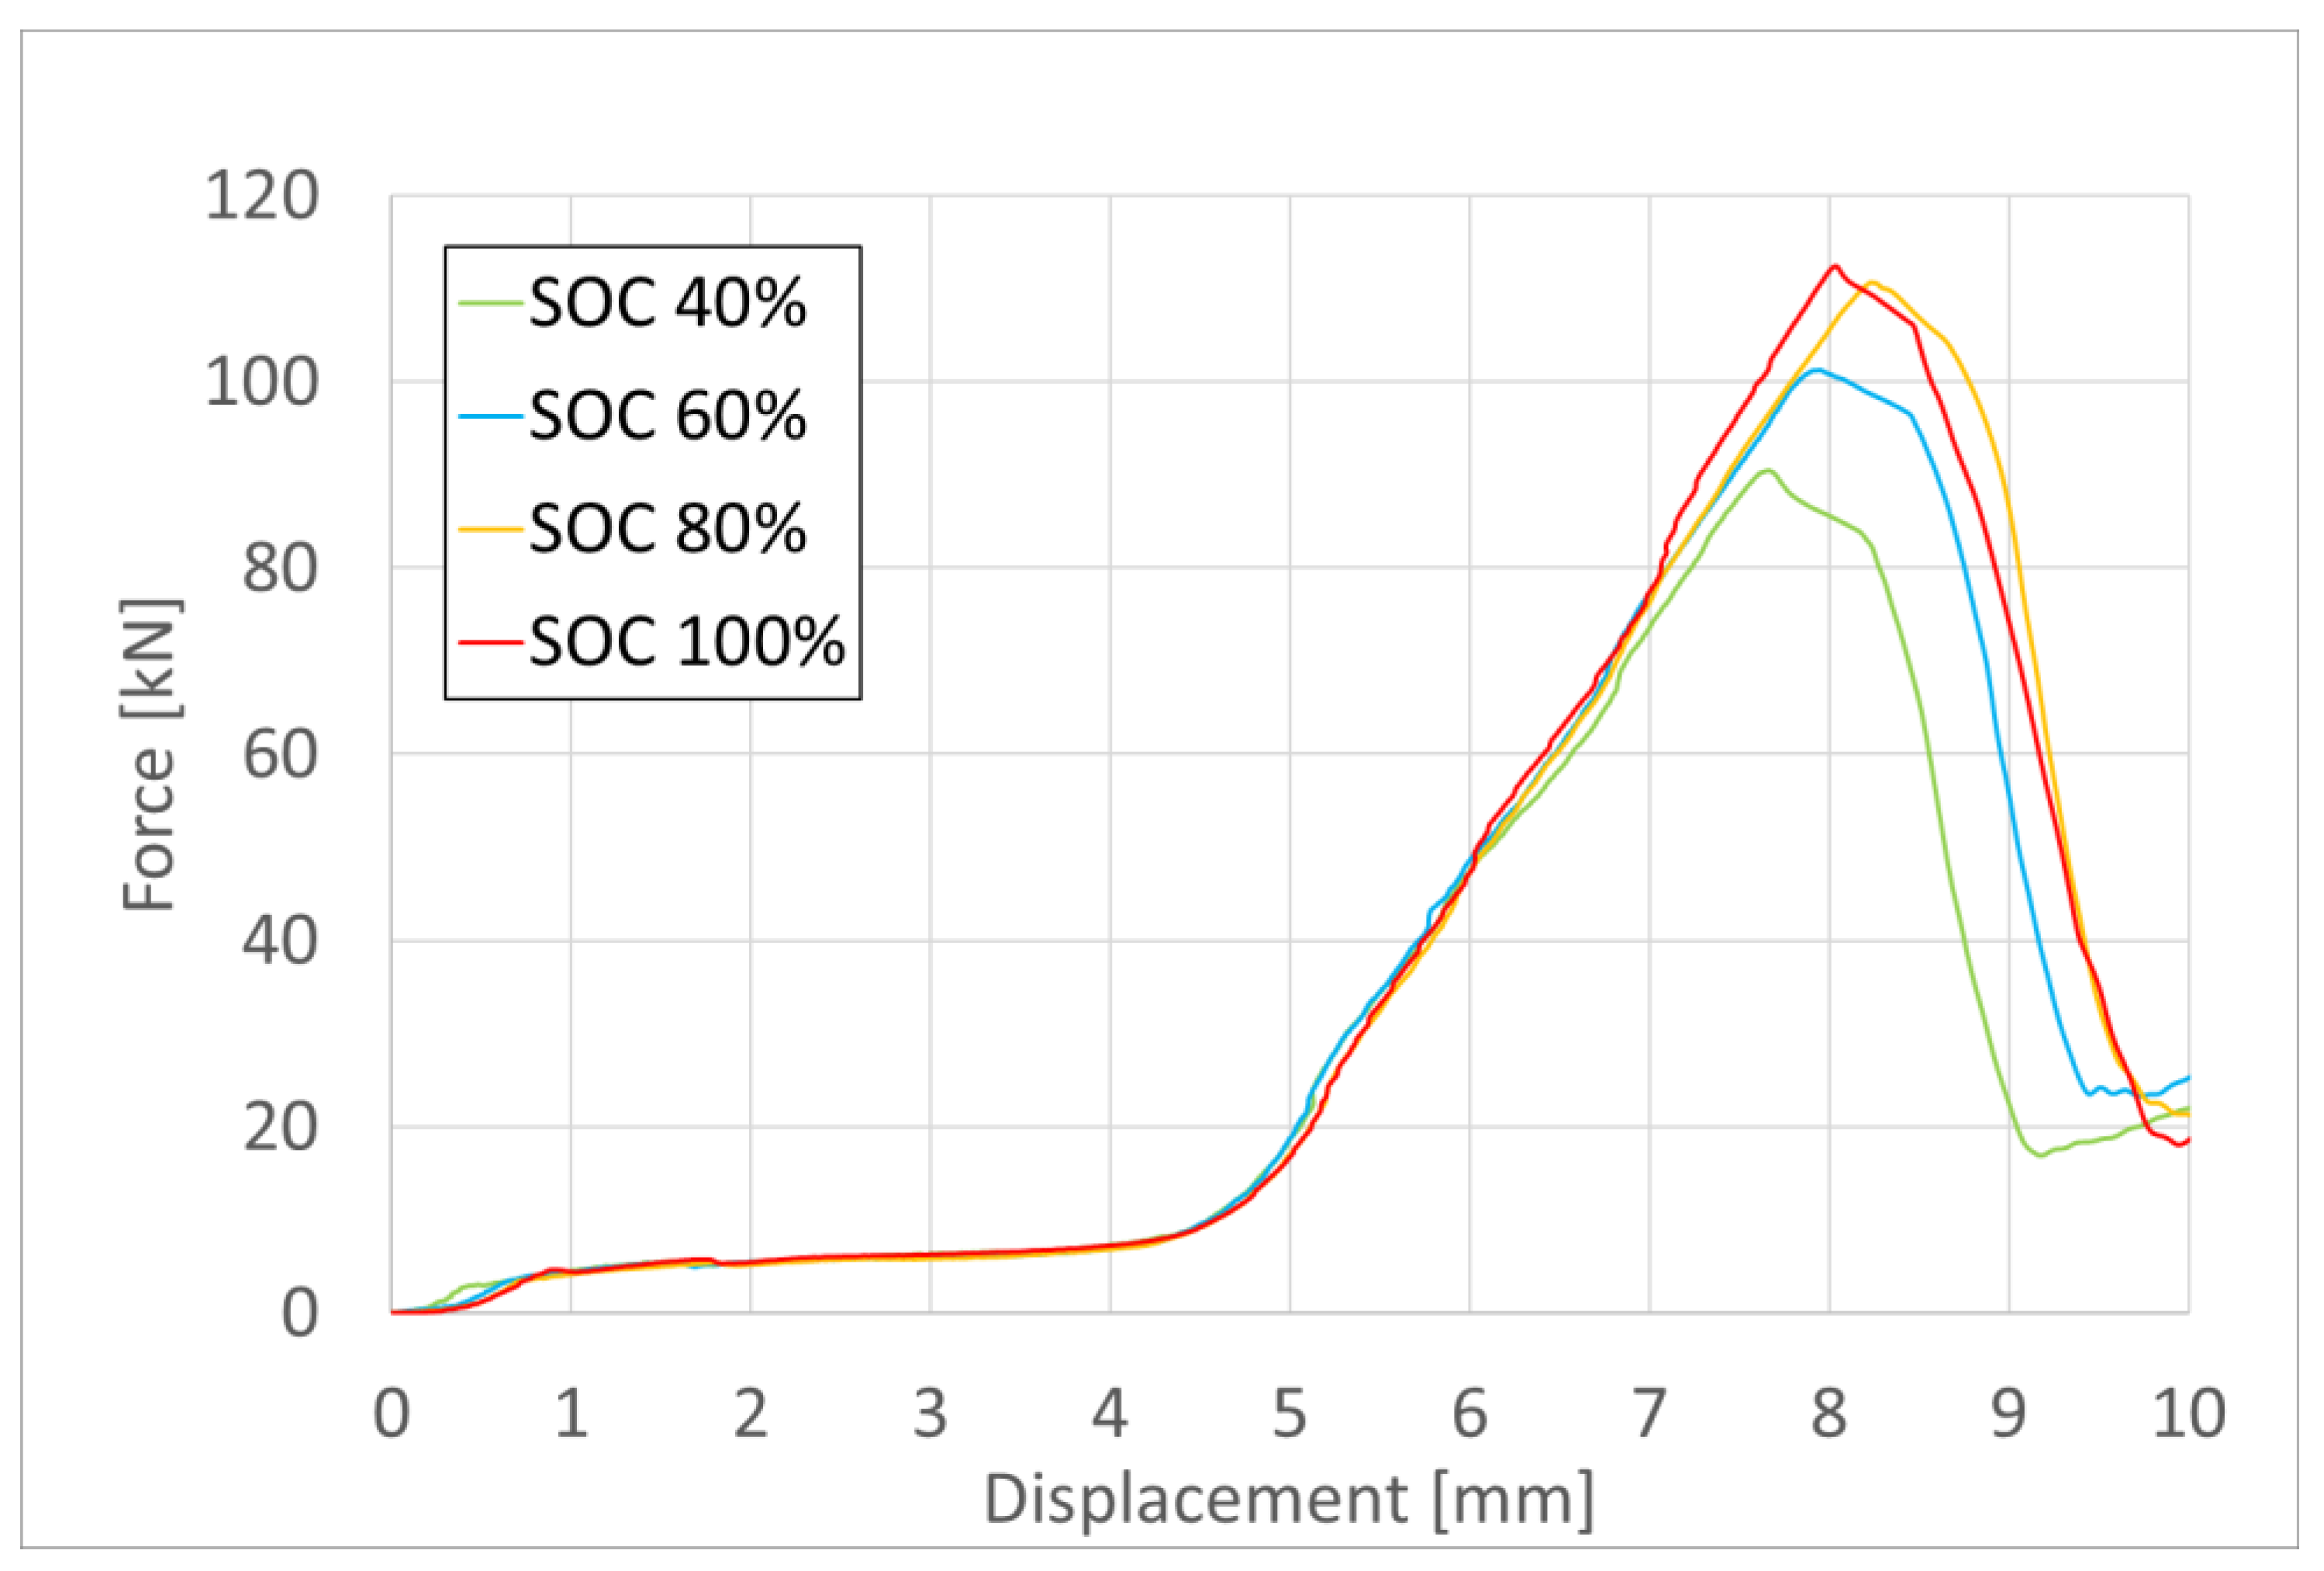
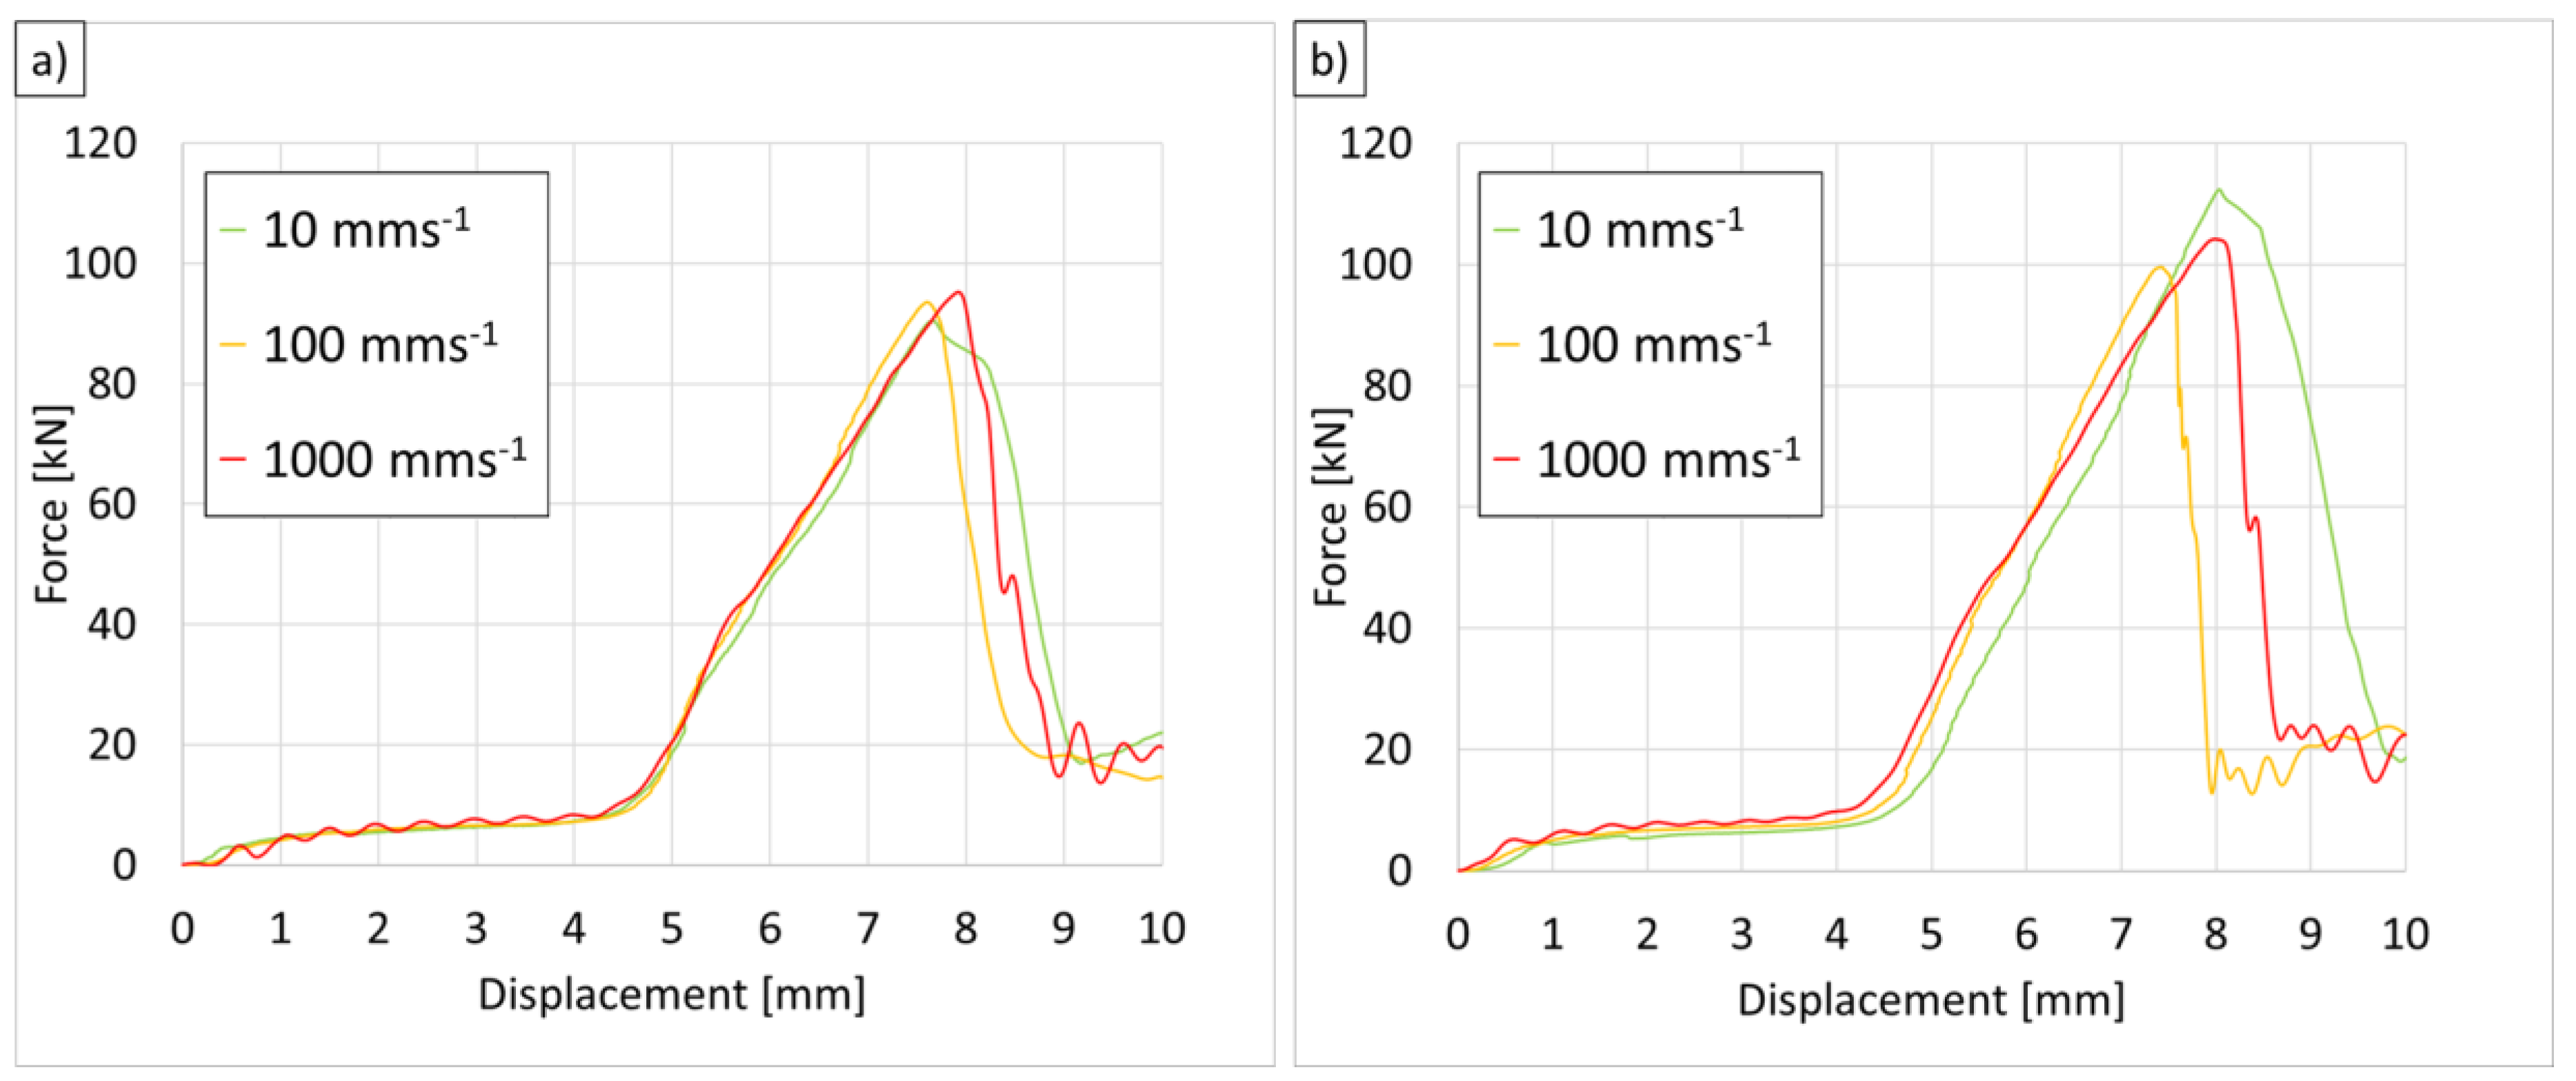
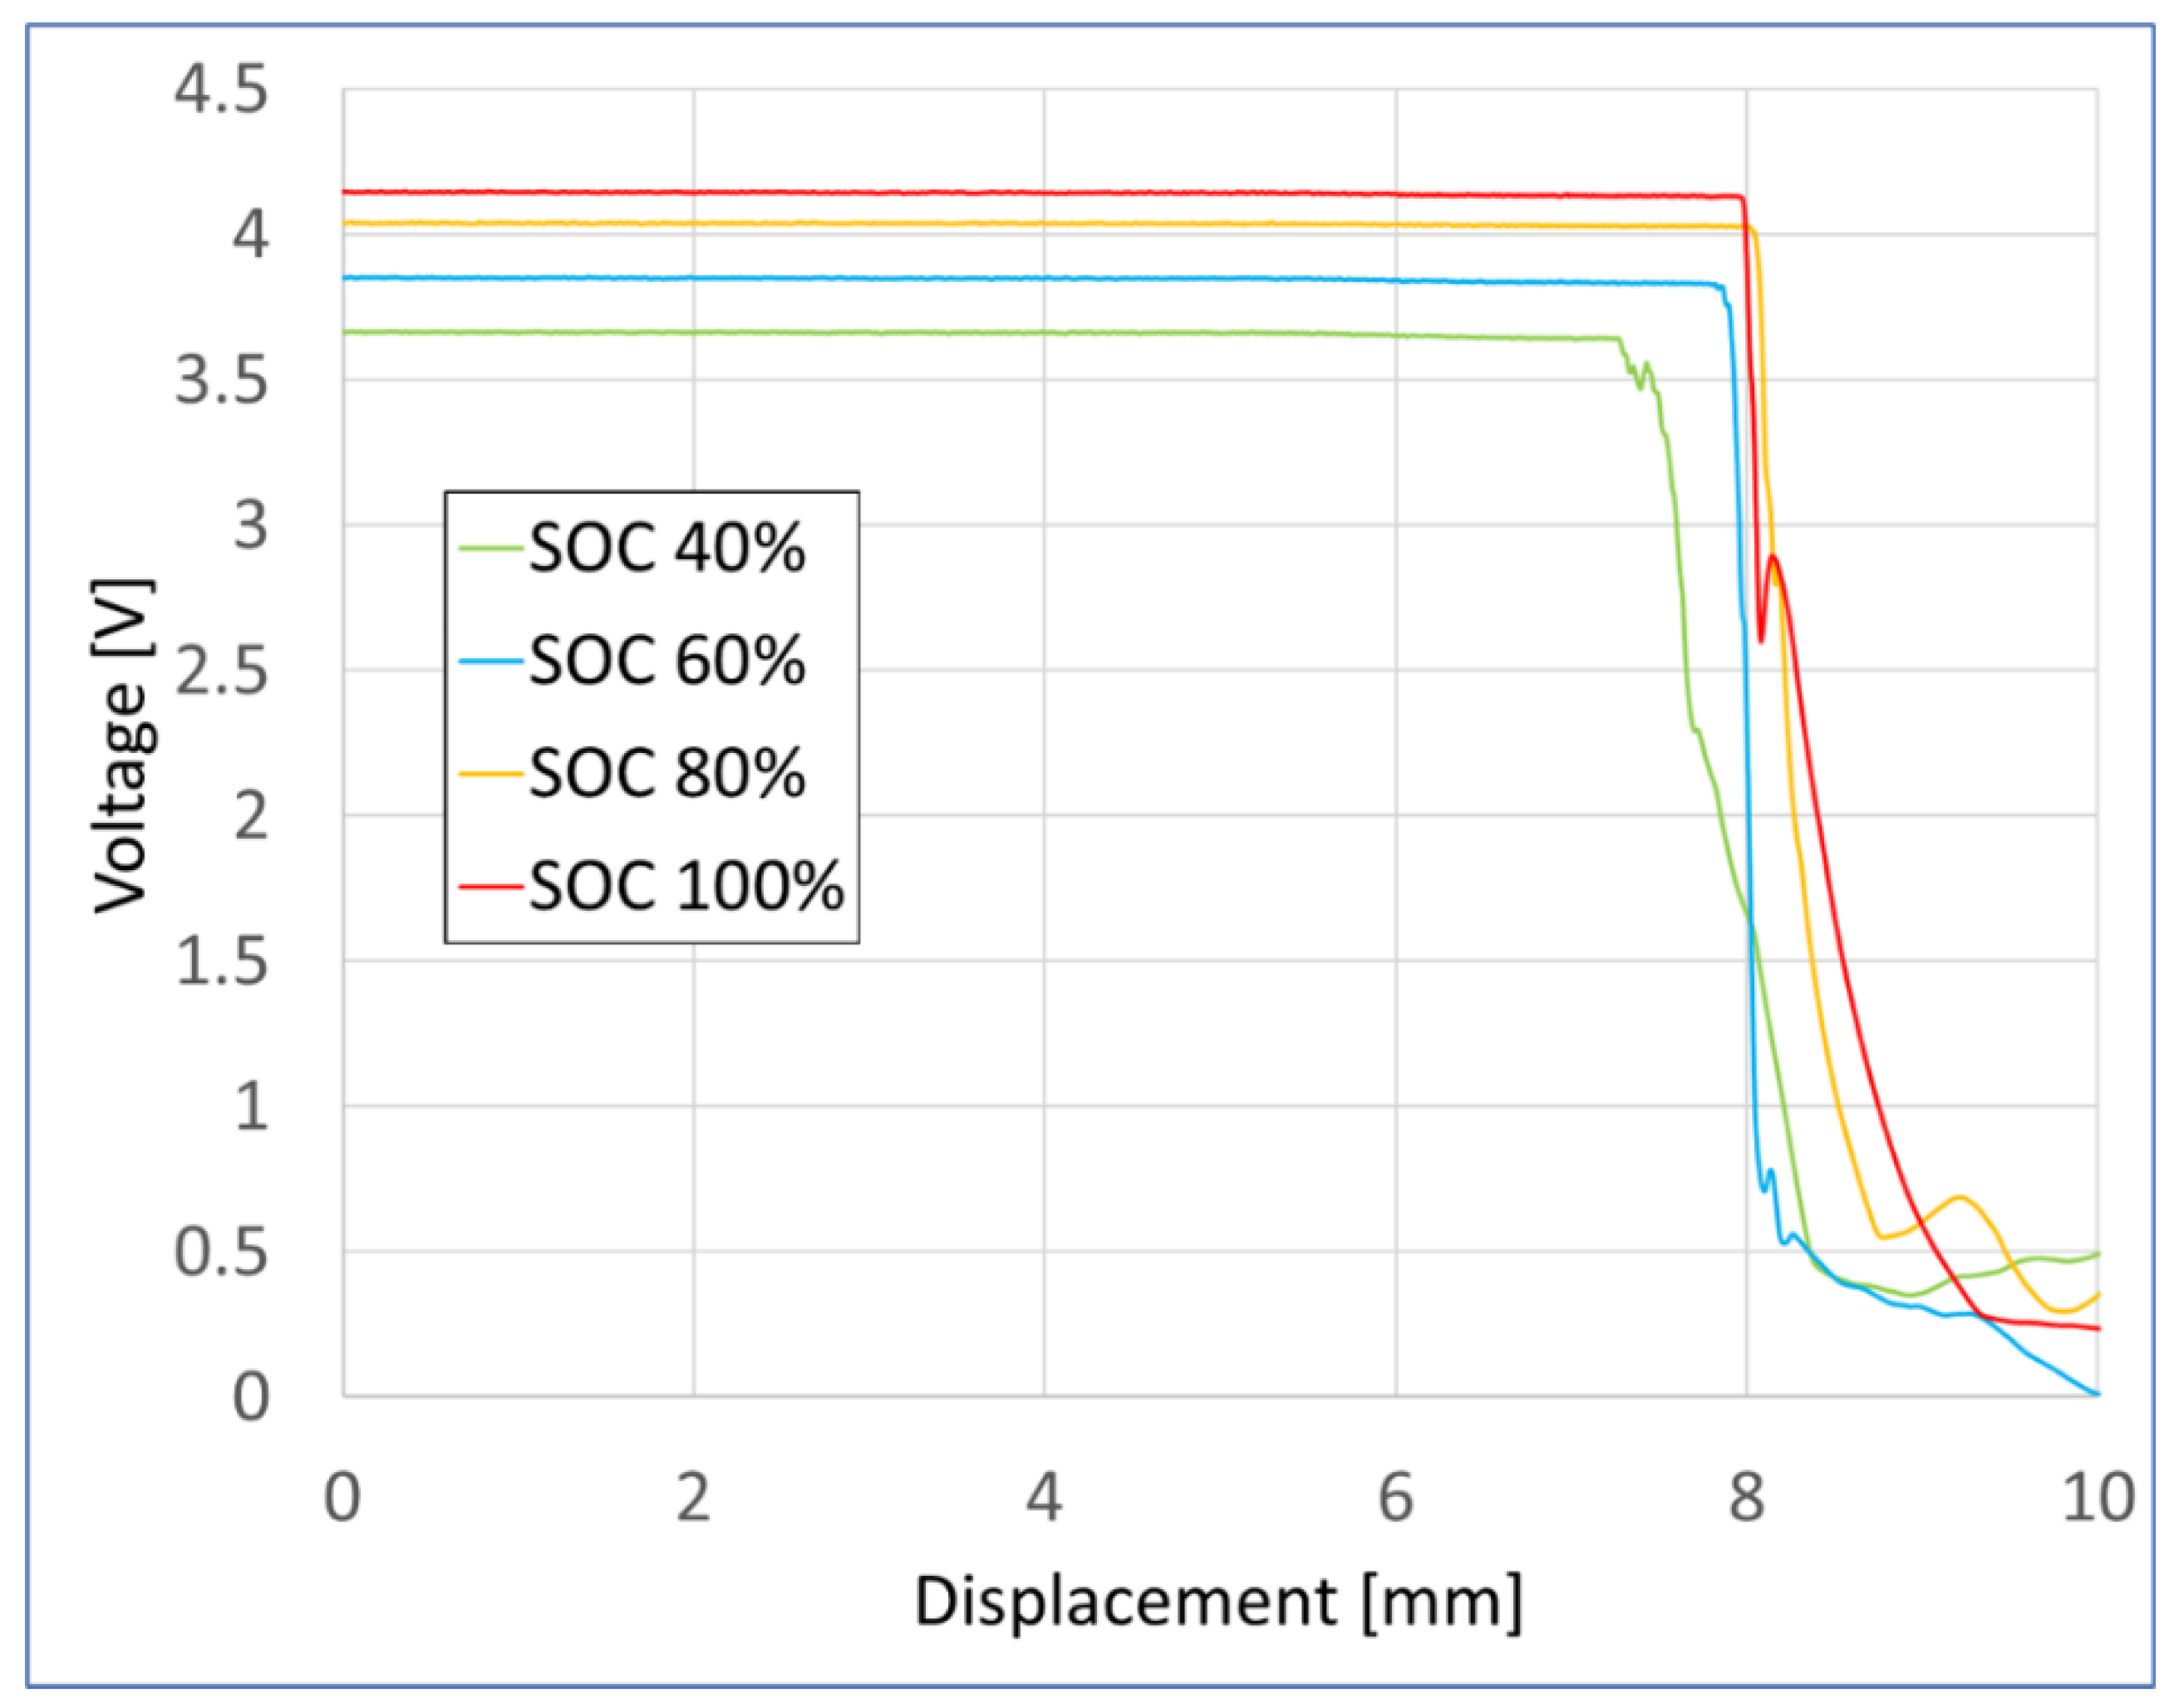
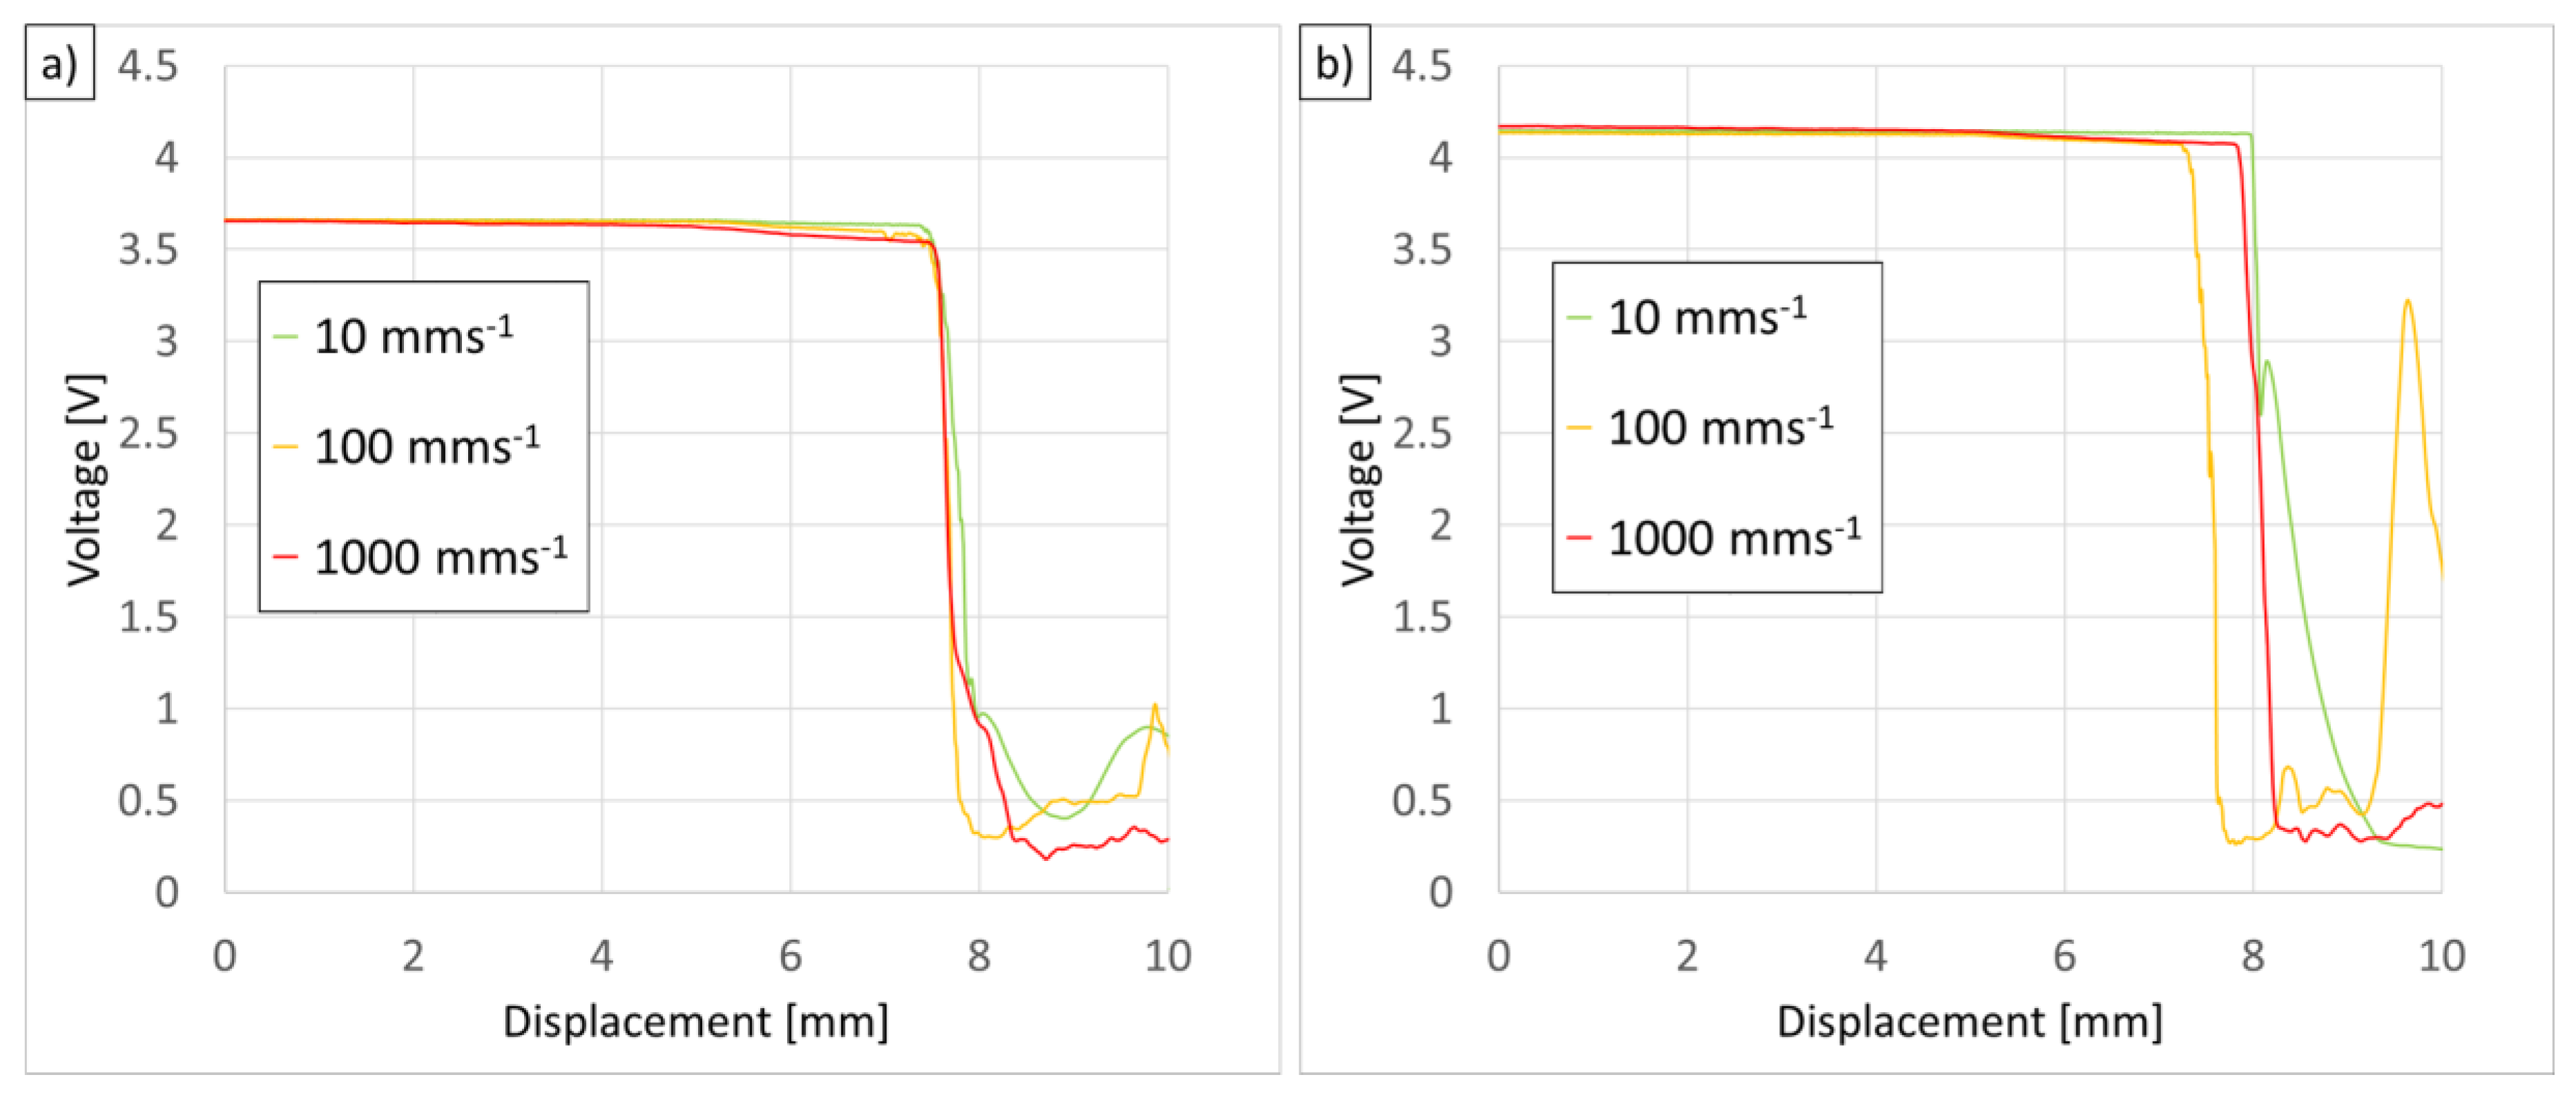
2.2. Test Results
3. Modeling and Results
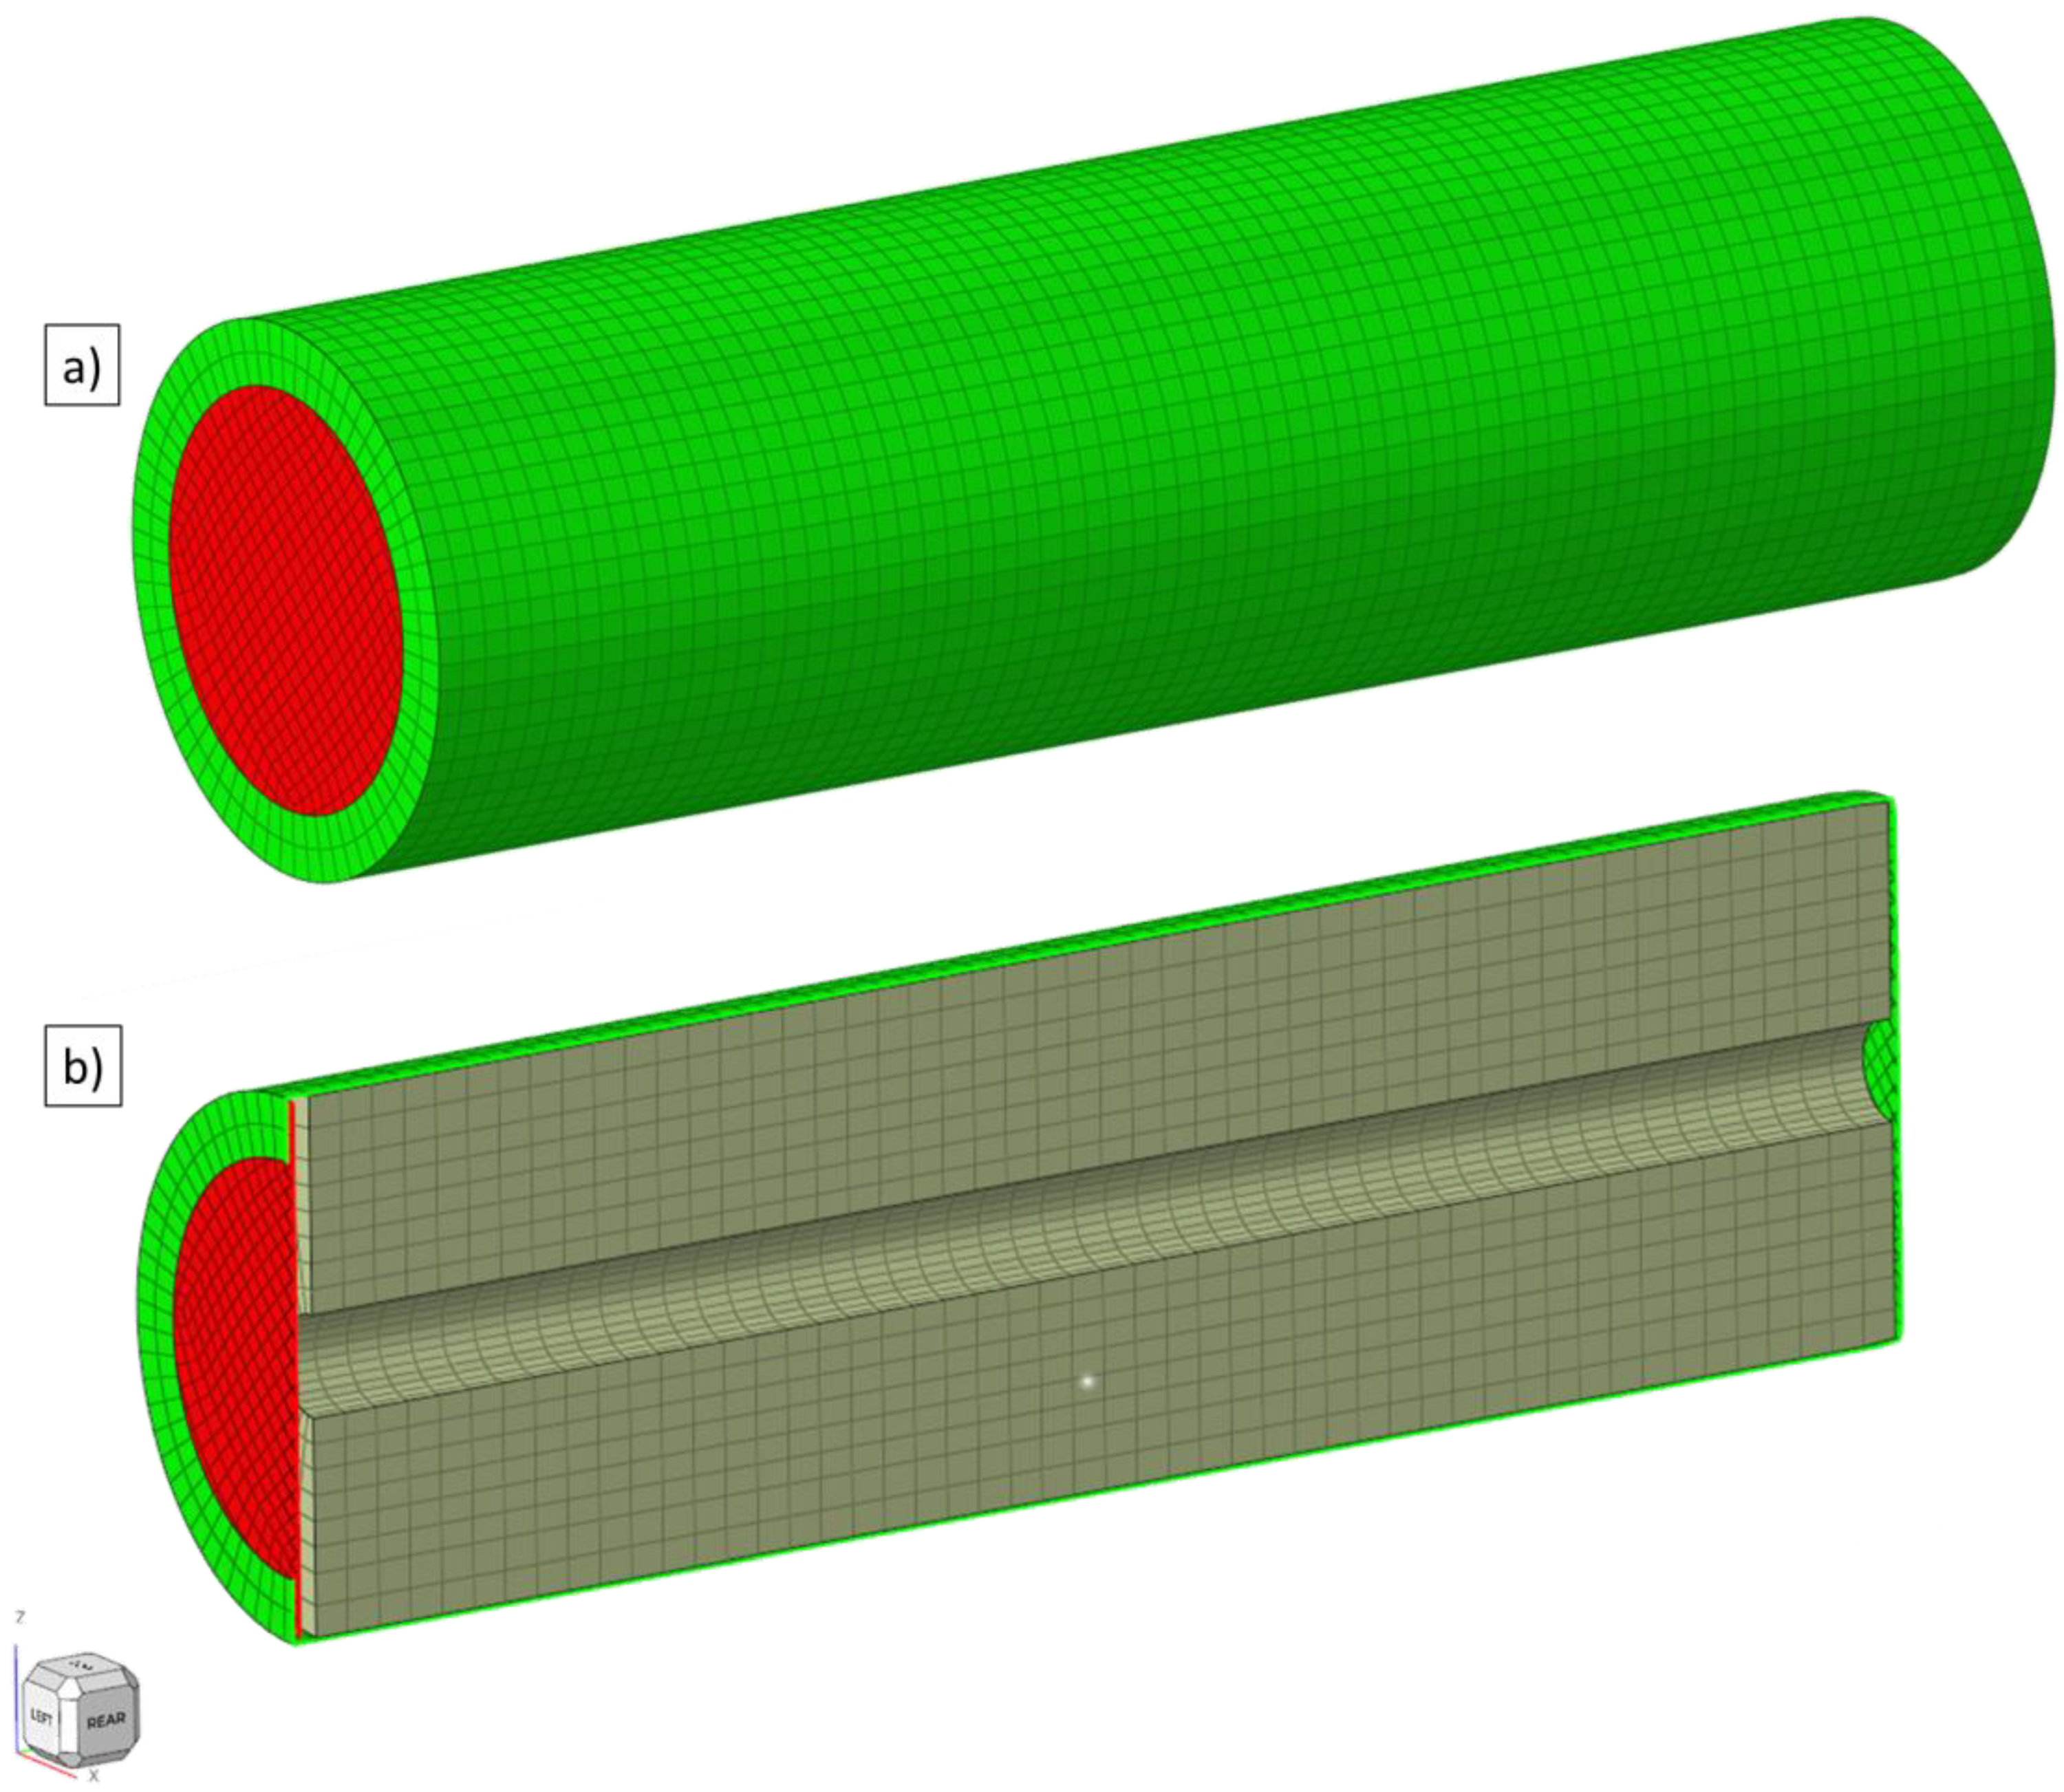
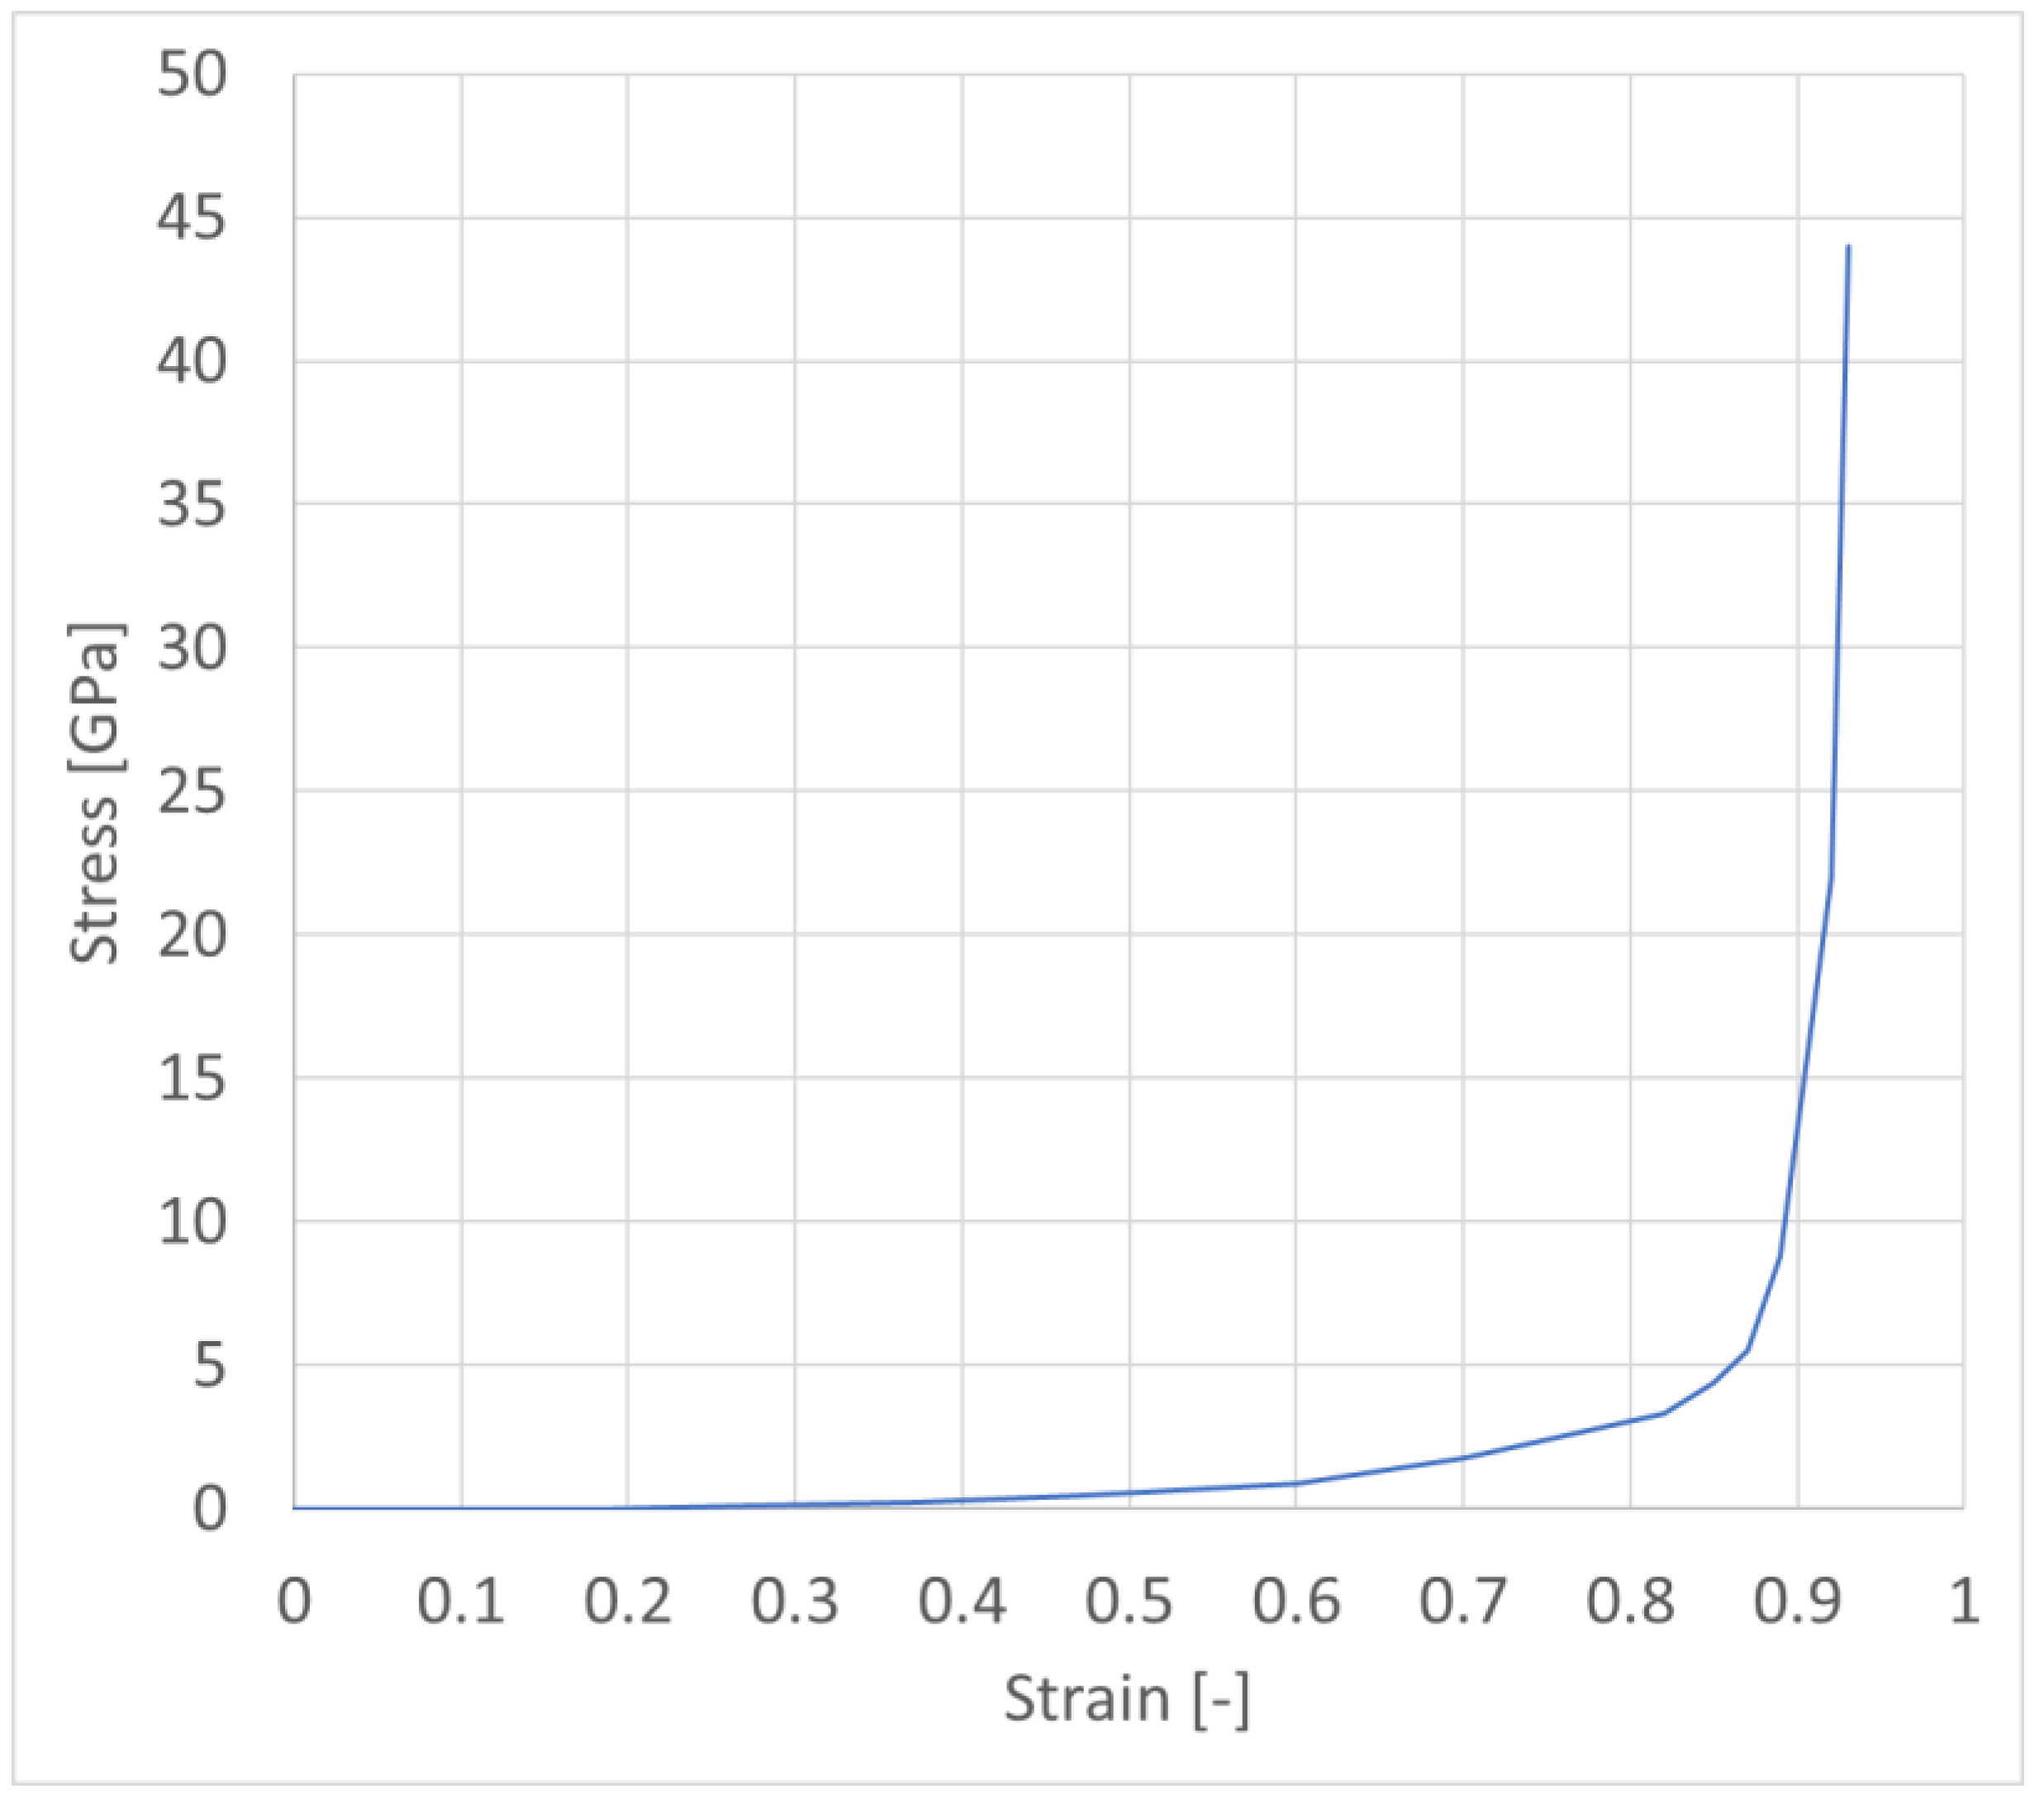
FEM Model
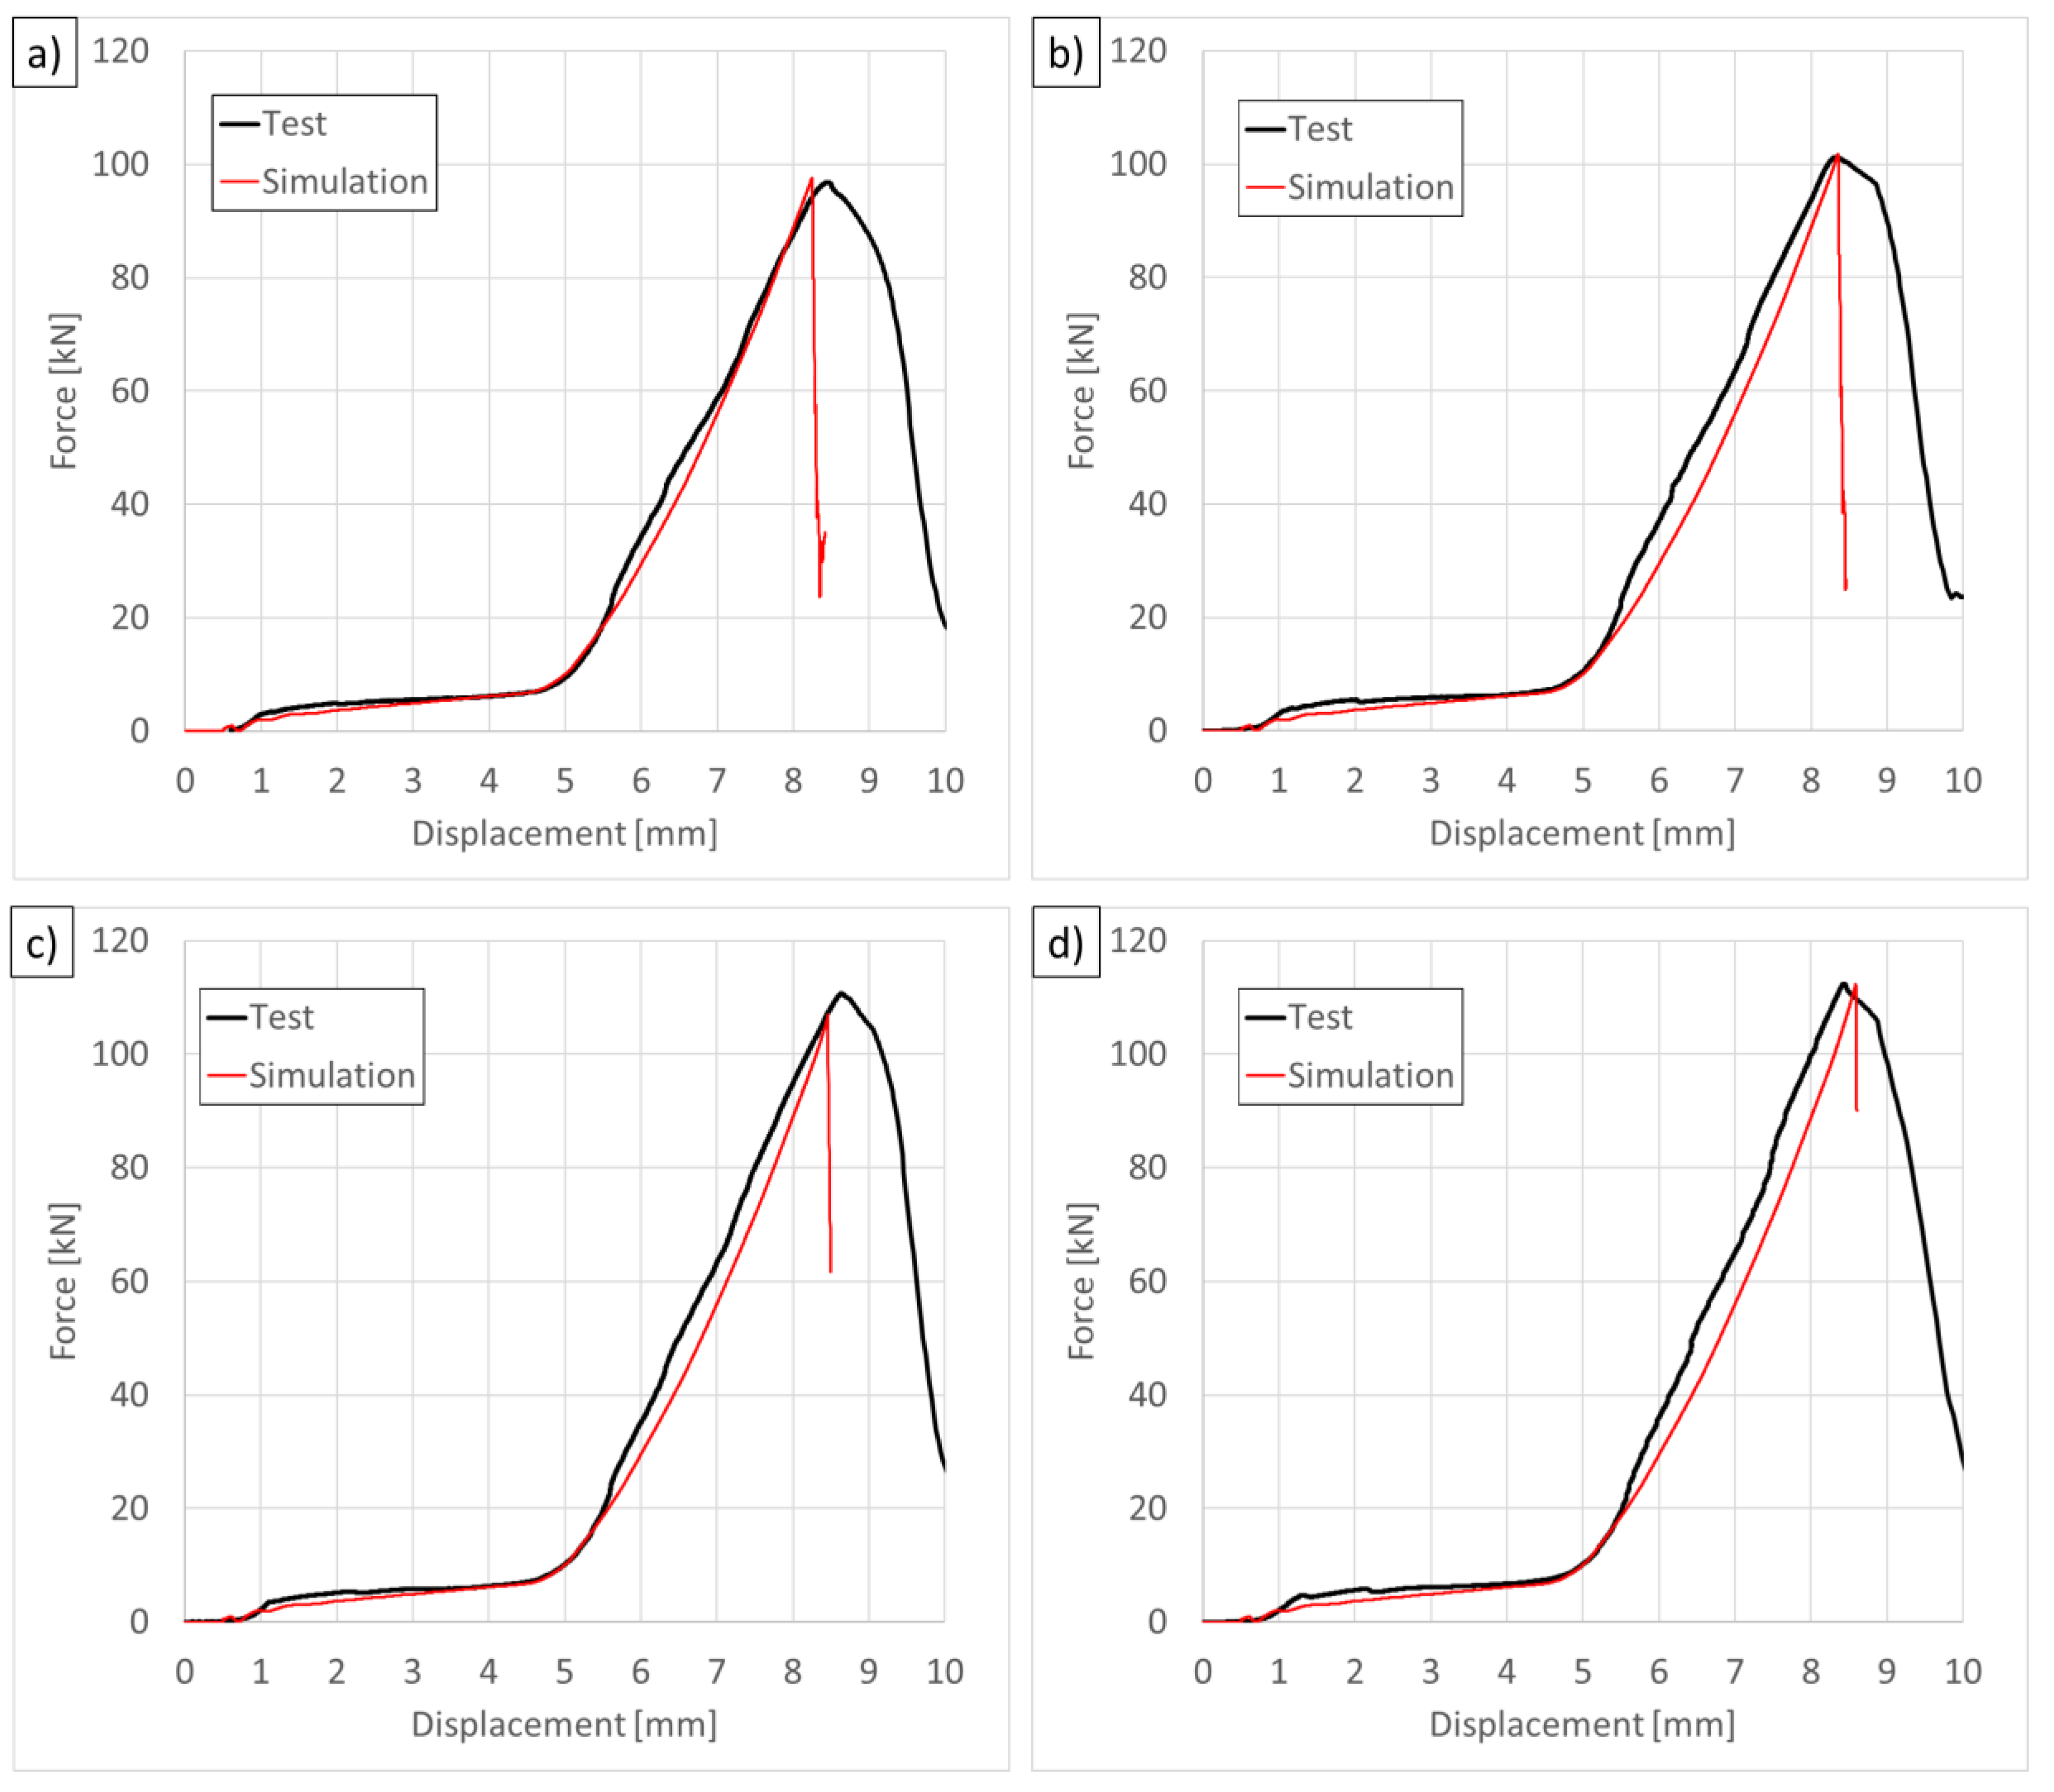
4. Discussion
5. Conclusions and Outlook
Author Contributions
Funding
Institutional Review Board Statement
Informed Consent Statement
Data Availability Statement
Conflicts of Interest
References
- Viebahn, P.; Nitsch, J.; Fischedick, M.; Esken, A.; Schuewer, D.; Supersberger, N.; Zuberbuehler, U.; Edenhofer, O. Comparison of carbon capture and storage with renewable energy technologies regarding structural, economic, and ecological aspects in Germany. Int. J. Greenh. Gas Control 2007, 1, 121–133. [Google Scholar] [CrossRef]
- Wei, Z.; Zou, C.; Leng, F.; Soong, B.H.; Tseng, K.-J. Online Model Identification and State-of-Charge Estimate for Lithium-Ion Battery with a Recursive Total Least Squares-Based Observer. IEEE Trans. Ind. Electron. 2018, 65, 1336–1346. [Google Scholar] [CrossRef]
- Lithium-Ion-Batteries. Available online: https://www.akkuparts24.de/Lithium-Ion-batteries (accessed on 17 August 2022).
- Battery Types Explained. Available online: https://blog.teufelaudio.com/battery-types/ (accessed on 22 September 2022).
- Canals Casals, L.; Macarulla, M.; Gómez-Núñez, A. High-Capacity Cells and Batteries for Electric Vehicles. Energies 2021, 14, 7799. [Google Scholar] [CrossRef]
- Lithium-Ionen-Akkumulator. Available online: https://de.wikipedia.org/wiki/Lithium-Ionen-Akkumulator (accessed on 22 September 2022).
- Liu, Y.; Li, Y.; Liao, Y.G.; Lai, M.-C. Effects of State-of-Charge and Penetration Location on Variations in Temperature and Terminal Voltage of a Lithium-Ion Battery Cell during Penetration Tests. Batteries 2021, 7, 81. [Google Scholar] [CrossRef]
- Feng, X.; Sun, J.; Ouyang, M.; Wang, F.; He, X.; Lu, L.; Peng, H. Characterization of penetration induced thermal runaway 346 propagation process within a large format lithium ion battery module. J. Power Sources 2015, 275, 261–347, +273. [Google Scholar] [CrossRef]
- Li, W.; Xia, Y.; Zhu, J.; Luo, H. State-of-Charge Dependance of Mechanical Response of Lithium-Ion Batteries: A Result of Internal Stress. J. Electrochem. Soc. 2018, 165, A1537. [Google Scholar] [CrossRef]
- Soudbakhsh, D.; Gilaki, M.; Lynch, W.; Zhang, P.; Choi, T.; Sahraei, E. Electrical Response of Mechanically Damaged Lithium-Ion Batteries. Energies 2020, 13, 4284. [Google Scholar] [CrossRef]
- Gilaki, M.; Song, Y.; Sahraei, E. Homogenized characterization of cylindrical Li-ion battery cells using elliptical approximation. Int. J. Energy Res. 2021, 46, 5908–5923. [Google Scholar] [CrossRef]
- Gilaki, M.; Walsh, R.; Sahraei, E. Model-Based Design of an Electric Bus Lithium-Ion Battery Pack. ASME J. Electrochem. Energy Conv. Stor. 2021, 18, 020914. [Google Scholar] [CrossRef]
- Kermani, G.; Keshavarzi, M.; Sahraei, E. Deformation of lithium-ion batteries under axial loading: Analytical model and Representative Element. Energy Rep. 2021, 7, 2849–2861. [Google Scholar] [CrossRef]
- Bulla, M.; Kolupaev, V. Stress Analysis in Design with Plastics: Accessible Method with huge Impact. J. Polym. Mater. 2021, 74, 60–67. [Google Scholar]
- Keshavarzi, M.; Gilaki, M.; Sahraei, E. Characterization of in-situ material properties of pouch lithium-ion batteries in tension from three-point bending tests. Int. J. Mech. Sources 2022, 219, 107090. [Google Scholar] [CrossRef]
- Kisters, T.; Gilaki, M.; Nau, S.; Sahraei, E. Modeling of Dynamic Mechanical Response of Li-Ion cells with Homogenized Electrolyte-Solid Interactions. J. Energy Storage 2022, 49, 104069. [Google Scholar] [CrossRef]
- Song, Y.; Gilaki, M.; Keshavarzi, M.; Sahraei, E. A universal anisotropic model for a lithium-ion cylindrical cell validated under axial, lateral, and bending loads. Energy Sci. Eng. 2022, 10, 1431–1448. [Google Scholar] [CrossRef]
- Sahraei, E.; Meier, J.; Wierzbicki, T. Characterizing and modeling mechanical properties and onset of short circuit for three types of lithium-ion pouch cells. J. Power Sources 2014, 247, 503–516. [Google Scholar] [CrossRef]
- Zhang, X.; Sahraei, E.; Kai, W. Deformation and failure characteristics of four types of lithium-ion battery separators. J. Power Sources 2016, 327, 693–791. [Google Scholar] [CrossRef]
- Bulla, M.; Kolling, S.; Sahraei, E. An Experimental and Computational Study on the Orthotropic Failure of Separators for Lithium-Ion Batteries. Energies 2020, 13, 4399. [Google Scholar] [CrossRef]
- Altair Engineering, Inc. RADIOSS Manual, USA. 2022. Available online: www.altairhyperworks.com (accessed on 17 March 2020).
- Bulla, M.; Kolling, S.; Sahraei, E. A Material Model for the Orthotropic and Viscous Behavior of Separators in Lithium-Ion Batteries under High Mechanical Loads. Energies 2021, 14, 4585. [Google Scholar] [CrossRef]
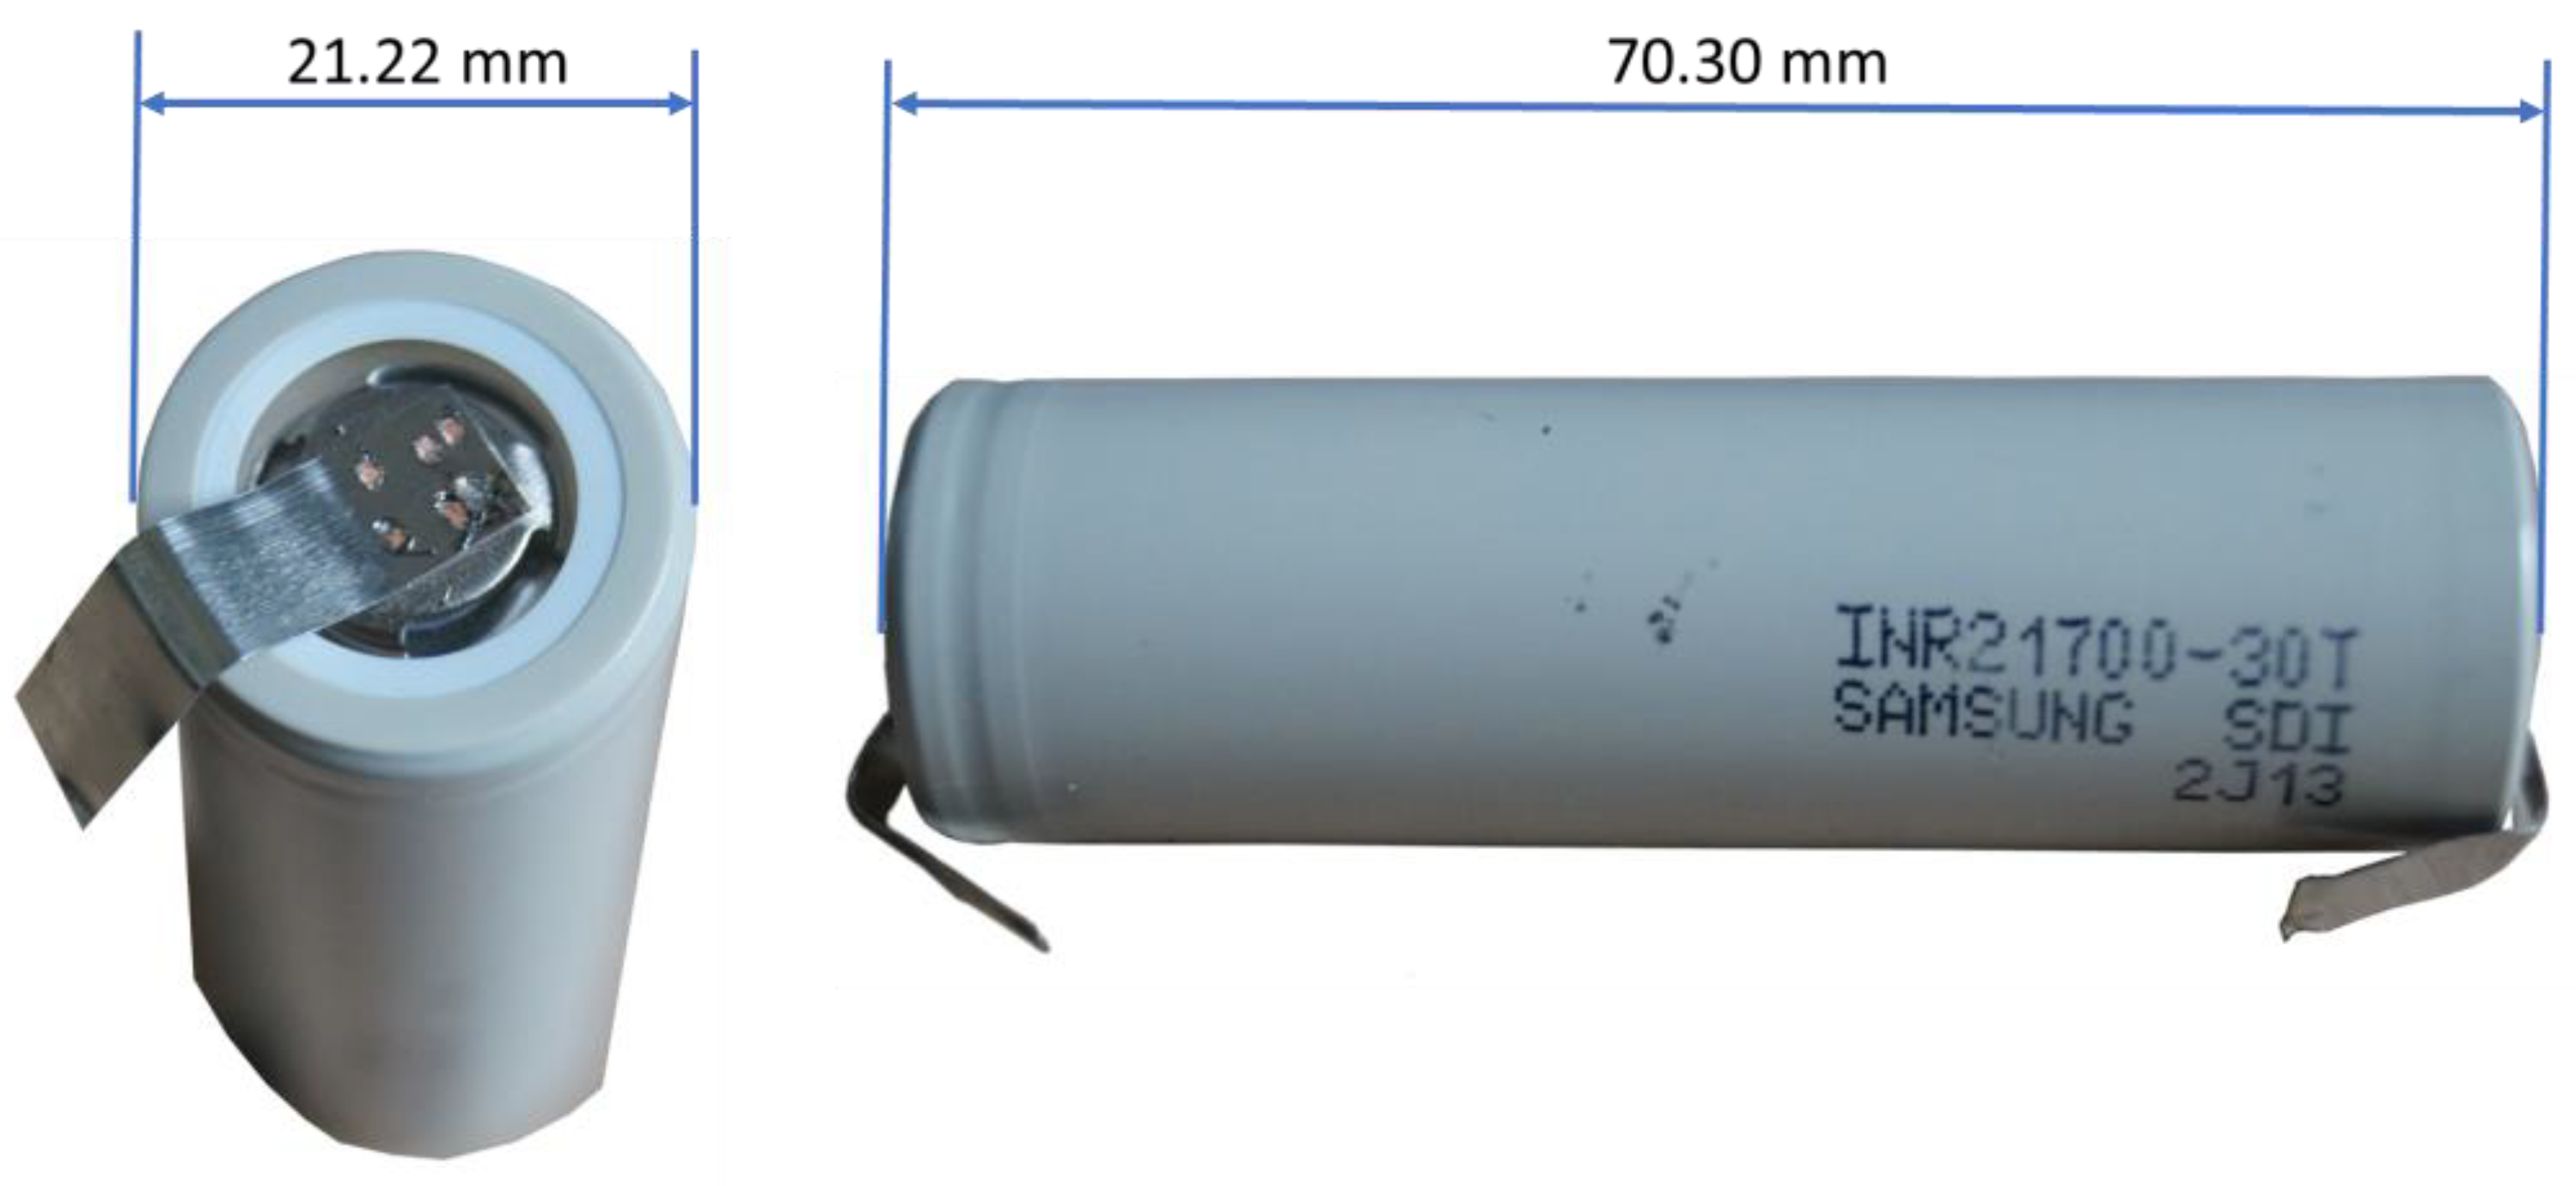
- Quinn, J.B.; Waldmann, T.; Richter, K.; Kasper, M.; Wohlfahrt-Mehrens, M. Energy Density of Cylindrical Li-Ion Cells: A Comparison of Commercial 18650 to the 21700 Cells. J. Electrochem. Soc. 2018, 165, A3284–A3291. [Google Scholar] [CrossRef]
- Waldmann, T.; Scurtu, R.-G.; Richter, K.; Wohlfahrt-Mehrens, M. 18650 vs. 21700 Li-ion cells—A direct comparison of electrochemical, thermal, and geometrical properties. J. Power Sources 2020, 472, 228614. [Google Scholar] [CrossRef]
- Sahraei, E.; Hill, R.; Wierzbicki, T. Calibration and finite element simulation of pouch lithium-ion batteries for mechanical integrity. J. Power Sources 2012, 201, 307–321. [Google Scholar] [CrossRef]
- Sahraei, E.; Bosco, E.; Dixon, B.; Lai, B. Microscale failure mechanisms leading to internal short circuit in Li-ion batteries under complex loading scenarios. J. Power Sources 2016, 319, 56–65. [Google Scholar] [CrossRef]
- Kotter, P.; Kisters, T.; Schleicher, A. Dynamic impact tests to characterize the crashworthiness of large-format lithium-ion cells. J. Energy Storage 2019, 26, 100948. [Google Scholar] [CrossRef]
- OpenRadioss. Available online: https://www.openradioss.org (accessed on 17 September 2022).
- Johnson, G.R.; Cook, W.H. A Constitutive Model and Data for Metals Subjected to Large Strains, High Strain Rates and High Temperatures. In Proceedings of the 7th International Symposium on Ballistics, Hague, The Netherlands, 21 April 1983. [Google Scholar]


| Nr. | Sample Name | Velocity (mms−1) | SoC (%) | Remark |
|---|---|---|---|---|
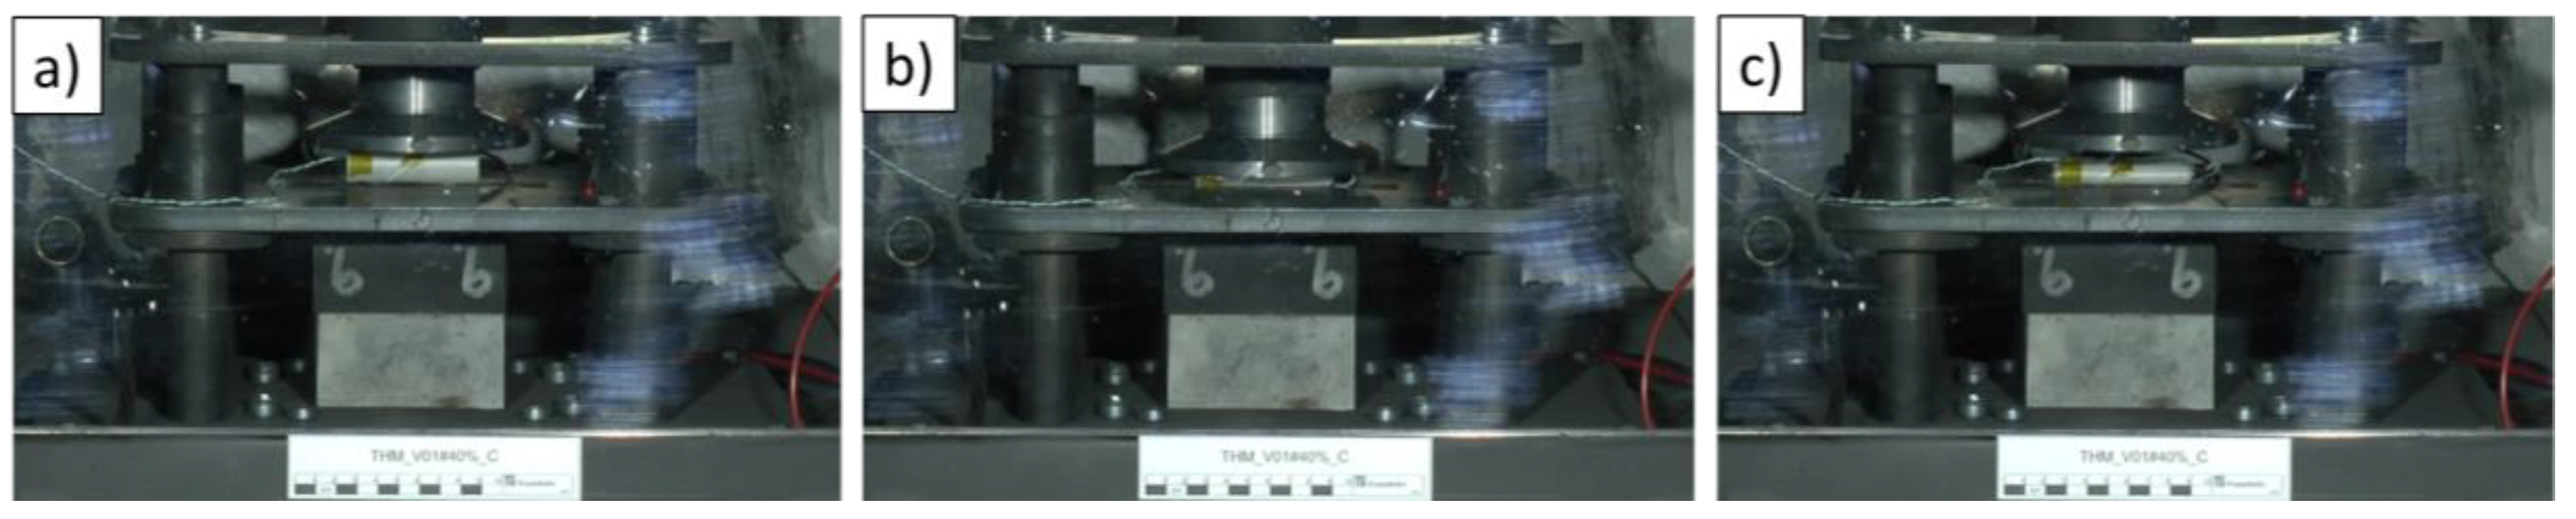
| 1 | THM_V01#40%_C | 10 | 40 | ok |
| 2 | THM_V02#40%_C | 10 | 40 | ok |
| 3 | THM_V03#40%_C | 10 | 40 | ok |
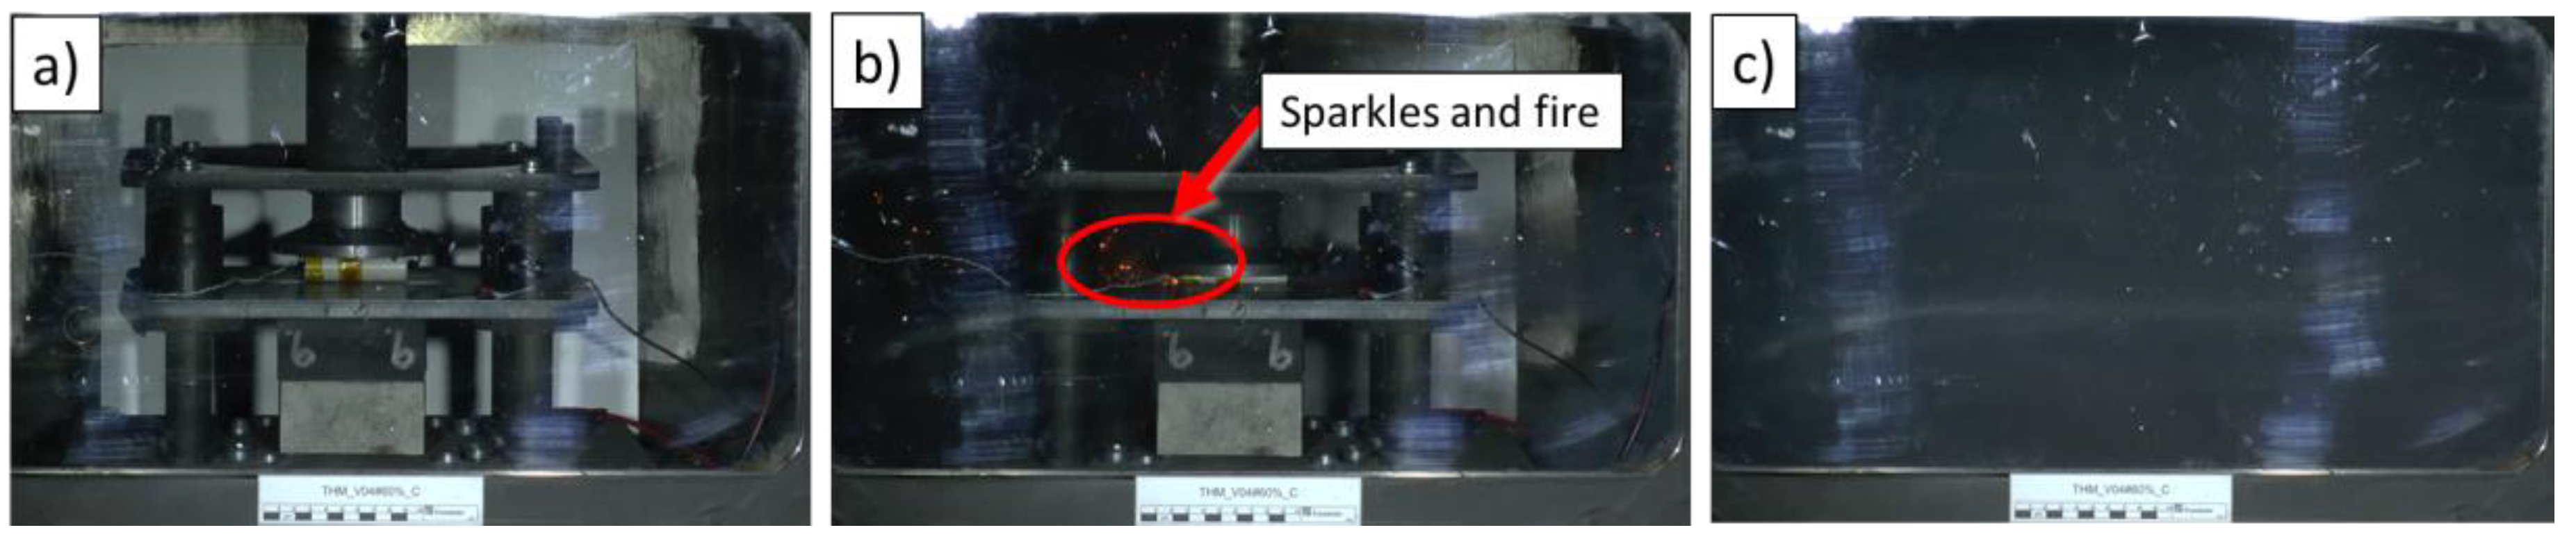
| 4 | THM_V04#60%_C | 10 | 60 | ok |
| 5 | THM_V05#60%_C | 10 | 60 | ok |
| 6 | THM_V06#60%_C | 10 | 60 | ok |
| 7 | THM_V07#80%_C | 10 | 80 | ok |
| 8 | THM_V08#80%_C | 10 | 80 | ok |
| 9 | THM_V09#80%_C | 10 | 80 | ok |
| 10 | THM_V10#100%_C | 10 | 100 | ok |
| 11 | THM_V11#100%_C | 10 | 100 | ok |
| 12 | THM_V12#100%_C | 10 | 100 | ok |
| 13 | THM_V13#40%_C | 100 | 40 | not ok |
| 14 | THM_V14#40%_C | 100 | 40 | ok |
| 15 | THM_V15#40%_C | 100 | 40 | ok |
| 16 | THM_V16#60%_C | 100 | 60 | ok, but no temperature data |
| 17 | THM_V17#60%_C | 100 | 60 | ok |
| 18 | THM_V18#60%_C | 100 | 60 | ok |
| 19 | THM_V19#80%_C | 100 | 80 | ok |
| 20 | THM_V20#80%_C | 100 | 80 | ok |
| 21 | THM_V21#80%_C | 100 | 80 | ok |
| 22 | THM_V22#100%_C | 100 | 100 | ok |
| 23 | THM_V23#100%_C | 100 | 100 | ok |
| 24 | THM_V24#100%_C | 100 | 100 | ok |
| 25 | THM_V25#40%_C | 1000 | 40 | ok |
| 26 | THM_V26#40%_C | 1000 | 40 | ok |
| 27 | THM_V27#40%_C | 1000 | 40 | ok |
| 28 | THM_V28#60%_C | 1000 | 60 | ok |
| 29 | THM_V29#60%_C | 1000 | 60 | ok |
| 30 | THM_V30#60%_C | 1000 | 60 | ok |
| 31 | THM_V31#80%_C | 1000 | 80 | ok |
| 32 | THM_V32#80%_C | 1000 | 80 | ok |
| 33 | THM_V33#80%_C | 1000 | 80 | ok |
| 34 | THM_V34#100%_C | 1000 | 100 | ok |
| 35 | THM_V35#100%_C | 1000 | 100 | ok |
| 36 | THM_V36#100%_C | 1000 | 100 | ok |
Disclaimer/Publisher’s Note: The statements, opinions and data contained in all publications are solely those of the individual author(s) and contributor(s) and not of MDPI and/or the editor(s). MDPI and/or the editor(s) disclaim responsibility for any injury to people or property resulting from any ideas, methods, instructions or products referred to in the content. |
© 2022 by the authors. Licensee MDPI, Basel, Switzerland. This article is an open access article distributed under the terms and conditions of the Creative Commons Attribution (CC BY) license (https://creativecommons.org/licenses/by/4.0/).
Share and Cite
Bulla, M.; Schmandt, C.; Kolling, S.; Kisters, T.; Sahraei, E. An Experimental and Numerical Study on Charged 21700 Lithium-Ion Battery Cells under Dynamic and High Mechanical Loads. Energies 2023, 16, 211. https://doi.org/10.3390/en16010211
Bulla M, Schmandt C, Kolling S, Kisters T, Sahraei E. An Experimental and Numerical Study on Charged 21700 Lithium-Ion Battery Cells under Dynamic and High Mechanical Loads. Energies. 2023; 16(1):211. https://doi.org/10.3390/en16010211
Chicago/Turabian StyleBulla, Marian, Christopher Schmandt, Stefan Kolling, Thomas Kisters, and Elham Sahraei. 2023. "An Experimental and Numerical Study on Charged 21700 Lithium-Ion Battery Cells under Dynamic and High Mechanical Loads" Energies 16, no. 1: 211. https://doi.org/10.3390/en16010211