Abstract
The testing of roller rotational resistance is essential in improving and searching for new design solutions to reduce the energy consumption of belt transport. The publication presents three methods of testing idler rotational resistance using various laboratory test stands designed and built by the authors. According to the first method, the test consists of applying torque to the roller axis and measuring the resistance force to rotate the roller axis. According to the second method, the test consisted of speeding up the idler, measuring the free stopping time and determining the moment of resistance to rotating the idler. The third stand enables the simulation of loads recommended by the PN-M-46606: 2010 and DIN 22112 standards, as well as operational loads, while measuring the dynamic rotational resistance. The comparative tests used two rollers different in terms of bearing type, hub type and quality of craft. The research object was ø133 × 465 rollers, most commonly used in the raw materials industry. The result of the research carried out is the assessment of the possibility of reducing the energy consumption of the belt conveyor by appropriate selection of the design features of a typical idler.
1. Introduction
The main element of the raw materials transport system in the industry related to the extraction and processing of mineral resources are belt conveyors. They ensure adequate efficiency while maintaining high availability as a means of continuous transport. Despite being the best energy consumption indicators, among other used transport devices, belt conveyors cause an increase in the percentage share of the cost of transport in the total operating costs of the mine. One of the reasons is the increase in the length of transport routes, another being the constantly growing costs of electricity. Due to this phenomena, activities aimed at reducing the energy consumption of belt conveyors are becoming more and more important [1,2,3].
The improvement of energy consumption indicators for belt transport can be achieved by increasing the utilization of the transport capacity of conveyors and by improving the efficiency of drive systems and reducing the resistance to the motion of the conveyor [4,5].
As the authors focused on the problem of roller rotational resistance, they found it necessary to show these resistances in relation to the total energy consumption of the conveyor. The sources of energy loss during the operation of the belt conveyor are the friction forces, gravity and inertia, constituting the resistance to the motion of the whole conveyor. They can be divided into primary resistance—equally distributed along the entire conveyor route; secondary resistance—concentrated in specific points of the conveyor; and grade resistance—occurring only on inclined sections of the route.
It is impossible to formulate a general thesis that any of the above-listed resistance components are the most important because their structure depends on the configuration of the belt conveyor [5]. In the case of inclined conveyors, the energy consumption is determined by the grade resistance. For an average slope of the route of 2°, the gradient resistance is about 50% and for 5° it is even 80% of total resistance to the motion of a conveyor. These resistances do not depend on the operational parameters of the conveyor’s structural elements but instead on the configuration of the route while not allowing for a reduction in energy consumption. A quite different situation is the case of the primary resistance WG. The components of WG (1) resistances are as follows (Figure 1) [1]:
where:
WG = Wk + We + Wr + Wf + Ws [N]
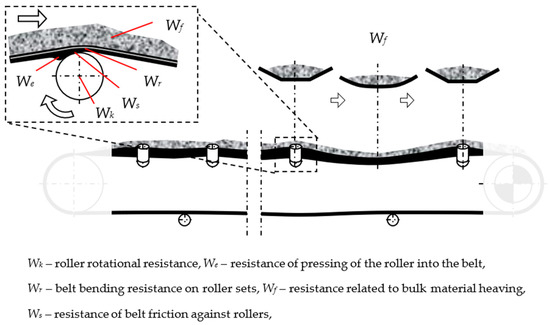
Figure 1.
Components of the primary resistance of the conveyor.
- The rotation of idlers, depending on the friction torque in bearings—Wk [N];
- Moving the belt along rollers, related to pressing the roller into the rubber belt—We [N];
- Bending the belt on roller sets—Wr [N];
- Related to bulk material heaving—Wf [N];
- Belt friction against rollers, related to the interaction between the roller surface and the rubber belt—Ws [N].
The primary resistances significantly depend on the properties of the belt conveyor components and have a crucial influence on the energy consumption of long conveyors with a slight inclination angle. Therefore, by appropriately selecting operating parameters and using appropriate components, such as energy-saving belts and rollers with low rotational resistance, it is possible to reduce the energy consumption of the belt conveyor drive [1].
For horizontal belt conveyors, the main design factor determining the energy consumption is the type of rubber compound of the covers of the belt. It affects resistances Wk and Ws, which constitute about 60% of the total resistance to the motion of a conveyor. Another element significantly influencing the energy consumption is the roller rotational resistance Wk. It can be from 17% to 23% of total resistances, depending on the level of loading of the conveyor (Figure 2) [1].
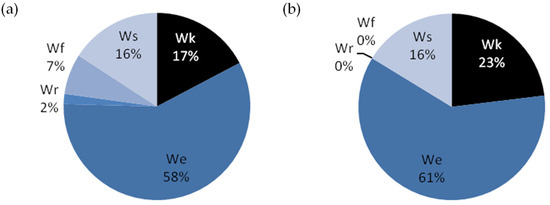
Figure 2.
The structure of the primary resistances of the horizontal conveyor (a) loaded and (b) empty.
The main task of the rollers is to support the belt along the conveyor; they also assure center run of the belt. Rollers are installed in huge quantities. Usually there is more than 3000 rollers per kilometer of route. That is why rollers are an essential component in the operating costs of belt conveyors [6,7]. Thus, the rollers’ quality has a significant influence on the power consumption and reliability of a conveyor [8].
The parameter that allows one to estimate the quality of the roller is its rotational resistance. The roller rotational resistance is related to the friction moment in the bearings. To overcome that resistance, appropriate force must be applied to the roller shell. The value of roller rotational resistance depends on many factors related to its structure (e.g., bearing quality, type of sealing), production quality (e.g., machining and assembly accuracy) and operating conditions (e.g., load, humidity or dust) [9,10,11].
All these factors ultimately accumulate in the bearing nodes, which determine the functional properties of the roller. The bearing nodes of the roller should be understood as bearings and seals. The friction torque in a bearing depends, among other things, on the type and size of the bearing, load, rotational speed, amount of lubricant, etc. The total friction is the sum of the rolling and sliding friction in the contact area of the rolling elements with the raceway, the friction in the lubricant and the sliding friction of the contact sealing. Assuming that the bearing load is about 10% of its load capacity, good lubrication and normal operating conditions are ensured; the frictional torque in the bearing is the product of the dynamic bearing load, the coefficient of friction and the pitch diameter of the bearing [12].
When a more precise determination of the frictional torque is required, an approach is used, which consists of dividing the frictional torque (2) into a torque independent of the load M0 (3) and a torque dependent on the load M1 (4). The torque M0 depends mainly on the rolling speed and the hydrodynamic losses in the lubricant in the lubricating medium, which are influenced by the quantity and viscosity of the oil. The general relations recommended for the determination of the values of these components are substantially similar. The values of the adopted coefficients differ slightly. They take the form of:
where:
M—frictional torque [Nmm];
ν—kinematic viscosity of the oil [mm2s−1];
n—rotational speed [min−1];
dm—bearing pitch diameter (d + D)/2 [mm];
f0—factor depending on the type and size of the bearing and type of lubrication;
f1—factor depending on the type and size of the bearing and permissible static load factor;
g1—factor depending on the load direction (2 ÷ 3);
P0—equivalent rest load [N].
Bearing manufacturers (NSK, SKF, FAG, Timken) also introduce empirical relationships to determine the value of frictional resistance in the bearing. The literature [12] summarizes the results of estimating the frictional torque for three commonly used bearings. In the presented comparison, the values of the frictional torque in the model adopted by SKF give values three times higher than those in the case of using other (primary) dependencies.
In the roller, the possibility of many inaccuracies related to the mounting of the bearing, the simultaneous occurrence of radial and axial loads, radial runout, unbalance, applied sealing all combine to result in the rotational resistance [13,14]. Therefore, it is justified to choose a satisfactory method of testing roller rotational resistance and conduct laboratory tests to accurately estimate this parameter, especially for operational loads.
During operation rollers, load is radial and axial [13,14]. The radial load is generated by the mass of the transported material, the belt weight itself and the tension force of belt [15].
Related standards specify permissible roller rotational resistances. Those standards recommend testing roller rotational resistance at a radial load of 250 N [7]. However, the roller operating loads are significantly greater [16]. Therefore, the standard requirements should instead be treated as outlines for roller quality control.
The tests of rollers loaded at a radial force of up to 8 kN are discussed in publications [17,18]. The research methodology and mathematical model allowed for a theoretical estimation of the dependence of the rotational resistance on the value of the applied radial force. Rollers used in open pit mines were tested. The literature [17,18] presents the results of roller rotational resistance tests carried out according to the standards and industrial tests under operational load.
The publication [19] analyzes the phenomenon of bending the shell and the roller axis under radial force. Different deflections of the shell and the roller axis increase the resistance to idler rotation. The papers [17,18] also present a list of tests of selected idlers loaded with a radial force in the range of 0 ÷ 8 kN, which shows that the rotation resistance increases from about 2 N to almost 7 N. Due to a large number of rollers used in the industry, it is justified to present, compare and assess roller testing methods to indicate their usefulness.
This publication presents and evaluates methods of testing roller rotational resistance and is an original contribution to the state of the art. For each method, results were presented and discussed. On the basis of these results, an analysis of the possibility of reducing the energy consumption of belt conveyor was undertaken.
2. Methodology of Research on Roller Rotational Resistance
Two rollers with a shell diameter of 133 mm and a length of 465 mm with 6305 C3 bearings were selected for the tests (Figure 3). Rollers differed in the type of hub, weight and quality of components, e.g., bearings. Selected rollers were marked: A6—a roller with a cast-iron hub and K2 with a pressed steel hub. The A6 roller used high-quality bearings from a reputable manufacturer, while the K2 roller was equipped with low-quality bearings.
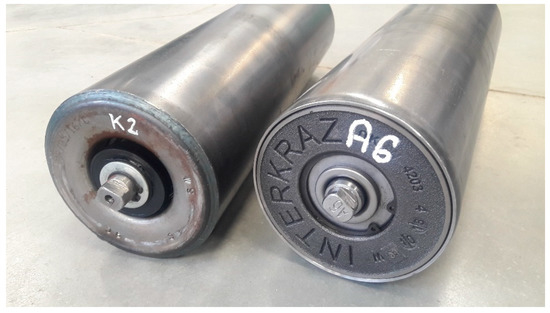
Figure 3.
View of the idlers for testing.
The tests of idler rotational resistance were carried out using three methods:
- Rotating axle test—RAT;
- Coasted roller test—CRT;
- Loaded roller method—LRM.
The RAT and CRT methods are simple tests, and the result is value of the idler rotational resistance Wk [N] obtained without a radial load.
This test, according to the LRM method, was defined by PN-M-46606: 2010 and DIN 22112 standards. Manufacturers and users of idlers use it. This test provided the roller test with a radial load applied to the rotating shell and best reflected the idler’s actual work and load condition.
2.1. Roller Resistance Tests on a Stand with a Rotary Axis—RAT
The tests of idler rotation resistance using the RAT method were carried out on the stand shown in Figure 4. The stand’s base was attached to a drive module with its frame. The roller on the stand was mounted in two self-centering three-jaw holders.
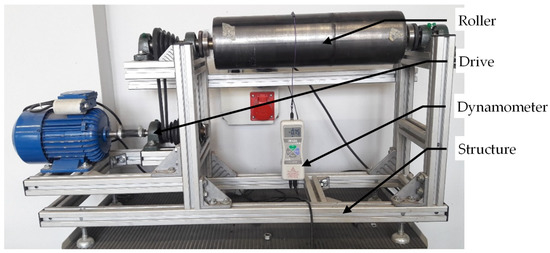
Figure 4.
View of the mobile stand for testing idler rotational resistance.
The rotational resistance was measured with an electronic dynamometer, which enabled the indication to be read directly or recorded on a computer. The measuring range of the force sensor was ±50 N, the sampling frequency was 20 Hz and the accuracy was ±0.2%.
The idler axis drive enabled measurements at selected rotational speed values.
Each measurement was performed five times, and the results were averaged. The roller rotational resistance was the average value from the stabilized course. The Table 1 below showed the values of the rotational resistance of the tested rollers, A6 and K2.

Table 1.
The RAT method results.
According to the tests carried out by RAT method, the value of the average rotational resistance force Wk of the A6 idler was 0.54 ± 0.013 N, and for the K2 idler it was 1.54 ± 0.16 N. That is, the resistance to rotating Wk of the idler A6 was almost three times lower than the resistance to rotating the idler K2.
2.2. Coasted Roller Tests—CRT
To determine the value of the rotational resistance using the CRT method, the braking time of an accelerated roller with a known moment of inertia value should be measured.
The tests were carried out on the stand shown in Figure 5. The tested roller was mounted in the supports and accelerated with the drive wheel to the assumed initial speed. The drive wheel was mounted with the motor on a pivoted frame.
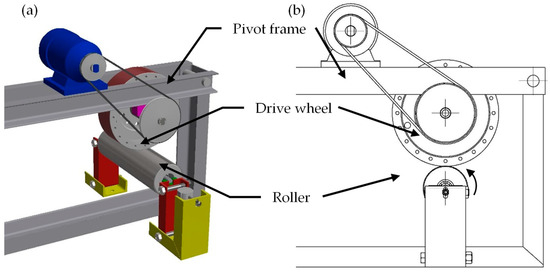
Figure 5.
Computer visualization (a) and diagram (b) of the stand for CRT method.
Procedure of the CRT method is as follows:
- Acceleration of the roller shell to speed n1 = 610 rpm and n2 = 1250 rpm;
- Disconnection of the drive wheel and beginning to measure coasting time, T;
- Calculation of the rotational resistance force Wk from the Formula (5):
- I—Roller mass moment of inertia [kgꞏm2];
- n—The initial rotational speed [rpm];
- Ts—Coasting time, [s];
- R—Roller radius [m].
The mass moment of inertia of the roller rotational parts can be measured or determined as the product of the mass of rotational parts and the square of its radius.
Table 2 presents the values of the times in the free stopping of the tested idlers, accelerated to the speed n1 = 610 and n2 = 1250 rpm.
Table 2.
The CRT method results.
During the test, the instantaneous value of the idler rotation resistance decreased and was dependent on the decreasing rotational speed. The CRT method allowed us to determine an approximate value of the rotational resistance only. For the A6 idler, it was Wk = 0.43 ÷ 0.65 N, and for the K2 idler—Wk = 1.19 ÷ 1.60 N.
2.3. Loaded Roller Method
Tests according to the LRM method were carried out on the stand shown in Figure 6 [13]. The roller was installed in a rigid pivotally supporting frame. The drive and adjusting of the roller radial load were implemented using a toothed belt.
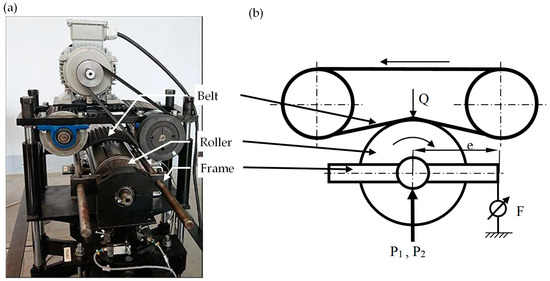
Figure 6.
Picture (a) and diagram (b) of the stand for measuring the rolling resistance LRM.
When measured, the force F acting on arm e and the radial force Q loading the idler, as the sum of forces in both supported P1 and P2, were recorded. Roller rotational resistance Wk was calculated from Formula (6):
where:
F—reaction force;
d—roller diameter;
e—arm of force F.
Force F was measured with a force gauge of range of 100 [N]. The sampling frequency was 1 [kHz], and the measurement precision was ±0.13 [N]. Each test was repeated five times.
The initial conditions assumed in tests were as follows:
- Value of radial force: 0, 250 and 700 N;
- Idler rotational speed of 6501/min.
Collective charts in Figure 7 and Figure 8 show selected waveforms of rotational resistance with radial loads of 0, 250 and 700 N. For K2 roller (Figure 8), the average values of the rotational resistance range from 2.9 N to 4.6 N. For the value of the radial load of 250 N recommended by the PN 46606 standard, the 133 × 465 roller met its requirements. However, when the roller was loaded with a radial force of 700 N, the resistance value exceeded the maximum allowable rolling resistance, which should be 4 N at most.
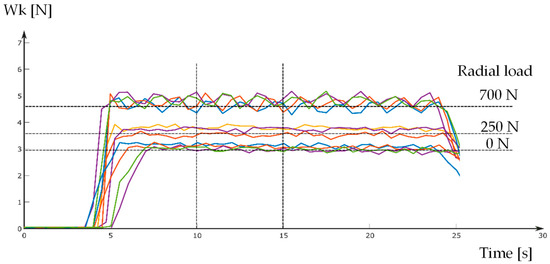
Figure 7.
Graph of the K2 roller rotational resistance during the LRM test.
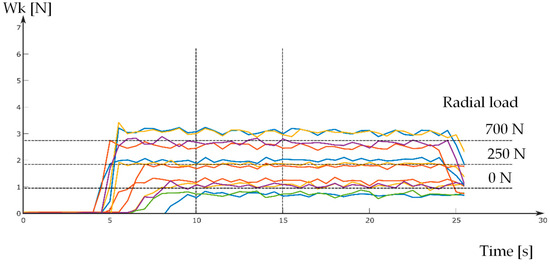
Figure 8.
Graph of the A6 roller rotational resistance during the LRM test.
Figure 8 shows the waveforms of the A6 roller rotational resistance for different states of radial force load. Depending on this load, the average values of the resistance force ranged from 1 N to 2.8 N.
Table 3 summarizes the final results of the LRM measurements. The results showed the rotational resistance’s dependence on the roller’s structure and quality. In the case of the tested rollers, the differences reached up to 300%. The radial load of the roller was also essential, as it caused a significant increase in rotational resistance.
Table 3.
The LRM method results.
3. Results
The graphs (Figure 9a) summarize the values of the rotational resistance of rollers obtained during the tests, according to the methods used. The CRT and RAT methods do not reflect the actual operating condition of the roller, and the obtained values of the rotational resistance are very low. The LRM method takes into account the entire specifics of the roller’s work, including its balance and radial runout. Therefore, the rotational resistance values measured with this method are the most reliable and can be used, for example, to determine the energy consumption of a conveyor.
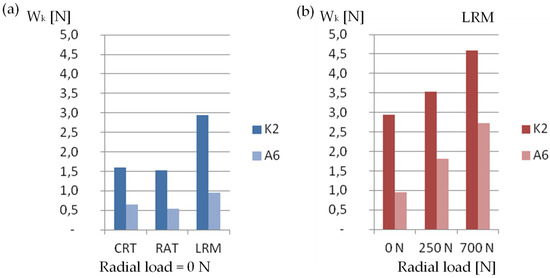
Figure 9.
K2 and A6 roller rotational resistance depending on the measurement method (a) and the radial load (b).
Figure 9b shows the value of the rotational resistance of the tested rollers and their changes depending on the radial load. Along with the increase in the radial load, the values of the rotational resistance of the tested rollers increase proportionally.
4. Discussion
Using the QNK-TT [20] computer program, co-created by one of the authors, the structure of the main resistance components were analyzed. A series of energy consumption calculations for the horizontal belt conveyor were performed, for which the procedure of the roller replacement to better quality ones with lower rotational resistance was planned.
The QNK-TT (Figure 10) software supports the design of belt conveyors in terms of calculations and the selection of operating parameters, a configuration of conveyor elements and the analysis of its operation. The calculation algorithm of the QNK program is based on standard methods and, above all, on many years of experience and research results carried out by the research teams of the Wroclaw University of Science and Technology and the AGH University of Science and Technology [20].
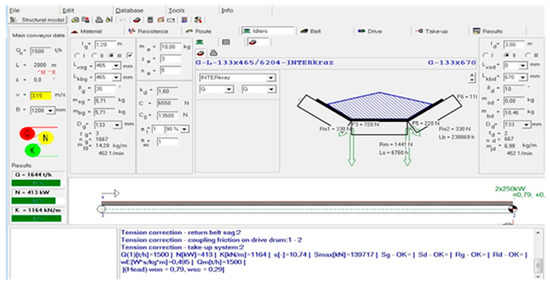
Figure 10.
QNK-TT program interface.
The calculation results (Figure 11) of the power consumption of a 2 km long horizontal belt conveyor showed that replacing the belt supporting rollers the K2 with A6 will reduce the power consumption of the conveyor drive by between 9 and 23% compared to the state before the modernization.
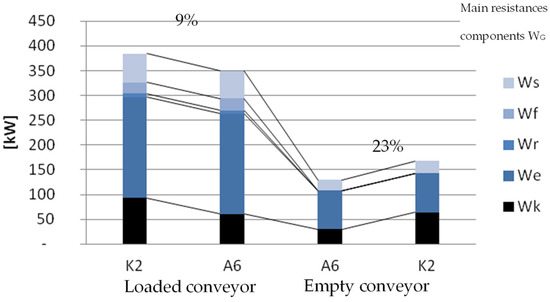
Figure 11.
Power consumption by the drive of the horizontal belt conveyor: loaded and empty for the K2 and A6 rollers.
5. Conclusions
The publication compares three methods of testing the rotational resistance of belt conveyor rollers. Table 4 presents a comparison of the essential features of the research methods.
Table 4.
Comparison of the features of research methods.
The RAT and CRT methods are easy to perform and do not require a specialized stand or a measurement and data acquisition system. The results obtained in the RAT and CRT tests are similar. Generally available devices, such as a lathe and simple measuring devices, can be used to perform the test with these methods. However, these methods have severe application limitations. They only allow for a coarse estimation of the roller rotational resistance and may be helpful for the evaluation or comparison of idlers by the manufacturers or users.
A reliable method for measuring the roller rotational resistance in laboratory conditions is the LRM method, which provides the test with a radial load and best reflects the roller’s actual work and load condition. However, the LRM needs an advanced test stand with a complex gauge system. This method allows for the accurate determination of roller rotational resistance. Obtained measure data allow for advanced analysis of dynamics phenomena, e.g., vibrations. The results of the LRM method can be used in numerical methods of calculating the energy consumption of belt transport, e.g., using the QNK program.
Simulation computational methods of designing belt conveyors confirm that the value of the rotational resistance of a single roller, affecting the energy consumption of the entire conveyor, is essential. In the example of the 2 km long horizontal conveyor, the power consumption of the drives may be 23% lower after using a better quality roller with lower rotational resistance.
Author Contributions
Conceptualization, P.K. (Piotr Kulinowski), P.K. (Piotr Kasza) and J.Z.; investigation, P.K. (Piotr Kasza) and J.Z.; supervision, P.K. (Piotr Kulinowski); visualization, P.K. (Piotr Kulinowski), P.K. (Piotr Kasza) and J.Z.; writing—original draft, P.K. (Piotr Kulinowski), P.K. (Piotr Kasza) and J.Z.; writing—review and editing, P.K. (Piotr Kulinowski), P.K. (Piotr Kasza) and J.Z.; formal analysis, P.K. (Piotr Kulinowski). All authors have read and agreed to the published version of the manuscript.
Funding
This research received no external funding.
Data Availability Statement
Not applicable.
Conflicts of Interest
The authors declare no conflict of interest.
References
- Gładysiewicz, L. Przenośniki taśmowe. In Teoria i Obliczenia; Oficyna Wydawnicza Politechniki Wrocławskiej: Wrocław, Poland, 2003. [Google Scholar]
- Köken, E.; Lawal, A.I.; Onifade, M.; Özarslan, A. A comparative study on power calculation methods for conveyor belts in the mining industry. Int. J. Mining. Reclam. Environ. 2022, 36, 26–45. [Google Scholar] [CrossRef]
- Kawalec, W.; Suchorab, N.; Konieczna-Fuławka, M.; Król, R. Specific energy consumption of a belt conveyor system in a continuous surface mine. Energies 2020, 13, 5214. [Google Scholar] [CrossRef]
- Zhang, S.; Xia, X. Modelling and energy efficiency optimization of belt conveyors. Appl. Energy 2011, 88, 3061–3071. [Google Scholar] [CrossRef]
- Mathaba, T.; Xia, X. A parametric energy model for energy management of long belt conveyors. Energies 2015, 8, 12375. [Google Scholar] [CrossRef]
- Pytlik, A. Durability Testing of Idlers for Belt Conveyors. J. Sustain. Min. 2013, 12, 1–7. [Google Scholar] [CrossRef][Green Version]
- Gładysiewicz, L.; Kawalec, W.; Król, R. Selection of carry idlers spacing of belt conveyor taking into account random stream of transported bulk material. Eksploat. I Niezawodn.—Maint. Reliab. 2016, 18, 32–37. [Google Scholar] [CrossRef]
- Kulinowski, P.; Kasza, P.; Zarzycki, J. Influence of design parameters of idler bearing units on the energy consumption of a belt conveyor. Sustainability 2021, 13, 437. [Google Scholar] [CrossRef]
- Król, R.; Kisielewski, W.; Kaszuba, D.; Gładysiewicz, L. Laboratory Tests of Idlers Rotational Resistance—Selected Issues. Procedia Earth Planet. Sci. 2015, 15, 712–719. [Google Scholar] [CrossRef][Green Version]
- Król, R.; Gladysiewicz, L.; Kaszuba, D.; Kisielewski, W. New Quality Standards of Testing Idlers for Highly Effective Belt Conveyors. In IOP Conference Series: Earth and Environmental Science; IOP Publishing: Bristol, UK, 2017. [Google Scholar] [CrossRef]
- Kulinowski, P.; Kasza, P.; Zarzycki, J. The methodology of testing rotational resistances of the rollers under the operation load. New Trends Prod. Eng. 2019, 2, 337–343. [Google Scholar] [CrossRef][Green Version]
- Adamczak, S.; Domagalski, R.; Sender, E. Friction torque in rolling bearings—Methods and test facilities. Tribologia 2011, 240, 19–28. [Google Scholar]
- Zakharov, A.; Gerike, B.; Shiryamov, D. The Ultimate Rotating Resistance of the Belt Conveyors Rollers. AER-Adv. Eng. Res. 2018, 176, 227–230. [Google Scholar]
- Wheeler, C.A. Rotating resistance of belt conveyor idler rolls. J. Manuf. Sci. Eng. Trans. ASME 2016, 138, 041009. [Google Scholar] [CrossRef]
- Furman, K. Analysis of load application on idler roller bearing of belt conveyor in different dynamic models. J. Frict. Wear 2009, 30, 142–147. [Google Scholar] [CrossRef]
- Król, R.; Kisielewski, W. Research of loading carrying idlers used in belt conveyor—Practical applications. Diagnostyka 2014, 15, 67–73. [Google Scholar]
- Gładysiewicz Lech; Król Robert; Kisielewski Waldemar: Measurements of loads on belt conveyor idlers operated in real conditions. Measurement 2019, 134, 336–344. [CrossRef]
- Król, R. Studies of the Durability of Belt Conveyor Idlers with Working Loads Taken into Account. IOP Conf. Ser. Earth Environ. Sci. 2017, 95, 042054. [Google Scholar] [CrossRef]
- Król, R. Metody Badań i Doboru Elementów Przenośnika Taśmowego z Uwzględnieniem Losowo Zmiennej Strugi Urobku; Oficyna Wydawnicza Politechniki Wrocławskiej: Wrocław, Poland, 2013. [Google Scholar]
- Kawalec, W.; Kulinowski, P. The calculation of belt conveyors the basic method and unit resistance in integrated environment of programme. Transp. Przemysłowy 2007, 1, 6–11. [Google Scholar]


Disclaimer/Publisher’s Note: The statements, opinions and data contained in all publications are solely those of the individual author(s) and contributor(s) and not of MDPI and/or the editor(s). MDPI and/or the editor(s) disclaim responsibility for any injury to people or property resulting from any ideas, methods, instructions or products referred to in the content. |
© 2022 by the authors. Licensee MDPI, Basel, Switzerland. This article is an open access article distributed under the terms and conditions of the Creative Commons Attribution (CC BY) license (https://creativecommons.org/licenses/by/4.0/).