Article

Solar-DG and DSTATCOM Concurrent Planning in Reconfigured Distribution System Using APSO and GWO-PSO Based on Novel Objective Function

by
Bikash Kumar Saw
1,
Aashish Kumar Bohre
1,
Jalpa H. Jobanputra
2 and
Mohan Lal Kolhe
3,*
1
Department of Electrical Engineering, National Institute of Technology, Durgapur 713209, India
2
Electrical Engineering Department, Shroff S R Rotary Institute of Chemical Technology, UPL University of Sustainable Technology, Ankleshwar 393135, India
3
Faculty of Engineering and Science, University of Agder, 4604 Kristiansand, Norway
*
Author to whom correspondence should be addressed.
Energies 2023, 16(1), 263; https://doi.org/10.3390/en16010263
Submission received: 20 November 2022 / Revised: 15 December 2022 / Accepted: 22 December 2022 / Published: 26 December 2022
(This article belongs to the Section A1: Smart Grids and Microgrids)

Abstract

:
The concurrent planning of multiple Distributed Generations (DGs), consisting of solar-DG and DSTATCOM with reconfiguration in IEEE 33 and 69 bus Radial Distribution Network (RDN), using Adaptive Particle Swarm Optimization (APSO) and hybrid Grey Wolf-Particle Swarm Optimization (GWO-PSO), is reported in this paper. For this planning, a novel multiple objective-based fitness-function ( M O F F ) is proposed based on various performance parameters of the system, such as power losses (both active, as well as reactive loss), system voltage profile, short circuit level of line current (SCLLCurrent), and system reliability. The economic perspective of the system has also been considered based on the various costs, such as fix, loss, and Energy Not Supplied (ENS) cost. Two case studies have been presented on IEEE 33 and 69 bus RDN to validate the efficacy of the proposed methodology. The results analysis of the system shows that better performance can be achieved with the proposed technique for 33 and 69 bus RDN, using GWO-PSO rather than APSO. From this results analysis, a vital point is noticed that the SCLLCurrent is reduced, which causes the short-circuit (fault) tolerance capacity (level) of the RDN to become enhanced. Finally, the comparative analysis of the obtained results, using the proposed method with other methods that exist in different literature, reveals that the proposed method has performed better from a techno-economic prospective.

1. Introduction

A power system has mainly four parts: generation sector, transmission sector, distribution sector, and utility sector/ends. The distribution sector is a vital part among all the four parts of the power system. This sector suffers from a massive amount of losses related to power (real power losses-PLoss and reactive power losses-QLoss) and deviation in voltage (VD), with system reliability (RS) issues. These need to be minimized by applying heuristic optimization techniques. This will maintain the short circuit level of line current and economy of the system. Consequently, it will improve the operation and control of the system. Varied kinds of solution methods are available, among which concurrent multiple DG planning and concurrent multiple DG planning with reconfiguration in RDN are proposed in this paper, as they are superior to others. Only DG planning and DG planning with reconfiguration through tie switches will enhance the profile of the voltage, fault (short circuit) current tolerance capacity, or level, as well as the reliability of the RDN.
This is because, through this planning approach, the reduction in system power losses and SCLLCurrent can be achieved. At the same time, the considered economic factors, such as fix, loss, and ENS cost, will also reduce. The IEEE 33-bus and 69-bus RDN are considered to validate the proposed approach. The RDNs are the least expensive and simplest for their construction and protection scheme; these networks never make any loop for their radial nature. Therefore, it is important to maintain network radiality. While performing the reconfiguration, the radiality of the distribution network must be maintained so that the distribution network will not make any loop.

1.1. Literature Survey

In [1], the planning of solar-DG and DSTATCOM in IEEE 118 and 69-bus RDN, using Ant Lion Optimizer (ALO) and Modified ALO (MALO), considering seasonal load variation with solar-irradiance to optimize the total annual cost, bus voltage deviation, and stability. In the article, Ref. [2] the author allocates DSTATCOM and PV in the IEEE 30-bus system to reduce the real power loss, using the Fuzzy Lightning Search Algorithm (Fuzzy LSA). The system reconfiguration and objective parameters, such as QLoss, RS, and SCLLCurrent, can also be included for the considered system planning in both of the above literature. In the proposed work, technical and economic objectives, along with social objectives, such as benefit-cost ratio, emission cost-benefit, and voltage profile enhancement indices, are considered for the optimal location and size of DG and DSTATCOM, using PSO with adaptive inertia weight [3]. In addition to these objectives, the PLoss, QLoss, RS, and SCLLCurrent can also be considered for this planning. In [4], the target is to enhance techno-economic benefit through improving system voltage and reducing line losses, along with the pollutants emission, using the Improved Crow-Search Algorithm (Improved-CSA) for planning different Renewable Energy Sources (RES) and DSTATCOM in the 51-bus practical distribution network, considering variable load. Here, the authors found that the planning of different devices is better in weaker buses as compared to the healthier buses with respect to computational time and algorithm performance. Parameters such as RS and SCLLCurrent with system reconfiguration have not considered in this work.
In [5], it is concluded that compensating the real and reactive power using DG and DSTATCOM integration with Cuckoo Search Algorithm (CSA) leads to improvement in overall energy efficiency, power quality, voltage profile, power factor, load balancing, and system stability. Along with this power loss, on-peak operating costs and pollutant emissions of IEEE 12-bus, 34-bus, and 69-bus RDN are minimized. In this work, many techno-economic perspectives are addressed, but QLoss, RS, and SCLLCurrent can also be addressed here. In [6], with variable load and uncertainty of DG output, the DGs and DSTATCOM are allocated using fuzzy logic-based Rooted Tree Hybrid Optimization (fuzzy logic RTO) to improve the profile of voltage, economic, and environmental benefits with a reduction in losses on 118 and 69-bus RDNs, which is investigated. The optimal size and optimal allocation of DSTATCOM utilizing the bat algorithm, based on the voltage stability index, for the reduction in a power loss of 33 and 69-bus RDN is presented in [7]. In [8], the revealed result indicates that the proposed objective has been achieved with 75.93% and 44.71% as loss reduction, 51.76% and 33.2% as voltage profile improvement, and 36.42% and 33.2% as load balancing, respectively, for both the considered IEEE Tai-Power 11.4 kV and 33-bus distribution network. In addition, network reconfiguration can also be done in [6,7], whereas the proposed work of [6,7,8] can be extended further, considering the RS and SCLLCurrent as other indices.
The simulation results of all three cases using Extended Nondominant Sorting Genetic Algorithm II (Extended NSGA II) reveal that planning of PV with Battery and DSTATCOM maximizes the objective parameters by maintaining all security constraints, such as power flow, voltage unbalance, and power factor, as given in [9]. The presented work can also be extended and validated by including PLoss, QLoss, and SCLLCurrent, with other factors of reliability instead of ENS only. The integration of biomass and intermittent renewable DGs with capacitor banks in 94-bus Portuguese RDN is proposed in [10], where the objective has been achieved with the reduction in PLoss up to 77.82%, voltage stability index 44.25%, and VD 9.68% [10]. The disadvantage of this work is only RDGs are planned with three technical parameters; it can be improved by considering more parameters with reconfiguration. In [11], the author has taken three objective indices—maximization of voltage stability index, reduction of PLoss, and total VD—with DG and DSTATCOM planning, using LSA in 33 and 69-bus RDN. In [12], the author proposes optimal planning of single DG and single DSTATCOM at bus number 13 of 33-bus IEEE RDN, which reduces the reactive and real power loss up to 95.3274 KVAr and 121.7023 kW, respectively, using an analytical approach. Again in [13], the authors have optimally placed DG and DSTATCOM with 18.94 kW and 31.94 kW reduction in losses of power with an enhanced voltage profile using the Evolutionary-based Bat Algorithm (EA based BA) of Standard 34 and 85-bus IEEE system [13]. The authors of [11,12,13] tried to achieve the objective with DG and DSTATCOM planning only; its efficacy can be extended further by considering reconfiguration also.
The result in [14] proves that network reconfiguration with DSTATCOM and PV leads to a significant reduction in power loss, with voltage profile enhancement of IEEE 33, 69, and 118 bus RDN, using the Grasshopper Optimization Algorithm (GOA). The results of [15] prove that optimal planning of DG and DSTATCOM leads to a significant reduction in power losses, with voltage profile enhancement using CSA in IEEE 33 and 136 bus RDN. In [16], the outcome states that optimal planning of DG and DSTATCOM leads to a significant enhancement in voltage profile, as well as the reduction in power loss, using the Loss Sensitivity Factor (LSF) and Hybrid Lightning Search Algorithm-Simplex Method (Hybrid LSA-SM) for both IEEE 33 and 69-bus RDN. In [17], the author proposed an approach to reduce daily real power loss with an enhanced profile of the voltage in the presence of PEV, with a daily variation of load using PSO and Butterfly Optimization (BO) by planning DG in a 33-bus RDN. By only optimizing the PLoss and VD, the effectiveness and robustness of the proposed work [14,15,16,17] cannot be justified; more technical parameters have to be considered for optimization.
The proposed work of [18], is tested in three IEEE systems, namely, 33, 69-bus, and a Practical Brazil 136-bus, using Student Psychology-Based Optimization (SPBO) for their optimal DG allocation solution. Finally, note that SPBO helps in the minimization of PLoss and VD with less computational time and rate of prominent convergence. Furthermore, this work can be expanded by considering other parameters along with system reconfiguration. In the literature [19,20,21,22], the Grey Wolf Optimization (GWO) and hybrid GWO-PSO algorithm are applied to the optimization problem. In [23,24,25], the bus injection to branch current and branch current to bus voltage (BIBC-BCBV)-based, backward-forward, sweep load, flow (LF) technique is explained for RDN load flow analysis (LFA). The Mixed Integer Non-Linear Programming (MINLP)-based optimization approach is used in IEEE 69 and 33-bus RDN for the planning of DGs to mitigate the losses with an enhanced profile of voltage in [26]. This work can be implemented further by using other optimization techniques, considering different techno-economic parameters along with the considered one. In [27,28,29,30], the authors proposed various techniques for DG planning in the distribution sector. The planning of these DGs will enhance the overall system performance in terms of operation, economy, and reliability. The optimization technique called PSO (Particle Swarm Optimization technique) and APSO (Adaptive PSO) are illustrated in [27,28], respectively, using them for DG planning. The technologies available for DG to harvest renewable energy near the load end are listed in [29]. In [30], using the Genetic Algorithm (GA) and PSO planning of multiple DGs with different load models was presented. The IEEE 33 and 69-bus RDN with 54-bus practical system is considered for the validation of results. It is noticed that there is significant reduction in losses, ENS, and apparent power intake, with enhancement of the voltage profile, system reliability, benefit in cost, and transfer capacity. However, a major drawback is that for reliability index calculation, only ENS is taken into account; hence, other interruptions related to reliability can also be considered for further analysis, including network reconfiguration with SCLLCurrent.
The author of [31] reveals that the suggested approach using PSO is capable of integrating multiple DGs with different load models, but the impact of network reconfiguration was not considered. This planning has been carried out to decrease the losses, MVA flows, and intake from the grid, along with improvement of the voltage stability margin and loading for 38- and 30-bus systems. The work [32] presents a multi-objective index for IEEE 34-bus medium voltage RDN with time-varying DGs. This includes wind speed and hourly demand, which constitute various technical aspects, such as PLoss, QLoss, VD, reverse conductor capacity, and single and three phase-to-ground short circuits. The author of [33] proposed an optimal planning of DGs, using the GA and Bat Algorithm (BA) and its comparative analysis to optimize the index for PLoss and voltage stability, but did not consider DG planning; hence, it can be considered further. The work [34] introduces PLoss and reliability indices minimization as an objective with the reconfiguration of RDN, using the Imperialist Competitive Algorithm (ICA) without considering any kind of DGs or other technical parameters. In [35], the characterization of DG is presented based on their power injection. In [36], different IEEE test system data and load flow techniques are presented. The author of [37] applied a unique codification of GA for reconfiguration of 69-, 84-, and 135-bus systems to minimize loss. By using PSO, the reconfiguration of IEEE 33 and 69-bus RDN is proposed in [38]. The authors of [37,38] only considered reconfiguration planning for loss and VD minimization without DG.
The various concepts related to DG types and their implementation using different techniques to improve the system parameters are discussed in [39,40,41,42]. Here, only PLoss and QLoss were taken into consideration in the planning of DGs without system reconfiguration. The planning of the grid-connected and isolated hybrid renewable energy system (HRES), including solar PV and wind systems, are explained in [43,44,45,46]. These works only focused on HRES implementation with economic and environmental parameters impacts, without considering any impact of technical parameters. Strategic optimum planning of solar, along with battery and FACTS devices, with its modelling is given in [47,48,49,50]. The author of [47] optimized a reliability index by only considering a single interruption, which was ENS. In [51], the planning of DG is carried out using an Evolutionary Algorithm (EA) to mitigate losses and total-harmonic distortion in voltage. Implementation of DG in an optimized reconfigured network, using the PSO and Dragonfly Algorithm (DA) [52], the dataset approach, and the Water Cycle Algorithm (WCA) [53], FA, and EA [54] are presented. In [51,52,53,54], the major drawback was in DG planning with reconfiguration, because the only technical parameters considered as objective were PLoss, VD, and the total harmonic distortion in voltage. Hence, the planning of multiple DGs with and without reconfiguration is a challenging goal, based on the multiple objective-based fitness-function consisting of non-linear nature constraints.
The detailed review of distribution system planning, methodology, objectives, and outcomes based on different literature are tabulated in Table 1. From this detailed review, it is found that none of the authors have considered the proposed “novel multiple objective-based fitness-function” for the “concurrent optimal planning of multi solar-DG and DSTATCOM with and without reconfiguration”. Therefore, this work is carried out efficiently using the APSO and GWO-PSO techniques, in which two proposed cases have been studied: Proposed Case-1 (PC-1)—Concurrent optimal planning of multi solar-DG and DSTATCOM without the impact of RDN reconfiguration, and Proposed Case-2 (PC-2)—Concurrent optimal planning of multi solar-DG and DSTATCOM with the impact of RDN reconfiguration.

1.2. Contribution of Paper

The novelty and major contributions reported in this paper are as follows:
1.
A novel “multiple objective-based fitness-function” ( M O F F ) is proposed, as given in (10). This M O F F consists of five significant performance indices: real power loss, reactive power loss, system voltage profile, short circuit level of line current, and system reliability.
2.
The short-circuit (fault) current tolerance capacity or level improvement factor is considered in the M O F F as a short circuit level of line current (SCLLCurrent).
3.
The economic perspective of the system has also been considered, based on the various costs, such as fix, loss, and energy not supplied (ENS) cost.
4.
The novel M O F F is optimized for the optimal DG sizes and locations with optimal reconfiguration tie-switches, using the two optimization techniques, i.e., APSO and GWO-PSO.
5.
To validate the proposed work efficacy, a techno-economic comparative result analysis has been presented for IEEE 33 and 69-bus RDN. In addition, the results are compared to other recent literature.

1.3. Paper Layout

This paper consists of six sections. The Section 1 is the Introduction, which describes the reviews related to DG technology, DG planning, and reconfiguration of distribution networks. The Section 2 is related to Distributed Generation and Related Different Technologies, associated with various DG technology and their application. The Section 3 includes the Modelling of Proposed System, including renewable solar-DG and DSTATCOM. The Section 4 presents the Proposed Methodology for the presented work. The Section 5 is Results and Discussion, which gives a detailed discussion related to 33- and 69-bus RDNs, based on the proposed methodology. The comparison with other methods is also done in the Section 5. The Section 6 is the Conclusion, which concludes the presented work based on different parameters, as proposed in the work.

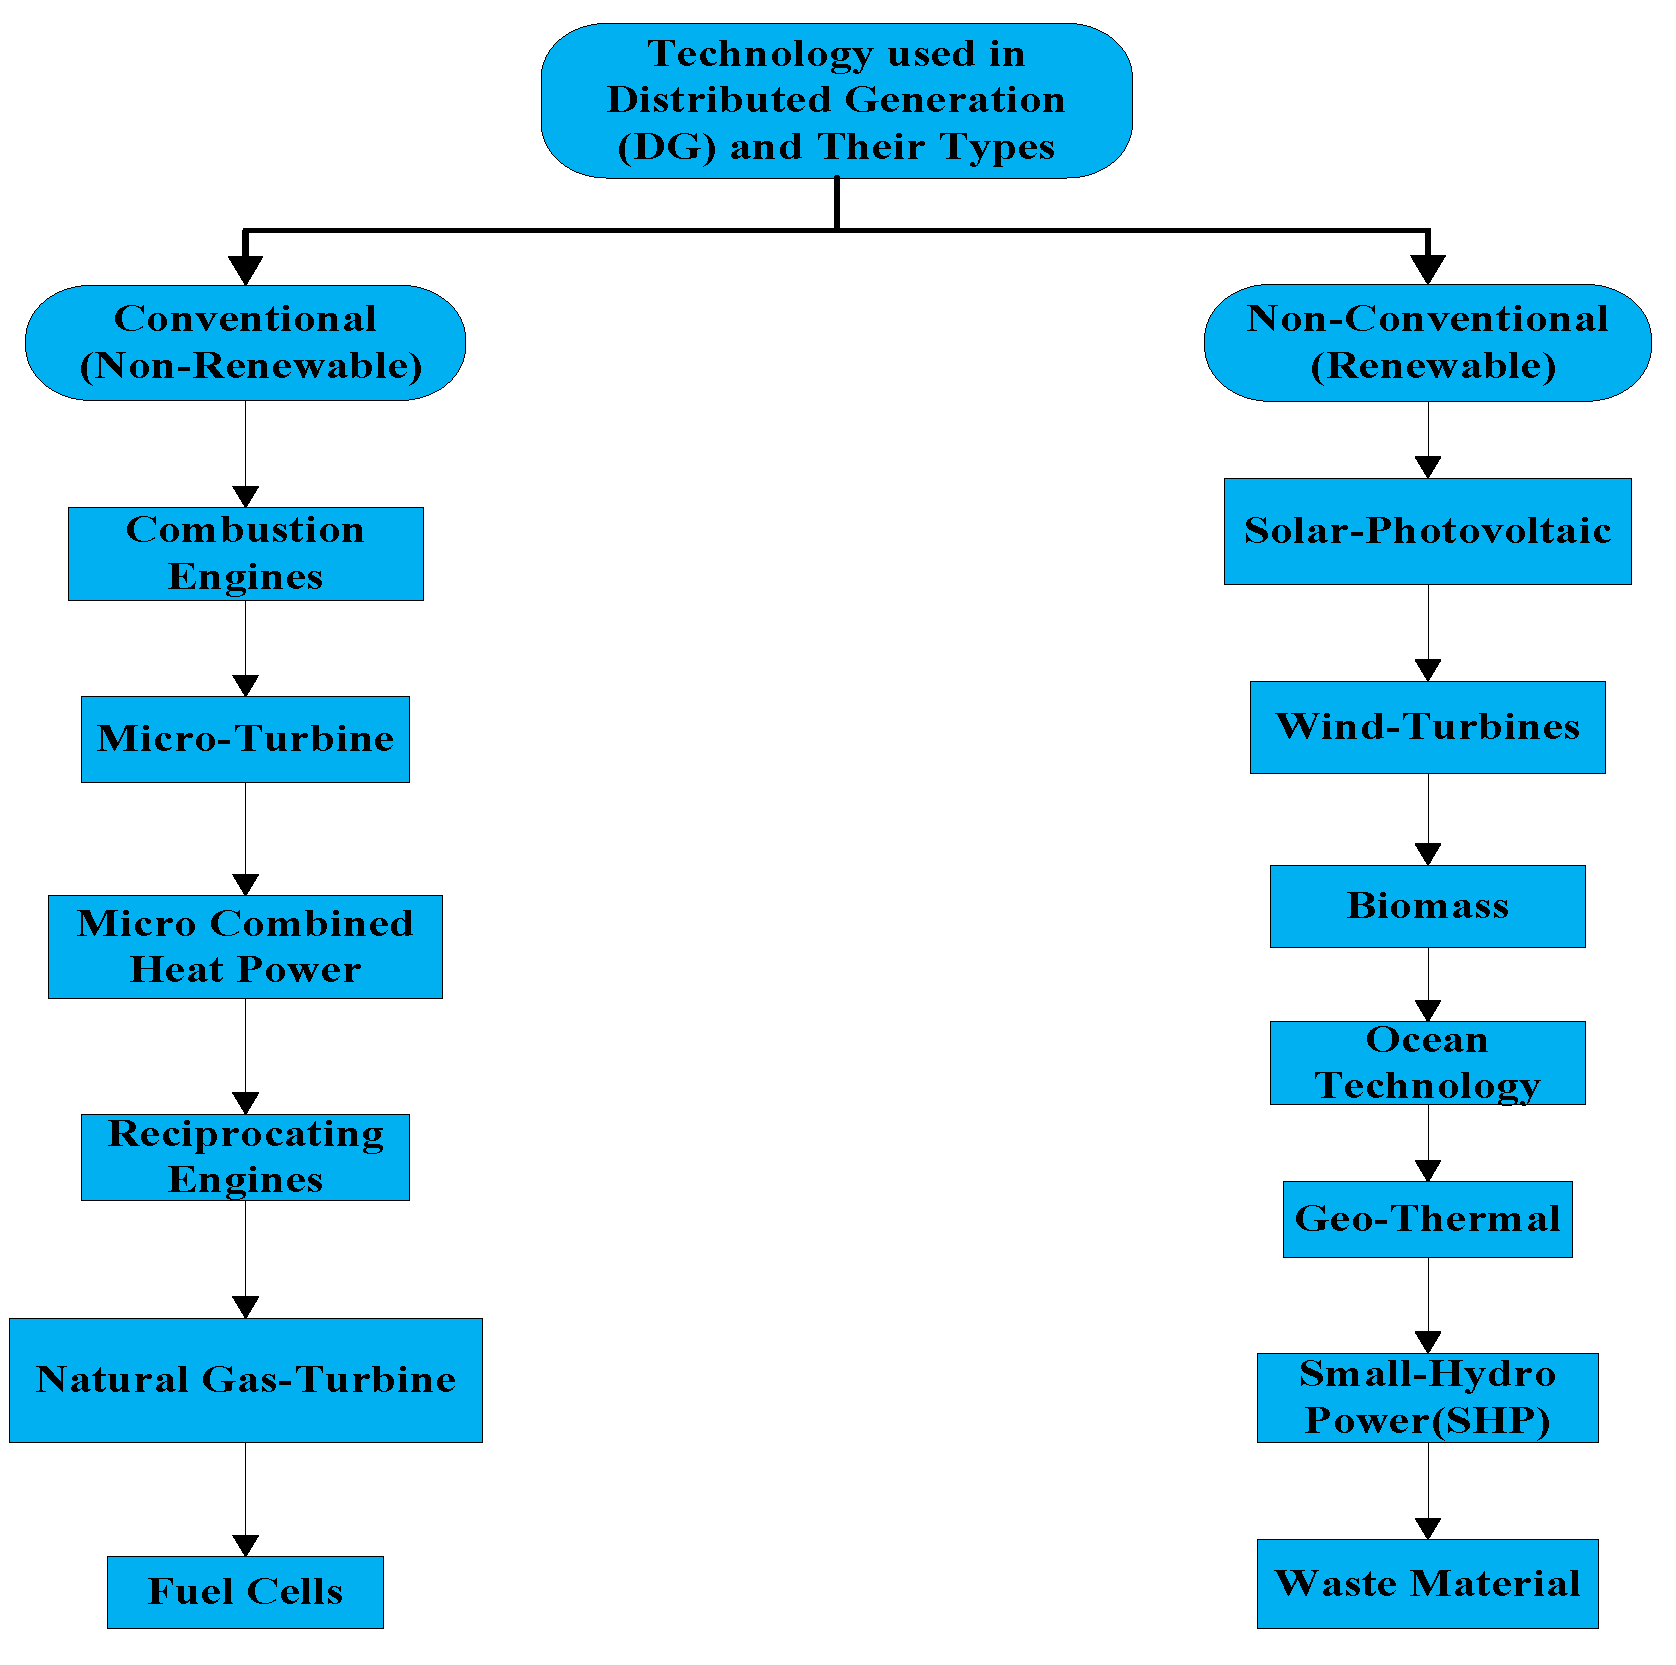
2. Distributed Generation (DG) and Related Different Technologies

DG is defined as the power production/generation units located near the consumer end and directly connected with the utility. The implementation of DG technology offers a viable alternative to the traditional sources of electric power for applications, such as residential, commercial, and industrial, as presented in [23,29,30].

2.1. Distributed Generation

2.1.1. The Motivational Factors behind Distributed Generator/Resources Planning Are

  • Its availability in an enormous amount with a vast range of resources
  • The system reliability will improve after DG plantation
  • Increment in system efficiency
  • Reduction in system losses
  • Improvement in the profile of voltage
  • Total intake of power flow from the system will minimize
  • Sudden load management is possible, rapidly and effectively
  • Continuity in power supply improves
  • Reduces the occurrence of interruption, failure, and any kind of risk
  • Increment in Available Transfer Capacity (ATC) of the system
  • Enhances the operation, availability of power, and economy
  • Reduces loading of the transmission and distribution sector
  • Reduction in toxic gases emission

2.1.2. The Concerns/Issues Defining Distributed Generators/Resources Are

  • Purpose of DGs
  • Location of DGs
  • Rating/Capacity of DGs
  • Area to deliver power by the DGs
  • Technology adopted during DGs selection
  • Impact of environmental condition on DGs
  • Operational mode of the DGs
  • The DGs owned by which body/ The DGs ownerships
  • Penetration level of DG resources

2.1.3. On the Basis of Capacity to Deliver the Energy, the DG Units Are Named as

  • Dispatchable, e.g., Small hydro plants, Gas-turbine based on biomass, and so on.
  • Non-Dispatchable, e.g., generation depends on weather, such as solar and wind.

2.2. Different Technologies Related to DGs

The categorization of DG technology, based upon the power delivering capacity per module and their efficiency ranges, is illustrated in Table 2. DG technology can be classified, based on the operating range in which it can produce the output power within a specific limit under different types, as given in Table 3. Additionally, the different types of DG technologies, on the basis of design suitability for the use of various applications, are shown in Figure 1.
DG technology, based on its real and reactive power dispatch/supply or consumption capability, can be divided into four categories, as given in [30,35,39,40,41].
  • DGs deliver real power only at the unity power factor (p.f.), known as Type-1. Example: photovoltaic (PV), micro-turbines, and fuel cells.
  • Similarly, DGs deliver reactive power only at zero p.f., known as Type-2. Example: synchronous compensators, such as a gas turbine.
  • Some of the DGs deliver real power, but absorb reactive power at optimum p.f. between 0 to 1. Example: induction generator (wind farm).
  • Likewise, DGs deliver both real and reactive power at optimum p.f. between 0 to 1. Example: Synchronous generator (cogeneration, gas turbine, etc.).

3. Modelling of Proposed System

3.1. Modelling of Solar-DG or PV System (PRDG)

Solar energy is freely accessible in the atmosphere, and it is totally liberated from pollution. The output of solar PV depends on its geographic atmosphere. Its application for power production as a renewable source of power overcomes society’s dependence on fossil fuels [43]. The power output of PV and its efficiency can be calculated with the help of (1) and (2), as mentioned [44].
P P V = a G η P V
η P V = η S T C [ 1 + α ( T c e l l 25 ) ]
where, PPV is the power output of PV; “a” is the panel area in meters squared (m2); and “G” is incident solar radiation, with the unit representation of watts per meters squared (W/m2). ηPV and ηSTC represent the efficiency in the determined operating condition and under Standard Test Conditions (STC). Cell temperature in °C is Tcell, and in percentage per °C temperature, the co-efficient “α” is represented. After merging (1) and (2), a new (3) and (4) are formulated. These developed equations will give the output power under STC.
P P V = P S T C { G 100 [ 1 + α ( T c e l l T 0 ) ] }
T c e l l = T a m + ( T N O C 20 800 ) G
where TNOC = nominal operating cell temperature in °C, Tam = ambient temperatures in °C, and T0 = 25 °C.

3.2. Modelling of DSTATCOM (QDSTAT)

DSTATCOM is considered as QDSTAT for this work. It is a shunt-connected voltage-source converter, coupled with a medium- to low-voltage distribution framework. It has numerous advantages compared to a shunt-connected capacitor. It provides fast response, more governing capacity, less harmonic, and compatibility in RDN [46]. It performs two operations, namely, supplying and absorbing the reactive power in the network. When the coupling point’s voltage is less than the actual voltage, it will supply reactive power, but it will absorb the same when it is greater than the actual voltage [47]. The DSTATCOM is comprised of a DC link capacitor, an inverter model, and an AC filter with a coupling transformer. When the system is overloaded, the compensating current is injected at the DSTATCOM-allocated bus to control the system voltage [48]. The DSTATCOM model and the one-line diagram of a distribution network for successive buses without DSTATCOM [49,50] are presented in Figure 2 and Figure 3, respectively. Here, the considered network is a balanced network. The (Rk + iXk) is the impedance of the line between the k and (k + 1) buses. Voltage and current phasor representation of the system without DSTATCOM is shown in Figure 4. The pre-specified loads connected at the buses are expressed by (Pk + iQk) and (Pk + 1 + iQk + 1), where the voltages are Vk and Vk + 1. The voltage and current phasor representation of the system without DSTATCOM are illustrated in Figure 3. Their corresponding equation can be expressed as (5) by using KVL.
V k + 1 ϕ k + 1 = V k ϕ k ( R k + i X k ) I k δ
The applied load flow method in this work is BIBC-BCBV-based backward-forward sweep, which is used to derive all the variables. In a real system, the voltage of buses are less than 1 p.u.; therefore, the voltage at (k + 1)th bus is also 1 p.u. The installation of DSTATCOM is carried out for compensating the voltage at (k + 1)th bus and to maintain the required reactive power in the system, as shown in Figure 5. Hence, it can be said that in steady-state conditions, it is used for regulation of voltage, as well as to reduce the system losses and make the balance of the reactive power to the system the same for supplying and absorbing. The current injected by the DSTATCOM, i.e., (IDSTATCOM), is in phase quadrature with reference to bus voltage, as shown in Figure 6.
The equation for angle and voltage correction by injecting the DSTATCOM current is estimated as:
I D S T A T C O M = π 2 + ϕ k + 1
V k + 1 ϕ k + 1 = V k ϕ k ( R k + j X k ) { I k δ + I D S T A T C O M ( π 2 + ϕ k + 1 ) }
The current Ik and IDSTATCOM flow simultaneously through the line/branch after installation of DSTATCOM in the (k + 1)th bus.
The reactive power injected by the DSTATCOM for system performance improvement, such as correction of voltage, at (k + 1)th bus till V(k + 1) is given by:
i Q D S T A T C O M = ( V k + 1 ϕ k + 1 ) { I D S T A T C O M ( π 2 + ϕ k + 1 ) }
The current injected by DSTATCOM (IDSTATCOM) and the angle change will be zero when the voltage is equal after and before the installation of DSTATCOM, i.e., V(k + 1) = V(k + 1). Mathematically, as a boundary condition, it is represented as:
V k + 1 = V k + 1 { I D S T A T C O M = 0 ϕ k + 1 = ϕ k + 1

4. Proposed Methodology

4.1. Formulation of Multiple Objective-Based Fitness-Function

A novel multiple objective-based fitness-function ( M O F F ) is introduced in this section. This M O F F , as given in (10), consists of five significant operational and performance parameters as indices. The minimization of this unique M O F F is utilized for the optimal allocation of multi solar-DG as a real power DG and DSTATCOM as a reactive power DG. It also includes the impact of network reconfiguration by the incorporation of APSO and GWO-PSO techniques in IEEE 33 and 69-bus RDN. Hence, this remarkable novel M O F F is used for the optimal positioning and sizing of multi DGs (solar-DG and DSTATCOM), with and without reconfiguration, by utilizing the APSO and GWO-PSO techniques.
M O F F = C 1 × I P L o s s + C 2 × I V D + C 3 × I Q L o s s + C 4 × I S C C L i n e + C 5 × I R S
Here, C1, C2, C3, C4, and C5 represent the weight-factors with the weightage of 0.30, 0.25, 0.20, 0.15, and 0.10 separately. The elaborated concept of selecting the weight-factors is given in the literature [30,31,32]. These factors express exactly how much weight is given to every system variable attribute (indices). Their values are decided on the priority basis of individual indices’ performance. It is significant while planning solar-DG and DSTATCOM, with and without reconfiguration impact, in an RDN.
IPLoss, IVD, IQLoss, ISCLLCurrent, and IRS are indexes for loss of real power, deviation in voltage, loss of reactive power, short circuit level of line current, and system reliability, respectively. In the novel M O F F , priorities are given to all the key factors that will upgrade the RDN to more reliable and effective. The main objective is to minimize the total loss of power (real and reactive) and deviation in voltage. Therefore, the highest weightage is given to the loss in real power (PLoss), which is followed by deviation in voltage (VD), and loss in reactive power (QLoss), with 30%, 25%, and 20% of weightage, respectively. Then, 15% and 10% weightage is given to the short circuit level of the line/branch current (SCLLCurrent) and system reliability (RS).

4.2. System Parameter Calculation

The calculation of the voltage and current of every bus and branch through backward-forward sweep LFA based on BIBC-BCBV matrices can be formulated as [24,25]:
  • Each bus load current is expressed in (11):
L C ( i ) k = ( P L ( i ) + Q L ( i ) V ( i ) k )
  • Branch current determined by (12):
B C = [ B I B C ] [ L C ]
  • Each bus voltage can be updated by (13):
V m = V n B C ( n 1 ) × Z n m
  • The change in voltages at different buses can be evaluated by (14):
[ Δ V ] = [ B C B V ] [ B C ]
  • The apparent power loss can be determined by (15):
S L o s s = j = 1 N B [ Δ V ] [ B C ] *
  • Calculation of PLoss and QLoss is shown in (16), (17):
P L o s s = R e a l ( S L o s s )
Q L o s s = I m a g ( S L o s s )
  • Calculation of short circuit level of line current is shown in (18):
S C L L C u r r e n t = M a x ( j = 1 N i = 2 N j i Y j i × ( V j V i ) )
Calculation of M O F F indices are as follows:
  • Index for loss of real power is given by (19):
I P L o s s χ = P L o s s χ P L o s s B C ,   Where ,   χ = PC - 1   and   PC - 2 ,   B C = Base   Case  
  • Index for loss of reactive power is given by (20):
I Q L o s s χ = Q L o s s χ Q L o s s B C ,  
  • Index for deviation in voltage is shown in (21):
I V D = m a x ( Δ V ( n ) v r e f )
  • Index for short circuit level of line current [31] is given by (22):
I S C L L C u r r e n t = S C L L C u r r e n t χ S C L L C u r r e n t B C
  • The system reliability index calculation depends on its various parameters SAIFI, SAIDI, CAIDI, and ENS [30]:
S A I F I = z = 1 N γ z M V A z z = 1 N M V A z
S A I D I = z = 1 N U N z M V A z z = 1 N M V A z
C A I D I = S A I D I S A I F I
E N S = Z = 1 N M W Z × U N Z
I R S =   T o t a l   I n t r u p t e d   P o w e r   i n   M V A χ T o t a l   I n t r u p t e d   P o w e r   i n   M V A B C
Re l i a b i l i t y = 1 T o t a l   I n t r u p t e d   P o w e r   i n   M V A M V A L o a d   D e m a n d χ
where N and NB = Number of total buses and branches; i and j = 2 to N and 1 to NB; k is the kth iteration; LC and BC = Load and branch current at each bus and branch, respectively; V = Voltage at each bus; m = To-Bus; n = From-Bus, which is from 2 to N; γz and UNz = Failure-rate and unavailability; MVAz and MWz = Each bus apparent and real power demand; and MVALoad Demand = Total connected apparent load.
The system cost parameters to calculate the capital recovery fixed cost, energy not supplied cost, and the energy loss cost are given as [30]:
  • Capital recovery fixed cost (CFIX) of system is shown in (29):
C F I X = g B R = 1 N B R C B R
  • Cost for Energy Not Supplied is given by (30):
C E N S = C i × E N S
  • The cost of energy losses is shown in (31):
C L O S S = 8760 × C l × ϕ × B R = 1 N B R I B R 2 × R B R
ϕ = 0.15 × φ + 0.85 × φ 2
where NBR, IBR, RBR, CBR, g, φ, and ϕ are the number of branches, branch current, resistance for the BRth branch, BRth branch cost of the main feeder, the yearly recovery rate of fixed cost, load factor, and loss factor, respectively. The Ci and Cl are p.u. cost of ENS and loss, respectively.

4.3. The Considered System with Different Cases

The two IEEE test networks, i.e., IEEE 33 and 69-bus RDN [37,38], as shown in, are considered in this work, with three cases as:
  • Base Case (BC): The system in which no modifications are considered for the proposed systems.
  • Proposed Case-1 (PC-1): This system includes the multi DGs as Solar-DG and DSTATCOM without Reconfiguration.
  • Proposed Case-2 (PC-2): This system includes the multi DGs as Solar-DG and DSTATCOM with Reconfiguration.

4.4. Adaptive Particle Swarm Optimization (APSO) Technique

The PSO and APSO were developed by Eberhart and Kennedy in 1995 [27] and Hue et al. in 2009 [28], respectively. PSO is a population-based technique for optimization. In its search space for each iteration, the particle will obey a specified velocity and inertia. The development of PSO to APSO takes place with some adjustments in PSO parameters, such as inertia weight, and then the incorporation of the extra constriction factor (ρ). Hence, these changes in PSO make the APSO advantageous in terms of optimization, with better capability to find solutions and convergences. The mathematical expression related to APSO is presented in (33)–(37). Here, the P is taken as the total population, with V as its velocity, m is varying from 1, 2, …, P, and it is the variation of P (particle). The S(i + 1) and V(k + 1) are population and velocity for the (k + 1)th iteration, where the velocity and position for the former iteration are V(k) and S(k). For the (k + 1)th iteration, the velocity and position will be updated using the expression given in (33) and (34) [28].
V ( k + 1 ) = ρ [ w ( k ) × V ( k ) + c 1 × r 1 × ( S p e r s o n a l b e s t S ) + c 2 × r 2 × ( ( S g l o b a l b e s t ) S ) ]
S ( k + 1 ) = S ( k ) + V ( k + 1 )
w k = w max ( w max w min ) I t r k I t r max
ρ = 2 | 2 ψ ψ 2 4 ψ |
ψ = C 1 + C 2 = 4.1
where, V, S, w, Itr, Itrmax, and k are defined as velocity, particle position, weight for inertia, iteration, maximum iteration, and respective kth iteration. The wmin = 0.9 and wmax = 0.4 are min and max weights, as given in [33]. The ρ = 0.729 is the constriction factor. Both C1, C2 = 2.05, and r1, r2 = random number between 0 and 1. The personal-best and global-best populations are denoted Spersonalbest and Sglobalbest.

4.5. Grey Wolf Optimization (GWO) Technique

The GWO is proposed in 2014, as given in [19]. The GWO is a technique for optimization based on gray wolves’ behavior and their hunting strategy. In a group, they obey a resilient leadership hierarchy of four levels of wolves, such as alpha (α), beta (β), delta (δ), and omega (ω) wolves headed by α level wolves. The α in level one is the authority to make decisions. The wolves in the β level usually help the leader. Wolves in level three are called δ wolves, and they are responsible for passing information to α, β wolves and controlling ω (last-level wolves). In the hierarchy of the grey wolves, α is considered as the most appropriate solution/result, whereas β and δ are the second and third most appropriate solution, respectively, and ω is the least appropriate solution of the population. Their hunting process comprises three different parts, such as searching, encircling (exploration), and attacking (exploitation) the prey.
  • In GWO, the wolves’ encircling process is mathematically expressed in Equations (38) and (39):
D = | C × S P ( t ) S ( t ) |
S ( t + 1 ) = | S P ( t ) A × D |  
where, A and C are the coefficient vectors, and they are calculated as follows:
A = 2 × a × r 1 a
C = 2 × r 2
where Sp, S, t, a, and (r1, r2) are the victim/prey location, wolf location, current iteration, the linearly decaying value from 2 to 0, and a random number between [0, 1], respectively.
  • In this algorithm, it is assumed that the hunting is executed by α, β, and δ because they have more expertise in searching for the prey location, whereas the ω just obey these wolves, as per their position. Hence, the adjustment of these leading wolves’ positions are presented mathematically as follows:
{ D α = | C 1 × S α S | D β = | C 2 × S β S | D δ = | C 3 × S δ S | }
The values of Sα, Sβ, and Sδ are the best three wolves in each iteration, respectively.
{ S 1 = | S α A 1 × D α | S 2 = | S β A 2 × D β | S 3 = | S δ A 3 × D δ | }
S p ( t + 1 ) = S 1 + S 2 + S 3 3
The (44) represents the new position of the prey as a mean of the best three wolves’ position in the population. The grey wolves accomplish their hunting by attacking the prey. To attack, they must be close enough to the prey. The ‘A’ value lies between [−2a, 2a]. If the value of |A| < 1, they will attack the prey. Otherwise, the hunt will be abandoned to find a new better solution. This process will be repeated until the stopping criteria are met.

4.6. Grey Wolf-Particle Swarm Optimization (GWO-PSO) Technique

Though the PSO is better for the global optimum solution, it has the possibility to trap into the local optimum solution. In contrast, the GWO has the advantage of better exploration, exploitation, and convergence, which create less possibility for local optimum solution [19]. However, despite having these advantages, its ability to make the balance between exploration and exploitation is still somewhat dependent/limited on some of the mechanisms.
Therefore, to obtain the desired global optimum solution without being stuck in the local optimum solution, both the GWO and PSO are combined. Hence, in the proposed hybrid GWO-PSO technique [20,21,22], the GWO will be executed first, then it will give the best position alpha (Sα). After that, the execution of PSO takes place with Sα in place of Spersonalbest in order to determine the particle velocity. This process returns the updated/modified position back to the GWO. Hence, this process will be repeated until the stopping criteria are reached.
The flowchart for the concurrent optimal planning of DGs (PRDGs and QDSTAT), with or without reconfiguration in IEEE 33 and 69-bus RDN using APSO and GWO-PSO, is illustrated in Figure 7 and Figure 8, in which TS1, to TS5, are five tie-switches. The PRDG1, PRDG2, PRDG3 and QDSTAT1, QDSTAT2, QDSTAT3 are three real power solar-DG and three reactive power DG, respectively. The Loc1, Loc2, and Loc3 are the three locations, along with the respective DG capacity. All the tie-switches, PRDGs, QDSTAT, and locations are considered as decision variables in the proposed algorithm.

5. Result and Discussion

In this paper, a novel multiple objective-based fitness-function ( M O F F ) is presented for the concurrent planning of multi-Solar-DG and DSTATCOM, with and without reconfiguration of RDN using the APSO and GWO-PSO techniques. Through the MATLAB 2018a platform, the said work has been carried out. The IEEE 33 and 69-bus RDN [37,38] are taken into consideration to analyze and validate the obtained results..

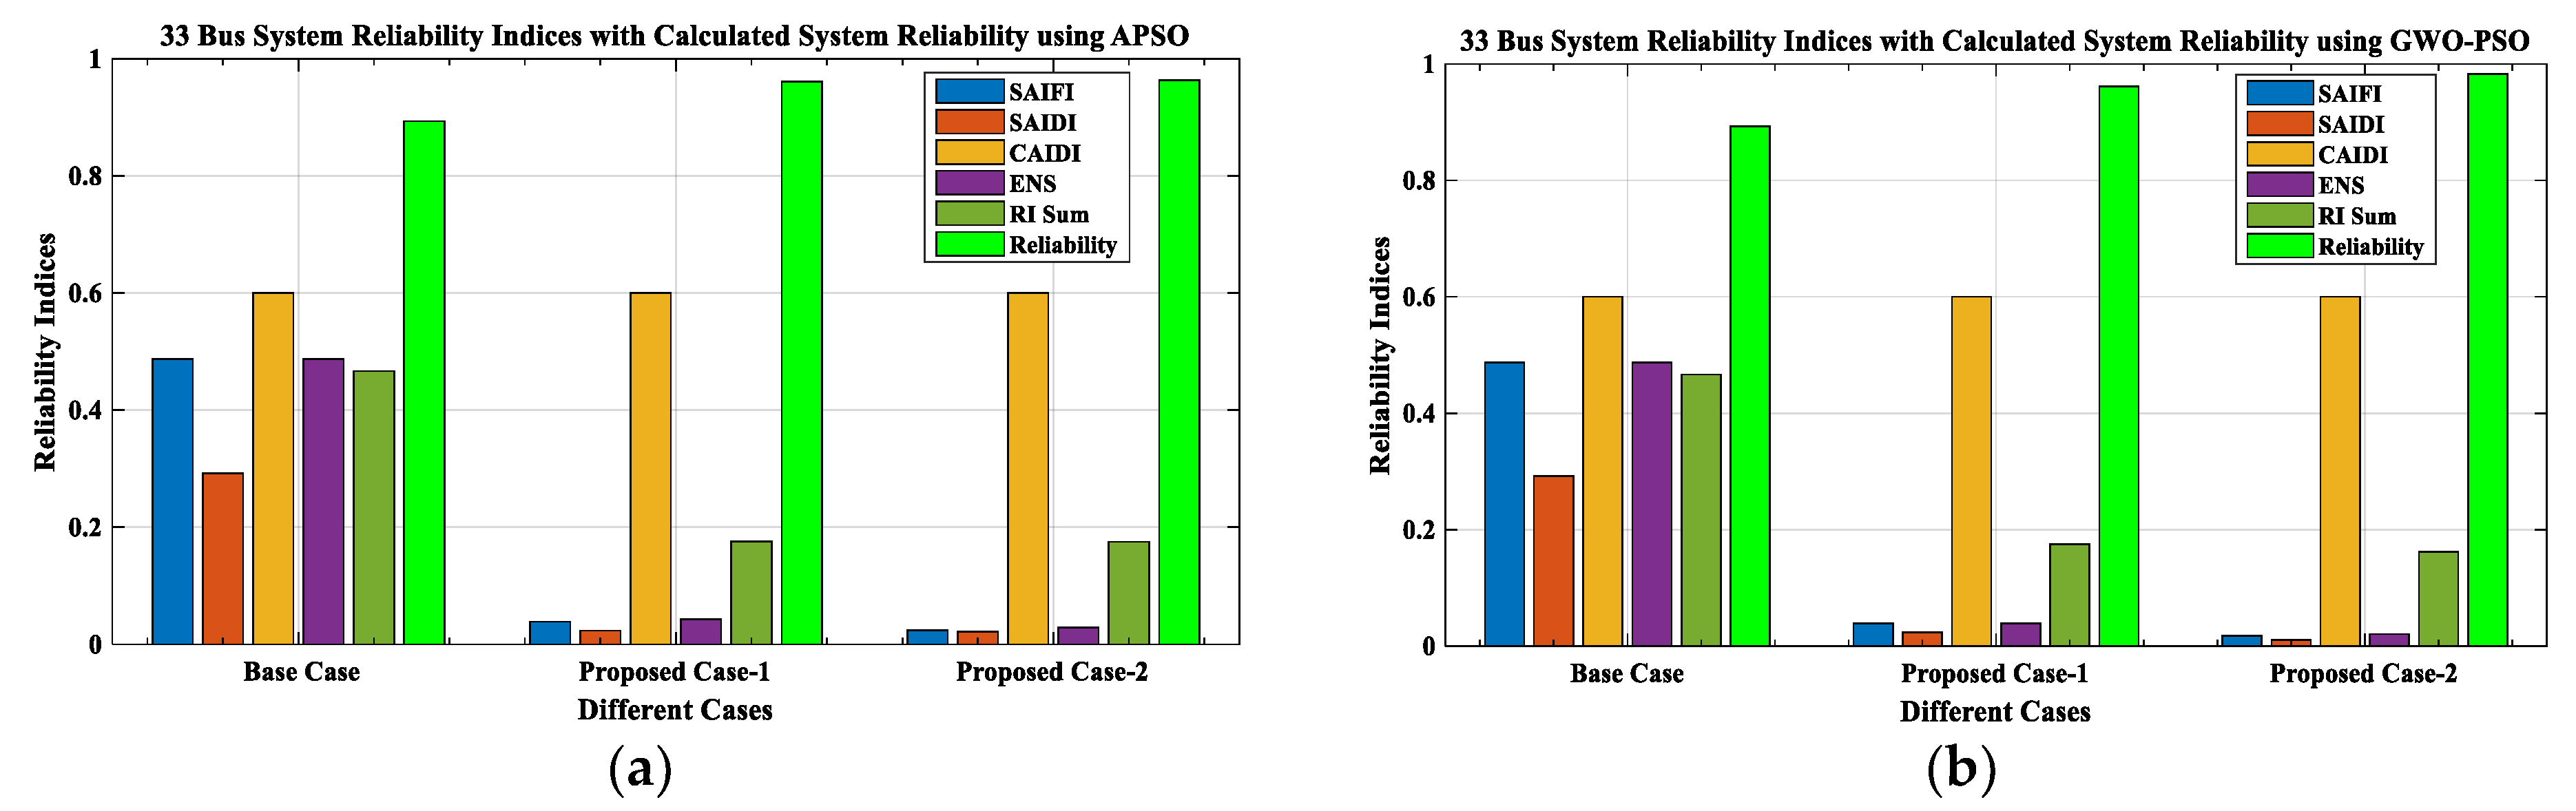
5.1. Analysis of 33-Bus Radial Distribution Network

The 33-bus RDN consists of 3.72 MW and 2.30 MVAr total active and reactive power loads, respectively. The data for the branch and load of the 33-bus IEEE test system [48] are presented in Figure 9 and the represented numbers are electric buses. The obtained outcomes for the PC-1 and PC-2 are illustrated in Table 4, Table 5, Table 6, Table 7 and Table 8 and Figure 10, Figure 11, Figure 12, Figure 13, Figure 14, Figure 15, Figure 16, Figure 17 and Figure 18.
The base case (BC) is considered as a case without DGs and reconfiguration. After the load flow analysis (LFA), the observed real power loss (PLoss) is 0.2027 MW, and the reactive power loss (QLoss) is 0.1351 MVAr for the BC, as shown in Table 6. The maximum deviation in voltage (VD) of the system is 0.1869 p.u. with respect to (w.r.t.) voltage reference, the short circuit level of line current (SCLLCurrent) is 3.4118 kA, and the reliability is 89.32%, as seen from Table 6 and Table 7.

5.1.1. The Proposed Case-1 (PC-1)

In PC-1 using APSO, 3 active and 3 reactive power DGs are optimally placed at bus numbers 24, 14, and 30 of the IEEE 33-bus RDN. The capacity of these DGs are 1.09 MW, 0.78 MW, 1.08 MW, and 0.46 MVAr, 0.30 MVAr, 0.96 MVAr, respectively, as shown in Table 4 and Figure 9a. After placing these DGs at optimal locations, the M O F F value is minimized to 0.1095, as given in Table 5. With this minimized M O F F , the system voltage profile is improved, with maximum (VD) 0.1121 p.u. The PLoss and QLoss is reduced to 0.0155 MW and 0.0142 MVAr, respectively, as illustrated in Table 6 and Figure 10, Figure 11, Figure 12, Figure 13 and Figure 14. Most importantly, the short circuit/fault tolerance capacity of the system is enhanced, as the SCLLCurrent is reduced by 92.04%, with improved system reliability of 96.12%, as shown in Table 6 and Table 7. In this implementation, the fix cost is the same, with the value of USD 18,791.4171/year. However, the cost related to loss and ENS is reduced to USD 5363.7979/year and USD 677.2700/year from USD 70,307.8843/year and USD 8509.4763/year, respectively. Hence, there is a reduction in total cost, as it was USD 97,608.7778/year in the BC, and in PC-1, it is USD 24,832.485/year, as mentioned in Table 8 and Figure 15a.
Similarly, DGs are planned using the GWO-PSO technique to present a comparative analysis between both techniques, i.e., APSO and GWO-PSO. The optimal locations using GWO-PSO are at bus numbers 6, 33 and 24. The optimal sizes of DGs are 0.89 MW, 0.72 MW, 1.14 MW and 1.06 MVAr, 0.42 MVAr, 0.37 MVAr from real and reactive power perspective, as illustrated in Table 4 and Figure 9b. After placing these DGs at optimal locations, the M O F F value is minimized to 0.0957, as mentioned in Table 5. With this minimized M O F F , the system voltage profile is improved, with a maximum VD of 0.1106 p.u. The PLoss and QLoss are reduced to 0.0147 MW and 0.0135 MVAr, respectively, as illustrated in Table 6 and Figure 10, Figure 11, Figure 12, Figure 13 and Figure 14. Most importantly, the short circuit/fault tolerance capacity of the system is enhanced, as the SCLLCurrent is reduced by 93.37%, with an improved system reliability of 96.77%, as shown in Table 6 and Table 7. In this implementation, the fix cost is the same, with the value of USD 18,791.4171/year. However, the cost related to loss and ENS is reduced to USD 5100.3413/year and USD 564.5218/year from USD 70,307.8843/year and USD 8509.4763/year, respectively. Hence, the total cost is observed as USD 24,456.2802/year, which is less than the BC, as given in Table 8 and Figure 15b.

5.1.2. The Proposed Case-2 (PC-2)

In PC-2, using APSO, multiple DG planning with reconfiguration has been carried out without disturbing the system radiality. Three active and three reactive power DGs (PRDG and QDSTAT) are optimally placed with reconfiguration at bus numbers 7, 25, and 32 of the IEEE 33-bus RDN. The capacities of all the optimal PRDG and QDSTAT at these buses are 1.04 MW, 0.87 MW, 0.83 MW, and 0.83 MVAr, 0.28 MVAr, 0.32 MVAr, with TS1 and TS4 active tie-switches, as shown in Table 4 and Figure 9a. After placing these DGs at optimal locations, the M O F F value is minimized to 0.1069, as given in Table 5. With this minimized M O F F , the system voltage profile is improved, with a maximum VD of 0.1082 p.u. The PLoss and QLoss are reduced to 0.0121 MW and 0.0100 MVAr with 0.0156 MVA as SLoss, respectively, as illustrated in Table 6, Figure 10a, Figure 11a, Figure 12a, Figure 13a and Figure 14a. Most importantly, the short circuit/fault tolerance capacity of the system is enhanced, as the SCLLCurrent is reduced by 96.42%, with an improved system reliability of 98.26%, as shown in Table 6 and Table 7. In PC-2, using APSO, the fix cost value is still fixed, with the value of USD 18,791.4171/year. At the same time, the cost related to loss and ENS is reduced to USD 4209.1715/year and USD 304.2684/year from USD 70,307.8843/year and USD 8509.4763/year, respectively. Hence, there is a reduction in total cost, as it was USD 97,608.7778/year in the BC, but in PC-2, its value reduced to USD 23,304.857/year, as illustrated in Table 8 and Figure 15a.
Similarly, in PC-2, using the GWO-PSO technique, DGs are planned with reconfiguration without disturbing the system radiality to present a comparative analysis between both the techniques, i.e., APSO and GWO-PSO. The optimal locations using GWO-PSO are at bus number 30, 24, and 26. The capacities of PRDG in MW and QDSTAT in MVAr at these buses are 0.57 1.05, 1.05 and 0.91, 0.61, 0.19, with all TS1 to TS5 active tie-switches, as illustrated in Table 4 and Figure 9b. After placing these DGs at optimal locations, the M O F F value is minimized to 0.0909, as given in Table 5. With this minimized M O F F , the system voltage profile is improved, with a maximum VD of 0.1077 p.u. The PLoss and QLoss are reduced to 0.0101 MW and 0.0084 MVAr with 0.0131 MVA as SLoss, respectively, as illustrated in Table 6, Figure 10b, Figure 11b, Figure 12b, Figure 13b and Figure 14b. Most importantly, the short circuit/fault tolerance capacity of the system is enhanced, as the SCLLCurrent is reduced by 99.31%, with an improved system reliability of 99.67% w.r.t. BC, as shown in Table 6 and Table 7. In PC-2, using GWO-PSO, the cost related to loss and ENS is reduced to USD 2515.1814/year and USD 1146.7351/year from USD 70,307.8843/year and USD 8509.4763/year, respectively, with no change in fix cost. Hence, there is a reduction in total cost, as it was USD 97,608.7778/year in the BC, but in PC-2, it is USD 22,453.3336/year, as mentioned in Table 8 and Figure 15b.
After placing the DGs at optimal locations with reconfiguration in IEEE 33-bus RDN, it has been observed that the total real and reactive power drawn by the system (which includes PSB_GEN, QSB_GEN and PRDG, QDSTAT) is reduced to 3.73 MW and 2.31 MVAr, respectively, in which the total real and reactive power generation is 4.85% and 5.33% less than the BC. Hence, with this novel implementation (PC-2) using APSO and GWO-PSO, the PLoss is reduced by 94.03% and 95.02%, QLoss is reduced by 92.59% and 93.78%, and VD is also decreased by 42.11% and 42.37%, respectively, as shown in Table 6 and Figure 10, Figure 11, Figure 12, Figure 13 and Figure 14. The SCLLCurrent is reduced by 96.42% and 99.31% using APSO and GWO-PSO separately. Consequently, the reliability is increased up to 98.26% and 99.67%, as it was 89.32% in BC, as given Table 7 and Figure 18b.
From the comparative analysis between APSO and GWO-PSO, it can be concluded that the outcomes of GWO-PSO are superior to the APSO. Finally, the detailed analysis of the results indicates that the concurrent optimal planning of multi-Renewable Solar-DG and DSTATCOM in a Reconfigured IEEE 33-bus RDN using the APSO and GWO-PSO techniques is an effective approach to minimize the M O F F , and its minimized outcome is illustrated in Table 5, as well as in Figure 17 as a graphical representation.

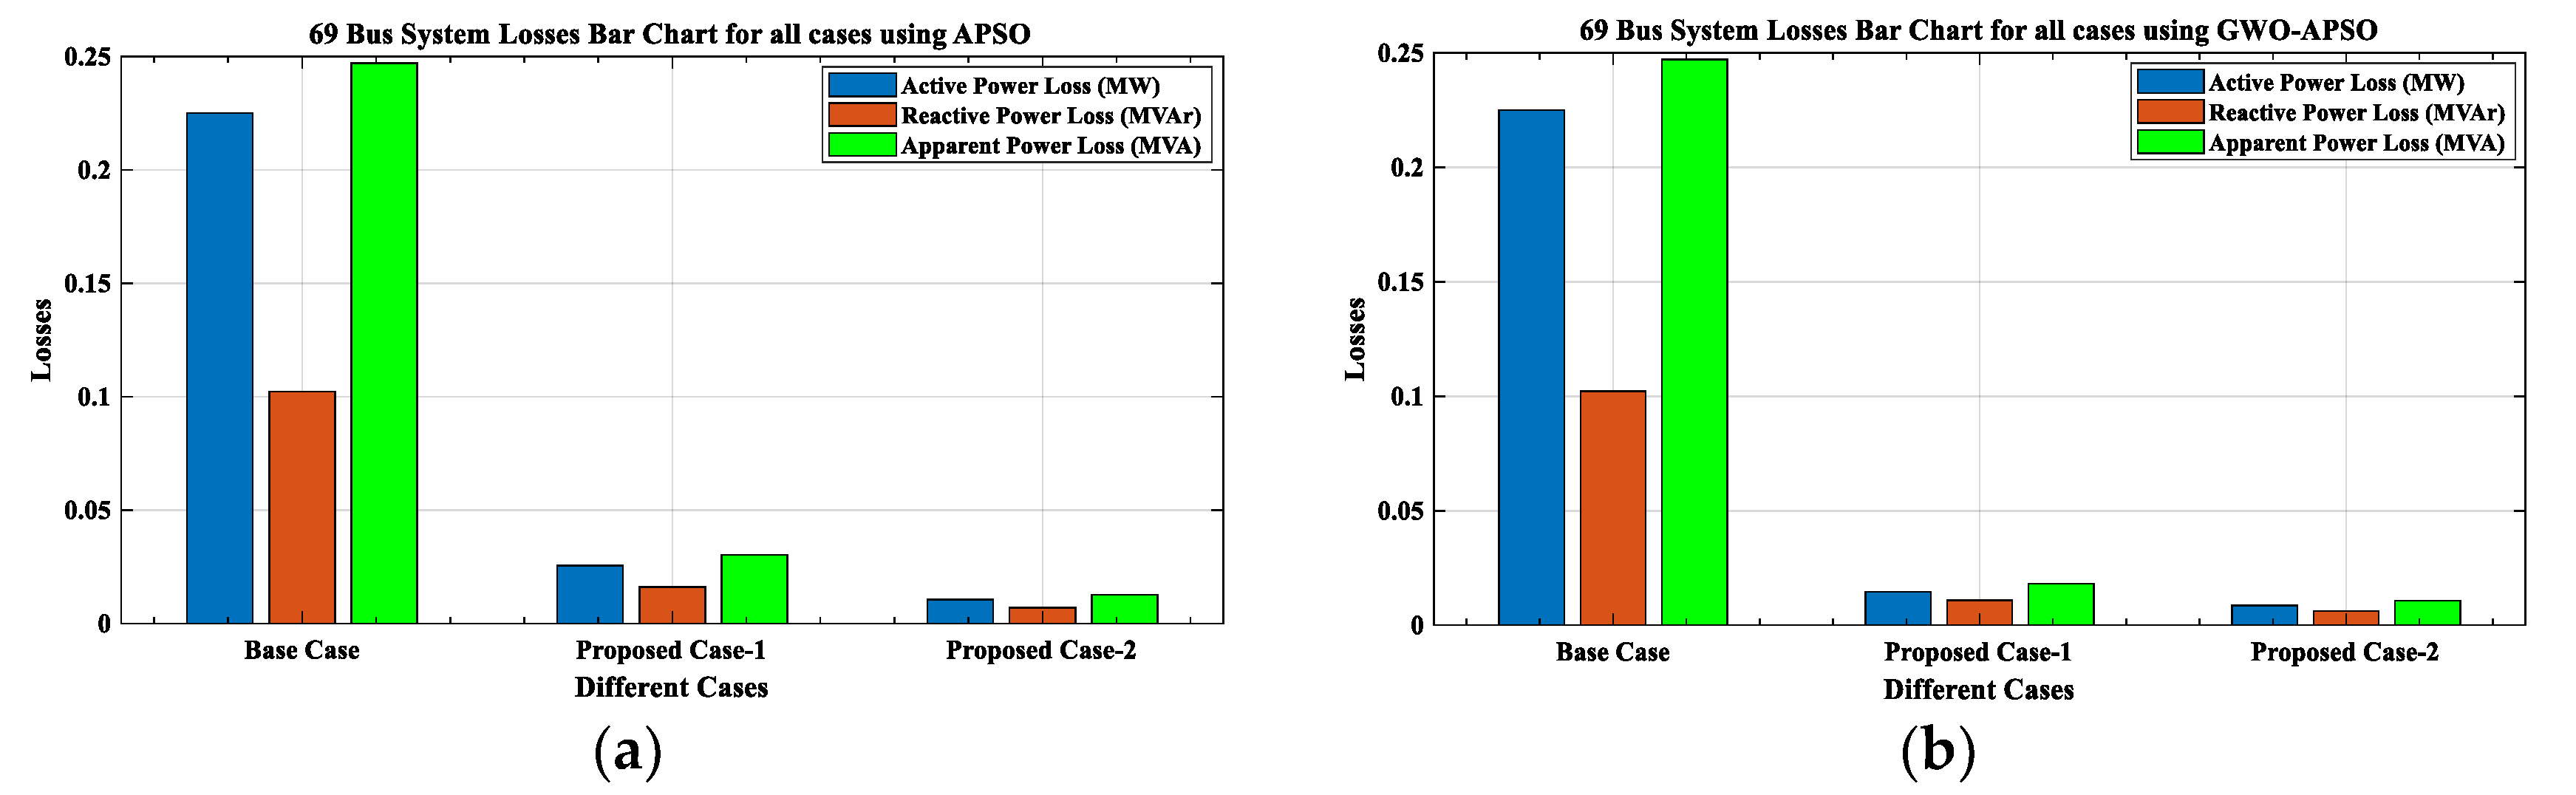
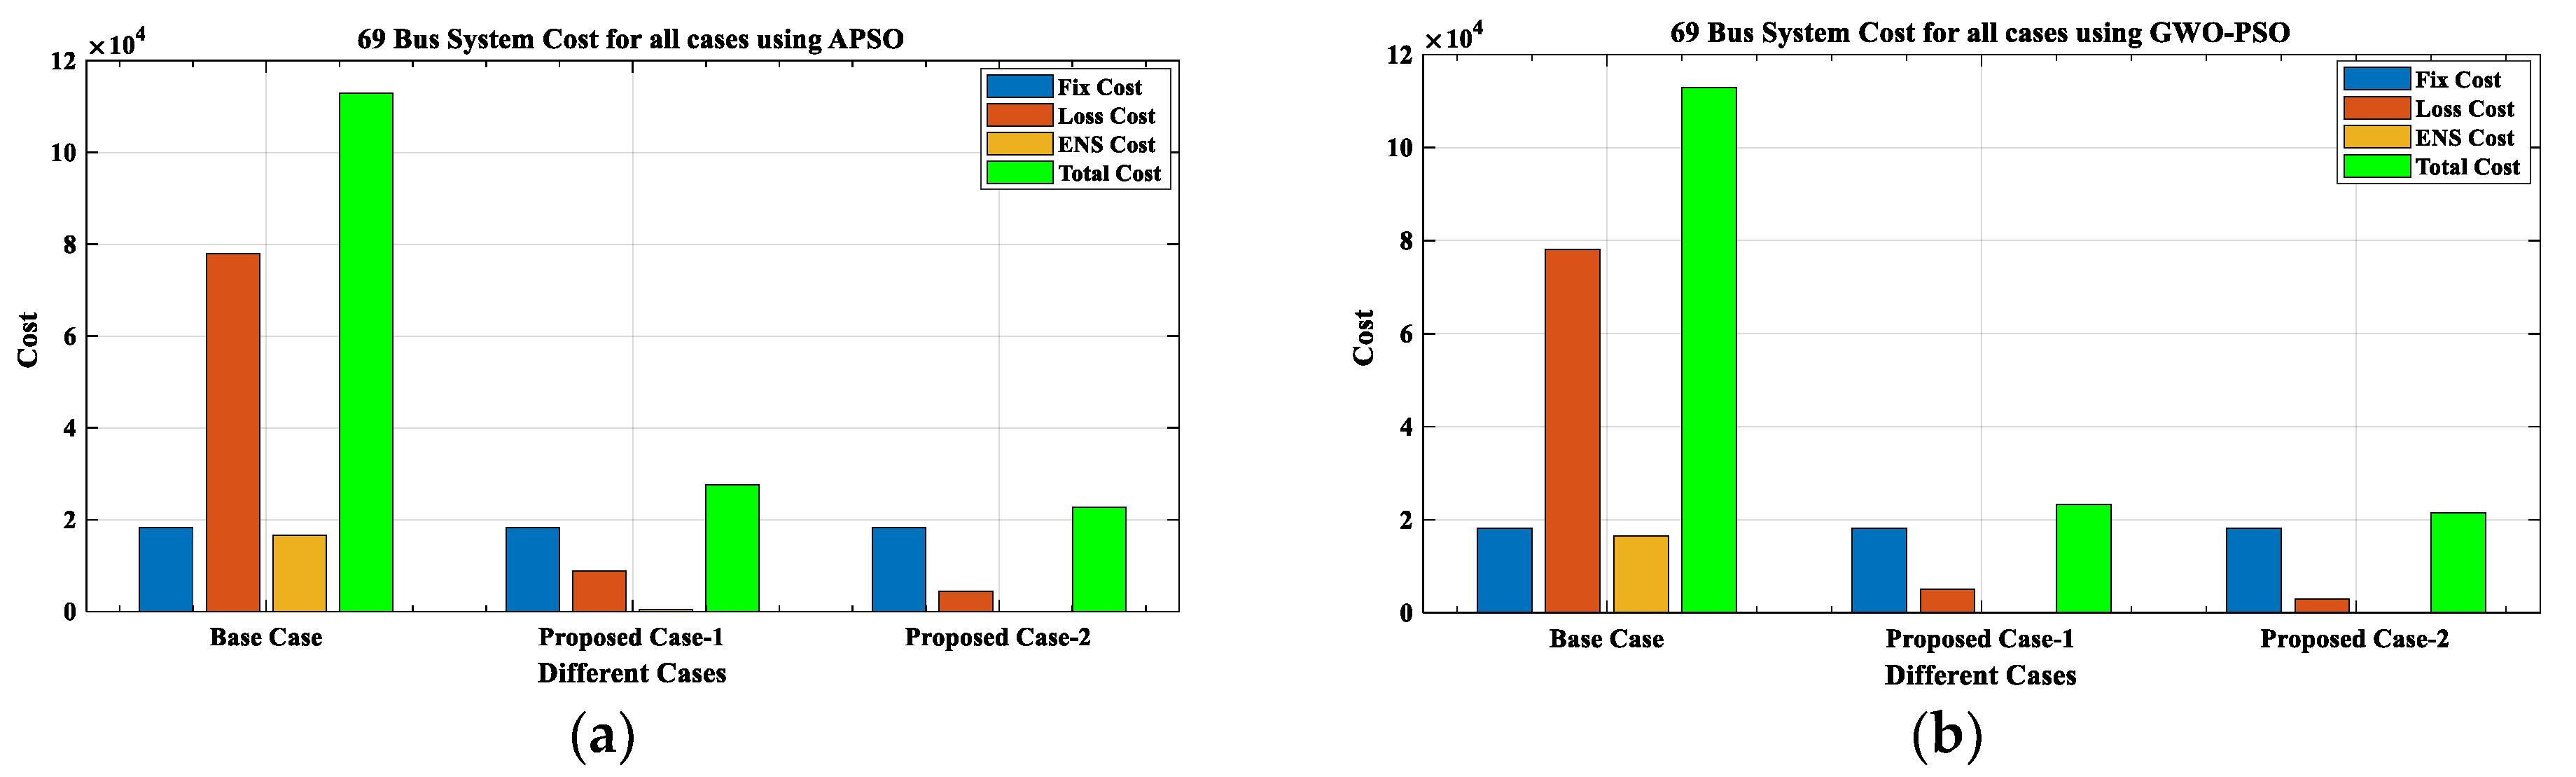
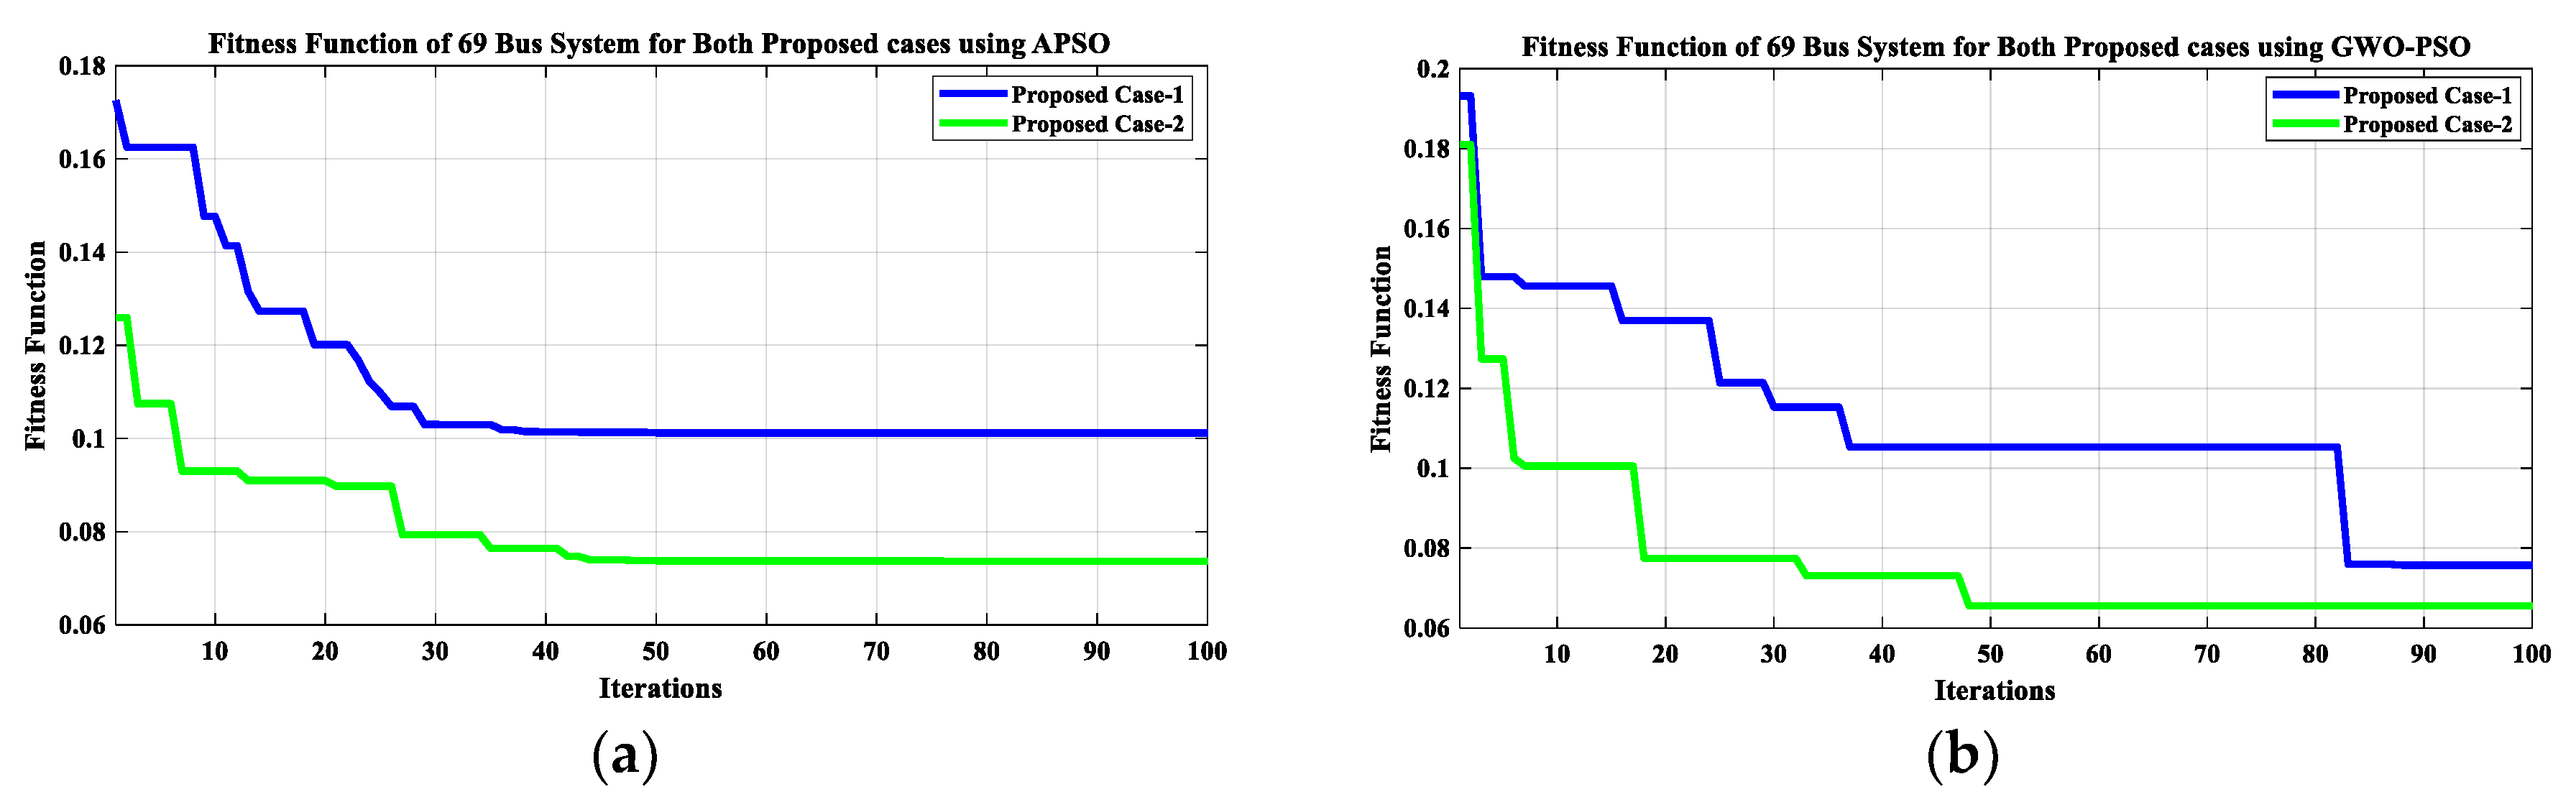
5.2. 69-Bus Radial Distribution Network

The 69-bus RDN consists of 3.80 MW and 2.69 MVAr total active and reactive power loads, respectively. The data for the branch and load of the 69-bus IEEE test system [48,51] are presented in Figure 19 and the given numbers are representing the electric buses. The obtained outcomes for the PC-1 and PC-2 are illustrated in Table 9, Table 10, Table 11, Table 12 and Table 13 and Figure 20, Figure 21, Figure 22, Figure 23, Figure 24, Figure 25, Figure 26, Figure 27 and Figure 28.
The base case (BC) is considered as a case without DGs and reconfiguration. After the LFA, the observed real power loss (PLoss) is 0.225 MW, and the reactive power loss (QLoss) is 0.1022 MVAr for the BC, as shown in Table 6. The maximum deviation in voltage (VD) of the system is 0.1908 p.u. with respect to (w.r.t.) voltage reference, the short circuit level of line current (SCLLCurrent) is 6.6534 kA, and the reliability is 84.36%, as shown in Table 10 and Table 11.

5.2.1. The Proposed Case-1 (PC-1)

In PC-1, using APSO, three active and three reactive power DGs are optimally placed at bus numbers 48, 36, and 61 of the IEEE 69-bus RDN. The capacity of these DGs are 2 MW, 2.6 MW, 1.75 MW, and 0.16 MVAr, −0.71 MVAr, 1.53 MVAr, respectively, as shown in Table 9 and Figure 19a. After placing these DGs at optimal locations, the M O F F value is minimized to 0.1017, as given in Table 10. With this minimized M O F F , the system voltage profile is improved, with a maximum VD of 0.1273 p.u. The PLoss and QLoss are reduced to 0.0256 MW and 0.0161 MVAr, respectively, as illustrated in Table 11 and Figure 20a, Figure 21a, Figure 22a, Figure 23a and Figure 24a. Most importantly, the short circuit/fault tolerance capacity of the system is enhanced, as the SCLLCurrent is reduced by 97.12%, with an improved system reliability of 96.42%, as shown in Table 11 and Table 12 and Figure 28a. In this implementation, the fix cost is the same, with a value of USD 18,230.327/year. However, the cost related to loss and ENS is reduced to USD 8873.0903/year and USD 477.3242/year from USD 78,051.832/year and USD 16,594.715/year, respectively. Hence, there is a reduction in total cost, as it was USD 112,876.87/year in the BC, and in PC-1, it is USD 27,580.742/year, as mentioned in Table 13 and Figure 25a.
Similarly, DGs are planned using the GWO-PSO technique to present a comparative analysis between both techniques, i.e., APSO and GWO-PSO. The optimal locations using GWO-PSO are at bus numbers 61, 23, and 49. The optimal sizes of DGs are of 1.80 MW, 0.51 MW, 1.56 MW and 1.12 MVAr, 0.22 MVAr 0.26 MVAr from the real and reactive power perspective, as illustrated in Table 9 and Figure 19b. After placing these DGs at optimal locations, the M O F F value is minimized to 0.0757, as mentioned in Table 5. With this minimized M O F F , the system voltage profile is improved, with a maximum VD of 0.1146 p.u. The PLoss and QLoss are reduced to 0.0146 MW and 0.0109 MVAr, respectively, as illustrated in Table 11, Figure 20b, Figure 21b, Figure 22b, Figure 23b and Figure 24b. Most importantly, the short circuit/fault tolerance capacity of the system is enhanced, as the SCLLCurrent is reduced by 97.36%, with improved system reliability of 96.78%, as shown in Table 11 and Table 12 and Figure 28b. In this implementation, the fix cost is the same, with the value of USD 18,230.327/year. However, the cost related to loss and ENS is reduced to USD 5048.5566/year and USD 87.6699/year from USD 78,051.832/year and USD 16,594.715/year, respectively. Hence, the total cost observed is USD 23,366.5538/year, which is less than the BC, as given in Table 13 and Figure 25b.

5.2.2. The Proposed Case-2 (PC-2)

In PC-2, using APSO, multiple DG planning with reconfiguration has been carried out without disturbing the system radiality. Three active and three reactive power DGs (PRDG and QDSTAT) are optimally placed with reconfiguration at bus numbers 36, 61, and 46 of the IEEE 69 bus RDN. The capacities of all optimal PRDG and QDSTAT at these buses are 3.60 MW, 1.95 MW, 0.50 MW, and −1.18 MVAr, 1.55 MVAr, 0.641 MVAr, with TS1, TS2, TS3, and TS5 active tie-switches, as shown in Table 9 and Figure 19b. After placing these DGs at optimal locations, the M O F F value is minimized to 0.0725, as given in Table 10. With this minimized M O F F , the system voltage profile is improved, with a maximum VD of 0.1053 p.u. The PLoss and QLoss are reduced to 0.0106 MW and 0.0070 MVAr with 0.0127 MVA as SLoss, respectively, as illustrated in Table 11 and Figure 20, Figure 21, Figure 22, Figure 23 and Figure 24. Most importantly, the short circuit/fault tolerance capacity of the system is enhanced, as the SCLLCurrent is reduced by 99.99%, with improved system reliability of 96.78%, as shown in Table 11 and Table 12 and Figure 28a. In PC-2, using APSO, the fix cost value is still fixed, with the value of USD 18,230.327/year. At the same time, the cost related to loss and ENS is reduced to USD 3677.7492/year and USD 1.5903/year from USD 78,051.832/year and USD 16,594.715/year, respectively. Hence, there is a reduction in total cost, as it was USD 112,876.87/year in the BC, but in PC-2, its value reduced to USD 21,926.545/year, as illustrated in Table 13 and Figure 25a.
Similarly, in PC-2, using the GWO-PSO technique, DGs are planned with reconfiguration without disturbing the system radiality to present a comparative analysis between both the techniques, i.e., APSO and GWO-PSO. The optimal locations using GWO-PSO are at bus number 12, 61, and 4. The capacities of PRDG in MW and QDSTAT in MVAr at these buses are 0.89, 2.39, 0.27, and 0.41, 1.15, 1.11, with all TS1 to TS5 active tie-switches, as illustrated in Table 9 and Figure 19b. After placing these DGs at optimal locations, the M O F F value is minimized to 0.0656, as given in Table 10. With this minimized M O F F , the system voltage profile is improved, with a maximum VD of 0.1015 p.u. The PLoss and QLoss is reduced to 0.0087 MW and 0.0062 MVAr with 0.0107 MVA as SLoss, respectively, as illustrated in Table 11 and Figure 20, Figure 21, Figure 22, Figure 23 and Figure 24. Most importantly, the short circuit/fault tolerance capacity of the system is enhanced, as the SCLLCurrent is reduced by 99.47%, with an improved system reliability of 96.72% w.r.t. BC, as shown in Table 11 and Table 12 and Figure 28b. In PC-2, using GWO-PSO, the cost related to loss and ENS is reduced to USD 3018.6946/year and USD 173.1570/year from USD 78,051.832/year and USD 16,594.715/year, respectively, with no change in fix cost. Hence, there is a reduction in total cost, as it was USD 112,876.87/year in the BC, but in PC-2, it is USD 21,422.1786/year, as mentioned in Table 13 and Figure 25. The reliability indices with system reliability of the 69-bus are shown in Figure 26. The proposed cases’ M O F F of the 69-bus are presented in Figure 27.
After placing the DGs at optimal locations with reconfiguration in IEEE 69-bus RDN, it has been observed that the total real and reactive power drawn by the system (which includes PSB_GEN, QSB_GEN and PRDG, QDSTAT) are reduced to 3.81 MW and 2.70 MVAr, respectively, in which the total real and reactive power generation is 5.46% and 3.57% less than the BC. Hence, with this novel implementation, (PC-2) using APSO and GWO-PSO, the PLoss is reduced by 95.29% and 96.14%, QLoss is reduced by 93.15% and 93.94%, and VD is also decreased by 44.81% and 46.80%, respectively, as shown in Table 11 and Figure 20b, Figure 21b, Figure 22b, Figure 23b and Figure 24b. The SCLLCurrent is reduced by 99.99% and 99.47% using APSO and GWO-PSO separately. Consequently, the reliability is increased up to 96.78% and 96.72%, as it was 84.36% in BC, as given in Table 12 and Figure 28b.
From the comparative analysis between APSO and GWO-PSO, it can be concluded that the outcomes of GWO-PSO are superior to APSO. Finally, the detailed analysis of results indicates that the concurrent optimal planning of multi-Renewable Solar-DG and DSTATCOM in a Reconfigured IEEE 69-bus RDN using the APSO and GWO-PSO techniques is an effective approach to minimize the M O F F , and its minimized outcome is illustrated in Table 10, as well as in Figure 27 as a graphical representation.
In Table 14, a comparison of the proposed work of this paper and other excerpted works from the literature [52,53,54] is presented. Hence, from this comparative analysis, it is found that the proposed work’s outcomes tabulated in Table 6 and Table 11 are much better than those in the existing work.

6. Conclusions

The concurrent optimal planning of multiple Solar-DG and DSTATCOM in IEEE 33- and 69-bus reconfigured RDN has been done using APSO and GWO-PSO, based on a proposed novel multiple objective-based fitness-function ( MO F F ). This MO F F consists of different system indices, such as loss in real power (PLoss), loss in reactive power (QLoss), deviation in voltage (VD), short circuit level of line current (SCLLCurrent), and system reliability (RS). The economic perspective of the system has also been considered, based on the various costs, such as the fix, loss, and Energy Not Supplied (ENS) cost. A detailed comparative analysis of obtained results using the APSO and GWO-PSO techniques has been presented for both IEEE 33 and 69-bus RDN. Thereafter, it has been observed that between both proposed cases, i.e., PC-1 and PC-2, PC-2 using GWO-PSO performs better.
This analysis using APSO and GWO-PSO in PC-2, as compared to PC-1, for IEEE 33-bus RDN shows an improved voltage profile, with a maximum VD of 0.1082 p.u. and 0.1077 p.u., respectively. It was 0.1869 p.u. in the base case (BC), as demonstrated in Table 6 and Figure 10. A significant reduction is noticed in the PLoss with 0.0121 MW and 0.0101 MW using APSO and GWO-PSO, respectively. The QLoss is decreased to 0.0100 MVAr and 0.0084 MVAr, as given in Table 6 and Figure 11, Figure 12, Figure 13 and Figure 14. Consequently, the SCLLCurrent is reduced by 96.42% and 99.31%, which is why the short circuit/fault tolerance capacity of the system is enhanced, which can be seen in Table 6. Hence, the RS in PC-2 for IEEE 33-bus RDN are enhanced by 98.26% and 99.67%, as compared with BC data, as illustrated in Table 7 and Figure 18. From the economic perspective, savings in loss and ENS costs are noticed. Hence, the total cost is reduced to USD 23,304.857/year and USD 22,453.3336/year using APSO and GWO-PSO, respectively, for IEEE 33-bus RDN, as presented in Table 8 and Figure 15.
Similarly, the analysis for IEEE 69-bus RDN using APSO and GWO-PSO in PC-2 shows an improved voltage profile, with a maximum VD of 0.1053 p.u. and 0.1015 p.u., respectively. It was 0.1908 p.u. in the base case (BC), as demonstrated in Table 9 and Figure 20. A significant reduction is noticed in the PLoss with 0.0106 MW and 0.0087 MW using APSO and GWO-PSO, respectively. The QLoss decreased to 0.0070 MVAr and 0.0062 MVAr, as given in Table 9 and Figure 21, Figure 22, Figure 23 and Figure 24. Consequently, the SCLLCurrent decreased by 96.99% and 99.47%, which is why the short circuit/fault tolerance capacity of the system is enhanced, which can be seen in Table 9. Hence, the RS in PC-2 for IEEE 33-bus RDN is enhanced by 96.78% and 96.72%, as compared with BC data, as illustrated in Table 12 and Figure 28. From the economic perspective, savings in loss and ENS costs are noticed. Hence, the total cost is reduced to USD 21,926.545/year and USD 21,422.1786/year using APSO and GWO-PSO, respectively, for IEEE 33-bus RDN, as presented in Table 13 and Figure 25.
After analyzing the results of the proposed work, a comparison between the proposed work results with other existing works is presented in Table 14. From this comparative analysis, it is found that the proposed work’s outcomes, as tabulated in Table 6 and Table 11, are much better than the existing works. While commenting on the superiority of results between APSO and GWO-PSO, the result obtained using GWO-PSO is superior in terms of reduction in VD, PLoss, QLoss, SCLLCurrent, and RS, along with increments in economic benefit. Hence, it can be seen that the proposed methodology for the concurrent optimal planning of multiple DGs (Solar-DG and DSTATCOM) in IEEE 33 and 69-bus reconfigured RDN using APSO and GWO-PSO is productive from the viewpoint of reduction in real power loss and reactive power loss and improvement in the voltage profile, as well as the short circuit level of line current, and its reliability.

Author Contributions

Conceptualization, B.K.S.; methodology, B.K.S.; software, B.K.S.; validation, B.K.S., A.K.B., J.H.J. and M.L.K.; formal analysis, B.K.S.; investigation, B.K.S.; resources, B.K.S.; data curation, B.K.S.; writing—original draft preparation, B.K.S.; writing—review and editing, B.K.S.; visualization, B.K.S.; supervision, A.K.B. and M.L.K. All authors have read and agreed to the published version of the manuscript.

Funding

This research received no external funding.

Institutional Review Board Statement

This study did not require ethical approval.

Acknowledgments

All the authors acknowledge the NIT-Durgapur and the Ministry of Education Government of India, for giving the facility to conduct the research.

Conflicts of Interest

The authors declare no conflict of interest.

Abbreviations and Acronyms

DGDistributed Generation
Solar-DG/RDGRenewable Distributed Generation
RDNRadial Distribution Network
DSTATCOMDistribution STATic COMpensator
TSReconfiguration Tie-Switching
APSOAdaptive Particle Swarm Optimization
GWO-PSOGrey Wolf-Particle Swarm Optimization
PLossReal Power Loss
QLossReactive Power Loss
VDDeviation of Voltage
SCLLCurrentShort Circuit level of Line Current
RSSystem Reliability
M O F F Multiple-objective based fitness-function
IPLoss Index for Real Power Loss
IQLossIndex for Reactive Power Loss
IVDIndex for Deviation of Voltage
ISCLLCurrentIndex for Short Circuit level of Line Current
IRSIndex for System Reliability
SAIFI System Average Interruption Frequency Index
SAIDI System Average Interruption Duration Index
CAIDI Customer Average Interruption Duration Index
ENS Energy Not Supplied
PRDGSolar-DG size as Real Power DG
QDSTATDSTATCOM size as Reactive Power DG
PSB_GENReal Power Generation at Slack Bus
QSB_GEN Reactive Power Generation at Slack Bu
CLoad, VRLoadConstant Load, Variable load
INLoad, RESLoadIndustrial Load, Residential Load
COMLoad, MIXLoadCommercial Load, Mixed Load

References

  1. Oda, E.S.; El Hamed, A.M.A.; Ali, A.; Elbaset, A.A.; El Sattar, M.A.; Ebeed, M. Stochastic Optimal Planning of Distribution System Considering Integrated Photovoltaic-Based DG and DSTATCOM Under Uncertainties of Loads and Solar Irradiance. IEEE Access 2021, 9, 26541–26555. [Google Scholar] [CrossRef]
  2. Isha, G.; Jagatheeswari, P. Optimal allocation of DSTATCOM and PV array in distribution system employing fuzzy-lightning search algorithm. Automatika 2021, 62, 339–352. [Google Scholar] [CrossRef]
  3. Ghatak, S.R.; Sannigrahi, S.; Acharjee, P. Comparative performance analysis of DG and DSTATCOM using improved PSO based on success rate for deregulated environment. IEEE Syst. J. 2017, 12, 2791–2802. [Google Scholar] [CrossRef]
  4. Sannigrahi, S.; Ghatak, S.R.; Acharjee, P. Strategically incorporation of RES and DSTATCOM for techno-economic-environmental benefits using search space reduction-based ICSA. IET Gener. Transm. Distrib. 2019, 13, 1369–1381. [Google Scholar] [CrossRef]
  5. Yuvaraj, T.; Ravi, K.; Devabalaji, K.R. Optimal allocation of DG and DSTATCOM in radial distribution system using cuckoo search optimization algorithm. Model. Simul. Eng. 2017, 2017, 2857926. [Google Scholar] [CrossRef] [Green Version]
  6. Sannigrahi, S.; Ghatak, S.R.; Acharjee, P. Fuzzy logic–based rooted tree optimization algorithm for strategic incorporation of DG and DSTATCOM. Int. Trans. Electr. Energy Syst. 2019, 29, e12031. [Google Scholar] [CrossRef]
  7. Yuvaraj, T.; Ravi, K.; Devabalaji, K.R. DSTATCOM allocation in distribution networks considering load variations using bat algorithm. Ain Shams Eng. J. 2017, 8, 391–403. [Google Scholar] [CrossRef] [Green Version]
  8. Tolabi, H.B.; Ali, M.H.; Rizwan, M. Simultaneous reconfiguration, optimal placement of DSTATCOM, and photovoltaic array in a distribution system based on fuzzy-ACO approach. IEEE Trans. Sustain. Energy 2014, 6, 210–218. [Google Scholar] [CrossRef]
  9. Ghatak, S.R.; Sannigrahi, S.; Acharjee, P. Multiobjective Framework for Optimal Integration of Solar Energy Source in Three-Phase Unbalanced Distribution Network. IEEE Trans. Ind. Appl. 2020, 56, 3068–3078. [Google Scholar] [CrossRef]
  10. Malik, M.Z.; Kumar, M.; Soomro, A.M.; Baloch, M.H.; Farhan, M.; Gul, M.; Kaloi, G.S. Strategic planning of renewable distributed generation in radial distribution system using advanced MOPSO method. Energy Rep. 2020, 6, 2872–2886. [Google Scholar] [CrossRef]
  11. Thangaraj, Y.; Kuppan, R. Multi-objective simultaneous placement of DG and DSTATCOM using novel lightning search algorithm. J. Appl. Res. Technol. 2017, 15, 477–491. [Google Scholar] [CrossRef]
  12. Weqar, B.; Khan, M.T.; Siddiqui, A.S. Optimal placement of distributed generation and D-STATCOM in radial distribution network. Smart Sci. 2018, 6, 125–133. [Google Scholar] [CrossRef]
  13. Salkuti, S.R. Optimal allocation of DG and D-STATCOM in a distribution system using evolutionary based Bat algorithm. Int. J. Adv. Comput. Sci. Appl. (IJACSA) 2021, 12, 360–365. [Google Scholar] [CrossRef]
  14. Sambaiah, K.S.; Jayabarathi, T. Optimal reconfiguration of distribution network in presence of D-STATCOM and photovoltaic array using a metaheuristic algorithm. Eur. J. Electr. Eng. Comput. Sci. 2020, 4, 1–15. [Google Scholar] [CrossRef]
  15. Yuvaraj, T.; Ravi, K. Multi-objective simultaneous DG and DSTATCOM allocation in radial distribution networks using cuckoo searching algorithm. Alex. Eng. J. 2018, 57, 2729–2742. [Google Scholar] [CrossRef]
  16. Chinnaraj, S.G.R.; Kuppan, R. Optimal sizing and placement of multiple renewable distribution generation and DSTATCOM in radial distribution systems using hybrid lightning search algorithm-simplex method optimization algorithm. Comput. Intell. 2021, 37, 1673–1690. [Google Scholar] [CrossRef]
  17. Injeti, S.K.; Thunuguntla, V.K. Optimal integration of DGs into radial distribution network in the presence of plug-in electric vehicles to minimize daily active power losses and to improve the voltage profile of the system using bio-inspired optimization algorithms. Prot. Control. Mod. Power Syst. 2020, 5, 1–15. [Google Scholar] [CrossRef] [Green Version]
  18. Balu, K.; Mukherjee, V. Optimal siting and sizing of distributed generation in radial distribution system using a novel student psychology-based optimization algorithm. Neural Comput. Appl. 2021, 33, 15639–15667. [Google Scholar] [CrossRef]
  19. Mirjalili, S.; Mirjalili, S.M.; Lewis, A. Grey wolf optimizer. Adv. Eng. Softw. 2014, 69, 46–61. [Google Scholar] [CrossRef] [Green Version]
  20. Gohil, B.N.; Patel, D.R. A hybrid GWO-PSO algorithm for load balancing in cloud computing environment. In Proceedings of the 2018 Second International Conference on Green Computing and Internet of Things (ICGCIoT), Bangalore, India, 16–18 August 2018. [Google Scholar]
  21. Kraiem, H.; Aymen, F.; Yahya, L.; Triviño, A.; Alharthi, M.; Ghoneim, S.S.M. A comparison between particle swarm and grey wolf optimization algorithms for improving the battery autonomy in a photovoltaic system. Appl. Sci. 2021, 11, 7732. [Google Scholar] [CrossRef]
  22. Şenel, F.A.; Gökçe, F.; Yüksel, A.S.; Yiğit, T. A novel hybrid PSO–GWO algorithm for optimization problems. Eng. Comput. 2019, 35, 1359–1373. [Google Scholar] [CrossRef]
  23. Ackermann, T.; Andersson, G.; Söder, L. Distributed generation: A definition. Electr. Power Syst. Res. 2001, 57, 195–204. [Google Scholar] [CrossRef]
  24. Teng, J.-H. A direct approach for distribution system load flow solutions. IEEE Trans. Power Deliv. 2003, 18, 882–887. [Google Scholar] [CrossRef]
  25. Díaz, G.; Gómez-Aleixandre, J.; Coto, J. Direct backward/forward sweep algorithm for solving load power flows in AC droop-regulated microgrids. IEEE Trans. Smart Grid 2015, 7, 2208–2217. [Google Scholar] [CrossRef] [Green Version]
  26. Alam, A.; Gupta, A.; Bindal, P.; Siddiqui, A.; Zaid, M. Power loss minimization in a radial distribution system with distributed generation. In Proceedings of the 2018 International Conference on Power, Energy, Control and Transmission Systems (ICPECTS), Chennai, India, 22–23 February 2018. [Google Scholar]
  27. Kennedy, J.; Eberhart, R. Particle swarm optimization. In Proceedings of the ICNN’95-International Conference on Neural Networks, Perth, WA, Australia, 27 November–1 December 1995; Volume 4. [Google Scholar]
  28. Zhan, Z.H.; Zhang, J.; Li, Y.; Chung, H.S.H. Adaptive particle swarm optimization. IEEE Trans. Syst. Man Cybern. Part B (Cybern.) 2009, 39, 1362–1381. [Google Scholar] [CrossRef] [Green Version]
  29. Dulău, L.I.; Abrudean, M.; Bică, D. Distributed generation technologies and optimization. Procedia Technol. 2014, 12, 687–692. [Google Scholar] [CrossRef] [Green Version]
  30. Bohre, A.K.; Agnihotri, G.; Dubey, M. Optimal sizing and sitting of DG with load models using soft computing techniques in practical distribution system. IET Gener. Transm. Distrib. 2016, 10, 2606–2621. [Google Scholar] [CrossRef]
  31. El-Zonkoly, A.M. Optimal placement of multi-distributed generation units including different load models using particle swarm optimisation. IET Gener. Transm. Distrib. 2011, 5, 760–771. [Google Scholar] [CrossRef]
  32. Ochoa, L.F.; Padilha-Feltrin, A.; Harrison, G.P. Evaluating distributed time-varying generation through a multiobjective index. IEEE Trans. Power Deliv. 2008, 23, 1132–1138. [Google Scholar] [CrossRef] [Green Version]
  33. Prakash, R.; Sujatha, B.C. Optimal placement and sizing of DG for power loss minimization and VSI improvement using bat algorithm. In Proceedings of the 2016 National Power Systems Conference (NPSC), Bhubaneswar, India, 19–21 December 2016. [Google Scholar]
  34. Sedighizadeh, M.; Esmaili, M.; Mahmoodi, M.M. Reconfiguration of distribution systems to improve reliability and reduce power losses using imperialist competitive algorithm. Iran. J. Electr. Electron. Eng. 2017, 13, 287–302. [Google Scholar]
  35. Prakash, D.; Lakshminarayana, C. Multiple DG placements in distribution system for power loss reduction using PSO algorithm. Procedia Technol. 2016, 25, 785–792. [Google Scholar] [CrossRef]
  36. Zimmerman, R.D.; Murillo-Sanchez, C.E. ‘Matpower7.1’, October 2020. Available online: http://www.pserc.cornell.edu//matpower/ (accessed on 1 October 2022).
  37. Swarnkar, A.; Gupta, N.; Niazi, K. A novel codification for meta-heuristic techniques used in distribution network reconfiguration. Electr. Power Syst. Res. 2011, 81, 1619–1626. [Google Scholar] [CrossRef]
  38. Reddy, A.S.; Reddy, M.D. Optimization of network reconfiguration by using particle swarm optimization. In Proceedings of the 2016 IEEE 1st International Conference on Power Electronics, Intelligent Control and Energy Systems (ICPEICES), Delhi, India, 4–6 July 2016. [Google Scholar]
  39. Hien, N.C.; Mithulananthan, N.; Bansal, R.C. Location and sizing of distributed generation units for loadabilty enhancement in primary feeder. IEEE Syst. J. 2013, 7, 797–806. [Google Scholar] [CrossRef]
  40. Hung, D.Q.; Mithulananthan, N. Multiple distributed generator placement in primary distribution networks for loss reduction. IEEE Trans. Ind. Electron. 2011, 60, 1700–1708. [Google Scholar] [CrossRef]
  41. Hung, D.Q.; Mithulananthan, N.; Bansal, R.C. Analytical expressions for DG allocation in primary distribution networks. IEEE Trans. Energy Convers. 2010, 25, 814–820. [Google Scholar] [CrossRef]
  42. Georgilakis, P.S.; Hatziargyriou, N.D. Optimal distributed generation placement in power distribution networks: Models, methods, and future research. IEEE Trans. Power Syst. 2013, 28, 3420–3428. [Google Scholar] [CrossRef]
  43. Sawle, Y.; Gupta, S.; Bohre, A.K. Review of hybrid renewable energy systems with comparative analysis of off-grid hybrid system. Renew. Sustain. Energy Rev. 2018, 81, 2217–2235. [Google Scholar] [CrossRef]
  44. Lujano-Rojas, J.M.; Dufo-Lopez, R.; Bernal-Agustín, J.L. Technical and economic effects of charge controller operation and coulombic efficiency on stand-alone hybrid power systems. Energy Convers. Manag. 2014, 86, 709–716. [Google Scholar] [CrossRef]
  45. Olatomiwa, L.; Mekhilef, S.; Huda, A.; Ohunakin, O.S. Economic evaluation of hybrid energy systems for rural electrification in six geo-political zones of Nigeria. Renew. Energy 2015, 83, 435–446. [Google Scholar] [CrossRef]
  46. Giraud, F.; Salameh, Z.M. Steady-state performance of a grid-connected rooftop hybrid wind-photovoltaic power system with battery storage. IEEE Trans. Energy Convers. 2001, 16, 1–7. [Google Scholar] [CrossRef]
  47. Ghatak, S.R.; Sannigrahi, S.; Acharjee, P. Multi-objective approach for strategic incorporation of solar energy source, battery storage system, and DSTATCOM in a smart grid environment. IEEE Syst. J. 2018, 13, 3038–3049. [Google Scholar] [CrossRef]
  48. Taher, S.A.; Afsari, S.A. Optimal location and sizing of DSTATCOM in distribution systems by immune algorithm. Int. J. Electr. Power Energy Syst. 2014, 60, 34–44. [Google Scholar] [CrossRef]
  49. Hosseini, M.; Shayanfar, H.A. Regular paper modeling of series and shunt distribution FACTS devices in distribution systems load flow. J. Electr. Syst. 2008, 4, 1–12. [Google Scholar]
  50. Acha, E.; Fuerte-Esquivel, C.R.; Ambriz-Perez, H.; Angeles-Camacho, C. FACTS: Modelling and Simulation in Power Networks; John Wiley & Sons: Hoboken, NJ, USA, 2004. [Google Scholar]
  51. Kadir, A.F.A.; Mohamed, A.; Shareef, H.; Wanik, M.Z.C. Optimal placement and sizing of distributed generations in distribution systems for minimizing losses and THD_v using evolutionary programming. Turk. J. Electr. Eng. Comput. Sci. 2013, 21 (Suppl. S2), 2269–2282. [Google Scholar] [CrossRef]
  52. Vempalle, R.; Dhal, P.K. Optimal Placement of Distributed Generators in Optimized Reconfigure. Radial Distribution Network using PSO-DA Optimization Algorithm. In Proceedings of the 2020 International Conference on Advances in Computing, Communication & Materials (ICACCM), Dehradun, India, 21–22 August 2020. [Google Scholar]
  53. Muhammad, M.A.; Mokhlis, H.; Naidu, K.; Amin, A.; Franco, J.F.; Othman, M. Distribution network planning enhancement via network reconfiguration and DG integration using dataset approach and water cycle algorithm. J. Mod. Power Syst. Clean Energy 2019, 8, 86–93. [Google Scholar] [CrossRef]
  54. Rahim, M.N.A.; Mokhlis, H.; Abu Bakar, A.H.; Rahman, M.T.; Badran, O.; Mansor, N.N. Protection coordination toward optimal network reconfiguration and DG sizing. IEEE Access 2019, 7, 163700–163718. [Google Scholar] [CrossRef]
Figure 1. Different types of DG technology.
Energies 16 00263 g001
Figure 2. Typical Representation of DSTATCOM connected to kth Bus.
Energies 16 00263 g002
Figure 3. One-line diagram of a distribution framework for successive buses.
Energies 16 00263 g003
Figure 4. Voltage and current phasor representation of the system without DSTATCOM.
Energies 16 00263 g004
Figure 5. Installation of DSTATCOM in (k + 1)th bus of the system to be proposed.
Energies 16 00263 g005
Figure 6. Voltage and current phasor representation of the system with DSTATCOM.
Energies 16 00263 g006
Figure 7. Flowchart for concurrent planning of multi Solar-DG and DSTATCOM in a reconfigured RDN using APSO technique.
Energies 16 00263 g007
Figure 8. Flowchart for concurrent planning of multi Solar-DG and DSTATCOM in a reconfigured RDN using GWO-PSO technique.
Energies 16 00263 g008
Figure 9. Proposed IEEE 33 bus RDN for both proposed cases; (a) APSO, (b) GWO-PSO.
Energies 16 00263 g009
Figure 10. Voltage profile of 33-bus RDN for all cases; (a) APSO, (b) GWO-PSO.
Energies 16 00263 g010
Figure 11. Real power loss for all cases of 33-bus RDN; (a) APSO, (b) GWO-PSO.
Energies 16 00263 g011
Figure 12. Reactive power loss for all cases of 33-bus RDN; (a) APSO, (b) GWO-PSO.
Energies 16 00263 g012
Figure 13. Cumulative representation of active and reactive power loss for all cases of 33-bus RDN; (a) APSO, (b) GWO-PSO.
Energies 16 00263 g013
Figure 14. Cumulative bar representation of PLoss, QLoss, and SLoss for all cases of 33-bus RDN; (a) APSO, (b) GWO-PSO.
Energies 16 00263 g014
Figure 15. The fix, loss, and ENS cost for all the cases of 33-bus RDN; (a) APSO, (b) GWO-PSO.
Energies 16 00263 g015
Figure 16. Reliability indices with system reliability of the 33-bus RDN; (a) APSO, (b) GWO-PSO.
Energies 16 00263 g016
Figure 17. Proposed cases M O F F of the 33-bus RDN; (a) APSO, (b) GWO-PSO.
Energies 16 00263 g017
Figure 18. All proposed cases’ percentage reliability of the 33-bus RDN; (a) APSO, (b) GWO-PSO.
Energies 16 00263 g018
Figure 19. Proposed IEEE 69-bus RDN for both proposed cases; (a) APSO, (b) GWO-PSO.
Energies 16 00263 g019
Figure 20. Voltage profile of 69-bus RDN for all cases; (a) APSO, (b) GWO.
Energies 16 00263 g020
Figure 21. Real power loss for all cases of 69-bus RDN; (a) APSO, (b) GWO-PSO.
Energies 16 00263 g021
Figure 22. Reactive power loss for all cases of 69-bus RDN; (a) APSO, (b) GWO-PSO.
Energies 16 00263 g022
Figure 23. Cumulative representation of active and reactive power loss for all cases of 69-bus RDN; (a) APSO, (b) GWO-PSO.
Energies 16 00263 g023
Figure 24. Cumulative bar representation of PLoss, QLoss, and SLoss for all cases of 69-bus RDN; (a) APSO, (b) GWO-PSO.
Energies 16 00263 g024
Figure 25. Cost for all cases of the 69-bus RDN; (a) APSO, (b) GWO-PSO.
Energies 16 00263 g025
Figure 26. Reliability indices with system reliability of the 69-bus RDN; (a) APSO, (b) GWO-PSO.
Energies 16 00263 g026
Figure 27. Proposed cases M O F F of the 69-bus RDN; (a) APSO, (b) GWO-PSO.
Energies 16 00263 g027
Figure 28. All proposed cases percentage reliability of the 69-bus RDN; (a) APSO, (b) GWO-PSO.
Energies 16 00263 g028
Table 1. Review on Distribution System Planning Methodology, Objectives, and Outcomes.
Author’sObjectivesMethodSystemLoad TypeDistribution System
Planning
Outcomes
Oda et al.,
2021
[1]
The objective is to minimize total annual cost, VD and maximize system stability. ALO and MALOStandard 69 and 118-bus IEEE systemSeasonal loadPlanning of
Solar-DG and DSTATCOM
The result of the proposed work reveals that the objective has been achieved by reducing the total annual cost, VD with enhanced RS.
Isha et al.,
2021
[2]
To increase voltage stability with decrement VD and PLoss. Fuzzy LSAStandard IEEE 30 bus RDN CLoadSiting and Sizing of
DSTATCOM and Solar-DG
From the comparative analysis of the work, it is found that the objective has been achieved.
Ghatak et al.,
2017
[3]
The objective is to maximize the benefit-cost ratio, emission cost-benefit with profile of voltage improvement indices. PSO with Adaptive Inertia weight Standard 33 and 69-bus IEEE systemCLoadPlanning of DG and DSTATCOMThe result analysis reveals that the objective is achieved with better computational efficiency in the unhealthy case of the RDN as compared to the healthy case.
Sannigrahi et al.,
2019
[4]
The target is to improve economic benefit, system voltage and decrease pollutants emission with line losses.ICSA51-bus practical distribution networkVRLoadIntegration of
Renewable Energy Sources and DSTATCOM
The outcomes state that the objective is achieved with reduced computational time and improved algorithm performance for the weaker buses of the practical distribution system as compared to the healthier buses.
Yuvaraj et al.,
2017
[5]
To minimize a problem formulated for reduction in total loss of power with respect to different equality and inequality constraints. CSAStandard IEEE 12, 34, and 69-bus RDNCLoadIntegration of
DG and DSTATCOM
Compensating the real and reactive power using DG and DSTATCOM integration with CSA leads to improvement in overall energy efficiency, power quality, voltage profile, power factor, load balancing, system stability, etc.
Sannigrahi et al.,
2019
[6]
To improve the economic and environmental benefits with profile of voltage, and reduction in losses.Fuzzy Logic–based RTOStandard IEEE 69, and 118 bus systemVRLoad with uncertainty in DG outputIntegration of
DG with DSTATCOM
In this work, the DG and DSTATCOM are planned taking varying load and uncertainty of DG output to improve the economic and environmental benefits with profile of voltage and reduction in losses.
Yuvaraj et al.,
2017
[7]
To decrease the loss of power balancing is taken as objective.BA Standard 33 and 69-bus IEEE systemCLoadPlanning of DSTATCOMIn this work BA along with voltage stability index is utilized for the optimal allocation and sizing of DSTATCOM separately for the reduction in power loss of RDN.
Tolabi et al.,
2014
[8]
Reduction in loss of power with increased voltage profile and feeder load balancing is taken as objective. Fuzzy-Ant Colony Optimization (Fuzzy-ACO) Tai-Power 11.4 kV real and 33-bus IEEE RDNVRLoad (Light, Normal and Heavy) Simultaneous reconfiguration planning with DG and DSTATCOMThe revealed result says that the objective has been achieved with 75.93% and 44.71% as loss reduction, 51.76% and 33.2% as voltage profile improvement, respectively for both the considered systems.
Ghatak et al.,
2020
[9]
The aim is to enhance economic, environmental, technical, and reliability characteristics.Extended NSGA IIThree-phase practical unbalanced 240-node USA systemVRLoadPlanning of PV with Battery and DSTATCOMThe simulation results of all three cases reveal that planning of PV with Battery and DSTATCOM (case 3) maximizes the objective parameters.
Malik et al.,
2020
[10]
The objective is to optimize indices of voltage stability, power losses, and VD.PSOPortuguese 94-bus distribution systemVRLoad Intermittent renewable DGs planning with biomass and capacitor banksPlanning of DGs with biomass and capacitor banks in 94-bus Portuguese RDN is proposed, where the objective has been achieved with reduced power loss and VD up to 77.82% and 9.68%.
Thangaraj et al.,
2017
[11]
To enhance the index for voltage stability and minimize the index for power loss, VD.LSAStandard 33 and 69-bus IEEE systemLight (0.5) to Peak (1.6) loadPlanning of DG and DSTATCOMThree objective indices were considered by the author and the same was achieved with DG and DSTATCOM planning using LSA in 33 and 69-bus RDN.
Weqar et al.,
2018
[12]
Power loss and VD minimization.Analytical
approach
33-bus IEEE RDNCLoadDSTATCOM and DG planningAuthor proposes optimal planning of single DSTATCOM and DG at bus number 13 of 33-bus IEEE RDN, which reduces the active and reactive loss of power to 121.7023 kW and 95.3274 kVAr.
Salkuti et al.,
2021
[13]
Aim is to decrease the loss of power and enhance the voltage profile.EA based BAStandard 34 and 85-bus IEEE systemCLoadPlanning of DG and DSTATCOMHere the author optimally placed DG and DSTATCOM with reduced loss of power with enhanced voltage profile.
Sambaiah et al.,
2020
[14]
The power loss reduction and profile of voltage improvement is taken as objective.GOAIEEE 33, 69, and 118 bus systemVRLoadOptimal reconfiguration planning with DG and DSTATCOMThe result proves that network reconfiguration with DSTATCOM and PV leads to reduction in power loss and voltage profile improvement.
Yuvaraj et al.,
2020
[15]
Aim is to decrease the loss of power and enhance the voltage profile.Bio-Inspired CSAIEEE 33, and 136-bus systemVRLoadDSTATCOM and DG planningIn this work, the result proves that planning of DG and DSTATCOM leads to decrement in loss of power, as well as voltage profile enhancement using CSA.
Chinnaraj et al.,
2020
[16]
The target is power loss minimization and voltage profile improvement.LSF and LSA-SMStandard 33 and 69-bus IEEE systemCLoadAllocation of DG and DSTATCOMThe outcome states that allocation of DSTATCOM and DG reduces loss of power, as well as the profile of voltage enhancement using LSA-SM for both IEEE 33 and 69-bus RDN.
Injeti et al.,
2020
[17]
The objective is to minimize everyday PLoss, along with improvement in the profile of voltage.PSO and BOIEEE 33-bus RDNVRLoadIn presence of Plug-In Electric Vehicle (PEV) integration of DGsThe author proposed an approach to reduce daily real power loss with an enhanced profile of the voltage in presence of PEV using PSO and BO by planning DG in a 33-bus RDN.
Balu et al.,
2021
[18]
To minimize VD, PLoss, and voltage stability index.SPBOIEEE 33 and 69 bus RDN with real 136 bus system VRLoadOptimal integration of DG The proposed work is tested in three systems, and for all the systems SPBO is applied for their optimal DG allocation solution. Finally noticed the optimal solution.
Alam et al.,
2018
[26]
The objective is to mitigate loss, with enhancement in voltage profile.MINLPStandard 33 and 69-bus IEEE systemCLoadIntegration of distributed generationOutcomes of the two test systems signify the impacts of the proposed approach aiming to reduce losses with enhancement in voltage profile by integrating DG optimally.
Bohre
et al.,
2016
[30]
To minimize a function comprises of losses, voltage profile, reliability, and shift factor indices.GA and PSOStandard 54-bus real system with 33 and 69-bus IEEE RDNCLoad, INLoad, RESLoad, COMLoad, MIXLoad Integration of multiple DGs with different models of loadThe systems results signify a reduction in losses, ENS, apparent power intake with enhancement in voltage profile, system reliability, benefit in cost, and ATC.
El-Zonkoly, A.M.
2011
[31]
Optimizing an objective function comprises of PLoss and QLoss, voltage profile, intakes in MVA and line loading.PSO38-bus radial and 30-bus meshes systemCLoad, INLoad, RESLoad, COMLoad, MIXLoad Integration of multiple DGs with different models of loadThe outcomes reveal that the suggested approach is capable of integrating multi-DGs with different models of load to decrease the losses, MVA flows and intake from the grid, along with voltage stability margin and loading improvement.
Prakash et al.,
2016
[33]
Aim is to decrease the PLoss and improve the index for voltage stability.BAStandard 69-bus IEEE systemCLoadIntegration of distributed generationThe noticed result clarified that using BA the objective has been achieved with an improved profile of voltage.
Sedighizade et al.,
2017
[34]
To minimize indices of reliability and PLoss.ICAStandard 33 and 69-bus IEEE systemCLoadNetwork reconfigurationOutcome reveals that the objective has achieved with minimized real power loss and increased reliability.
Prakash, et al.,
2016
[35]
Objective is to decrease power loss, along with increment in profile of voltage.PSOStandard 33 and 69-bus IEEE systemCLoadIntegration of distributed generationThrough this effective work, the decrement in power loss, along with increment in the profile of voltage takes place.
Swarnkar et al.,
2011
[37]
Objective is to minimize the loss.GAIEEE 69, 84 and 135 bus systemCLoadNetwork reconfigurationThrough the proposed method, the loss has been minimized and validated on all the three considered systems.
Reddy et al.,
2016
[38]
The objective is to decrease PLoss and VD.PSOStandard 33 and 69-bus IEEE systemVRLoad (Light, Normal and Heavy) Network reconfigurationThrough this effective work, the decrement in real power loss, along with increment in the profile of voltage at poor buses above 0.9 p.u. take place.
Ghatak et al.,
2018
[47]
The target is to maximize technical, economical, reliable and environmental features of the system considered.E_NSGA IIStandard 69-bus IEEE systemVRLoadIntegration of Renewable Energy Resources, Battery Storage Systems and DSTATCOMThrough this approach, the technical, economical, reliable and environmental features of the system have been maximized. To check the efficacy of revealed outcomes, the said approach has been compared with other multiple-objective-based approach.
Taher et al.,
2014
[48]
Objective is to reduce power loss with minimum cost of DSTATCOM installation by considering enchantment of current and voltage profile.Immune AlgorithmStandard 33 and 69-bus IEEE systemVRLoad (Light, Medium and Peak)Optimal integration of DTATCOMNoticed results say that the target is achieved with reduced loss of power and cost of installation for DSTATCOM, improved current profile, and voltage profile of buses.
Kadir et al.,
2013
[51]
The objective is to reduce power loss with total harmonic distortion in voltageEA Standard 69-bus IEEE systemCLoadIntegration of distributed generationThe outcomes reveal a reduction in total harmonic distortion in voltage and losses with the improved voltage profile.
Vempalle et al.,
2020
[52]
To maximize the savings on DG installation, maintenance cost and minimize the loss.PSO and DAIEEE 33 and 69 bus systemCLoadOptimal Reconfigure using PSO with DG Planning using DAIn this work using hybrid PSO-DA, the optimal planning of DG with reconfiguration is carried out, and the outcomes show maximization of savings with reduction in loss.
Muhammad et al.,
2019
[53]
The aim is to enhance the RDN planning via its reconfiguration and integration of DG to reduce the loss and enhance the RDN solution quality. Dataset approach with WCAStandard IEEE 33 and 69 bus RDNCLoadReconfiguration, sizing
and siting of DG
Depending on the evaluation from outcomes it is noticed that the power loss is reduced by 75.16% and 84.42% for IEEE 33 and 69-bus RDN respectively, also improves solution quality of considered networks via Network Reconfiguration and DG Integration.
Rahim et al.,
2019
[54]
Objective is to keep the protective devices in coordination after planning with minimum PLoss and VD.FA and EAIEEE 33, 69, and 118 bus systemCLoadReconfiguration with DG incorporating protective devicesThe outcomes reveal that the optimal reconfiguration and DG sizing with minimum PLoss and VD ensured coordinated protective devices operated correctly during normal and fault conditions.
Table 2. Various DG technology with their per module specification and efficiency range.
DG Technology Per Module Typical Size RangeRange of Efficiency in %
Renewable Wind-Turbine200 W–3 MW40–80
Solar-PV20 W–1000 kW35–45
Biomass100 kW–20 MW60–75
Small-Hydro5 kW–100 MW90–98
Micro-Hydro20 kW–1 MW90–98
Geothermal5 MW–100 MW35–50
Ocean-Energy100 kW–1 MW80–90
Solar-Thermal1 MW–80 MW50–75
Battery-Storage500 kW–5 MW70–75
Non-RenewableInternal-Combustion-Engines5 kW–10 MW80–90
Reciprocating-Engines3 kW–6 MW80–85
Combustion-Turbine1 MW–250 MW80–90
Hybrid-Fuel Cell200 kW–20 MW80–85
Small-Fuel Cell1 kW–300 kW80–90
Micro-CHP1 kW–10 kW75–89
Automotive-Fuel Cells30 kW–60 kW80–90
Micro-Turbines35 kW–1 MW80–85
Table 3. DG technology based on size.
Distributed Generation TypeRange of Power Generation
Micro-DGs ≈1 W < 5 kW
Small-DGs5 kW < 5 MW
Medium-DGs5 MW < 50 MW
Large-DGs50 MW < 300 MW
Table 4. Simultaneous optimal planning of DGs (in MW and MVAr) with and without reconfiguration of 33 bus RDN.
CasesP & Q at Slack Bus
(PSB_GEN/ QSB_GEN)
PRDG (MW)/Bus No.
(PRDG1, PRDG2 & PRDG3)
QDSTAT (MVAr)/Bus No.
(QDSTAT, QDSTAT & QDSTAT
TS5, TS4, TS3, TS2, & TS1Total P, Q and S GenerationTechniques
BC3.92/2.44-----------------------------------3.922.444.6-----
PC-10.78/0.581.09/240.78/141.08/300.46/240.30/140.96/30-----3.732.314.39APSO
PC-20.98/0.891.04/70.87/250.83/320.28/70.32/250.83/320, 1, 0, 0 & 13.732.314.39
PC-10.98/0.460.89/60.72/331.14/241.06/60.42/330.37/24-----3.732.314.39GWOPSO
PC-21.05/0.600.57/301.05/241.05/260.91/300.61/240.19/261, 1, 1, 1, & 13.732.314.39
Table 5. The M O F F and its indices for IEEE 33 bus RDN.
Cases/TechniquesFitness Function Indices
M O F F
IPLossIQLossIVDISCLLCurrentIRS
TechniquesAPSOGWOPSOAPSOGWOPSOAPSOGWOPSOAPSOGWOPSOAPSOGWOPSOAPSOGWOPSO
PC-10.07630.07250.10510.10000.10190.10050.07960.06630.37560.36660.10950.0957
PC-20.05990.05000.07420.06240.09840.09790.03580.00690.34750.32650.10690.0909
Table 6. Losses, Short Circuit Level of Line Current (SCLLCurrent), Deviation in Voltage (VD) of the 33 bus RDN.
Cases/TechniquesLossesSCLLCurrent (kA)VD (p.u.)
PLoss (MW)QLoss (MVAr)SLoss (MVA)
TechniquesAPSOGWOPSOAPSOGWOPSOAPSOGWOPSOAPSOGWOPSOAPSOGWOPSO
BC0.20270.20270.13510.13510.24350.24353.41183.41180.18690.1869
PC-10.01550.01470.01420.01350.02100.01990.27150.22630.11210.1106
PC-20.01210.01010.01000.00840.01560.01310.12200.02340.10820.1077
Table 7. Indices of Reliability of the IEEE 33 bus RDN.
Cases/
Techniques
Reliability IndicesRS in %
SAIFISAIDICAIDIENSRI SUM
TechniquesAPSOGWOPSOAPSOGWOPSOAPSOGWOPSOAPSOGWOPSOAPSOGWOPSOAPSOGWOPSO
BC0.48690.48690.29210.29210.60.60.48690.48690.46650.466589.3289.32
PC-10.03880.03230.02330.01940.60.60.03880.03230.17520.171096.1296.77
PC-20.01740.00330.01040.00200.60.60.02050.00390.16210.152398.2699.67
Table 8. Different cost of the IEEE 33 bus RDN.
Cases/TechniquesFix Cost ($/Year)Loss Cost ($/Year)ENS Cost ($/Year)Total Cost ($/Year)
TechniquesAPSOGWOPSOAPSOGWOPSOAPSOGWOPSOAPSOGWOPSO
BC18,791.417118,791.417170,307.884370,307.8848509.47638509.476397,608.777897,608.7778
PC-118,791.417118,791.41715363.79795100.3413677.2700564.521824,832.48524,456.2802
PC-218,791.417118,791.41714209.17152515.1814304.26841146.735123,304.85722,453.3336
Table 9. Simultaneous optimal planning of DGs (in MW and MVAr) with and without reconfiguration of 69-bus RDN.
CasesP & Q at Slack Bus (PSB_GEN/QSB_GEN)PRDG (MW)/Bus No.
(PRDG1, PRDG2 & PRDG3)
QDSTAT (MVAr)/Bus No.
(QDSTAT, QDSTAT & QDSTAT
TS5, TS4, TS3, TS2, & TS1Total P, Q and S GenerationTechniques
BC4.03/2.80-----------------------------------4.032.84.9-----
PC-1−2.52/1.732.00/482.60/361.75/610.16/48−0.71/361.53/61-----3.832.714.69APSO
PC-2−2.24/1.73.60/361.95/610.50/46−1.18/361.55/610.64/461, 0, 1, 1, & 13.812.74.67
PC-1−0.06/1.101.80/610.51/231.56/491.12/610.22/230.26/49-----3.812.74.67GWOPSO
PC-20.27/0.020.89/122.39/610.27/40.41/121.15/611.11/41, 1, 1, 1, & 13.812.74.67
Table 10. The M O F F and its indices for IEEE 69-bus RDN.
Cases/TechniquesFitness Function Indices
M O F F
IPLossIQLossIVDISCLLCurrentIRS
TechniquesAPSOGWOPSOAPSOGWOPSOAPSOGWOPSOAPSOGWOPSOAPSOGWOPSOAPSOGWOPSO
PC-10.11370.06470.15750.10700.11570.10420.02880.01670.22870.21010.10110.0757
PC-20.04710.04240.06890.06050.09580.09180.00010.00530.20590.17470.07250.0656
Table 11. Losses, Short Circuit Level of Line Current (SCLLCurrent), Deviation in Voltage (VD) of the 69-bus RDN.
Cases/TechniquesLossesSCLLCurrent (kA)VD (p.u.)
PLoss (MW)QLoss (MVAr)SLoss (MVA)
TechniquesAPSOGWOPSOAPSOGWOPSOAPSOGWOPSOAPSOGWOPSOAPSOGWOPSO
BC0.2250.2250.10220.10220.24710.24716.65346.65340.19080.1908
PC-10.02560.01460.01610.01090.03020.01820.19140.17570.12730.1146
PC-20.01060.00870.00700.00620.01270.01070.00060.03520.10530.1015
Table 12. Indices of Reliability of the IEEE 69-bus RDN.
Cases/TechniquesReliability IndicesRS in %
SAIFISAIDICAIDIENSRI SUM
TechniquesAPSOGWOPSOAPSOGWOPSOAPSOGWOPSOAPSOGWOPSOAPSOGWOPSOAPSOGWOPSO
BC0.89020.89020.53410.53410.60.60.89020.89020.72870.728784.3684.36
PC-10.02560.01820.01540.00690.60.60.02560.002460.16660.162496.4297.18
PC-20.00010.00470.00010.00280.60.60.00010.00470.15010.153196.7896.72
Table 13. The fix, loss, and ENS cost for all the cases of IEEE 69-bus RDN; (a) APSO, (b) GWO-PSO.
Cases/TechniquesFix Cost ($/Year)Loss Cost ($/Year)ENS Cost ($/Year)Total Cost ($/Year)
TechniquesAPSOGWOPSOAPSOGWOPSOAPSOGWOPSOAPSOGWOPSO
BC18,230.32718,230.32778,051.83278,051.83216,594.71516,594.71511,2876.87112,876.87
PC-118,230.32718,230.3278873.09035048.5566477.324287.669927,580.74223,366.5538
PC-218,230.32718,230.3273677.74923018.69461.5902656173.157021,926.54521,422.1786
Table 14. The comparative analysis of the proposed work with existing work on 33- and 69-bus RDN.
Proposed/
Existing Work
Technique for OptimizationMagnitude% Reduction
PLoss (kW)VD (p.u.)PLossVD
For IEEE 33 Bus Distribution Network
Vempalle, et al. [52]PSO and Dragonfly Algorithm63.500.152268.6718.57
Muhammad, et al. [53]Water Cycle Algorithm51.74-----74.47-----
Harmony Search Algorithm96.83-----51.99-----
Fireworks Algorithm68.27-----66.32-----
Cuckoo Search Algorithm54.23-----73.25-----
Uniform voltage distribution based Constructive Algorithm57.28-----71.74-----
Rahim, et al. [54]Firefly Algorithm (FA)72.360.124964.3033.17
Evolutionary Programming Algorithm73.340.126863.8232.15
Work ProposedAdaptive PSO12.100.108294.0342.11
GWO-PSO10.100.107795.0242.38
For IEEE 69 Bus Distribution Network
Oda, et al. [1]ALO71.71-----68.13-----
MALO69.43-----69.14-----
Vempalle, et al. [52]PSO and Dragonfly Algorithm39.200.137582.627.93
Muhammad, et al. [53]Water Cycle Algorithm35.04-----84.42-----
Harmony Search Algorithm59.44-----73.58-----
Fireworks Algorithm39.57-----82.41-----
Cuckoo Search Algorithm36.90-----83.6-----
Uniform voltage distribution based Constructive Algorithm37.00-----83.56-----
Rahim, et al. [54]Firefly Algorithm (FA)39.540.118482.4737.94
Evolutionary Programming Algorithm40.340.118482.0737.94
Work ProposedAdaptive PSO10.600.105395.2944.81
GWO-PSO8.700.101596.1446.80
Disclaimer/Publisher’s Note: The statements, opinions and data contained in all publications are solely those of the individual author(s) and contributor(s) and not of MDPI and/or the editor(s). MDPI and/or the editor(s) disclaim responsibility for any injury to people or property resulting from any ideas, methods, instructions or products referred to in the content.

