Article

An Analysis of the Potential of Hydrogen Energy Technology on Demand Side Based on a Carbon Tax: A Case Study in Japan

1
School of Mechanical and Energy Engineering, Tongji University, Shanghai 200092, China
2
Faculty of Environmental Engineering, The University of Kitakyushu, Kitakyushu 808-0135, Japan
3
Innovation Institute for Sustainable Maritime Architecture Research and Technology, Qingdao University of Technology, Qingdao 266033, China
4
School of Engineering, Sanda University, Shanghai 201209, China
5
Energy and Environment Engineering Institute, Shanghai University of Electric Power, Shanghai 200090, China
*
Authors to whom correspondence should be addressed.
Energies 2023, 16(1), 342; https://doi.org/10.3390/en16010342
Submission received: 7 November 2022 / Revised: 13 December 2022 / Accepted: 23 December 2022 / Published: 28 December 2022
(This article belongs to the Section A5: Hydrogen Energy)

Abstract

:
Hydrogen energy is considered one of the main measures of zero carbonization in energy systems, but high equipment and hydrogen costs hinder the development of hydrogen energy technology. The objectives of this study are to quantify the environmental advantages of hydrogen energy through a carbon tax and study the application potential of hydrogen energy technology in a regional distributed energy system (RDES). In this study, various building types in the smart community covered by Japan’s first hydrogen energy pipeline are used as an example. First, ten buildings of five types are selected as the research objectives. Subsequently, two comparative system models of a regional distributed hydrogen energy system (RDHES) and an RDES were established. Then, by studying the optimal RDHES and RDES configuration and combining the prediction of future downward trends of fuel cell (FC) costs and energy carbon emissions, the application effect of FC and hydrogen storage (HS) technologies on the demand side was analyzed. Finally, the adaptability of the demand-side hydrogen energy system was studied by analyzing the load characteristics of different types of buildings. The results show that, when the FC price is reduced to 1.5 times that of the internal combustion engine (ICE), the existing carbon tax system can sufficiently support the RDHES in gaining economic advantages in some regions. Notably, when the carbon emissions of the urban energy system are reduced, the RDHES demonstrates stronger anti-risk ability and has greater suitability for promotion in museums and shopping malls. The conclusions obtained in this study provide quantitative support for hydrogen energy promotion policies on the regional demand side and serve as a theoretical reference for the design and adaptability research of RDHESs.

1. Introduction

1.1. Background

The technological progress and cost reduction offered by renewable energy can effectively promote further decarbonization of energy systems. However, with the increasing popularity of renewable energy, the planning and operation of the entire energy system must respond to massive adjustments to accommodate intermittent power generation. The development and utilization of hydrogen storage (HS) and hydrogen energy can help renewable energy break through existing bottlenecks and accelerate the decarbonization of energy systems [1].
Hydrogen energy is a global development hotspot. Research shows that by applying hydrogen energy as an alternative to fossil fuels in the future, carbon dioxide emissions can be reduced by 34% [2].
With breakthroughs in technological research and development and the promotion of large-scale commercial production processes, the price of hydrogen energy equipment has also decreased significantly [3]. However, compared with conventional energy equipment, the cost of hydrogen energy equipment still hinders obtaining economic advantages, which also leads to the relative lag of hydrogen-related infrastructure deployment [4]. To this end, all countries worldwide have introduced supportive policies for hydrogen energy development, mainly focusing on the research and development of fuel cell (FC) stacks and FC vehicles [5,6]. Therefore, most current research focuses are in the above two areas. However, due to the zero emission characteristics of its usage process, hydrogen energy is suitable for adding to the demand-side RDES for the combined supply of heat and power. This also provides an application space for hydrogen energy to consume renewable energy on the demand side directly [7,8].

1.2. Literature and Research Review

RDESs can directly produce, dispatch, and transmit energy on the demand side, including cooling, heating, electric, and other energy sources [9]. RDESs can improve energy conversion efficiency and often include some renewable energy equipment. Therefore, RDES is one of the important measures in the process of carbon reduction in an energy system [10]. Common RDES equipment includes internal combustion engines (ICEs), heat pumps (HPs), gas boilers, rooftop photovoltaics (RTPV), and various energy storage devices [11,12].
Currently, conventional RDES research is relatively mature, including optimal design and optimal operation. Current research focuses also include interactions with the power market [13] and correlations with urban planning [14]. Various research results are also gradually driving RDES to become a new trend in building-side energy systems [15]. Reference [16] studied the adaptability of photovoltaics, energy storage batteries, and electric vehicles V2G under different degrees of power market liberalization. Reference [17] studied the environment and peak shaving benefits of RDES including ICE under different building load types.
For hydrogen energy systems, more research is focused on the physical and chemical properties of FCs [18,19]. Research in the application field also tends to focus on transportation [20] and large-scale renewable energy hydrogen production [21,22]. However, there is currently little research on the application of hydrogen energy in an RDES, and it is still basically in the realm of theoretical research on thermoelectric characteristics and the adaptability of HS technology on the demand side [23,24,25]. Reference [26] analyzed the thermoelectric characteristics of a solid oxide fuel cell (SOFC) in a demand-side application through model simulation. Both reference [27] and reference [28] analyzed the commercial value and life-cycle benefits of FCs in a demand-side cogeneration system.
At present, the research on HS mainly focuses on coupling with renewable energy. Reference [29] studied the application effect of a photovoltaic (PV) and HS coupling system in residential buildings. Reference [30] coupled a battery with HS and studied the matching between this hybrid energy storage system and PVs. The research on the demand side of fuel cells is more concentrated in the residential area. Reference [31] takes a Japanese ENE-FARM system as the research object and studies its coupling with the photovoltaic system in independent housing. Reference [32] studied the application and promotion strategy of an FC-based micro-CHP system in the housing field.
Only a small amount of research involves the coupling of FC and HS on the demand side, and the FC system at this time is often not the core equipment of the system, but only the auxiliary equipment consuming hydrogen. Reference [33] established an off-grid PV—wind power—HS system based on the actual data of an island in Hawaii and studied the economic benefits of this system. It can be seen that the current research on the demand side of fuel cells is mostly about heat and electricity, and there is less research on integrated energy systems, including cold, heat, and electricity. At the same time, there are relatively few studies on the coupling between fuel cells and HS on the demand side.

1.3. Contents and Contribution

The literature review indicates that hydrogen energy has a low priority in RDES and remains in the peak shaving or auxiliary position. Furthermore, as more research objects pertain to electric power, this situation often leads to addressing combined cooling, heating, and power (CCHP) and renewable energy as separate entities; that is, there are few studies that incorporate hydrogen energy into a comprehensive energy system containing renewable energy. The main reason for this is that the cost of hydrogen energy equipment remains uncompetitive, and the hydrogen supply network is still imperfect. However, it is still necessary to perform a prospective study on hydrogen energy in RDES. Therefore, this study includes the current hotspot of carbon reduction. By introducing a carbon tax to quantify the environmental advantages of hydrogen energy, the government will provide policy support or subsidies for this technology investment. This will facilitate analyzing and studying the application potential and adaptability of hydrogen energy in RDESs at similar cost levels. The contributions and novelty of this study are as follows:
(1)
It is proposed to quantify the environmental advantages of a demand-side hydrogen energy system through a carbon tax, which provides a quantitative reference for the promotion and support policy of hydrogen energy.
(2)
Compared with conventional systems, the adaptability of the demand-side hydrogen energy system under different levels of PV permeability and user-load characteristics is studied.
(3)
The application potential of hydrogen energy on the demand side is analyzed in terms of energy cost, equipment cost, and energy carbon emissions, which provides a theoretical reference for the promotion of hydrogen energy on the demand side.
The content of this study is as follows. The first section discusses the background and provides an introduction that examines the research status of hydrogen energy on the demand side. The second section presents the methodology, which explains the mathematical model and the optimization method. The third section presents a case study, which explains the research objects and data and analyzes the load characteristics of different types of research objects. The fourth section presents the modeling optimization process and provides a discussion of the results. The model parameters are set, and the application effects of RDHES and RDES are compared and analyzed based on the optimization results. The fifth section outlines the trend and adaptability analysis, which studies the impact of equipment cost and energy carbon emissions on the research results and analyzes the adaptability of RDHES in different types of buildings. The sixth section presents the conclusions, which summarize the entire study and outline prospects for future research.

2. Methodology

2.1. Supply Side Model

Two systems, an RDHES and a conventional RDES, were used in this study. In the RDES (Figure 1a), the main power supply equipment is the ICE, PV, and battery. The main types of cooling and heating supply equipment are air conditioning (AC), conventional heating systems (CHSs), and HPs. The ICE produces electricity by burning natural gas, and the waste heat in the combustion process is converted into cooling and heating by AC. The HP produces heat and cooling by electricity. The excess heat and cooling produced by the HP and CHS during the low electricity price period and the excess cooling and heat produced by the AC due to excessive waste heat are stored in CHSs and supplied when needed. In contrast, surplus PV power generation is stored in batteries. In addition, batteries can also store electricity during the low-price period at night and supply it to users during the day.
In an RDHES (Figure 1b), the main power supply equipment is the FC, PV, and battery. The main cooling and heating supply equipment are the AC, CHS, and HP. The function of an FC is similar to an ICE, but it uses hydrogen to produce electricity while similarly using waste heat through AC. In addition to supplying electricity to users, the surplus part of PV will produce hydrogen through HS, and the hydrogen will be used in the FC operation.
The electricity balance (Formulas (1) and (2)) of the two systems are as follows:
E l o a d , R D E S t = E I C E t + E P V t + E B a t t e r y t + E G r i d t
E l o a d , R D H E S t + E H S t = E F C t + E P V t + E G r i d t
where E l o a d , R D E S t and E l o a d , R D H E S t are the user power demand of RDES and RDHES, respectively. E I C E t , E P V t , and E F C t are the outputs of ICE, PV, and FC, respectively. E B a t t e r y t is the power storage or output of the battery, and when the battery needs to be charged, E B a t t e r y t corresponds to a negative number. E H S t is the power storage of HS. t is the time series, which is every hour in a year (1, 2, 3, …, 8760).
The cooling (Formula (3)) and heating (Formula (4)) balance of users are as follows:
C l o a d t = C A C t + C H P c t + C C H S t
H l o a d t = H A C t + H H P h t + H C H S t
where C l o a d t , C A C t , C H P c t , and C C H S t represent the cooling demand and the outputs of the corresponding refrigeration equipment (AC, HP, and CHS). H l o a d t , H A C t , H H P h t , and H C H S t are the heating demand and the outputs of the corresponding heating equipment (AC, HP, and CHS). Among them, C C H S t and H H P h t have positive output values and negative energy storage values.

2.2. Economic Model

The total cost of users (Formula (5)) using the two systems is as follows:
c o s t = c o s t s y s t e m + c o s t m a i n t a i n + c o s t e n e r g y + c o s t c a r b o n
where c o s t s y s t e m is the energy system investment, including equipment, installation, and labor costs. c o s t m a i n t a i n is the cost of equipment maintenance. c o s t e n e r g y is the total cost of electricity, gas, and hydrogen during system operation.
c o s t c a r b o n is total cost of carbon emission. Detailed calculations are shown below. The investment (Formula (6)) and maintenance (Formula (7)) costs of the system are as follows:
c o s t s y s t e m = c o s t i
c o s t m a i n t a i n = m a i n t a i n i
where i refers to each piece of equipment in the system, including the ICE, FC, AC, HP, CHS, PV, and battery. As the HP includes two working conditions of refrigeration and heating, the equipment investment is calculated according to the larger working condition. The maintenance cost of most equipment in the system is set to 2% of the equipment investment according to engineering experience. Among them, the maintenance cost of ICE (Formula (8)) needs to be calculated separately:
m a i n t a i n I C E = E I C E t × p r i c e m a i t a i n
where p r i c e m a i t a i n is the maintenance cost per 1 kWh of ICE production, set to 1.6 Yen/kWh.
The energy cost (Formula (9)) of the two systems is as follows:
c o s t e n e r g y = E G r i d t × p r i c e e + U s e g a s × p r i c e g + U s e h y d r o g e n × p r i c e h
where p r i c e e , p r i c e g , and p r i c e h are the prices of the three input energy sources (electricity, gas, and hydrogen, respectively) in the urban supply network. U s e g a s and U s e h y d r o g e n are the natural gas and hydrogen consumption, respectively.
The grid power demand (Formula (10)) of the two systems is as follows:
E G r i d t = t = 1 8760 ( l o a d e + E H P E P V E I C E E B a t t e r y × ε B E H S × ε H S )
The number ‘8760’ in the formula represents 8760 h in a year (365 days × 24 h). l o a d e is the electricity load demand of users. E H P is the power consumed by the heat pump during heating and cooling. ε B and ε H S are energy storage losses of energy storage equipment (battery and HS, respectively).
The consumption of natural gas (Formula (11)) and hydrogen (Formula (12)) of the two systems are as follows:
U s e g a s = t = 1 8760 ( E I C E / δ I C E )
U s e h y d r o g e n = t = 1 8760 ( E F C / δ F C E H S × ε H S )
where δ I C E and δ F C are the efficiency of power generation equipment (ICE and FC, respectively).
The carbon emission cost (Formula (13)) of the two systems is as follows:
c o s t c a r b o n = ( E G r i d t × c a r b o n e + U s e g a s × c a r b o n g ) × p r i c e c a r b o n
where c a r b o n e is the average 1 kWh carbon emission of the power grid in the research area. c a r b o n g is the carbon emission coefficient of urban natural gas in the research area. p r i c e c a r b o n is the carbon tax.

2.3. Objective Function and Constraints

After the conversion of the carbon tax, all the calculations can be compared from an economic perspective. Therefore, the objective of this study is to optimize the economics. The objective function (Formula (14)) is as follows.
min ( c o s t ) = min ( c o s t s y s t e m + c o s t m a i n t a i n + c o s t e n e r g y + c o s t c a r b o n )
The limitations and assumptions of this study are as follows:
(1)
The installed capacity of PVs on the demand side is often limited by the rooftop area. Regardless of whether photovoltaic curtain walls, photovoltaic sheds, and other forms of applications are included, rooftop photovoltaic is still the core component of demand-side photovoltaics. Based on previous research of the study area [34] and the estimation of the building roof area in the study area [35], photovoltaic power generation is set so that it will not exceed 30% of the total power consumption of the target buildings.
(2)
There is no additional input of cooling and heating sources in the area, that is, the installed capacity of the cooling and heating systems must fully match the maximum demand of users.
(3)
The hydrogen energy used in this study is generated from renewable electricity, and the carbon dioxide generated in the equipment manufacturing phase is not considered, so the carbon emission coefficient of hydrogen used in this study is 0.
(4)
There are many kinds of cooling and heating storage technologies with different costs and energy storage losses. In this study, the water storage tank was selected as the energy storage equipment. Through the storage of refrigerant water and heat medium water, the water storage tank can be used for storing cooling water in the summer and heating water in the winter.
(5)
As it is a demand-side system, energy production equipment is close to users, so this study does not consider the loss of energy in pipeline transmission.
(6)
In this study, the assumption is that the photovoltaic output and user load can be accurately predicted; that is, the battery can make charging and discharging strategies in advance according to the high-precision prediction results for the next day.
The objective function of this study is solved and optimized by a genetic algorithm (GA). The final optimization result is the optimal configuration of RDHESs and RDESs in different scenarios.

3. Case Study and Basic Data

3.1. Case Study and Basic Data

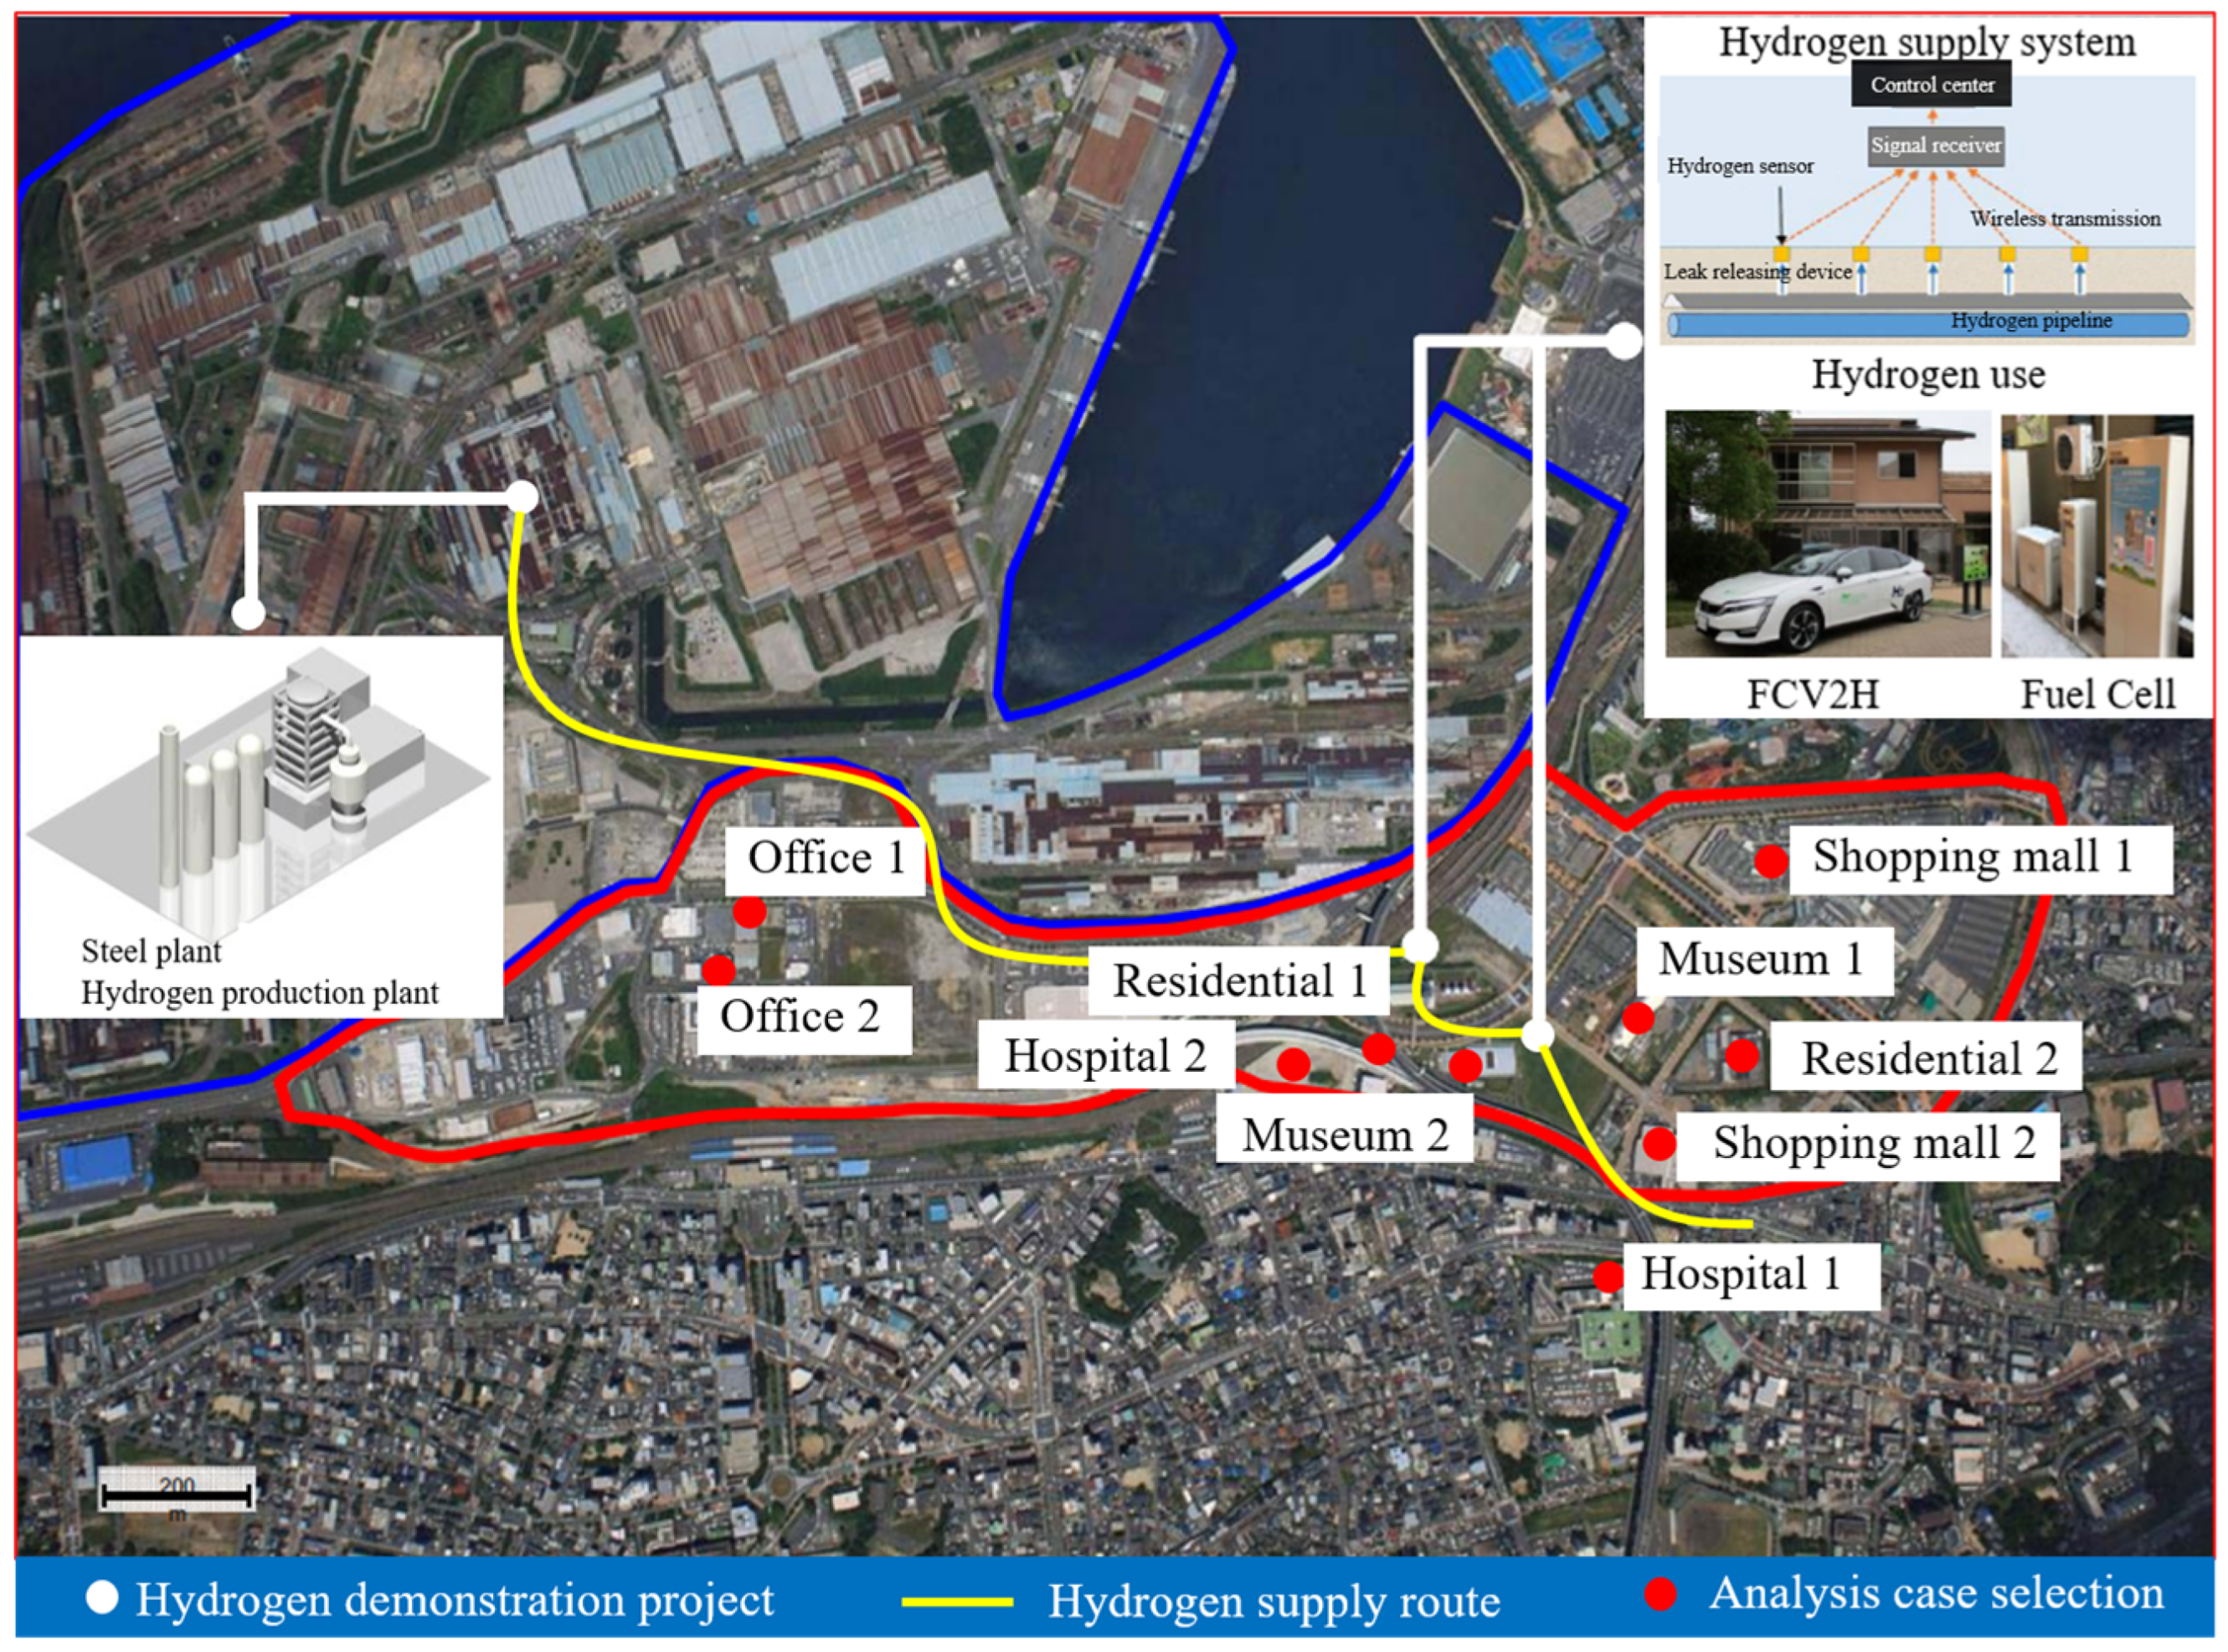
The target area of this study is a smart community in Kitakyushu, Japan. From 2011 to 2014, a hydrogen energy application demonstration was conducted in this region. As shown in Figure 2, a 1.2 km hydrogen energy supply line has been built in the area. In this study, different types of buildings around this line were selected as research objects. The author of this study participated in the relevant research of this hydrogen energy application demonstration, and the data used are the actual collected data at that time [36]. Energy consumption data from 49 buildings were collected in this area. Through previous research on these data, it was found that even for the same type of buildings, there are differences in the laws of energy consumption changes [16]. In this study, five different types of buildings were selected. Combined with the comparison of loads of different building types in the literature review [37,38,39], two buildings with the most obvious differences were selected as representatives of each type. Then, a total of ten buildings were selected as the research objects. Among them, museums represent various public service facilities such as libraries and gymnasiums. The building area and power consumption are summarized in Table 1 below. Table 1 shows that buildings with large differences were selected as research objects in this study to support the analysis of RDHES adaptability.

3.2. Basic Data Pretreatment and Analysis

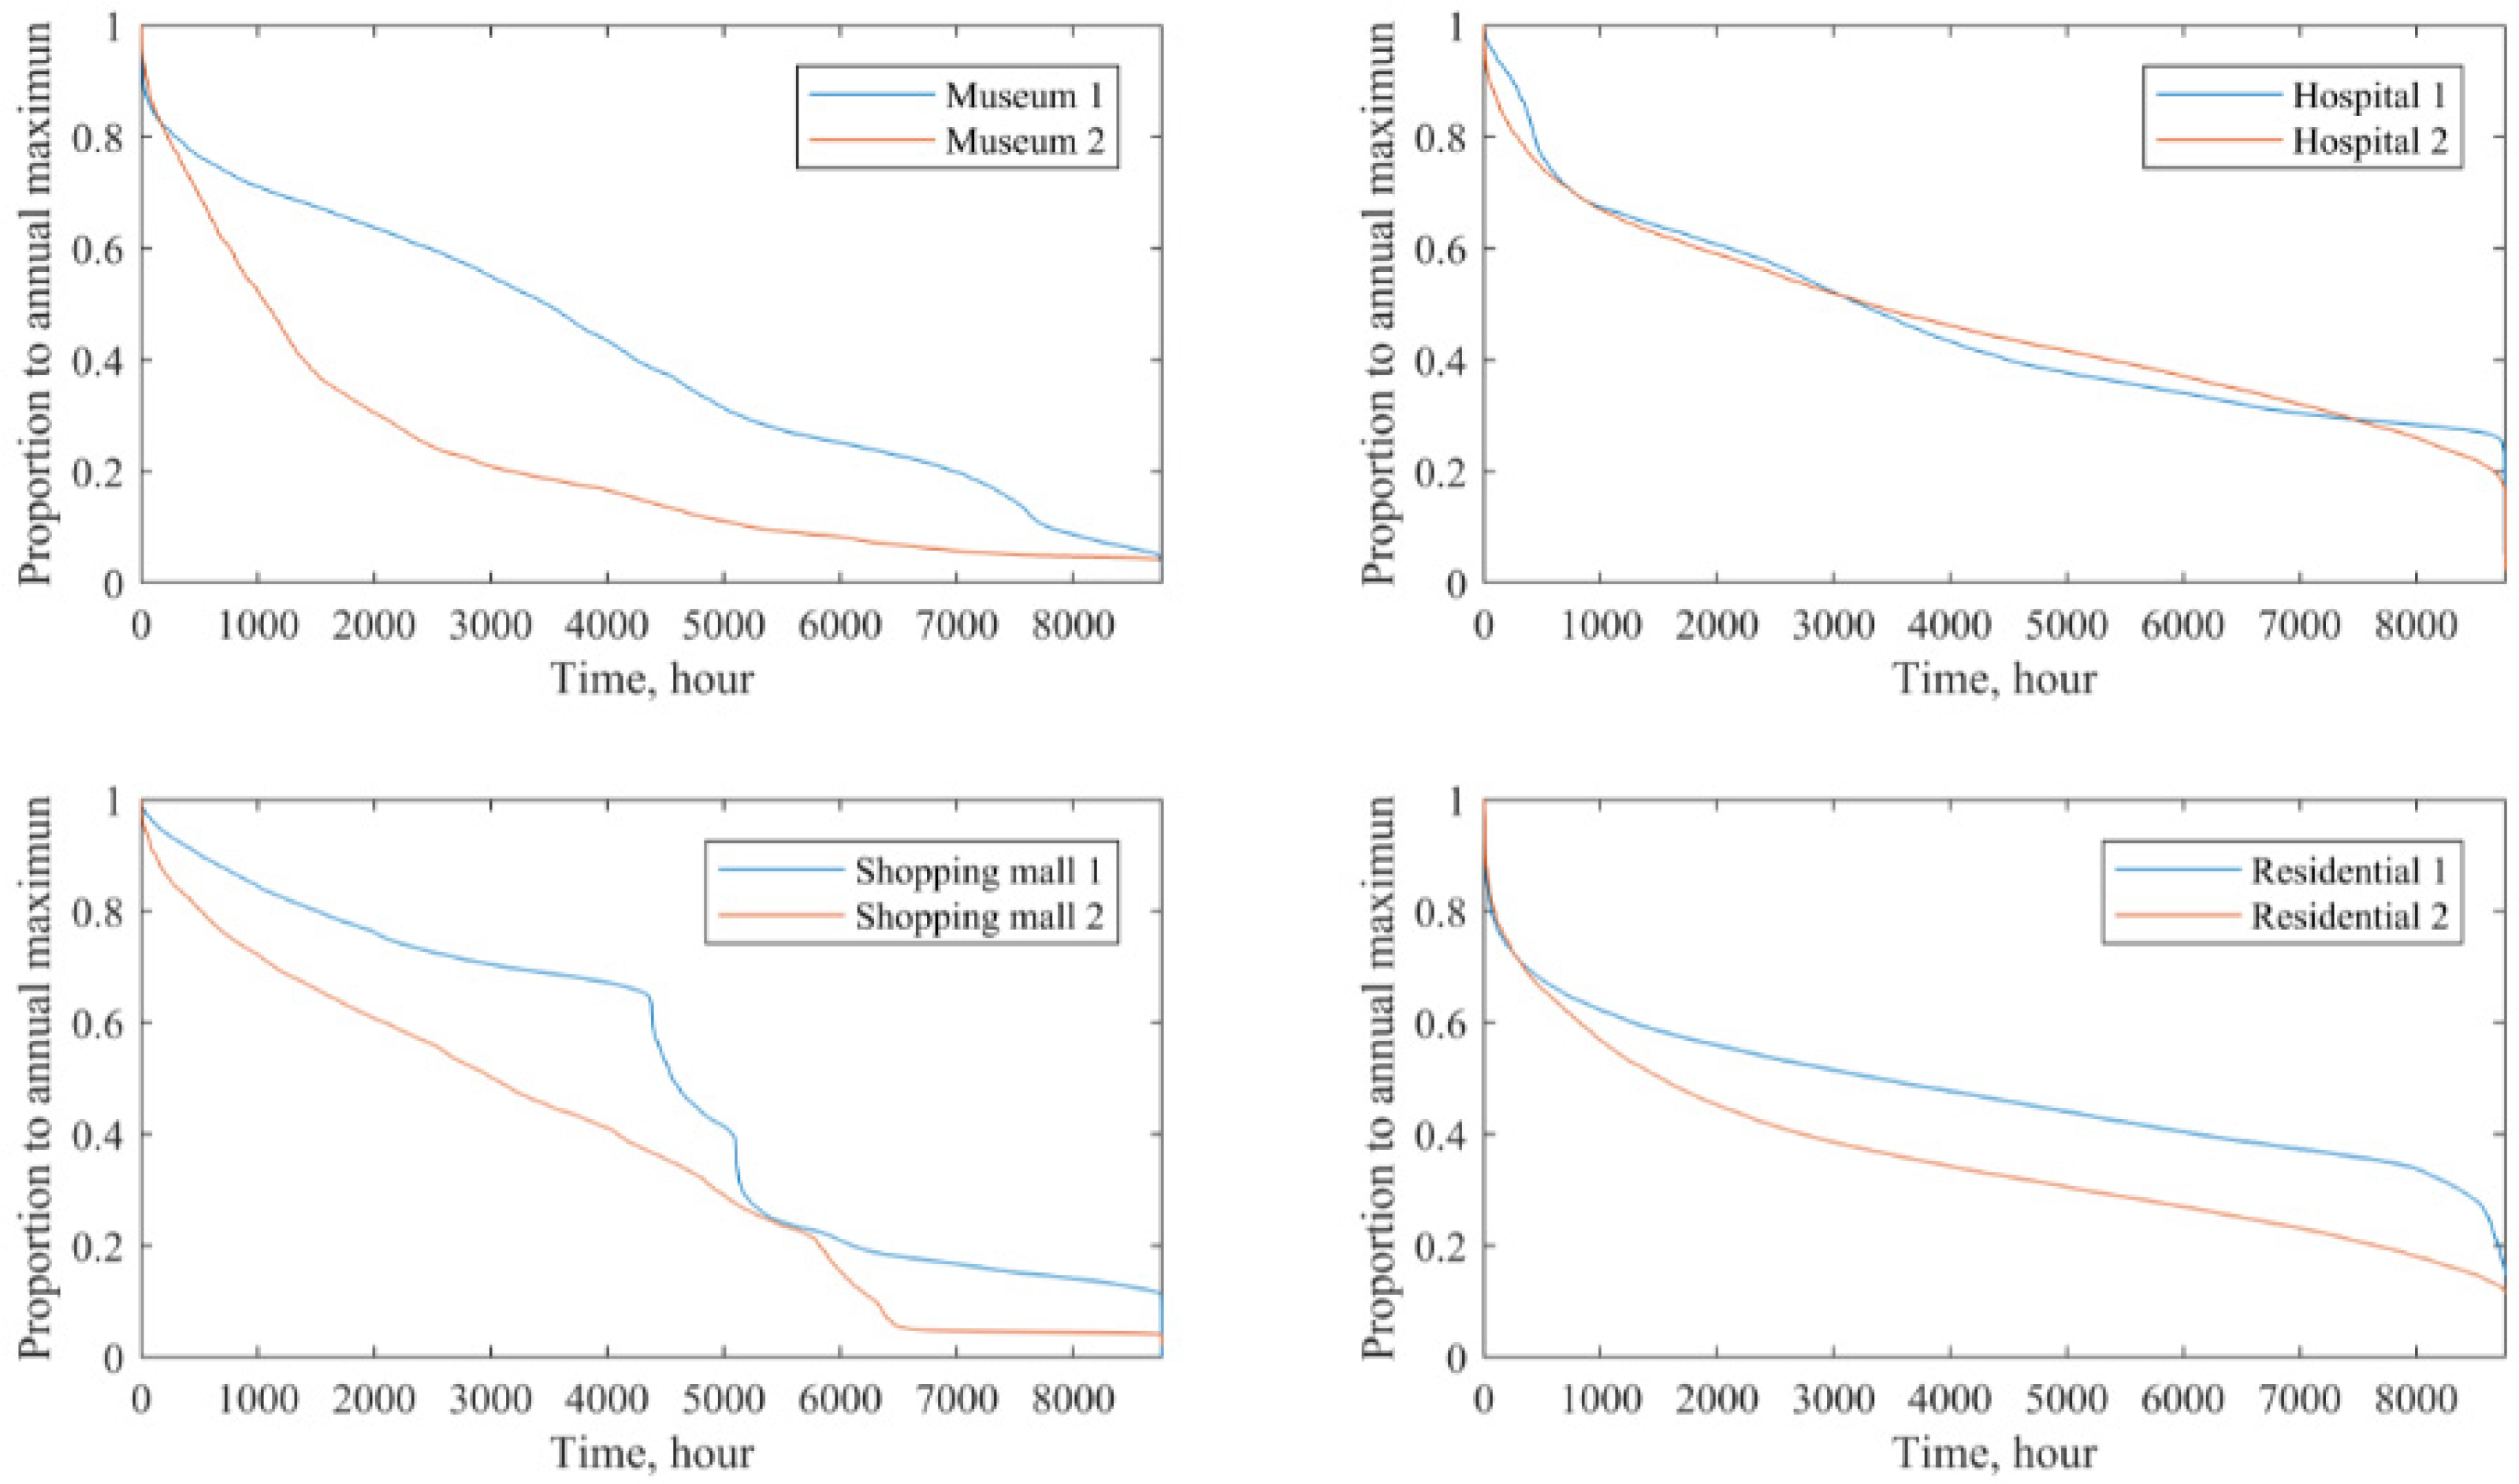
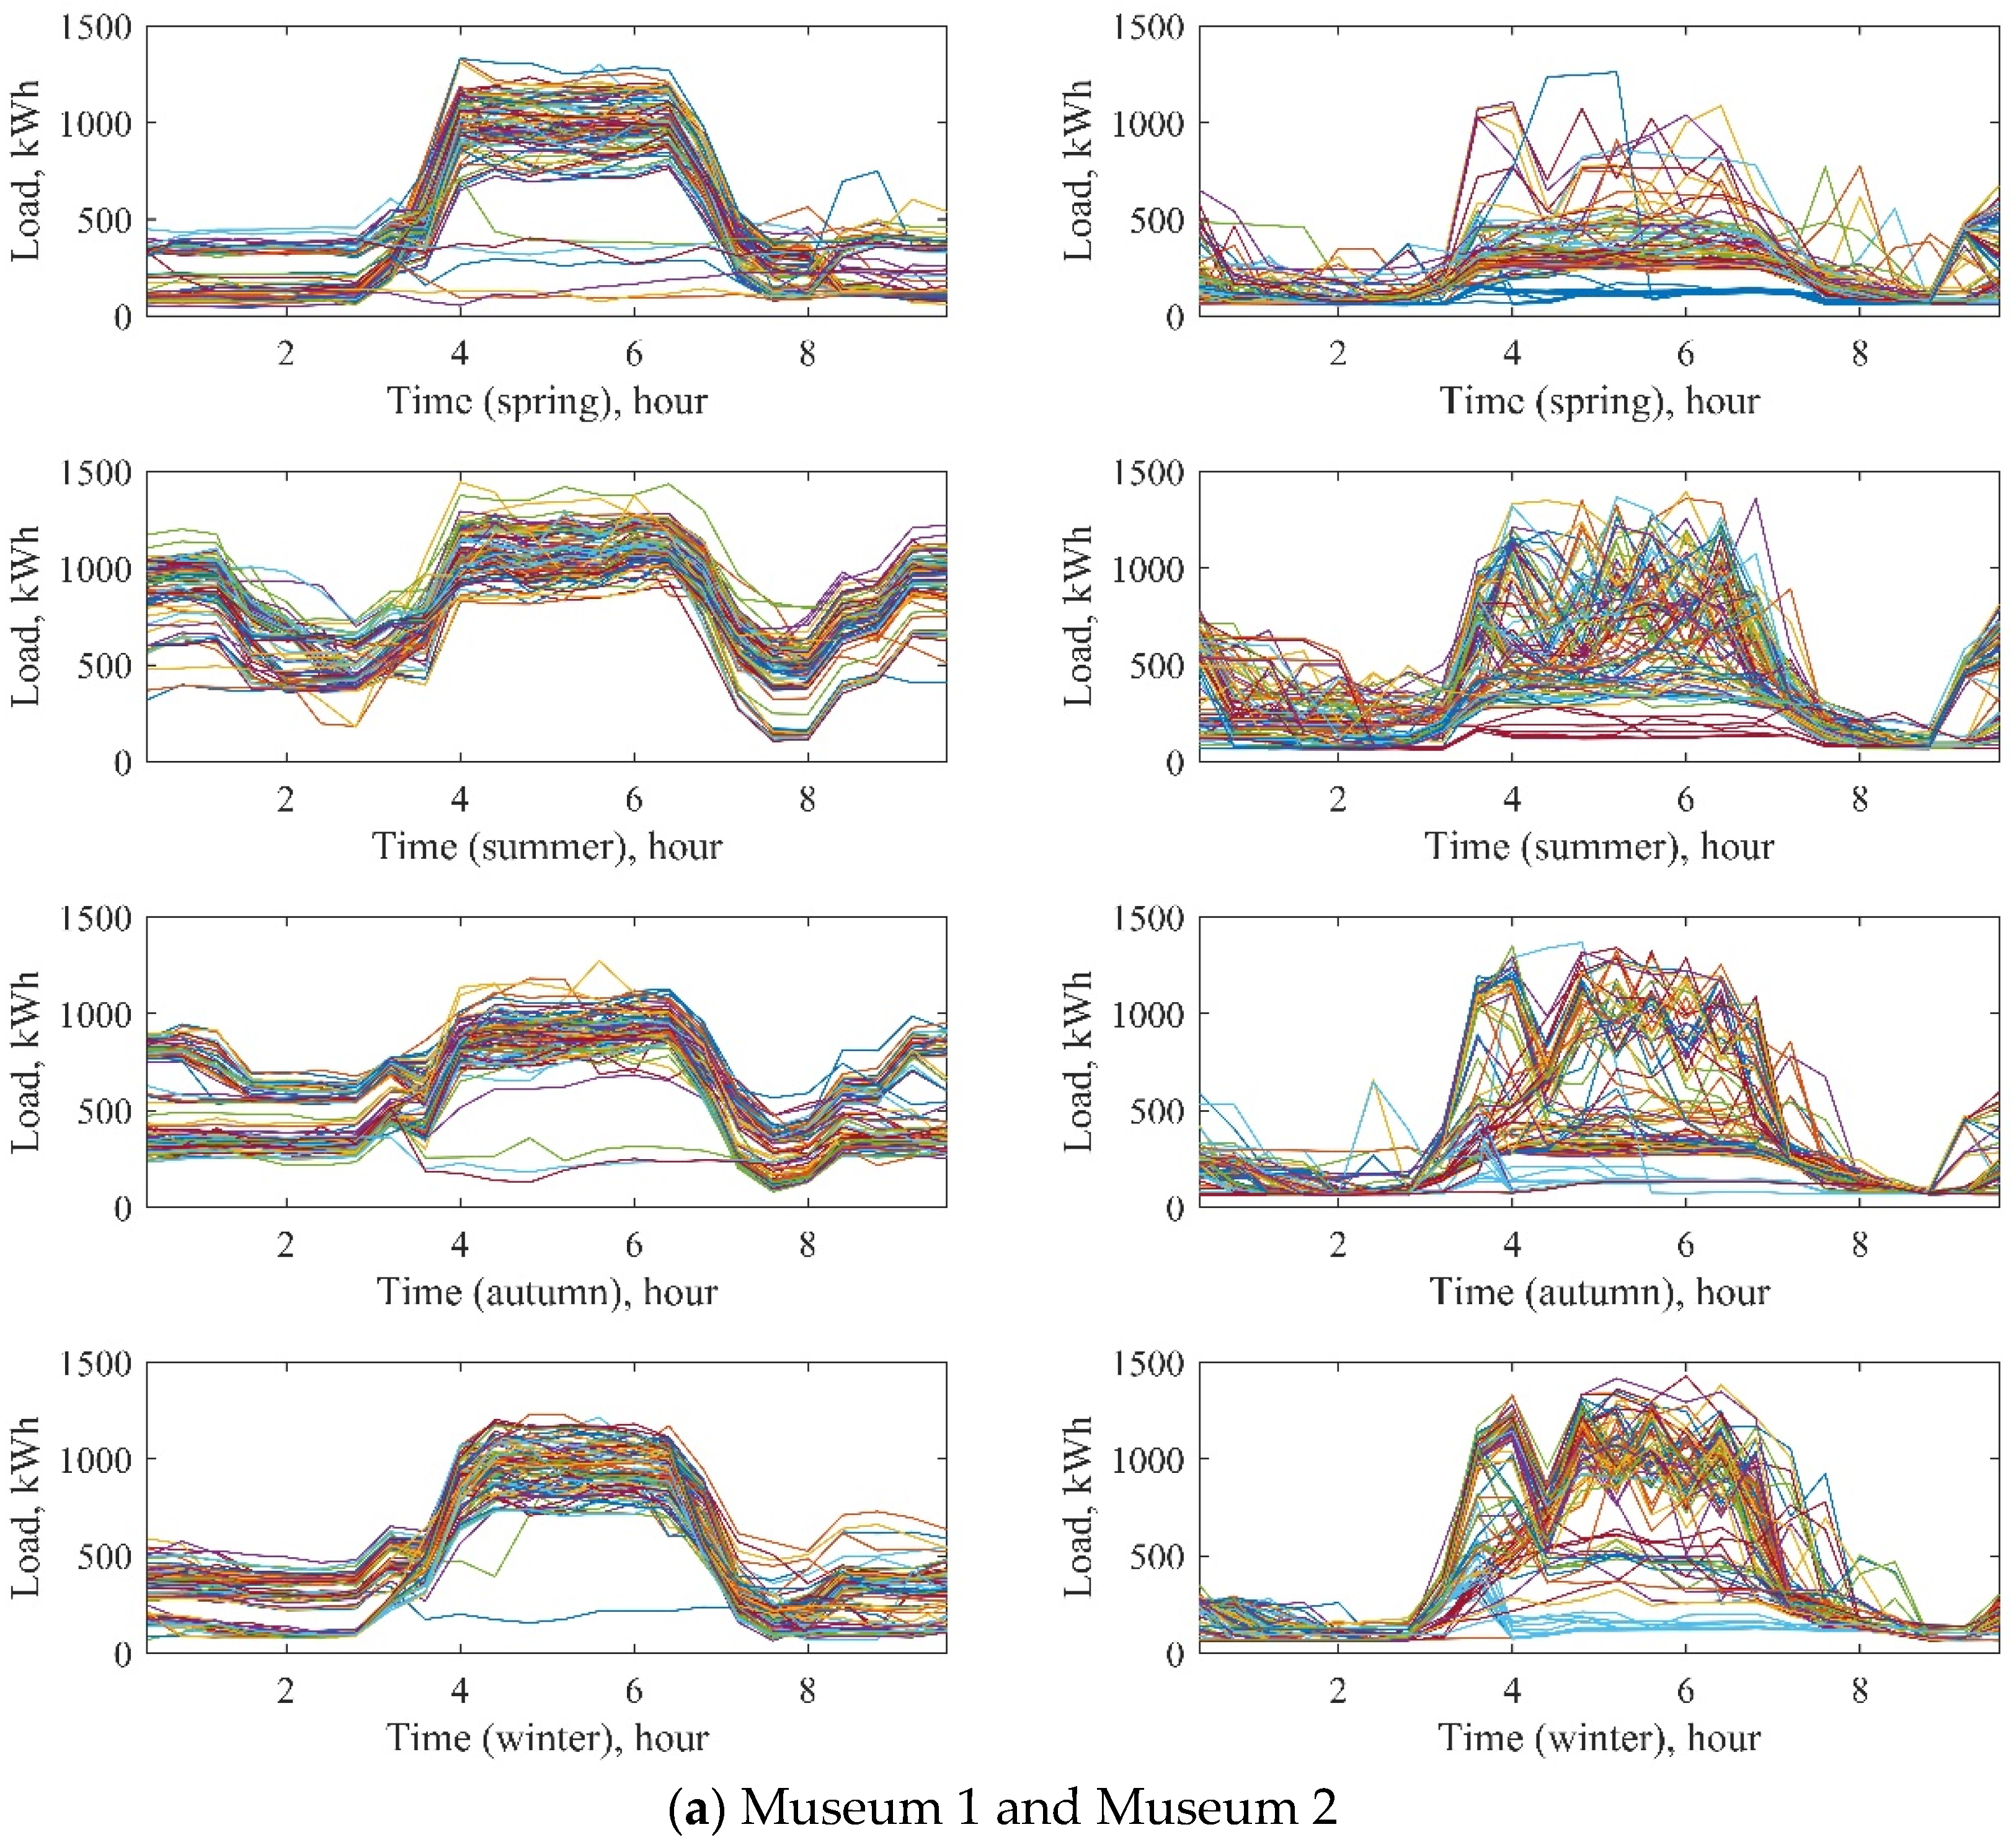
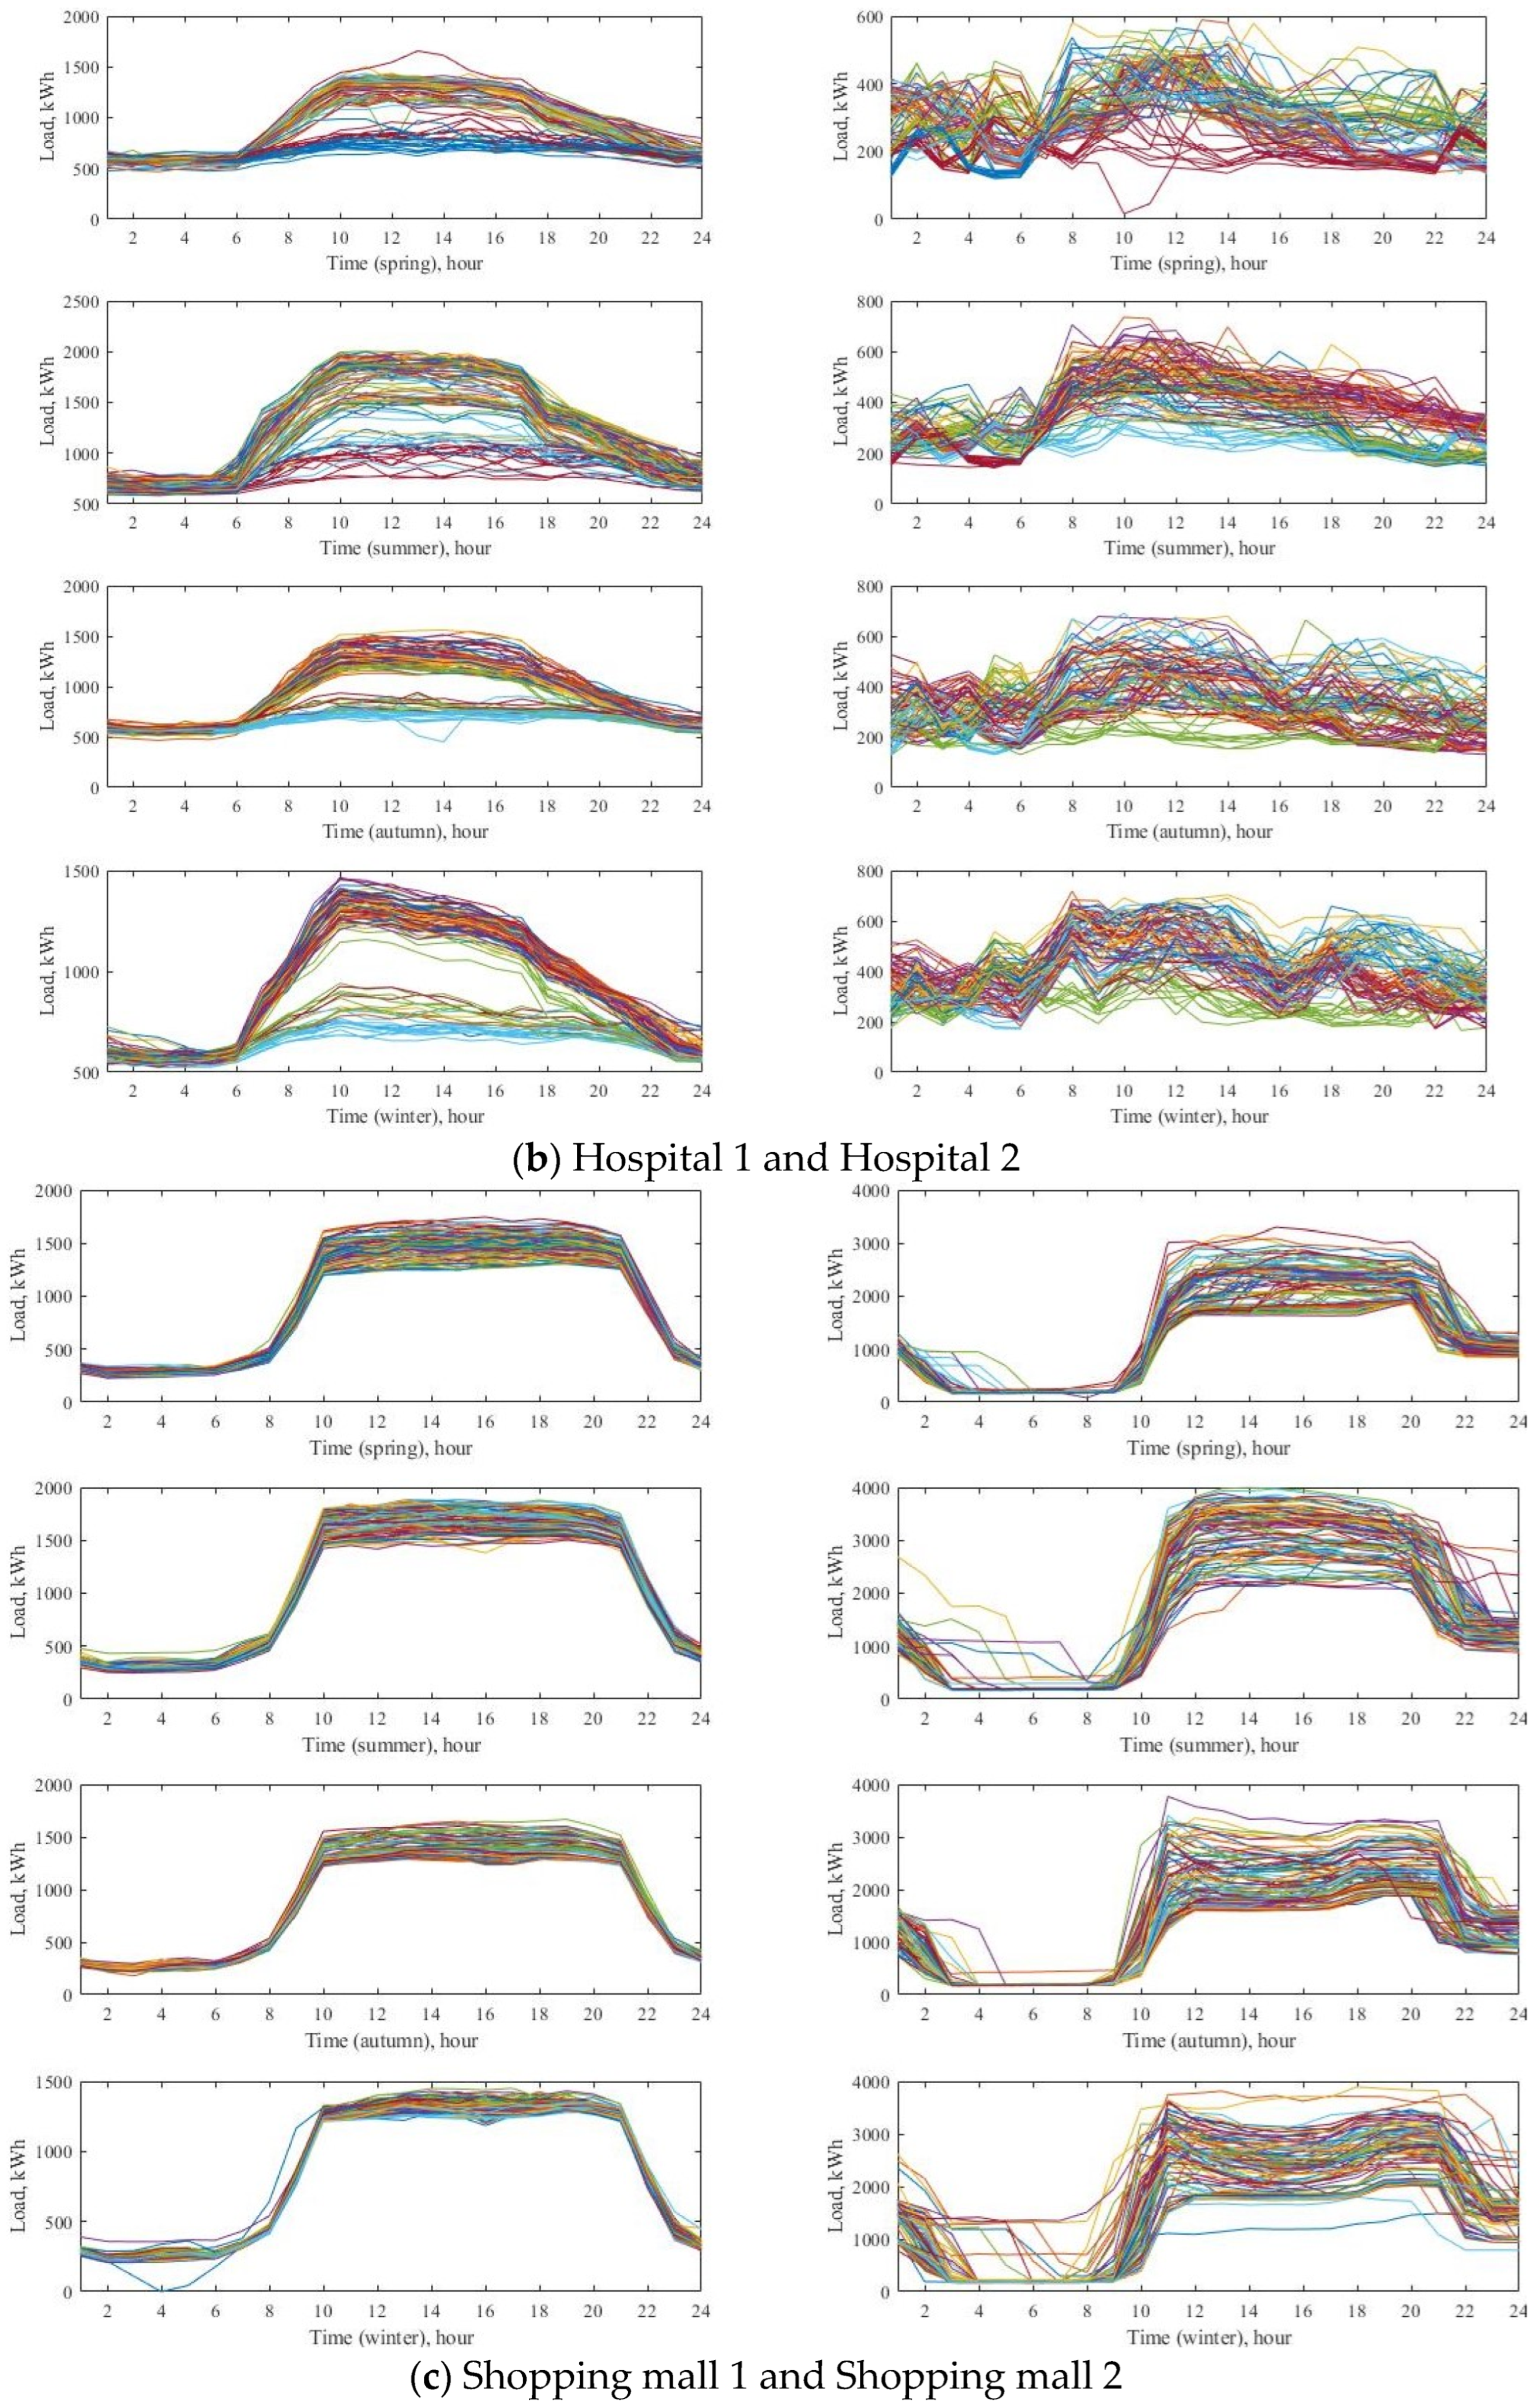
To further obtain the load characteristics of the research object buildings, the power loads of ten buildings are standardized to 0–1. Then, standardized loads are ranked from large to small, and the results are shown in Figure 3 and Appendix Figure A1. Sorting the loads from large to small facilitates displaying the peak valley gap and the distribution of the annual load demand more intuitively. In particular, the two hospital buildings have basically the same change rule, and the minimum load is still more than 20% of the peak load. The change rules of the two office buildings are also similar, with an obvious day–night peak valley gap. However, in the peak period of the two office buildings, obvious differences still exist. Combined with the typical daily load changes in four seasons shown in Figure 4, the analysis shows that one office building has an obvious trend pertaining to lunch breaks, while the other building does not. Similarly, the load variation characteristics of the remaining shopping malls, residences, and museums can also be obtained (Appendix Figure A2).

3.3. Cold and Heat Load

In contrast to the power load, because the ten buildings belong to the same area, the differences in the operating times of the building facilities better reflect the change characteristics than the differences in the change characteristics of the cooling and heating loads. Taking the office building as an example, the annual and typical daily cooling and heating load changes of the two buildings are shown in Appendix Figure A3 and Figure A4. Although the difference in the power load between the two office buildings is obvious, the changes in cooling and heating loads are basically the same. This is because lunch breaks do not affect the supply of cooling and heating loads. As the commuting time of the two office buildings is the same, their cooling and heating loads are also similar. Table 2 below presents an overview of the cooling and heating loads for the ten buildings. Buildings with more people, such as commerce, museum, and hospital buildings, generally have a higher cooling load demand. Hospitals and residential buildings have a higher heating load demand due to the nighttime load demand.
The load characteristic analysis obtained above is ultimately compared with the final research results to illustrate the adaptability of RDHES to different load types.

4. System Design and Optimization after the Introduction of Carbon Tax

4.1. Model Parameter Setting

Japan has conducted a pilot promotion of a carbon tax policy, and the current carbon tax price is 2–5 Yen/kg-CO2 [40]. According to the prediction of the International Energy Agency (IEA), Japan’s carbon tax will rise to 15 Yen/kg-CO2 in the next 20 years [40]. Therefore, in this study, the change range of the carbon tax was set to 0–15 Yen/kg-CO2.
Based on the carbon tax surveys of various countries, the carbon tax of most countries is 2–6 Yen/kg-CO2 [41], and the carbon tax of Sweden is the highest in the world, reaching 18.4 Yen/kg-CO2 [42]. Therefore, the carbon tax change set in this study is within a reasonable range and can be realized in the future.
In addition, the current carbon emission coefficient of the urban power grid in the target area is 0.463 kg/kWh [43]. The carbon emission coefficient of urban gas is 2.21 kg/m3 [44]. The electricity and gas prices during the study are shown in Table 3 below.
According to Japan’s hydrogen energy development strategy and the industry statistics report of related equipment, the performance parameters and cost settings are shown in Table 4 below. The equipment cost is the annual average equipment investment cost calculated by the total cost, service life, residual value, and the basic rate of return on investment. Although the current average annual cost of an FC is four times that of an ICE, according to Japan’s hydrogen and fuel cell development strategy, substantial improvements in the service life of FCs are anticipated in the next decade. Furthermore, large-scale production, catalyst R&D, and upgrades are also expected to lower the cost of FC equipment [3]. Finally, predictions indicate that, in the next 10–15 years, the cost of FCs will be close to the level of ICEs.

4.2. Optimization Results and Analysis

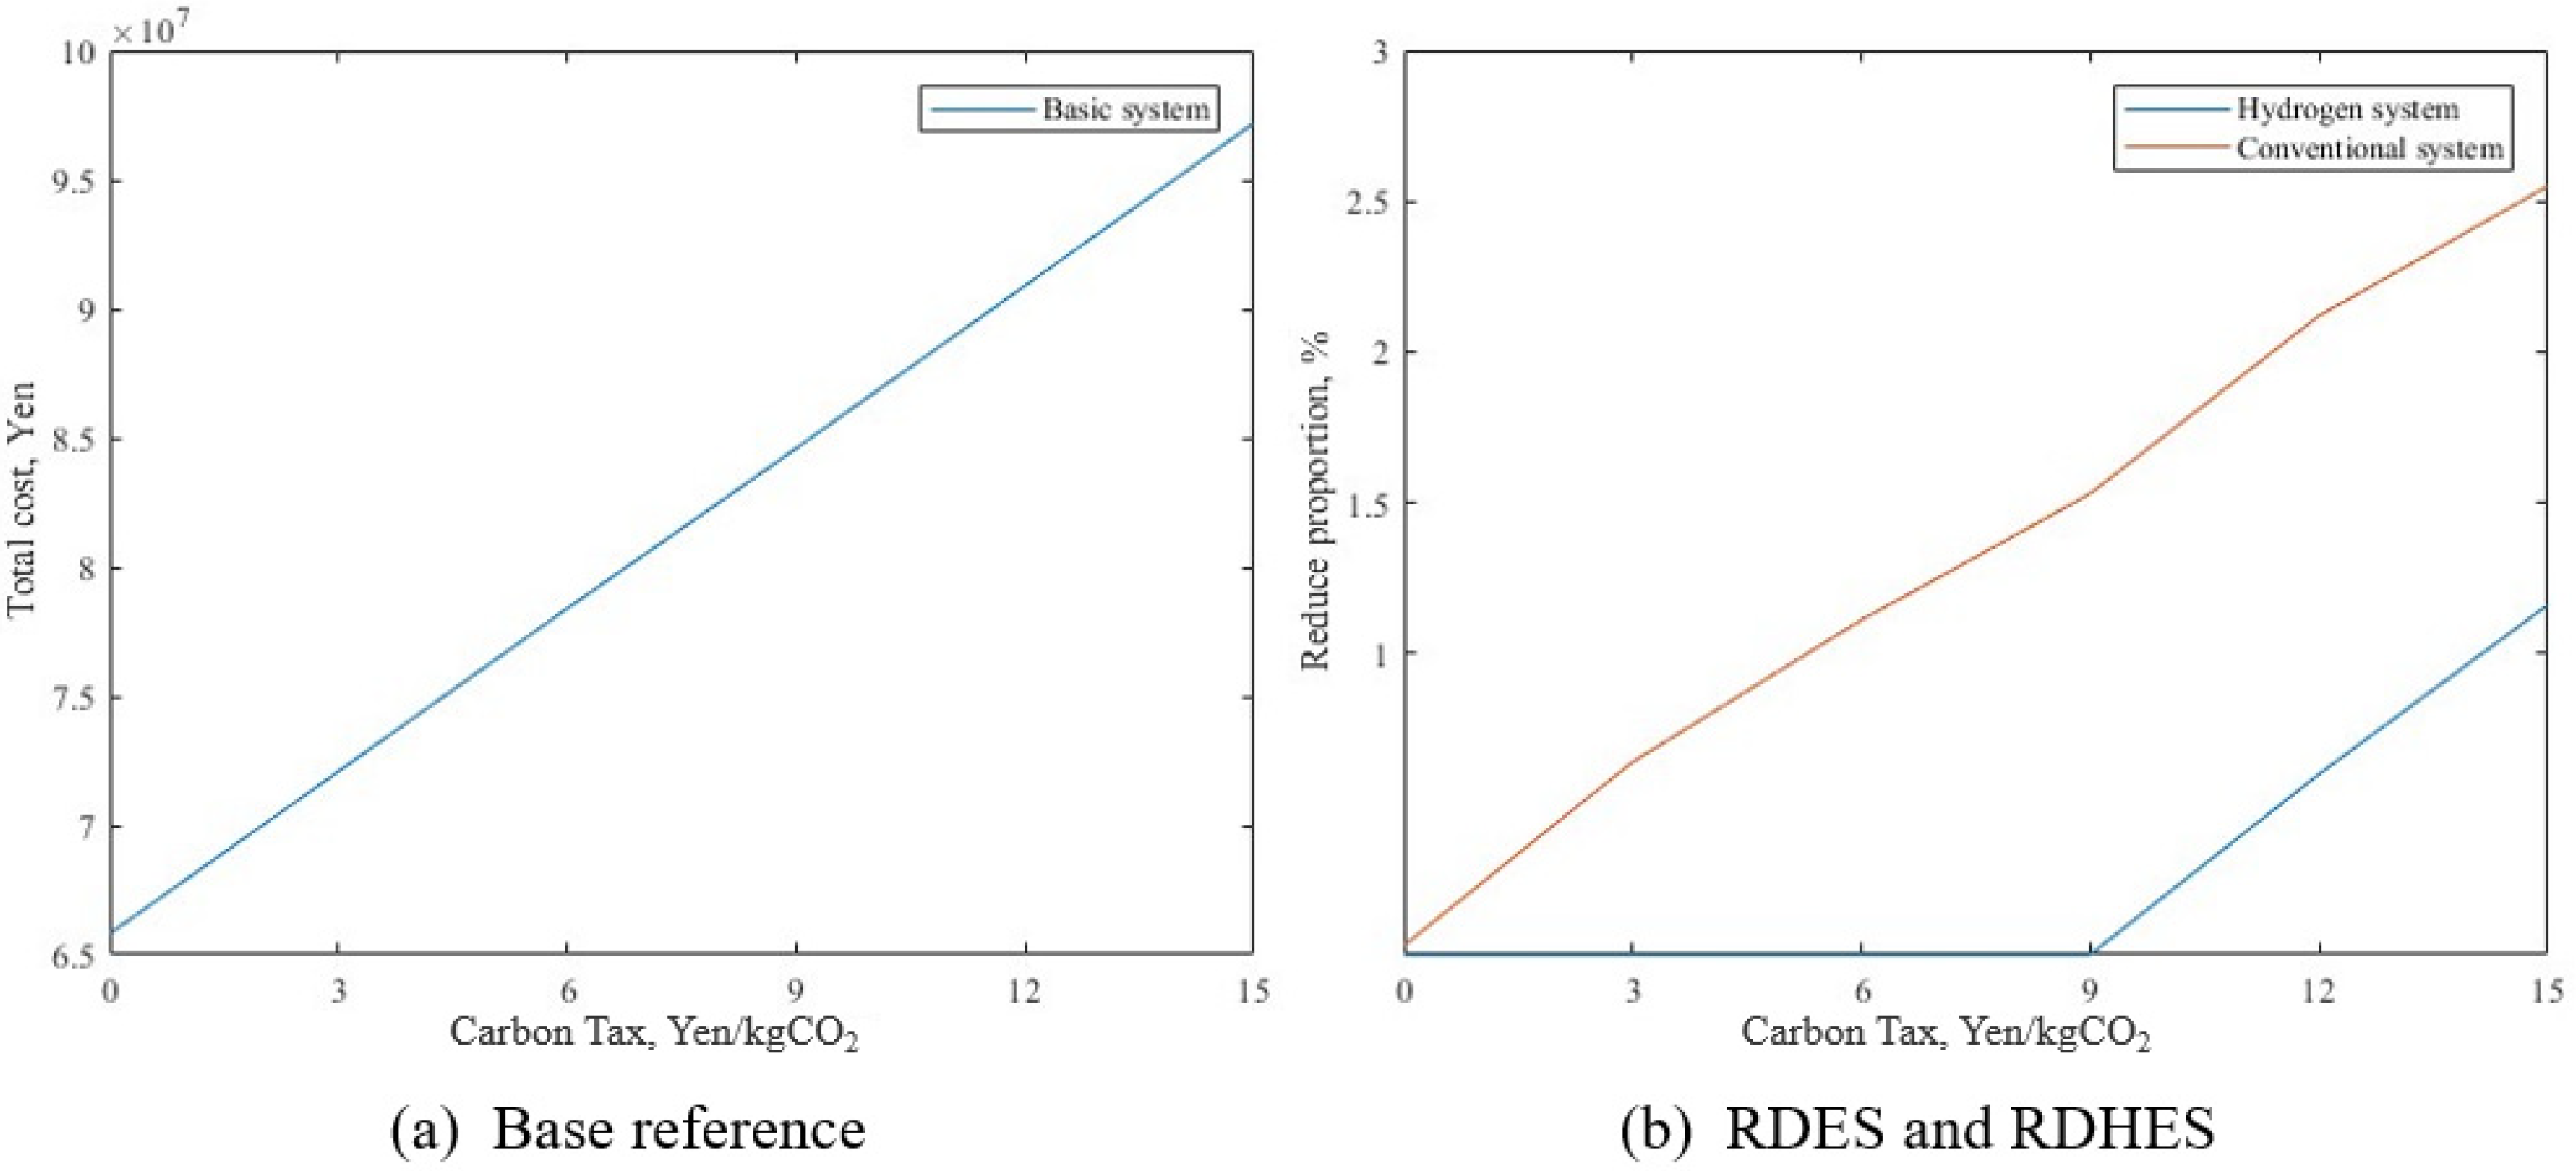
After setting the parameters, the optimal configuration of the system can be obtained by solving the GA optimization. To specifically highlight the comparison between equipment, the core element needs to be compared by removing two groups of equipment (ICE and FC, battery and HS), and a basic system consisting of the HP, PV, and CHS is obtained. Taking Museum 1 as an example, the total annual energy cost of this basic system within the carbon tax range of 0–15 Yen/kg-CO2 is shown in Figure 5a. Then, the energy cost reduction of RDHES and RDES is calculated for different carbon taxes, as shown in Figure 5b. The optimization results show that RDHES will generate benefits only when the carbon tax reaches 12 Yen/kg-CO2 due to the high FC cost. However, when the carbon tax reaches 15 Yen/kg-CO2 at the research boundary, compared with the basic system, the conventional RDES system can generate about 2.5% economic cost reduction, while RDHES can only generate 1% economic cost reduction. This shows that the system revenue of RDES is still higher than that of RDHES at this time. After expanding the scope of carbon tax changes, the findings indicate that, when the carbon tax reaches 21 Yen/kg-CO2, the benefits of the two systems can be balanced.
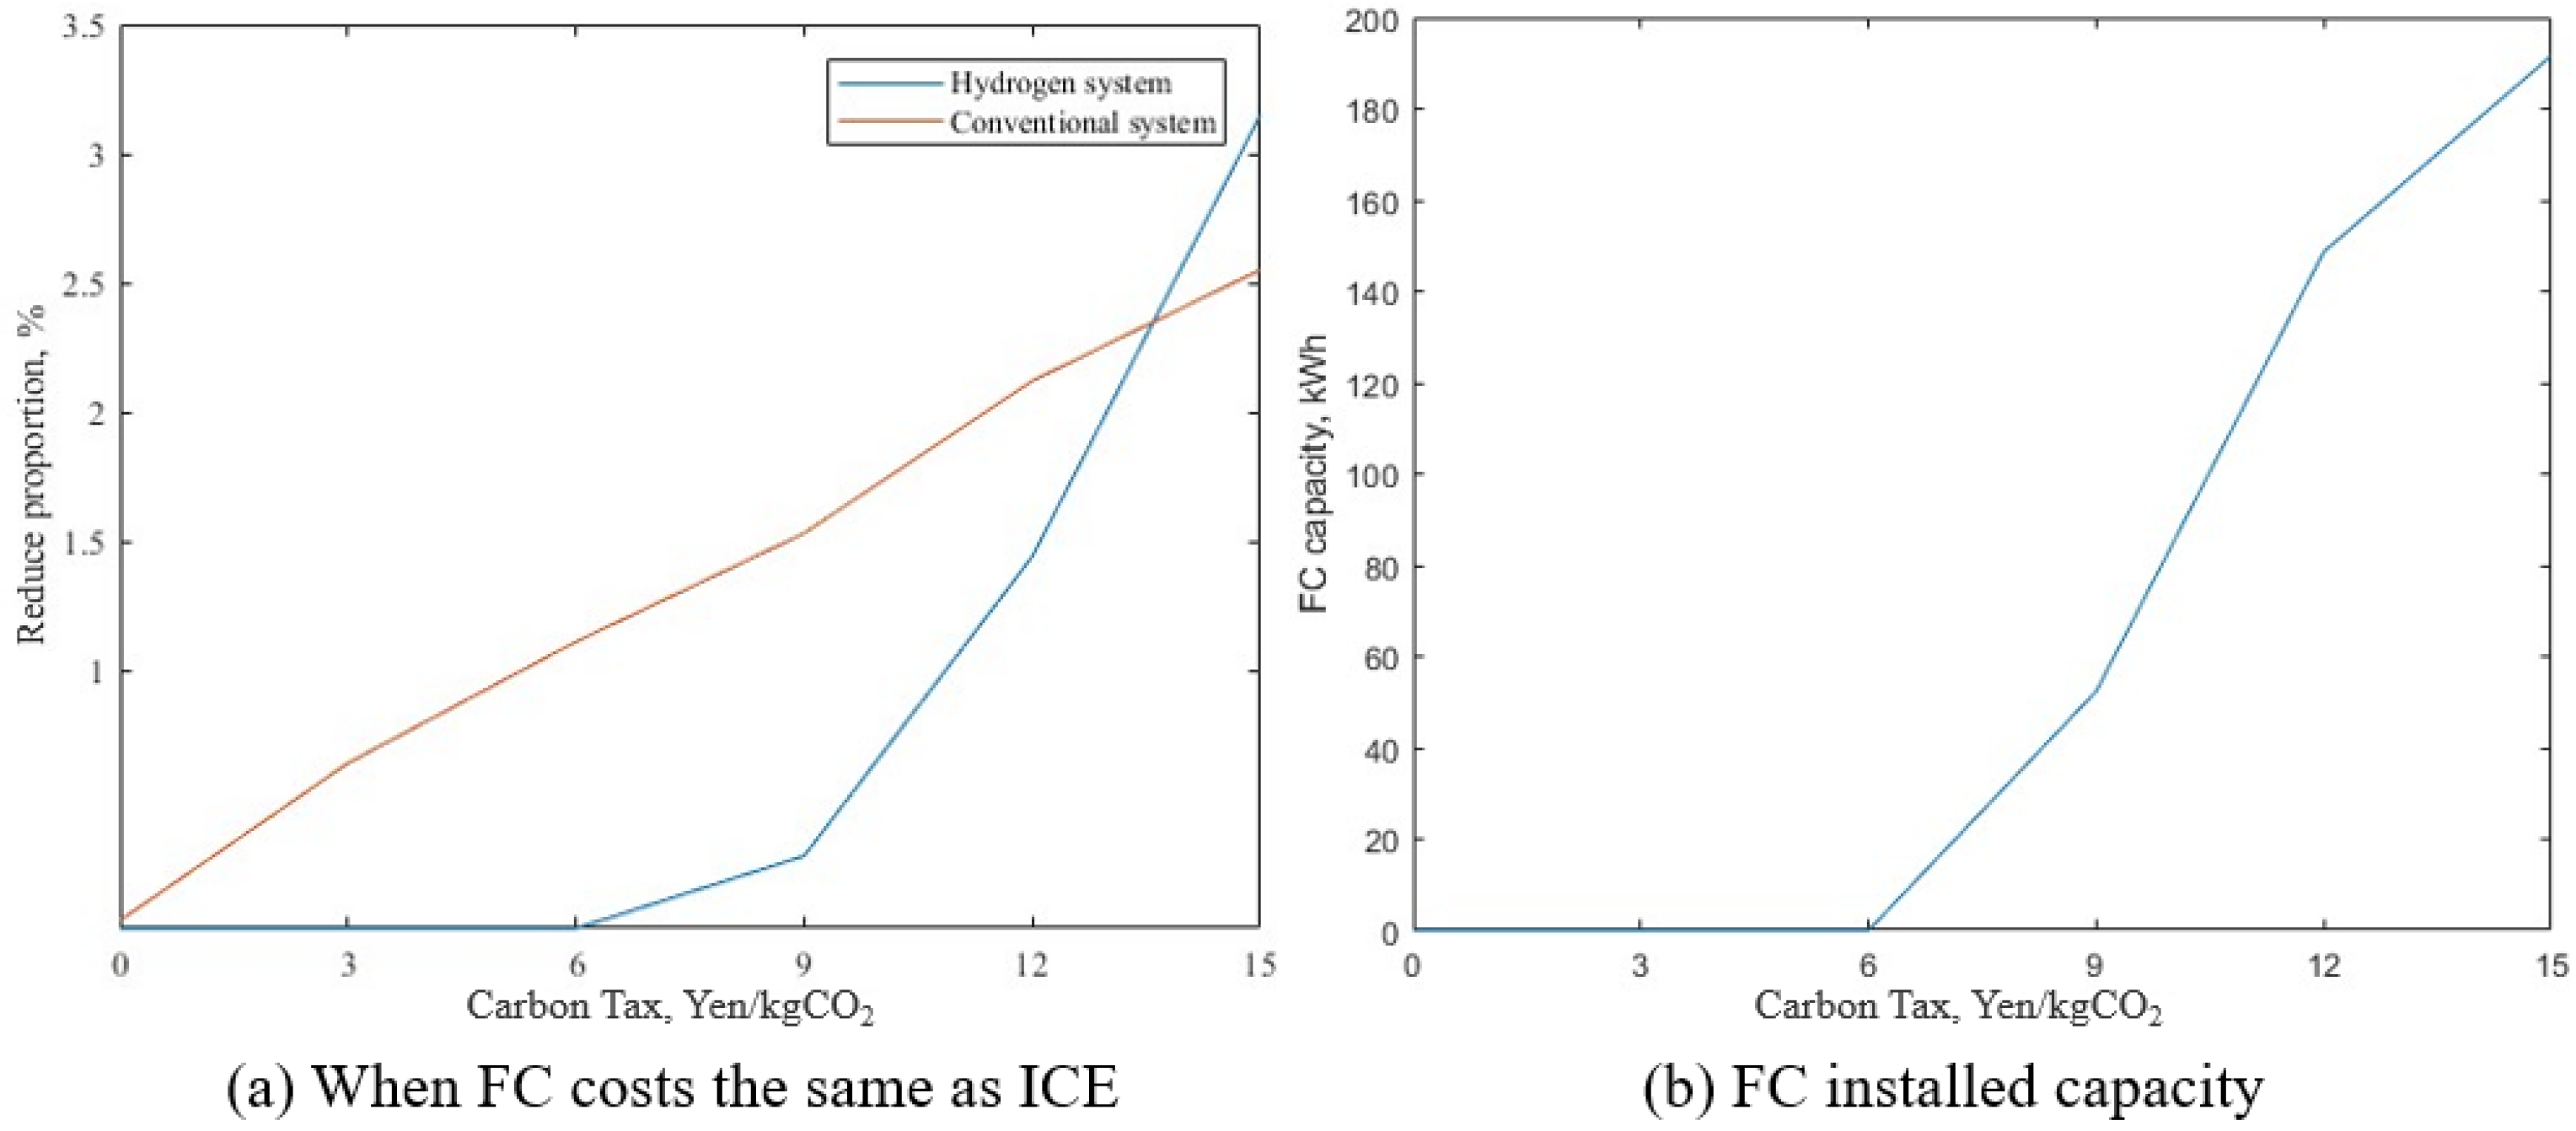
Based on Japan’s hydrogen development strategy and the fuel cell industry analysis of the US Department of Energy, the cost of FCs will decline to a level close to ICEs in the future [48]. When the cost of FCs has been adjusted accordingly, the results of the system energy cost reduction under different carbon taxes are shown in Figure 6a. The FC capacity change at this time is shown in Figure 6b. The installed capacity of FC shows an accelerating trend with the carbon tax. When the carbon tax varies between 12 and 15 Yen/kg-CO2, the economic cost reduction effect of RDHES will catch up with and exceed the RDES. At this time, compared with RDES, RDHES began to produce economic advantages.
The above results show that, based on the condition that the current electricity carbon emission coefficient is still high, although the gas CHP system will also generate additional benefits due to the carbon tax, the hydrogen energy system is more dependent on the carbon tax. In the next section, the impact of energy costs, equipment costs, and energy carbon emissions on the research results is discussed. In addition, the results of different types of buildings are also compared.

5. Trend Analysis and Case Comparison

5.1. Sensitivity Analysis

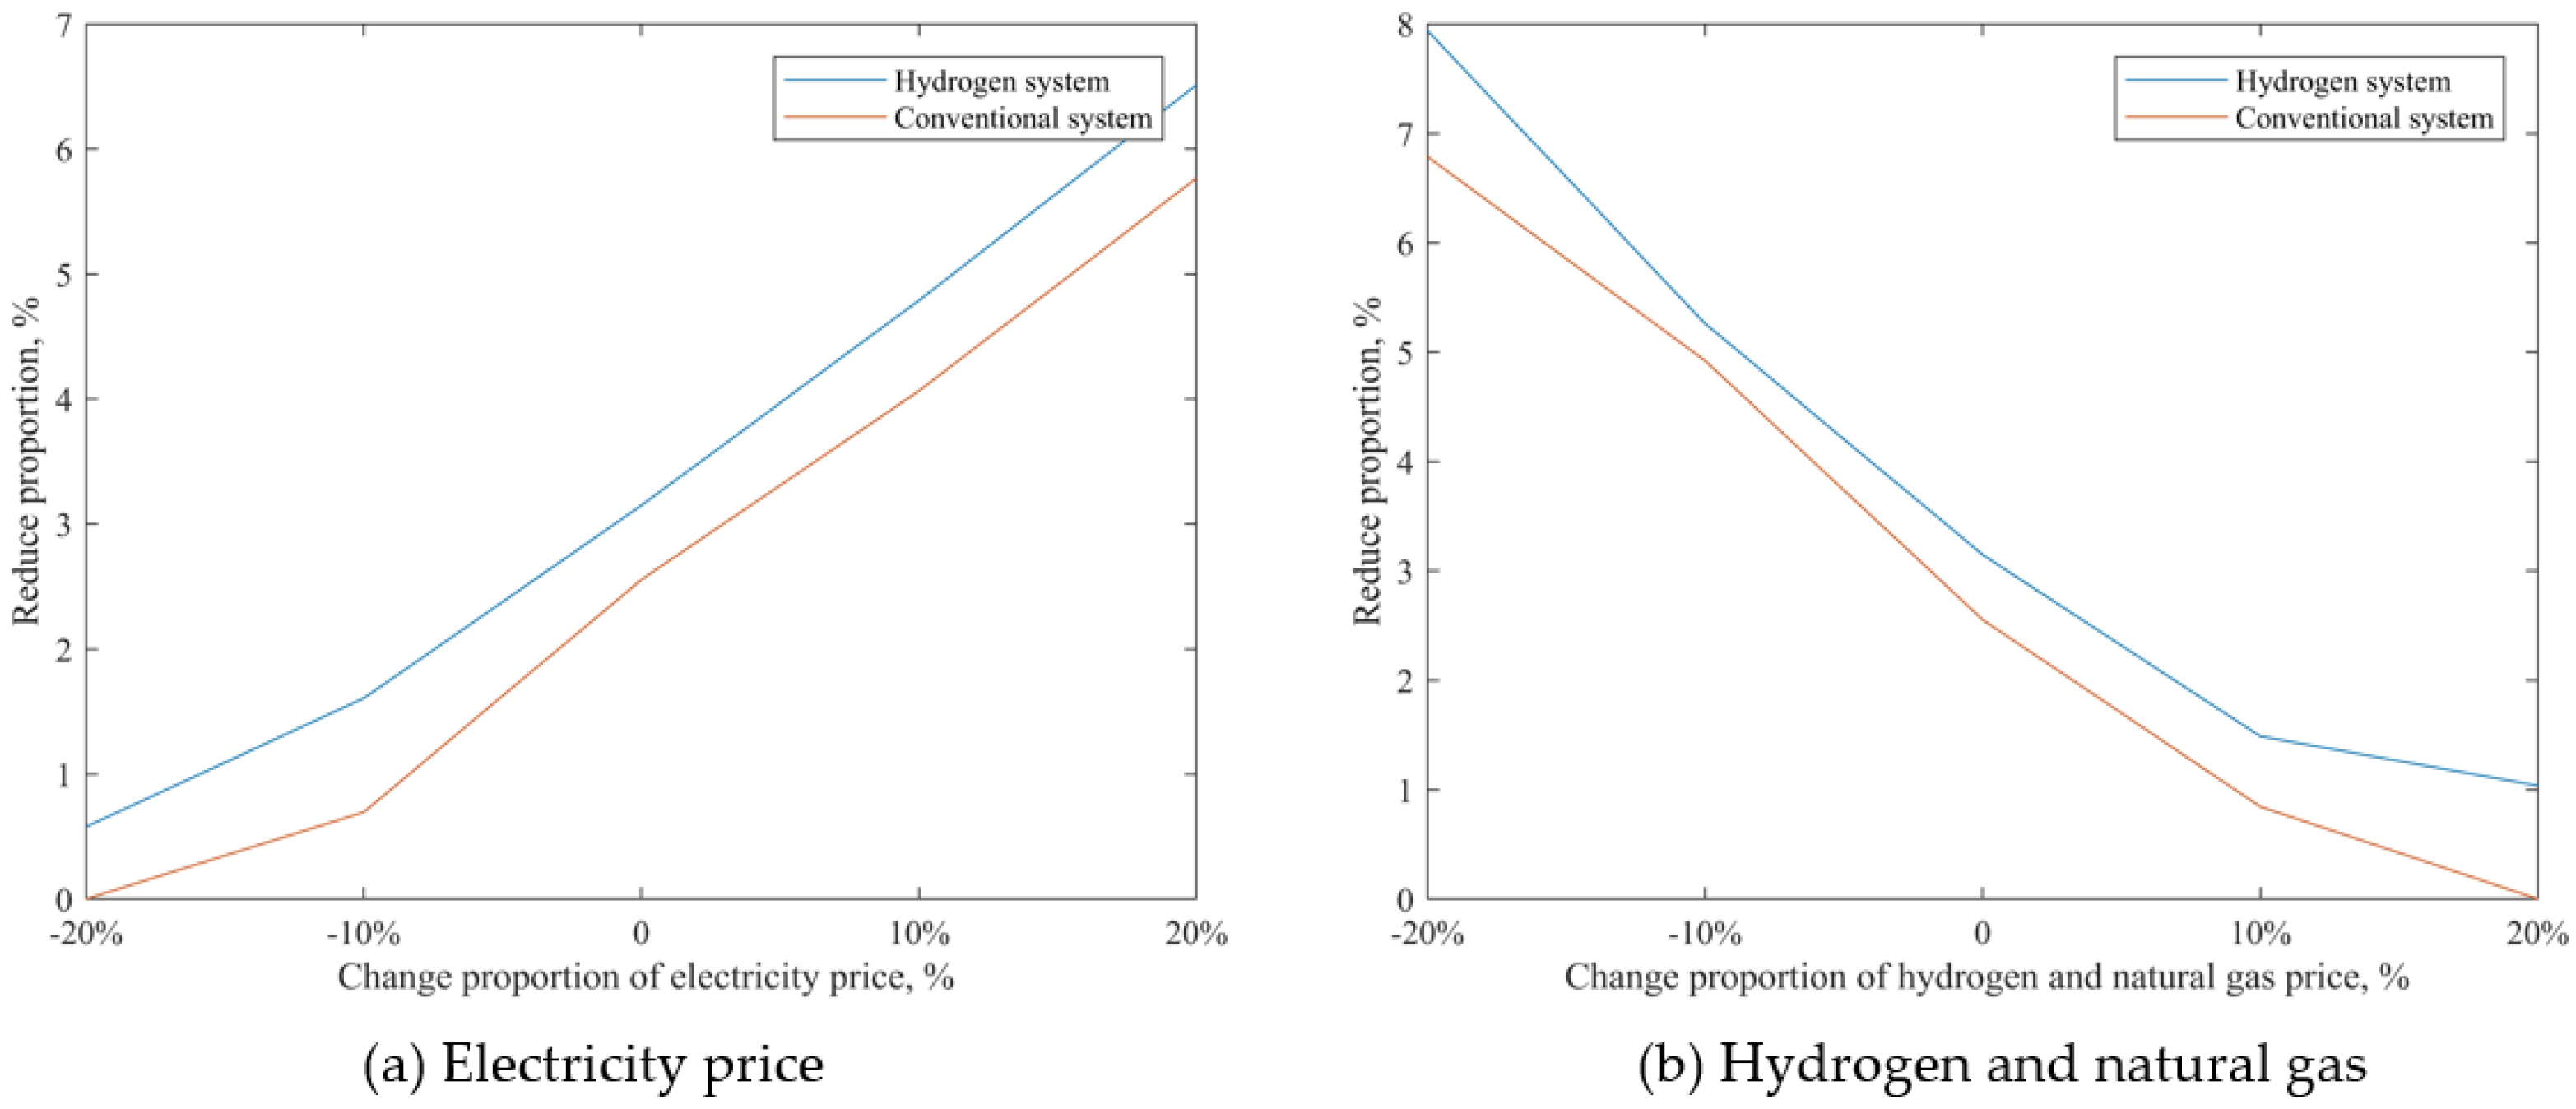
The energy price used in this study is the price of the energy company in the study area. For different regions and countries, energy prices fluctuate. Therefore, based on the above research results, when the carbon tax is 15 Yen/kg-CO2, this part of the research will conduct sensitivity analysis on the prices of the three types of energy involved: electricity, natural gas, and hydrogen. The variation range of energy price is −20–20%, and the results are shown in Figure 7 below.
Figure 7a shows the economic benefits of RDHES and RDES when the electricity price fluctuates. With the decrease in electricity prices, ICE using natural gas and FC using hydrogen will gradually lose their economic benefits. When the electricity price drops by 20%, ICE cannot continue to generate economic benefits, which makes the system configuration of RDES gradually tend to the basic system configuration of HP and PV. At this time, although the economic benefits of RDHES have declined seriously, it can still generate additional economic benefits.
Figure 7b shows the economic benefits of RDHES and RDES when the prices of hydrogen and natural gas fluctuate. Compared with natural gas, the reduction in hydrogen price can produce greater economic benefits. At the same time, when the price of natural gas rises by 20%, RDES loses its economic advantage. However, when the hydrogen price rises by 20%, RDHES still has economic benefits.
It can be seen from the comparison in Figure 7 that RDHES is better than RDES in the anti-risk ability of energy price fluctuations. Judging from the current energy development trend, the price of fossil energy will continue to rise, which will bring about an increase in electricity prices. The price of hydrogen will gradually decrease with the maturity of the technology. Therefore, RDHES will generate greater economic benefits in the future.

5.2. Trend Analysis

5.2.1. FC System Price

The previous study reduced the cost of the FC to the same level as that of the ICE. Figure 8 shows the impact of FC cost reduction on the economic benefits of the two systems when the carbon tax is at 15 Yen/kg-CO2. When the average annual cost of FC is reduced to 50,000 Yen, which is 1.5 times that of ICE and RDHES, RDES achieves the same economic benefits. This cost is also close to the goal of reducing the cost of FCs in the next decade [48].

5.2.2. CO2 Emission from Electricity and Natural Gas

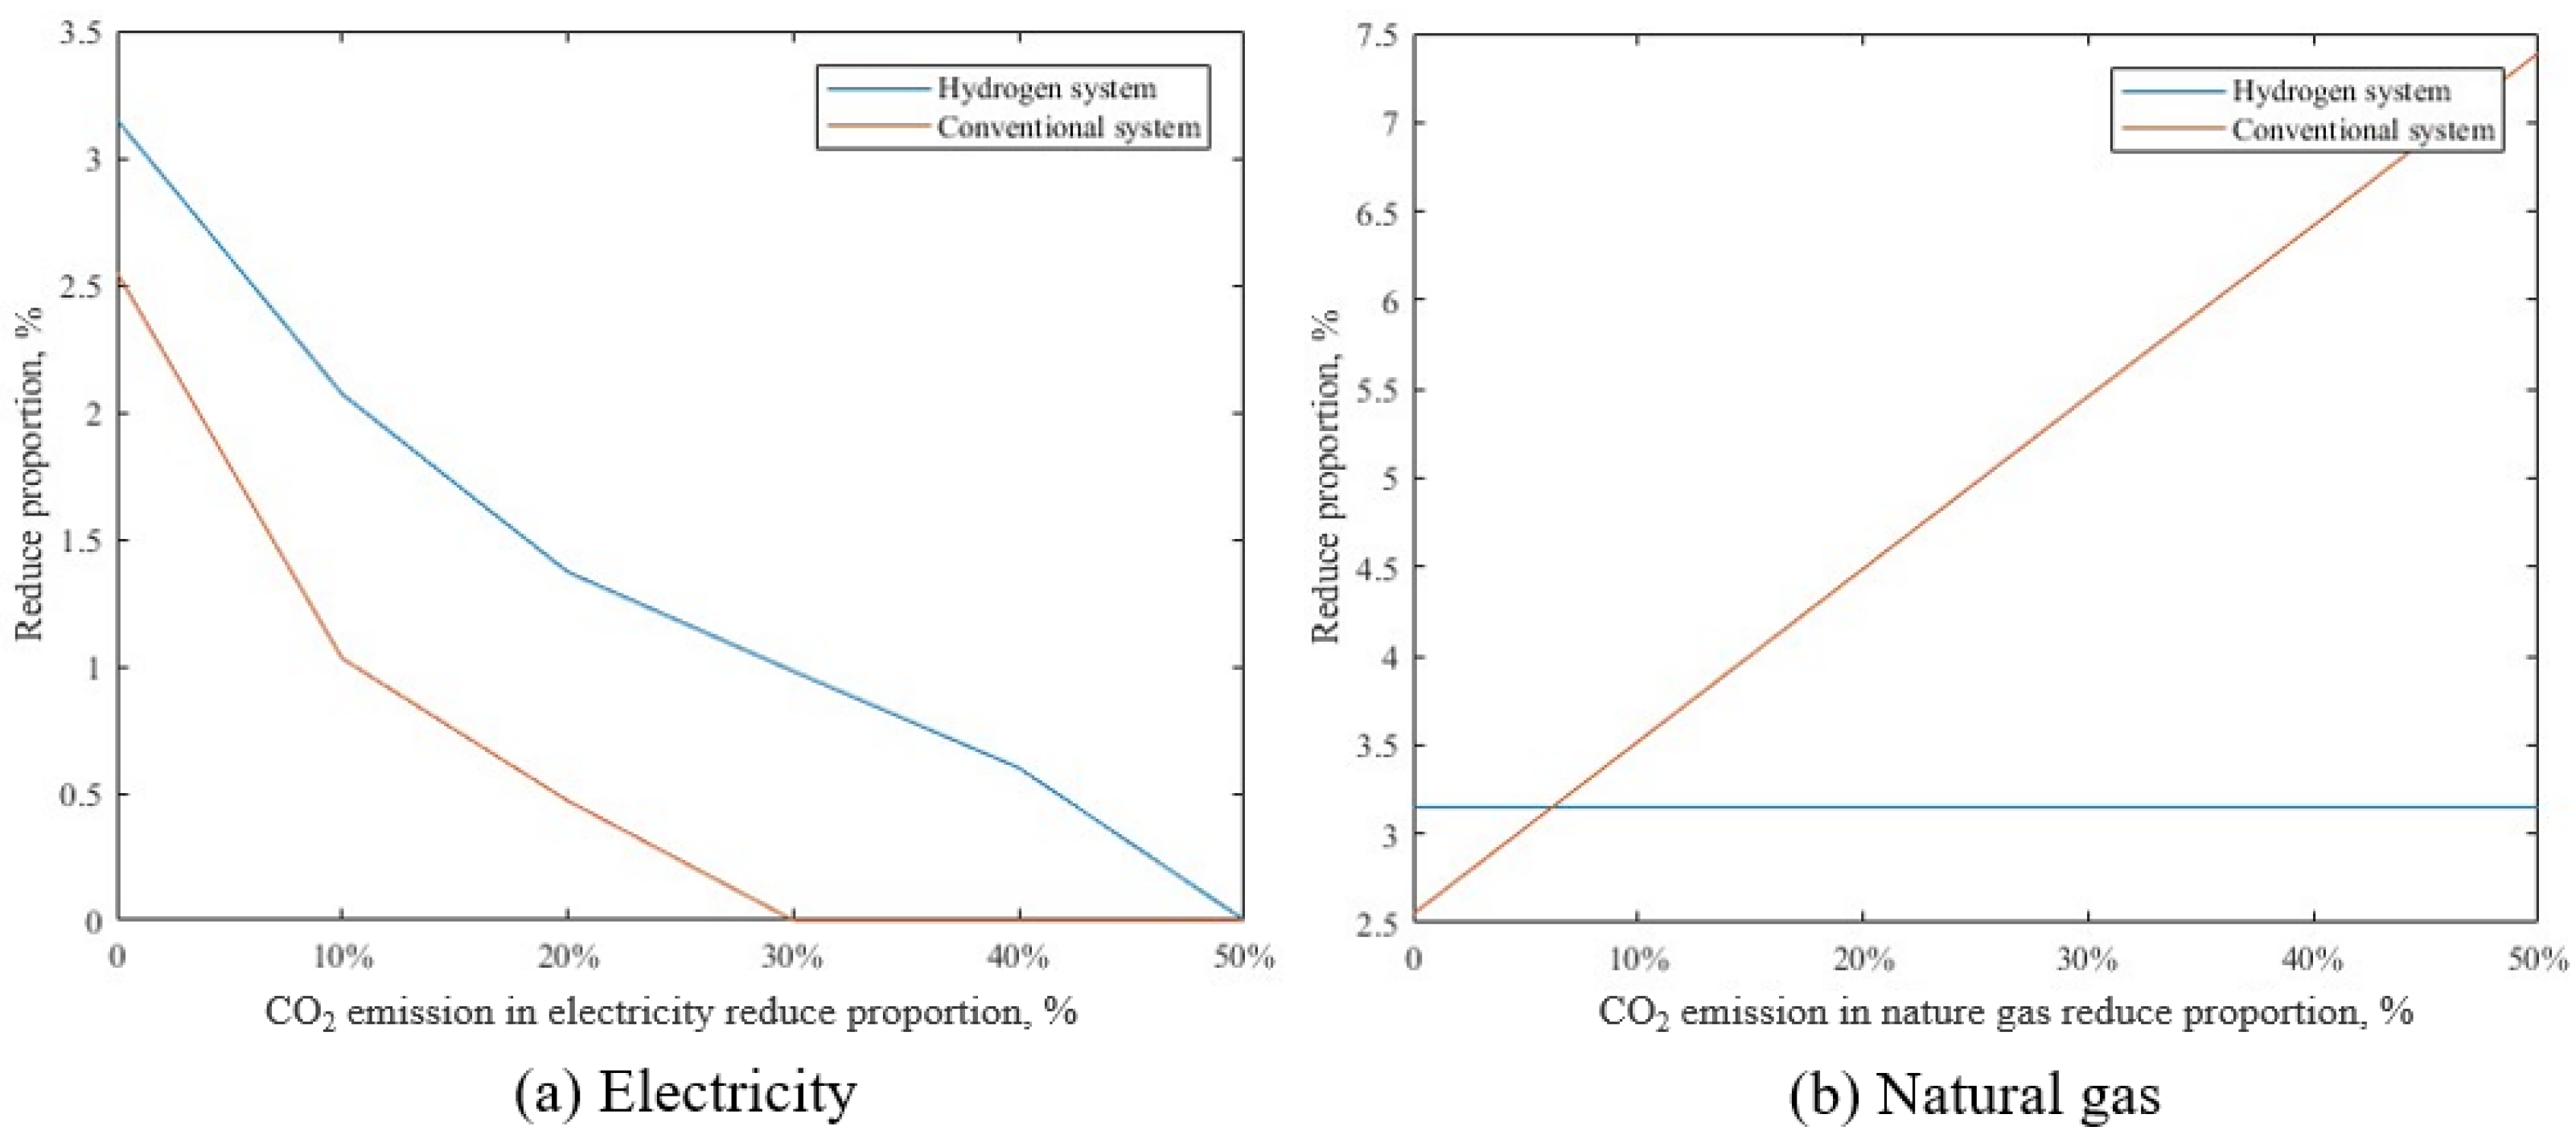
The development of hydrogen energy can accelerate the proportion of renewable energy in power systems, thereby reducing the carbon emission coefficient of electric power in the urban power grid. At the same time, the hydrogen blending technology of natural gas can also reduce the carbon emission coefficient of urban natural gas. As shown in Figure 9, when the carbon tax is 15 Yen/kg-CO2, the benefits of RDHESs and RDESs are shown after the carbon emissions of electricity and natural gas are reduced. When the carbon emissions of electric power are reduced by 30%, the gas equipment no longer generates benefits, while the positive benefits of the hydrogen energy system continue until the carbon emissions of electric power are reduced by 50%. Considering the time course of carbon emission reduction in the power system, the 20% gap indicates that the economic advantage of RDHES on the demand side will be 5–10 years longer than that of RDES. From the perspective of reducing carbon emissions from natural gas, the promotion of hydrogen blending technology of natural gas will have a negative effect on RDHES, and a 10% hydrogen blending ratio will cause RDHES to lose its economic advantage. However, with reference to the EU’s plan for the promotion of hydrogen energy, by 2030, hydrogen will replace 7% of the natural gas in the EU, which also includes the direct substitution of hydrogen energy rather than hydrogen blending of natural gas. Therefore, except for a few demonstration areas, the 10% natural gas reduction rate is expected to arrive 20 to 30 years later.

5.2.3. PV Penetration Rate

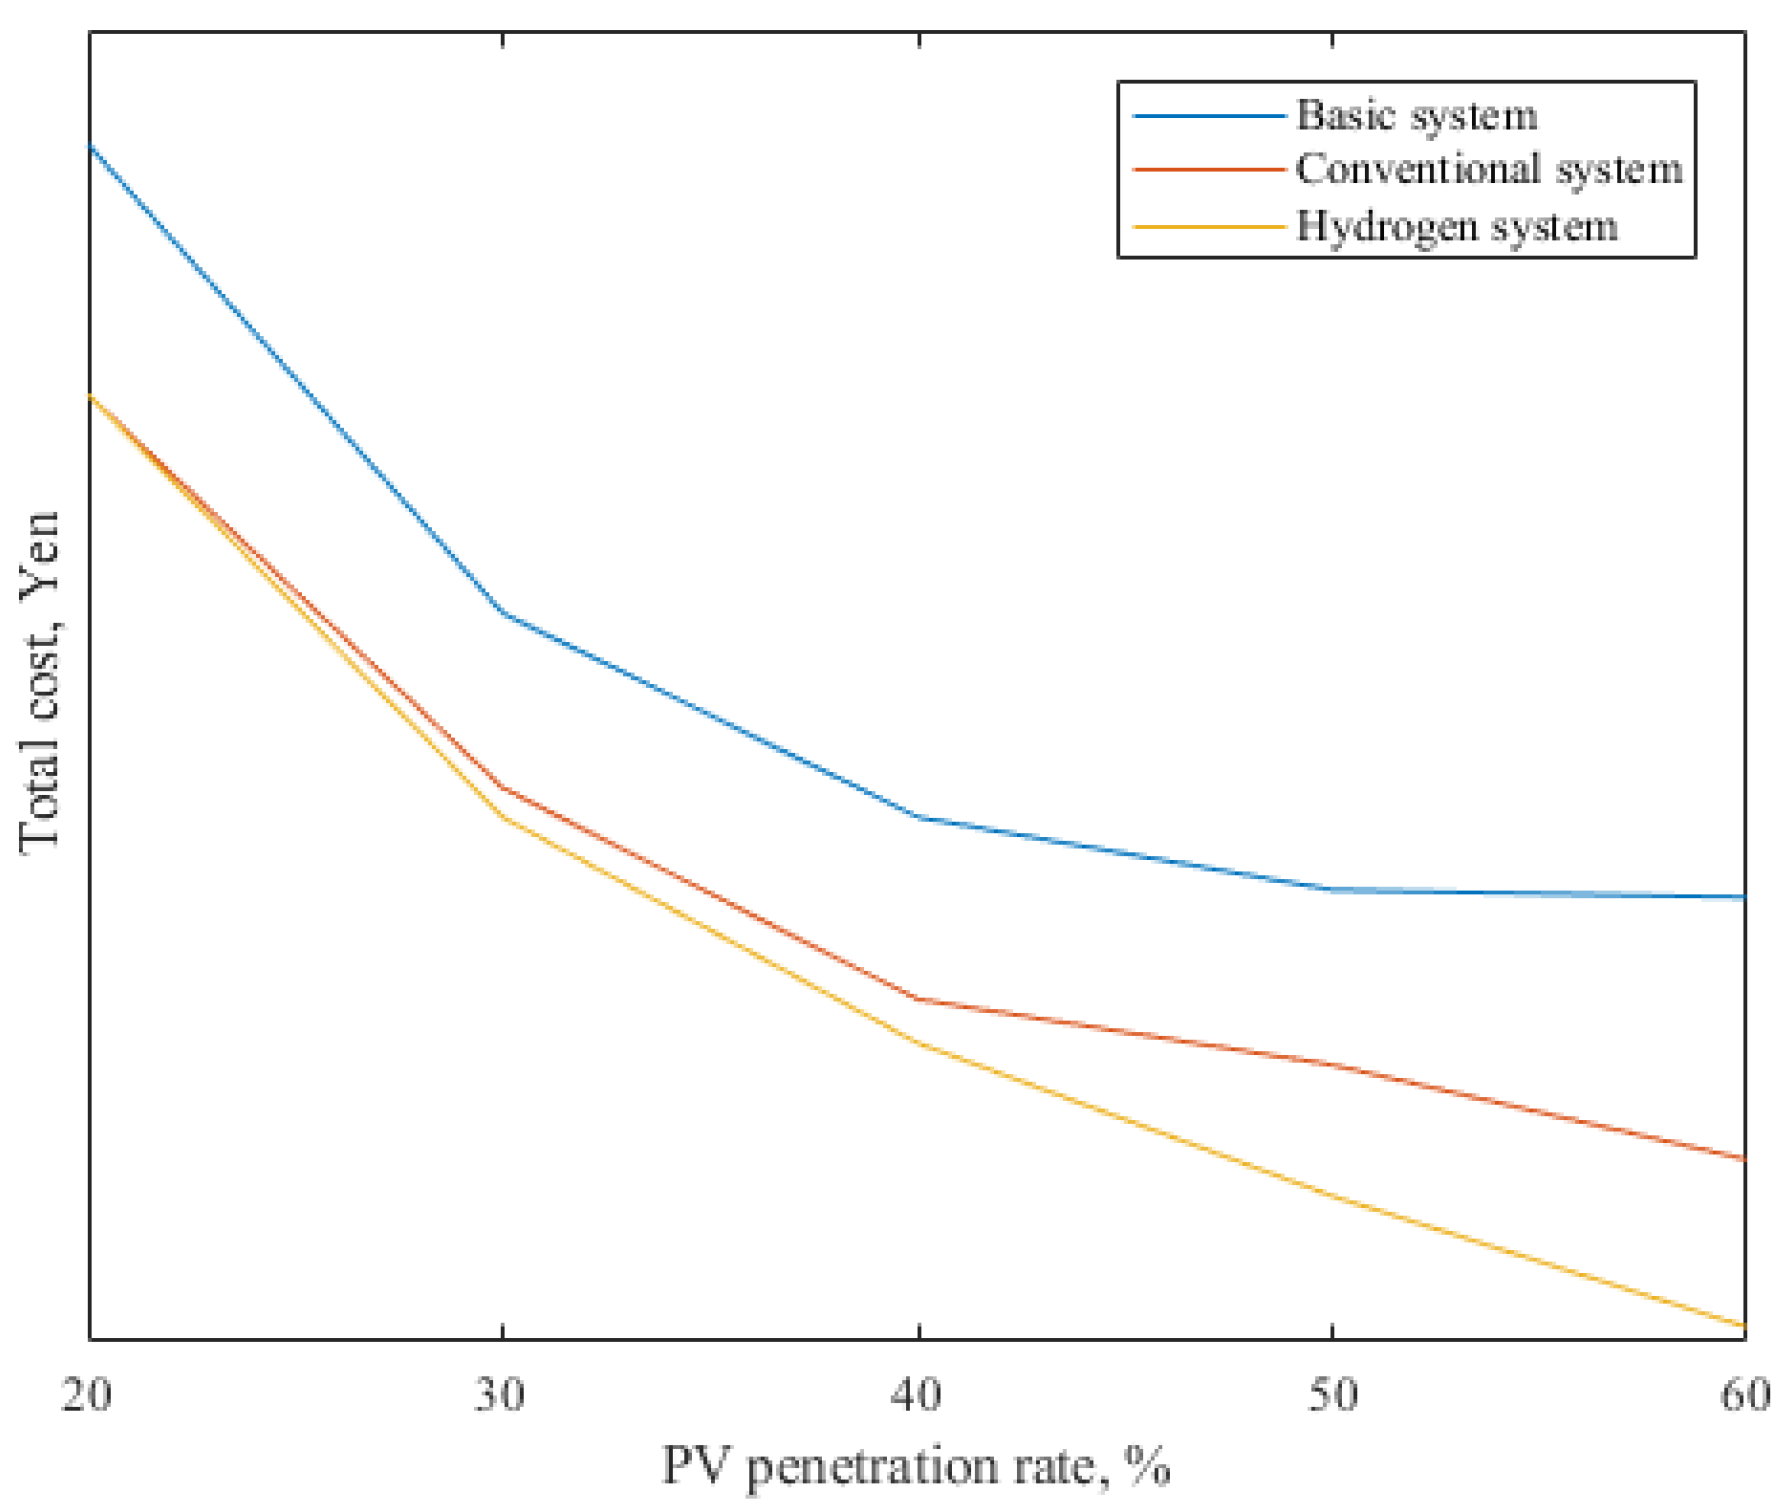
In RDHES, in addition to FC, HS is also a core hydrogen energy utilization technology. However, as the PV penetration rate is set to 30%, a large amount of discarded light cannot be generated in many cases, which significantly affects the benefits of HS. Therefore, the PV penetration rate changes by 20–60%. The system benefits under the carbon tax of 15 Yen/kg-CO2 are shown in Figure 10. Although the battery can also be used to store and discard the electricity in RDESs, it is necessary to relinquish the benefits of night valley electricity storage. Therefore, with the increase in PV penetration, RDHES with HS will gradually achieve greater economic benefits than RDES.

5.3. Case Comparison

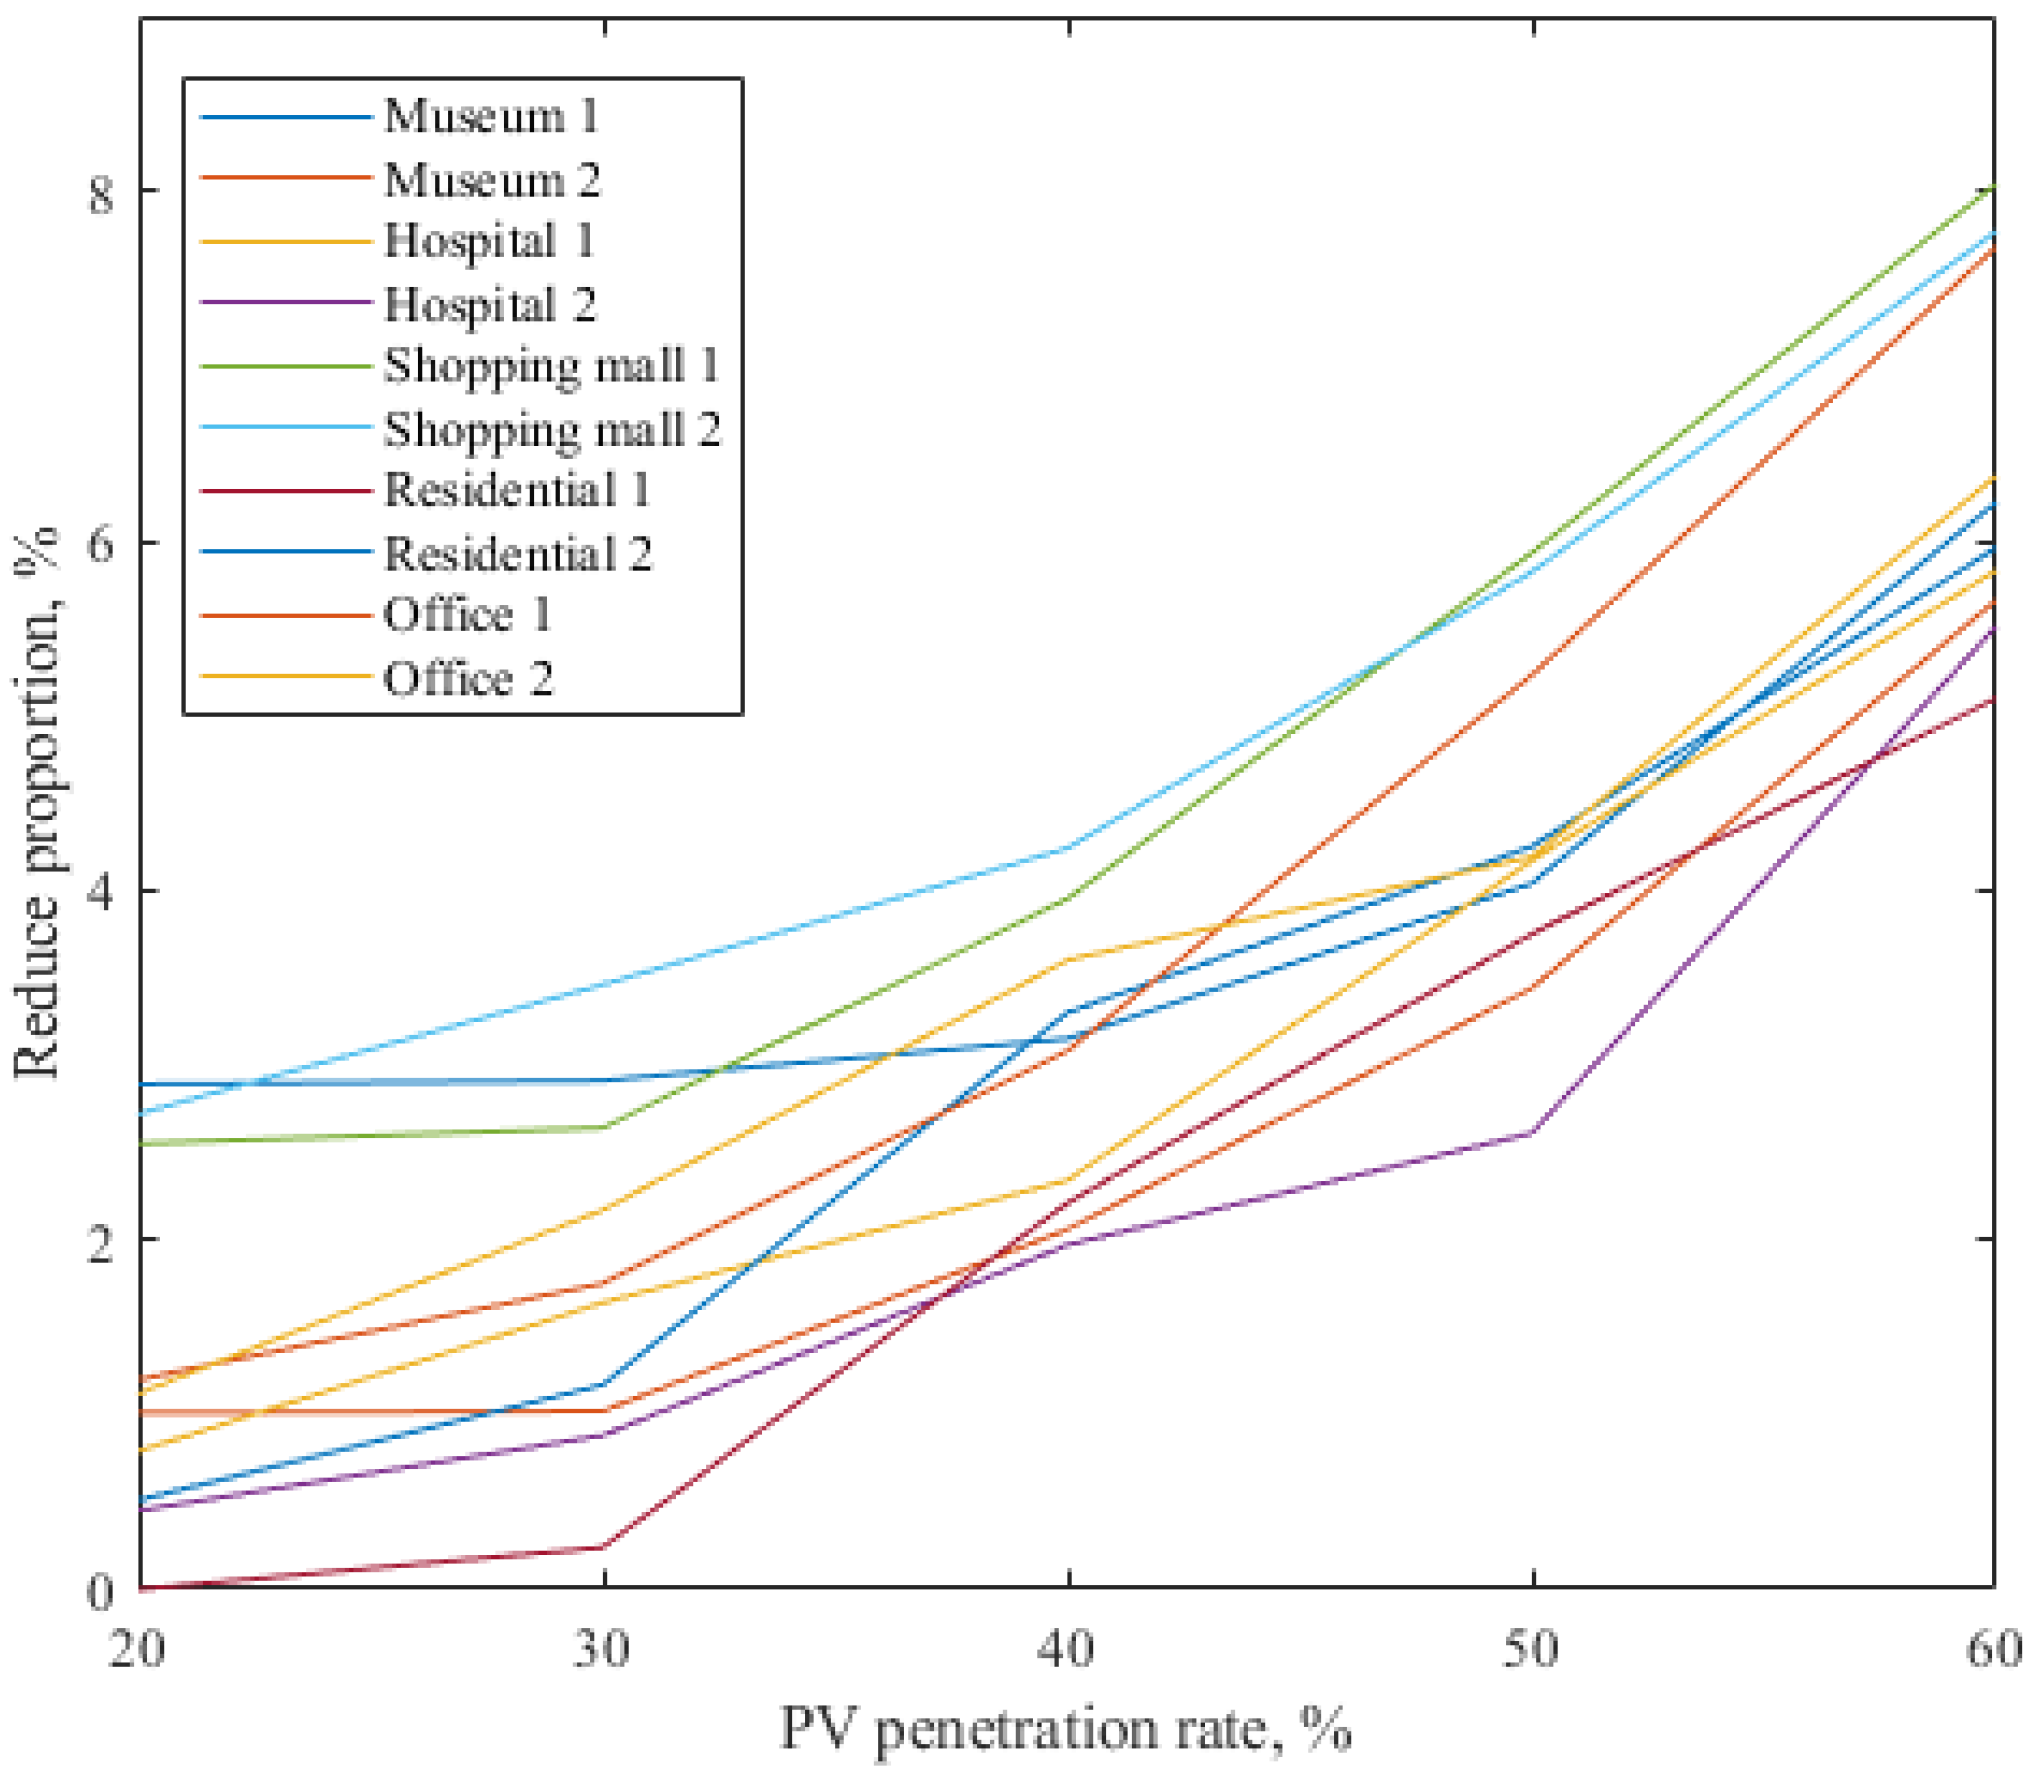
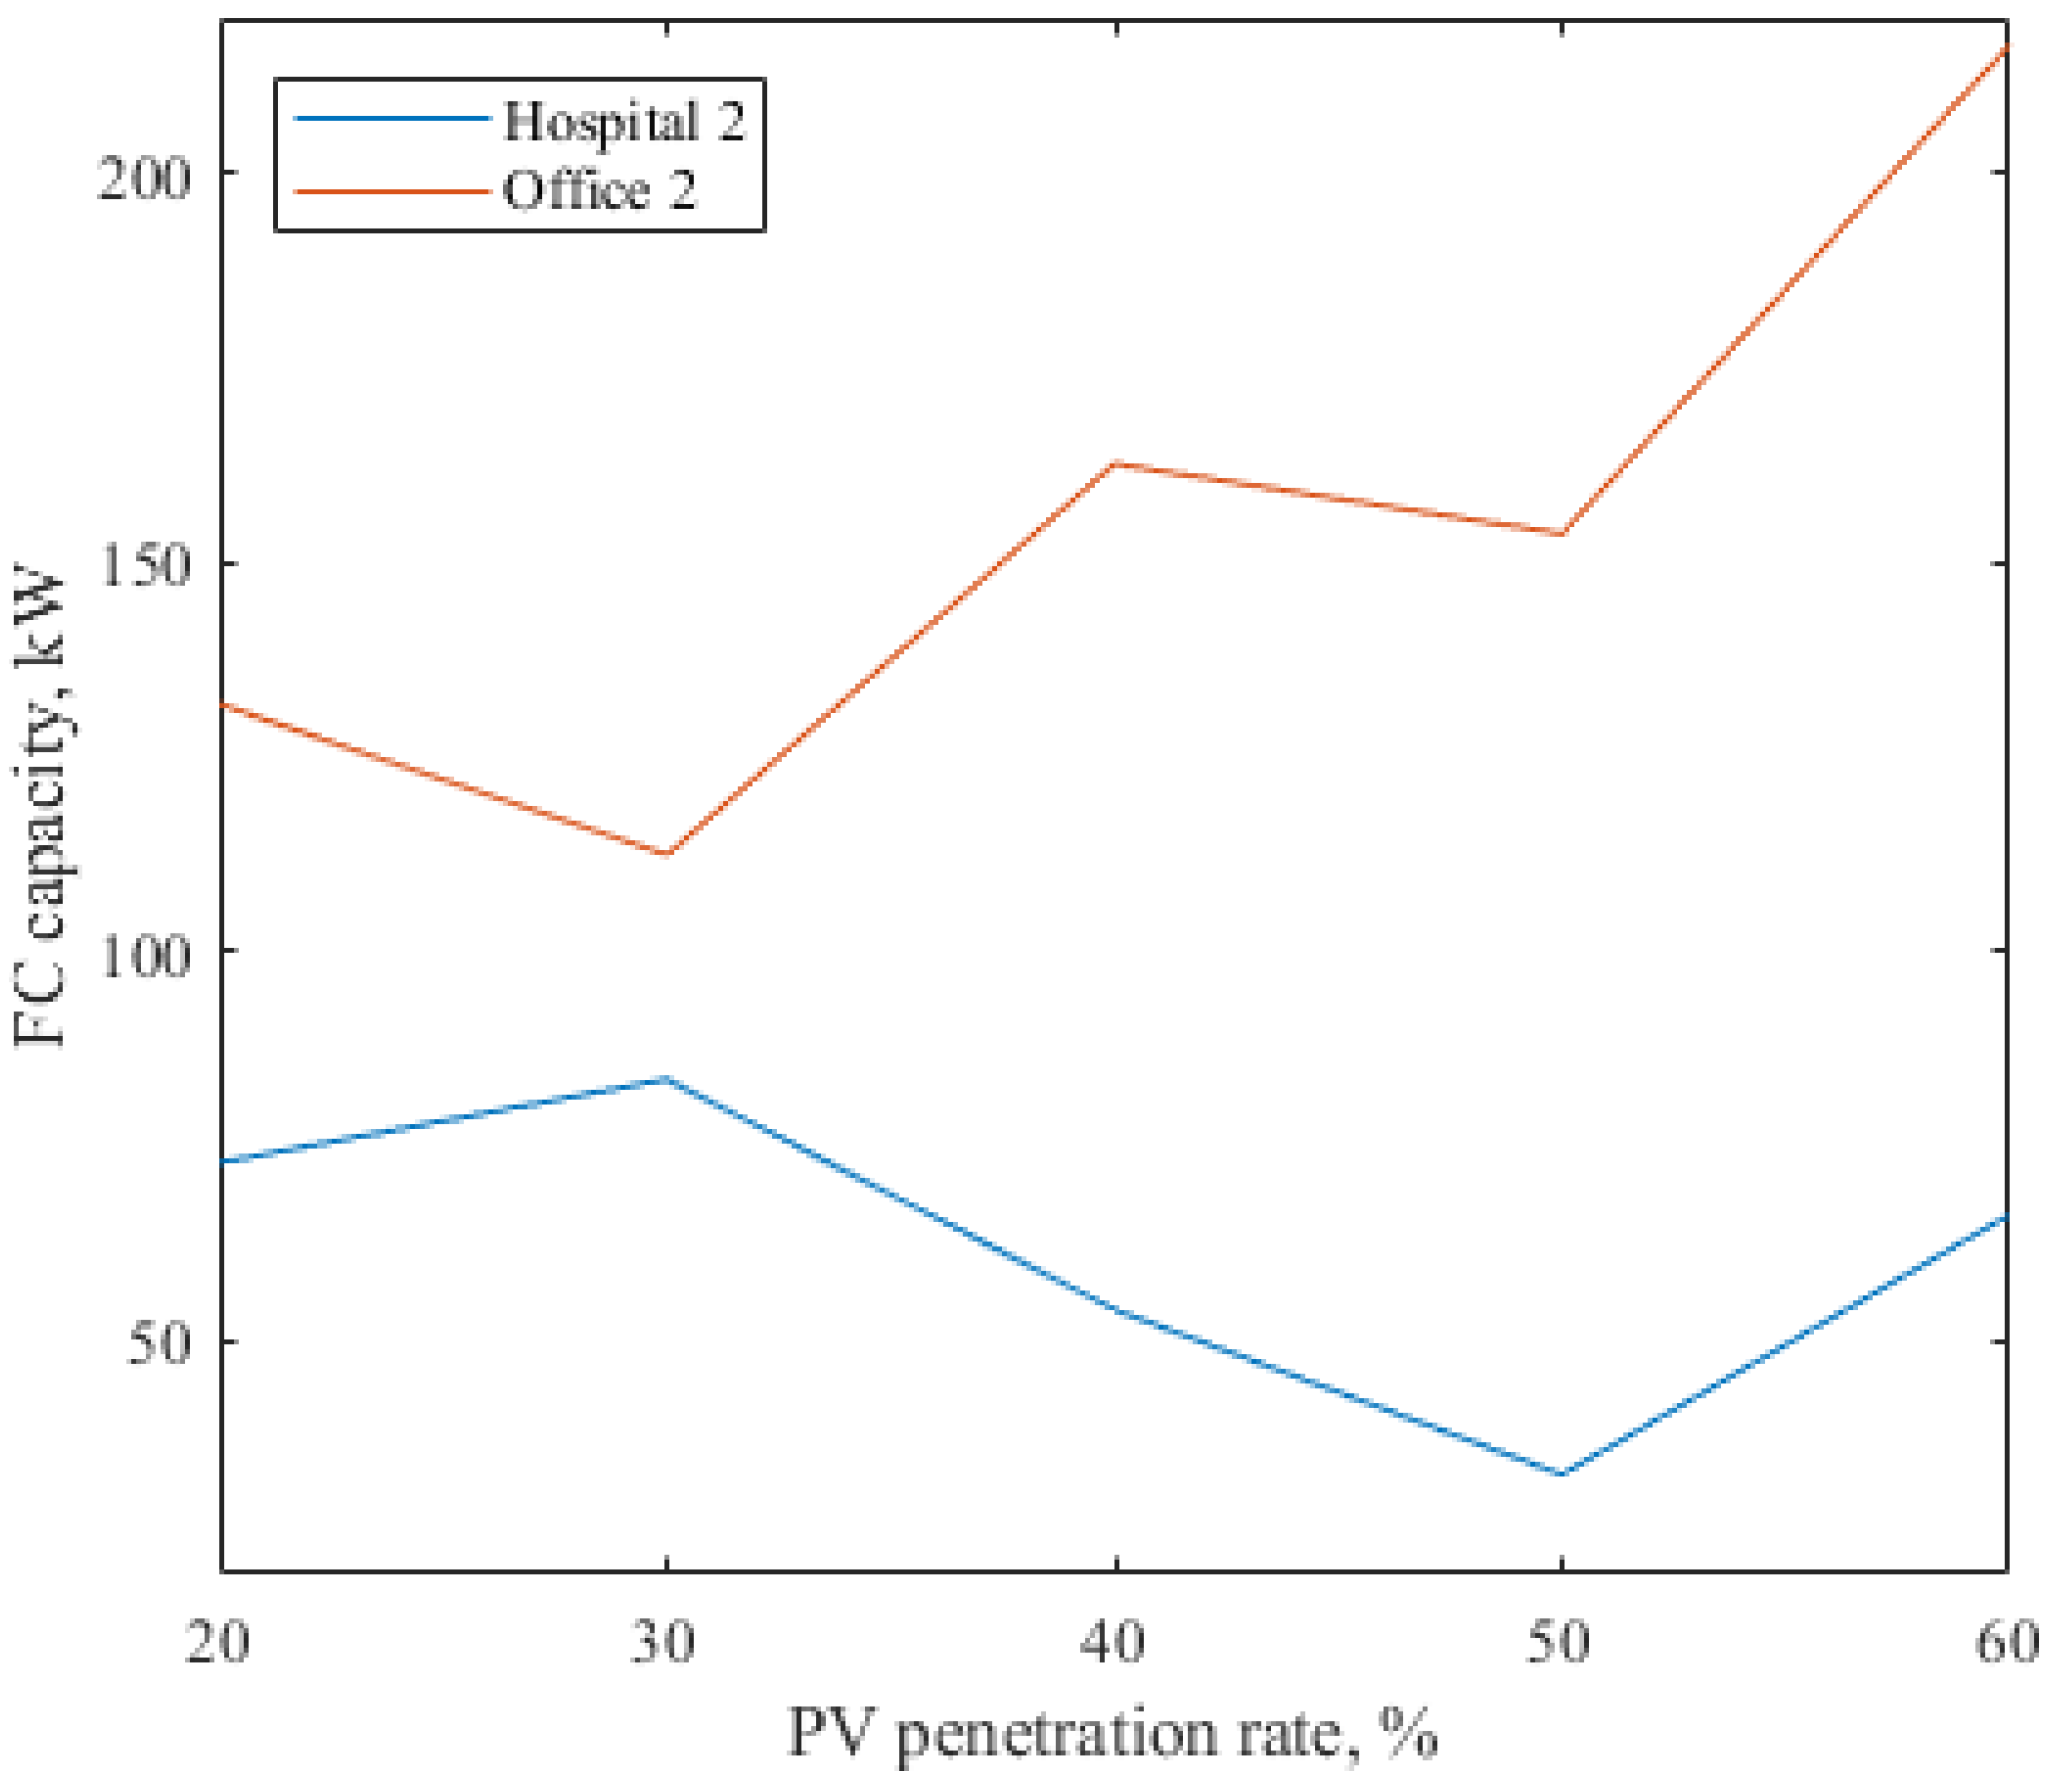
The application of RDHES in different types of buildings when the carbon tax is 15 Yen/kg-CO2 is shown in Figure 11. Although the increase in the PV penetration rate facilitates an improvement in economic benefits, the improvement effect shows obvious differences. In most types of buildings, with the increase in the PV penetration rate, the economic benefits of RDHES accelerate. However, in Hospital 2, Office 2, Residence 1, and Residence 2, when the PV penetration rate is 30–50%, the trend of economic benefits of RDHES increases slowly. In terms of residences, due to the small daytime load, the trend does not match the PV system imported in high proportions. For Hospital 2 and Office 2, FC capacity changes have been specifically analyzed, as shown in Figure 12.
Figure 11 shows that the installed capacity of FC fluctuates with the increase in PV permeability. This is because, on the one hand, more waste light can be stored by HS to reduce the fuel cost of FCs, thus improving the economic benefits of the system. On the other hand, excessive photovoltaic power generation in the daytime will also reduce the effective utilization time of FC, thereby reducing the overall benefits of FCs. The conflict between these two aspects exists simultaneously in all buildings, but it is more obvious in some buildings with relatively low daytime loads. For example, in combination with the typical daily power load change of Office 2 shown in Figure 4, the power load drop caused by the lunch break in Office 2 has caused a bottleneck in achieving the economic benefits of RDHES in this building. Therefore, regardless of whether the PV penetration limit is set at 30% or the PV installed capacity continues to increase, shopping malls and museum types of buildings can generate greater economic benefits, which are suitable for the promotion of RDHES. The museum represents public service facilities such as libraries and gymnasiums. Therefore, buildings with a dense pedestrian flow in the daytime appear to be more suitable for RDHES applications.

6. Conclusions

To quantify the environmental advantages of hydrogen energy, this study introduced a carbon tax to quantify the policies or subsidies that the government or industry needs to provide to support the promotion of hydrogen energy. In this study, two of the five types of buildings in a hydrogen energy demonstration area in Japan were selected as the research objects, with a total of 10 buildings. Then, through the comparative analysis of RDHES and RDES according to different equipment costs, energy prices, carbon taxes, and user loads, the adaptability of hydrogen energy to the demand-side energy system was studied. The conclusions of this study are as follows:
(1)
FC cost reduction is the core consideration to ascertain whether RDHES can gain economic advantages. When the FC cost is reduced to the same level as the ICE cost, carbon taxes above 12 Yen/kg-CO2 enable RDHES to achieve an economic benefit exceeding that of RDES. When the carbon tax reaches 15 Yen/kg-CO2, the FC cost decreases to 1.5 times that of ICE, and RDHES can gain economic advantages.
(2)
From the perspective of energy price and carbon emission reduction in electric power, RDHES can maintain its economic advantages for a longer period of time and provide a stronger anti-risk ability than RDES.
(3)
Considering the positive effects of the reduction in hydrogen energy costs and the increase in carbon taxes, as well as the negative effects of the reduction in carbon emissions from electricity and natural gas, it is estimated that the hydrogen energy system on the demand side will have the greatest economic advantage for the gas system in 2030. Subsequently, with the introduction of large-scale renewable energy on the supply side, both of them will have an obvious decline in economic benefits.
(4)
In buildings with relatively low power loads in the daytime, the direct conflict between the improvement of hydrogen energy system efficiency and the increase in PV penetration rates will become more obvious. From the perspective of the final effect of economic benefit improvement, buildings with relatively high daytime loads, such as museums and shopping malls, are more suitable for the promotion of RDHESs.
This study compared the configuration optimization of RDHES and RDES through actual energy data, obtained the level of cost reduction and policy support (in the form of a carbon tax) that hydrogen needs to obtain in the demand-side promotion process, and analyzed the adaptability in different types of buildings. The results of this study have strong practical application value and can also provide a theoretical reference for the promotion of hydrogen energy on the demand side. However, the performance and cost of the equipment used in this study are fixed values or linear changes. At the same time, factors or technologies that affect the demand-side energy system, such as energy sharing across buildings, demand-side response, and electric vehicle-to-grid (V2G) implementations, are not considered. These topics will provide future research directions for further improvements.

Author Contributions

Conceptualization, W.G., Y.Y. and Y.R.; Methodology, F.Q., W.G., Y.Y. and Y.R.; Software, F.Q.; Validation, F.Q.; Investigation, F.Q. and D.Y.; Data curation, F.Q. and D.Y.; Writing—original draft, F.Q.; Writing—review & editing, F.Q., W.G., D.Y., Y.Y. and Y.R. All authors have read and agreed to the published version of the manuscript.

Funding

This research was funded by Shanghai Science and Technology Development Foundation, NO. 21DZ1208803.

Data Availability Statement

Not applicable.

Conflicts of Interest

The authors declare no conflict of interest.

Appendix A

Figure A1. Annual 8760-h power load of the museums, hospitals, shopping malls and residentials building.
Energies 16 00342 g0a1
Figure A2. Typical daily changes in the four seasons of museum (a), hospital (b), shopping mall (c) and residential buildings (d) (electricity load).
Energies 16 00342 g0a2aEnergies 16 00342 g0a2bEnergies 16 00342 g0a2c
Figure A3. Annual 8760 load change curve of office buildings.
Energies 16 00342 g0a3
Figure A4. Typical daily change curve for the four seasons of office buildings (cold and heat load).
Energies 16 00342 g0a4

References

  1. Glenk, G.; Reichelstein, S. Economics of converting renewable power to hydrogen. Nat. Energy 2019, 4, 216–222. [Google Scholar] [CrossRef] [Green Version]
  2. BloombergNEF. Hydrogen Economy Outlook, 2020. Available online: https://data.bloomberglp.com/professional/sites/24/BNEF-Hydrogen-Economy-Outlook-Key-Messages-30-Mar-2020.pdf (accessed on 10 December 2022).
  3. International Energy Agency IEA. The Future of Hydrogen. 2019. Available online: https://www.iea.org/reports/the-future-of-hydrogen (accessed on 10 December 2022).
  4. Apostolou, D.; Xydis, G. A literature review on hydrogen refuelling stations and infrastructure. Current status and future prospects. Renew. Sustain. Energy Rev. 2019, 113, 109292. [Google Scholar] [CrossRef]
  5. Staffell, I.; Scamman, D.; Abad, A.V.; Balcombe, P.; Dodds, P.E.; Ekins, P.; Shah, N.; Ward, K.R. The role of hydrogen and fuel cells in the global energy system. Energy Environ. Sci. 2019, 12, 463–491. [Google Scholar] [CrossRef] [Green Version]
  6. Jones, J.; Genovese, A.; Tob-Ogu, A. Hydrogen vehicles in urban logistics: A total cost of ownership analysis and some policy implications. Renew. Sustain. Energy Rev. 2020, 119, 109595. [Google Scholar] [CrossRef]
  7. Gür, T.M. Review of electrical energy storage technologies, materials and systems: Challenges and prospects for large-scale grid storage. Energy Environ. Sci. 2018, 11, 2696–2767. [Google Scholar] [CrossRef]
  8. Li, Y.; Gao, W.; Ruan, Y. Potential and sensitivity analysis of long-term hydrogen production in resolving surplus RES generation—A case study in Japan. Energy 2019, 171, 1164–1172. [Google Scholar] [CrossRef]
  9. Mahmud, K.; Khan, B.; Ravishankar, J.; Ahmadi, A.; Siano, P. An internet of energy framework with distributed energy resources, prosumers and small-scale virtual power plants: An overview. Renew. Sustain. Energy Rev. 2020, 127, 109840. [Google Scholar] [CrossRef]
  10. Inderwildi, O.; Zhang, C.; Wang, X.; Kraft, M. The impact of intelligent cyber-physical systems on the decarbonization of energy. Energy Environ. Sci. 2020, 13, 744–771. [Google Scholar] [CrossRef]
  11. Wu, Q.; Ren, H.; Gao, W.; Ren, J. Multi-objective optimization of a distributed energy network integrated with heating interchange. Energy 2016, 109, 353–364. [Google Scholar] [CrossRef]
  12. Kumar, A.; Meena, N.K.; Singh, A.R.; Deng, Y.; He, X.; Bansal, R.C.; Kumar, P. Strategic integration of battery energy storage systems with the provision of distributed ancillary services in active distribution systems. Appl. Energy 2019, 253, 113503. [Google Scholar] [CrossRef]
  13. Varghese, S.; Sioshansi, R. The price is right? How pricing and incentive mechanisms in California incentivize building distributed hybrid solar and energy-storage systems. Energy Policy 2020, 138, 111242. [Google Scholar] [CrossRef]
  14. Wu, Q.; Ren, H.; Gao, W.; Weng, P.; Ren, J. Coupling optimization of urban spatial structure and neighborhood-scale distributed energy systems. Energy 2018, 144, 472–481. [Google Scholar] [CrossRef]
  15. Ren, H.; Wu, Q.; Zhu, Q.; Gao, W. Cost–benefit analysis of distributed energy systems considering multi-benefits and multi-stakeholders. Energy 2019, 189, 116382. [Google Scholar] [CrossRef]
  16. Yu, D.; Zhou, X.; Qian, F.; Dewancker, B.; Gao, W.; Zhang, L. Research on energy sharing ability and adaptability of building Complex: A case study with smart community in Japan. Energy Explor. Exploit. 2022, 01445987221117181. [Google Scholar] [CrossRef]
  17. Zhang, L.; Yang, Y.; Li, Q.; Gao, W.; Qian, F.; Song, L. Economic optimization of microgrids based on peak shaving and CO2 reduction effect: A case study in Japan. J. Clean. Prod. 2021, 321, 128973. [Google Scholar] [CrossRef]
  18. Vijay, A.; Hawkes, A. Impact of dynamic aspects on economics of fuel cell based micro co-generation in low carbon futures. Energy 2018, 155, 874–886. [Google Scholar] [CrossRef]
  19. Qiu, D.; Peng, L.; Tang, J.; Lai, X. Numerical Analysis of Air-cooled Proton Exchange Membrane Fuel Cells With Various Cathode Flow Channels. Energy 2020, 198, 117334. [Google Scholar] [CrossRef]
  20. Qian, F.; Gao, W.; Yang, Y.; Yu, D. Economic optimization and potential analysis of fuel cell vehicle-to-grid (FCV2G) system with large-scale buildings. Energy Convers. Manag. 2020, 205, 112463. [Google Scholar] [CrossRef]
  21. Seo, S.K.; Yun, D.Y.; Lee, C.J. Design and optimization of a hydrogen supply chain using a centralized storage model. Appl. Energy 2020, 262, 114452. [Google Scholar] [CrossRef]
  22. Samsatli, S.; Samsatli, N.J. The role of renewable hydrogen and inter-seasonal storage in decarbonising heat–Comprehensive optimisation of future renewable energy value chains. Appl. Energy 2019, 233, 854–893. [Google Scholar] [CrossRef]
  23. Yang, X.; Zhao, H. Thermodynamic performance study of the SOFC-STIG distributed energy system fueled by LNG with CO2 recovery. Energy 2019, 186, 115860. [Google Scholar] [CrossRef]
  24. Kang, S.; Ahn, K.Y. Dynamic modeling of solid oxide fuel cell and engine hybrid system for distributed power generation. Appl. Energy 2017, 195, 1086–1099. [Google Scholar] [CrossRef]
  25. Reuß, M.; Grube, T.; Robinius, M.; Preuster, P.; Wasserscheid, P.; Stolten, D. Seasonal storage and alternative carriers: A flexible hydrogen supply chain model. Appl. Energy 2017, 200, 290–302. [Google Scholar] [CrossRef]
  26. Pellow, M.A.; Emmott, C.J.; Barnhart, C.J.; Benson, S.M. Hydrogen or batteries for grid storage? A net energy analysis. Energy Environ. Sci. 2015, 8, 1938–1952. [Google Scholar] [CrossRef] [Green Version]
  27. Hawkes, A.; Staffell, I.; Brett, D.; Brandon, N. Fuel cells for micro-combined heat and power generation. Energy Environ. Sci. 2009, 2, 729–744. [Google Scholar] [CrossRef]
  28. Notter, D.A.; Kouravelou, K.; Karachalios, T.; Daletou, M.K.; Haberland, N.T. Life cycle assessment of PEM FC applications: Electric mobility and μ-CHP. Energy Environ. Sci. 2015, 8, 1969–1985. [Google Scholar] [CrossRef]
  29. Mehrjerdi, H. Peer-to-peer home energy management incorporating hydrogen storage system and solar generating units. Renew. Energy 2020, 156, 183–192. [Google Scholar] [CrossRef]
  30. Hemmati, R.; Mehrjerdi, H.; Bornapour, M. Hybrid hydrogen-battery storage to smooth solar energy volatility and energy arbitrage considering uncertain electrical-thermal loads. Renew. Energy 2020, 154, 1180–1187. [Google Scholar] [CrossRef]
  31. Zhao, X.; Gao, W.; Qian, F.; Li, Y.; Ushifusa, Y.; Yang, Z.; Yin, W.; Ge, J. Economic performance of multi-energy supply system in a zero-carbon house. Energy Build. 2020, 226, 110363. [Google Scholar] [CrossRef]
  32. Bozorgmehri, S.; Heidary, H.; Salimi, M. Market Diffusion Strategies for the PEM Fuel Cell-Based Micro-CHP Systems in the Residential Sector: Scenario Analysis. Int. J. Hydrogen Energy 2022, in press. [Google Scholar] [CrossRef]
  33. Virji, M.; Randolf, G.; Ewan, M.; Rocheleau, R. Analyses of hydrogen energy system as a grid management tool for the Hawaiian Isles. Int. J. Hydrogen Energy 2020, 45, 8052–8066. [Google Scholar] [CrossRef]
  34. Li, Y.; Qian, F.; Gao, W.; Fukuda, H.; Wang, Y. Techno-economic performance of battery energy storage system in an energy sharing community. J. Energy Storage 2022, 50, 104247. [Google Scholar] [CrossRef]
  35. Wang, Y.; Gao, W.; Qian, F.; Li, Y. Evaluation of economic benefits of virtual power plant etween demand and plant sides based on cooperative game theory. Energy Convers. Manag. 2021, 238, 114180. [Google Scholar] [CrossRef]
  36. Sasakura, T.; Fuji Electric Corporation. The Results of the Kitakyushu Smart Community Project 2015. Available online: https://www.smart-japan.org/english/vcms_cf/files/Kitakyushu_Project_Japanese.pdf (accessed on 10 December 2022).
  37. China Building Energy Conservation Association. China Building Energy Consumption Annual Report 2020. Build. Energy Effic. 2021, 49, 1–6. (In Chinese) [Google Scholar]
  38. Fang, X.; Gong, G.; Li, G.; Chun, L.; Li, W.; Peng, P. A hybrid deep transfer learning strategy for short term cross-building energy prediction. Energy 2021, 215, 119208. [Google Scholar] [CrossRef]
  39. Cai, S.; Gou, Z. Impact of COVID-19 on the Energy Consumption of Commercial Buildings: A Case Study in Singapore. Energy Built Environ. 2022, in press. [CrossRef]
  40. Ministry of the Environment, Japan. Regarding Measures to Maximize Emission Reduction Potential (Report Summary Version), 2013. Available online: https://www.env.go.jp/earth/er-potential/index.html (accessed on 10 December 2022).
  41. Levi, S. Why hate carbon taxes? Machine learning evidence on the roles of personal responsibility, trust, revenue recycling, and other factors across 23 European countries. Energy Res. Soc. Sci. 2021, 73, 101883. [Google Scholar] [CrossRef]
  42. Runst, P.; Thonipara, A. Dosis facit effectum why the size of the carbon tax matters: Evidence from the Swedish residential sector. Energy Econ. 2020, 91, 104898. [Google Scholar] [CrossRef]
  43. Kyushu Electric Power, Japan. Environmental Activity Results in 2017. Available online: http://www.kyuden.co.jp/library/pdf/environment/action-report18/booklet/report/P15-56.pdf (accessed on 10 December 2022).
  44. Tokyo Gas, Japan. Type, Heat Quantity, Pressure, Composition of City Gas. 2020. Available online: https://home.tokyo-gas.co.jp/gas/userguide/shurui.html (accessed on 10 December 2022).
  45. Kyushu Electric Power, Japan. Price Menu, Unit Price, Power Supply Configuration. 2020. Available online: http://www.kyuden.co.jp/business_menu_index.html (accessed on 10 December 2022).
  46. Western Gas, Japan. Gas Charge 2020. Available online: https://www.saibugas.co.jp/business/rates/index.htm (accessed on 10 December 2022).
  47. Li, Y.; Gao, W.; Ruan, Y.; Ushifusa, Y. The performance investigation of increasing share of photovoltaic generation in the public grid with pump hydro storage dispatch system, a case study in Japan. Energy 2018, 164, 811–821. [Google Scholar] [CrossRef]
  48. Agency for Natural Resources and Energy. Hydrogen/Fuel Cell Strategy Roadmap. 12 March 2019. Available online: https://www.meti.go.jp/press/2018/03/20190312001/20190312001.html (accessed on 10 December 2022).
  49. Wakiyama, T.; Kuriyama, A. Assessment of renewable energy expansion potential and its implications on reforming Japan’s electricity system. Energy Policy 2018, 115, 302–316. [Google Scholar] [CrossRef]
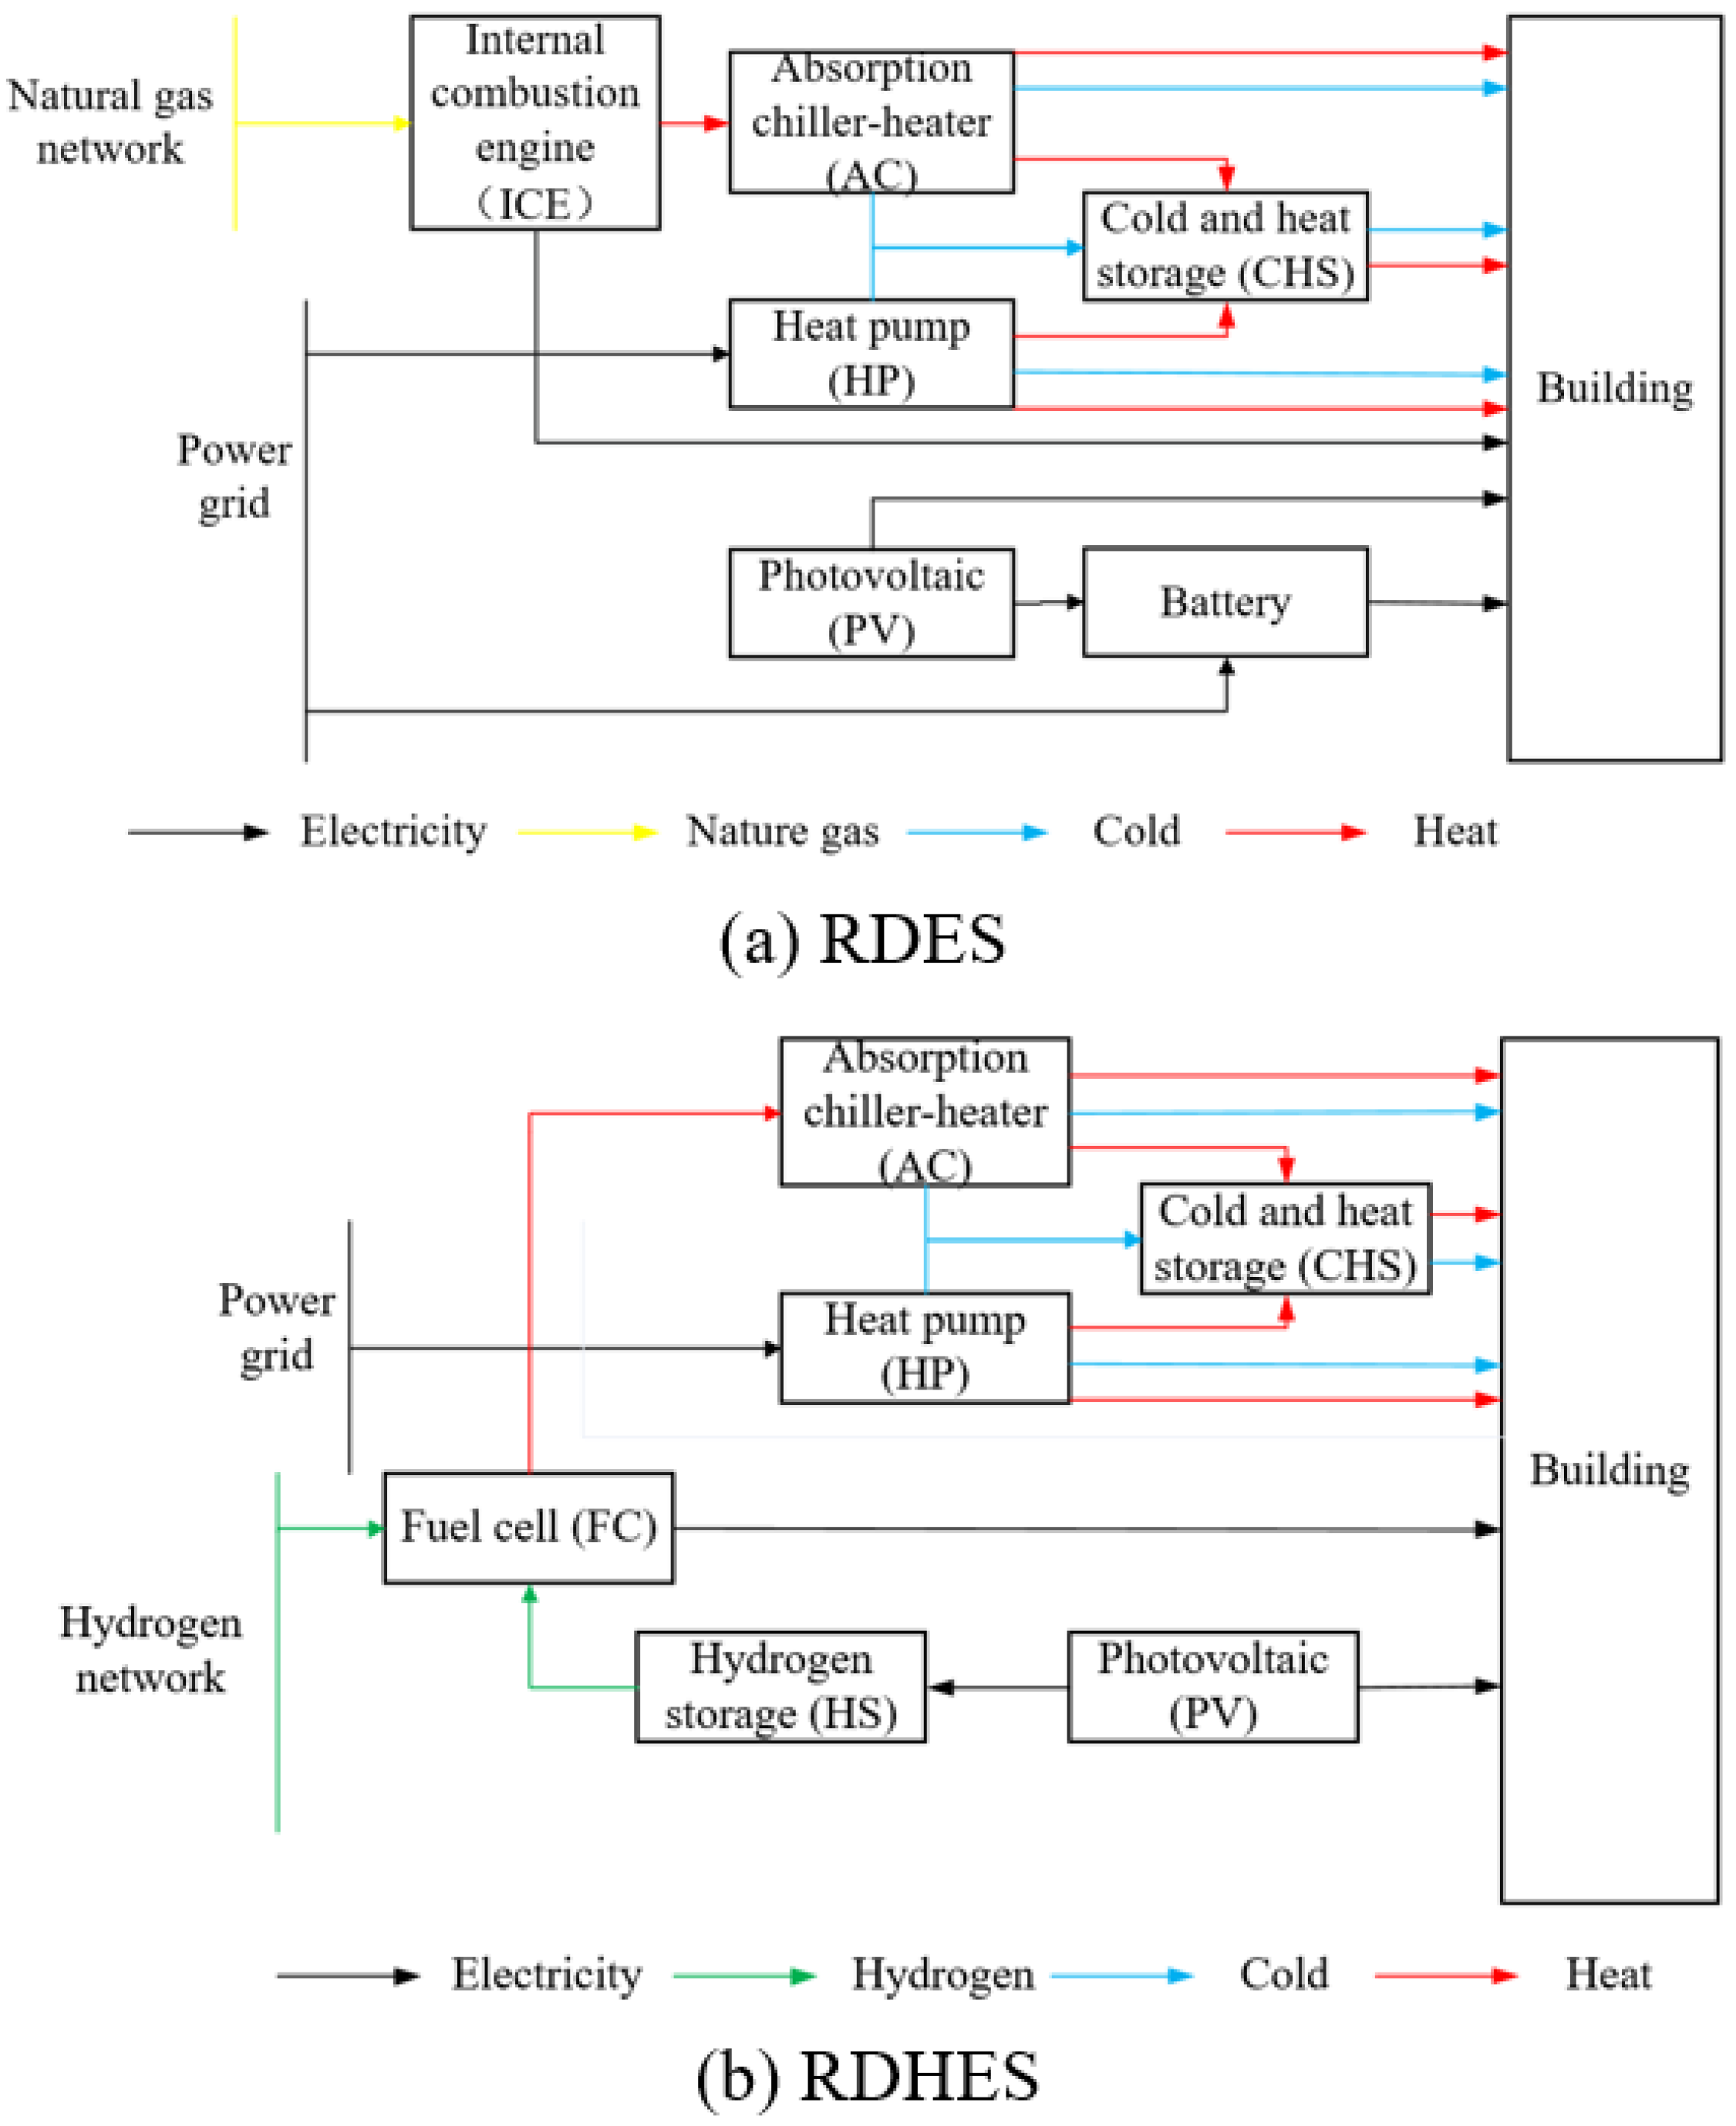
Figure 1. Description of the main equipment and energy flow in a conventional RDES (a) and RDHES (b).
Energies 16 00342 g001
Figure 2. Description of the hydrogen supply route and research case in the Higashida area.
Energies 16 00342 g002
Figure 3. Annual 8760-h power load of the museums, hospitals, shopping malls, residential buildings, and office buildings.
Energies 16 00342 g003
Figure 4. Typical daily changes in the four seasons of office buildings (electricity load, (a) Office 1; (b) Office 2).
Energies 16 00342 g004aEnergies 16 00342 g004b
Figure 5. Total cost base reference value change (a) and the proportion of total cost reduction under different carbon taxes (b).
Energies 16 00342 g005
Figure 6. Proportion of the total cost reduction under different carbon taxes (FC costs the same as ICE) (a) and FC installed capacity under different carbon taxes (b).
Energies 16 00342 g006
Figure 7. Sensitivity analysis of energy price ((a) electricity price; (b) hydrogen and natural gas prices).
Energies 16 00342 g007
Figure 8. Variation curve of total cost with decrease in FC cost.
Energies 16 00342 g008
Figure 9. Benefits of different CO2 emission in electricity (a) and natural gas (b).
Energies 16 00342 g009
Figure 10. Benefits of different PV penetration rates (carbon tax:15 Yen/kgCO2).
Energies 16 00342 g010
Figure 11. Reduce proportion of RDHES in ten buildings under different PV penetration.
Energies 16 00342 g011
Figure 12. FC capacity in case Hospital 2 and Office 2 under different PV penetration.
Energies 16 00342 g012
Table 1. Basic information on the research target building.
BuildingConstruction Area (104 m2)Annual Total Electricity Consumption (MWh)Maximum Electrical Load (MW)
Museum 14.0152171.44
Museum 23.9727391.43
Hospital 15.5781492.01
Hospital 22.0429990.74
Shopping mall 15.2482441.89
Shopping mall 211.0912,8833.99
Residential 1 *1.5923860.57
Residential 2 *7.7487692.79
Office 13.0528841.10
Office 21.9815440.71
* Residential 1 and 2 are dwellings.
Table 2. Equivalent hours of cooling and heating load (MW).
MuseumHospitalShopping MallResidentialOffice
Building number1212121212
Cold load0.770.450.790.751.160.890.330.200.700.56
Heat load0.630.290.880.760.480.250.870.530.380.33
Table 3. Energy price [45,46].
Electricity Nature GasHydrogen
Unit energy costSummer peak (13:00–16:00)16.95 Yen/kWh67.53 Yen/m340 Yen/m3
Summer daytime (8:00–12:00, 17:00–22:00)14.48 Yen/kWh
Normal daytime (8:00–22:00)13.53 Yen/kWh
Nighttime (23:00–7:00), Sunday and holiday9.06 Yen/kWh
Basic capacity cost2046 Yen/kW2365 Yen/m3
Summer is from 1 July to 30 September. The price of natural gas is a price model suitable for larger equivalent use, and a fixed fee of 159,148 yen needs to be paid in one lump sum. The price of hydrogen selects the predicted target value of Japan’s hydrogen energy strategic plan, without considering the cost of capacity.
Table 4. Performance parameters and cost of energy equipment [47,48,49].
ICE3101 Yen/kW
Power efficiency0.45Thermal efficiency0.4
FC13,298 Yen/kW
Power efficiency0.4Thermal efficiency0.45
AC3101 Yen/kW
Cold COP1Heat COP0.9
HP775 Yen/kW
Cold COP3.5Heat COP3.5
CHS120 Yen/kWh
TypeWater storageStorage loss2% per 24 hours
PV5040 Yen/kW
TypePolysiliconPower efficiency18%
Battery3896 Yen/kWh
TypeSodium-sulfurStorage loss0.95
HS3571 Yen/kWh
Storage loss0.7
Disclaimer/Publisher’s Note: The statements, opinions and data contained in all publications are solely those of the individual author(s) and contributor(s) and not of MDPI and/or the editor(s). MDPI and/or the editor(s) disclaim responsibility for any injury to people or property resulting from any ideas, methods, instructions or products referred to in the content.