
Seawater Intrusion Risk and Prevention Technology of Coastal and Large-Span Underground Oil Storage Cavern

 ,
,
Abstract
:1. Introduction
2. Engineering Background
2.1. Project Overview
2.2. Engineering Geology
2.3. Hydrogeology
3. Model Construction and Boundary Conditions
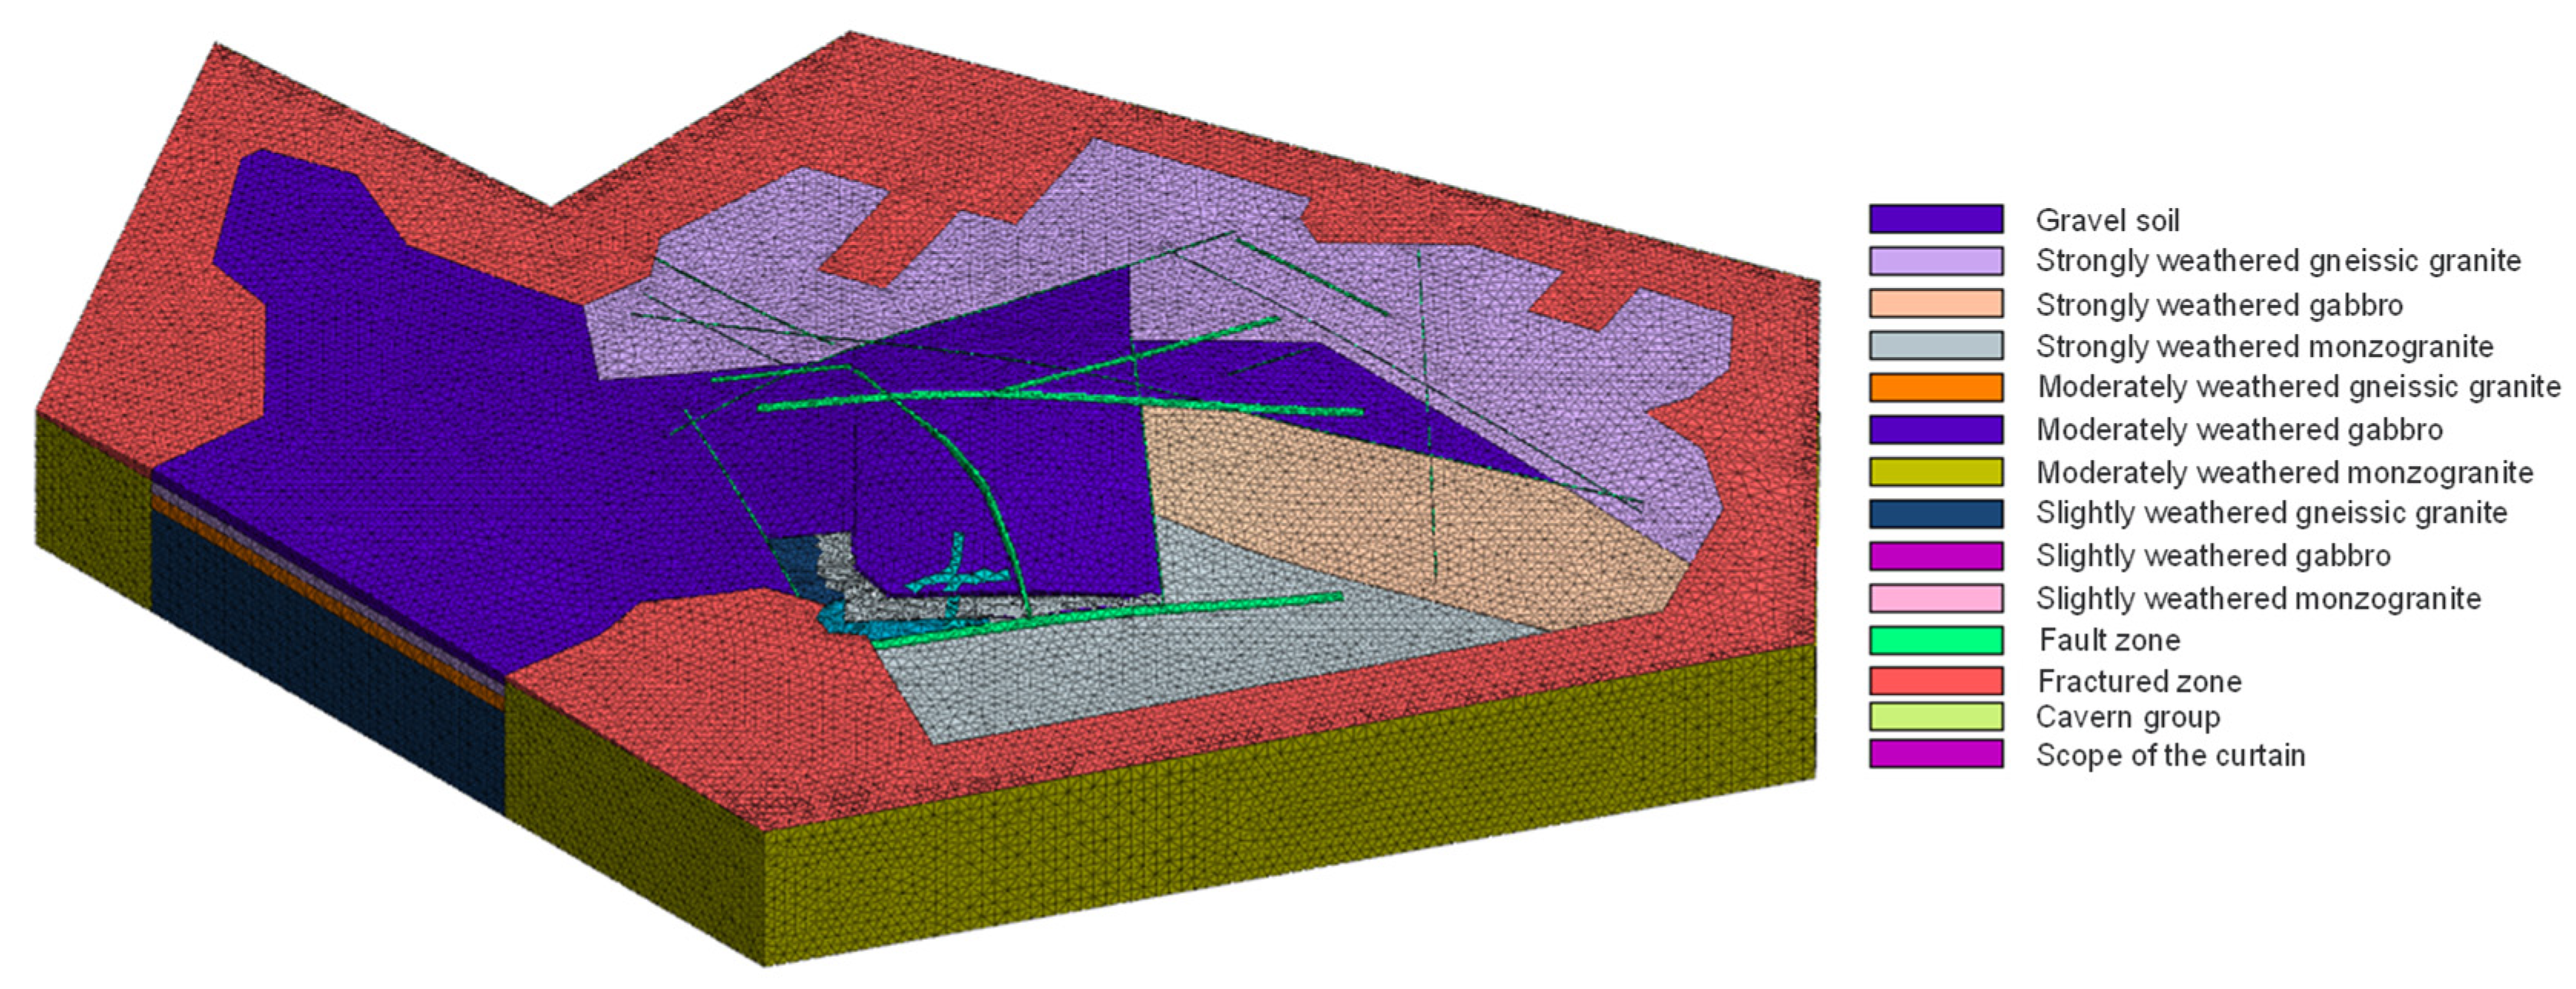
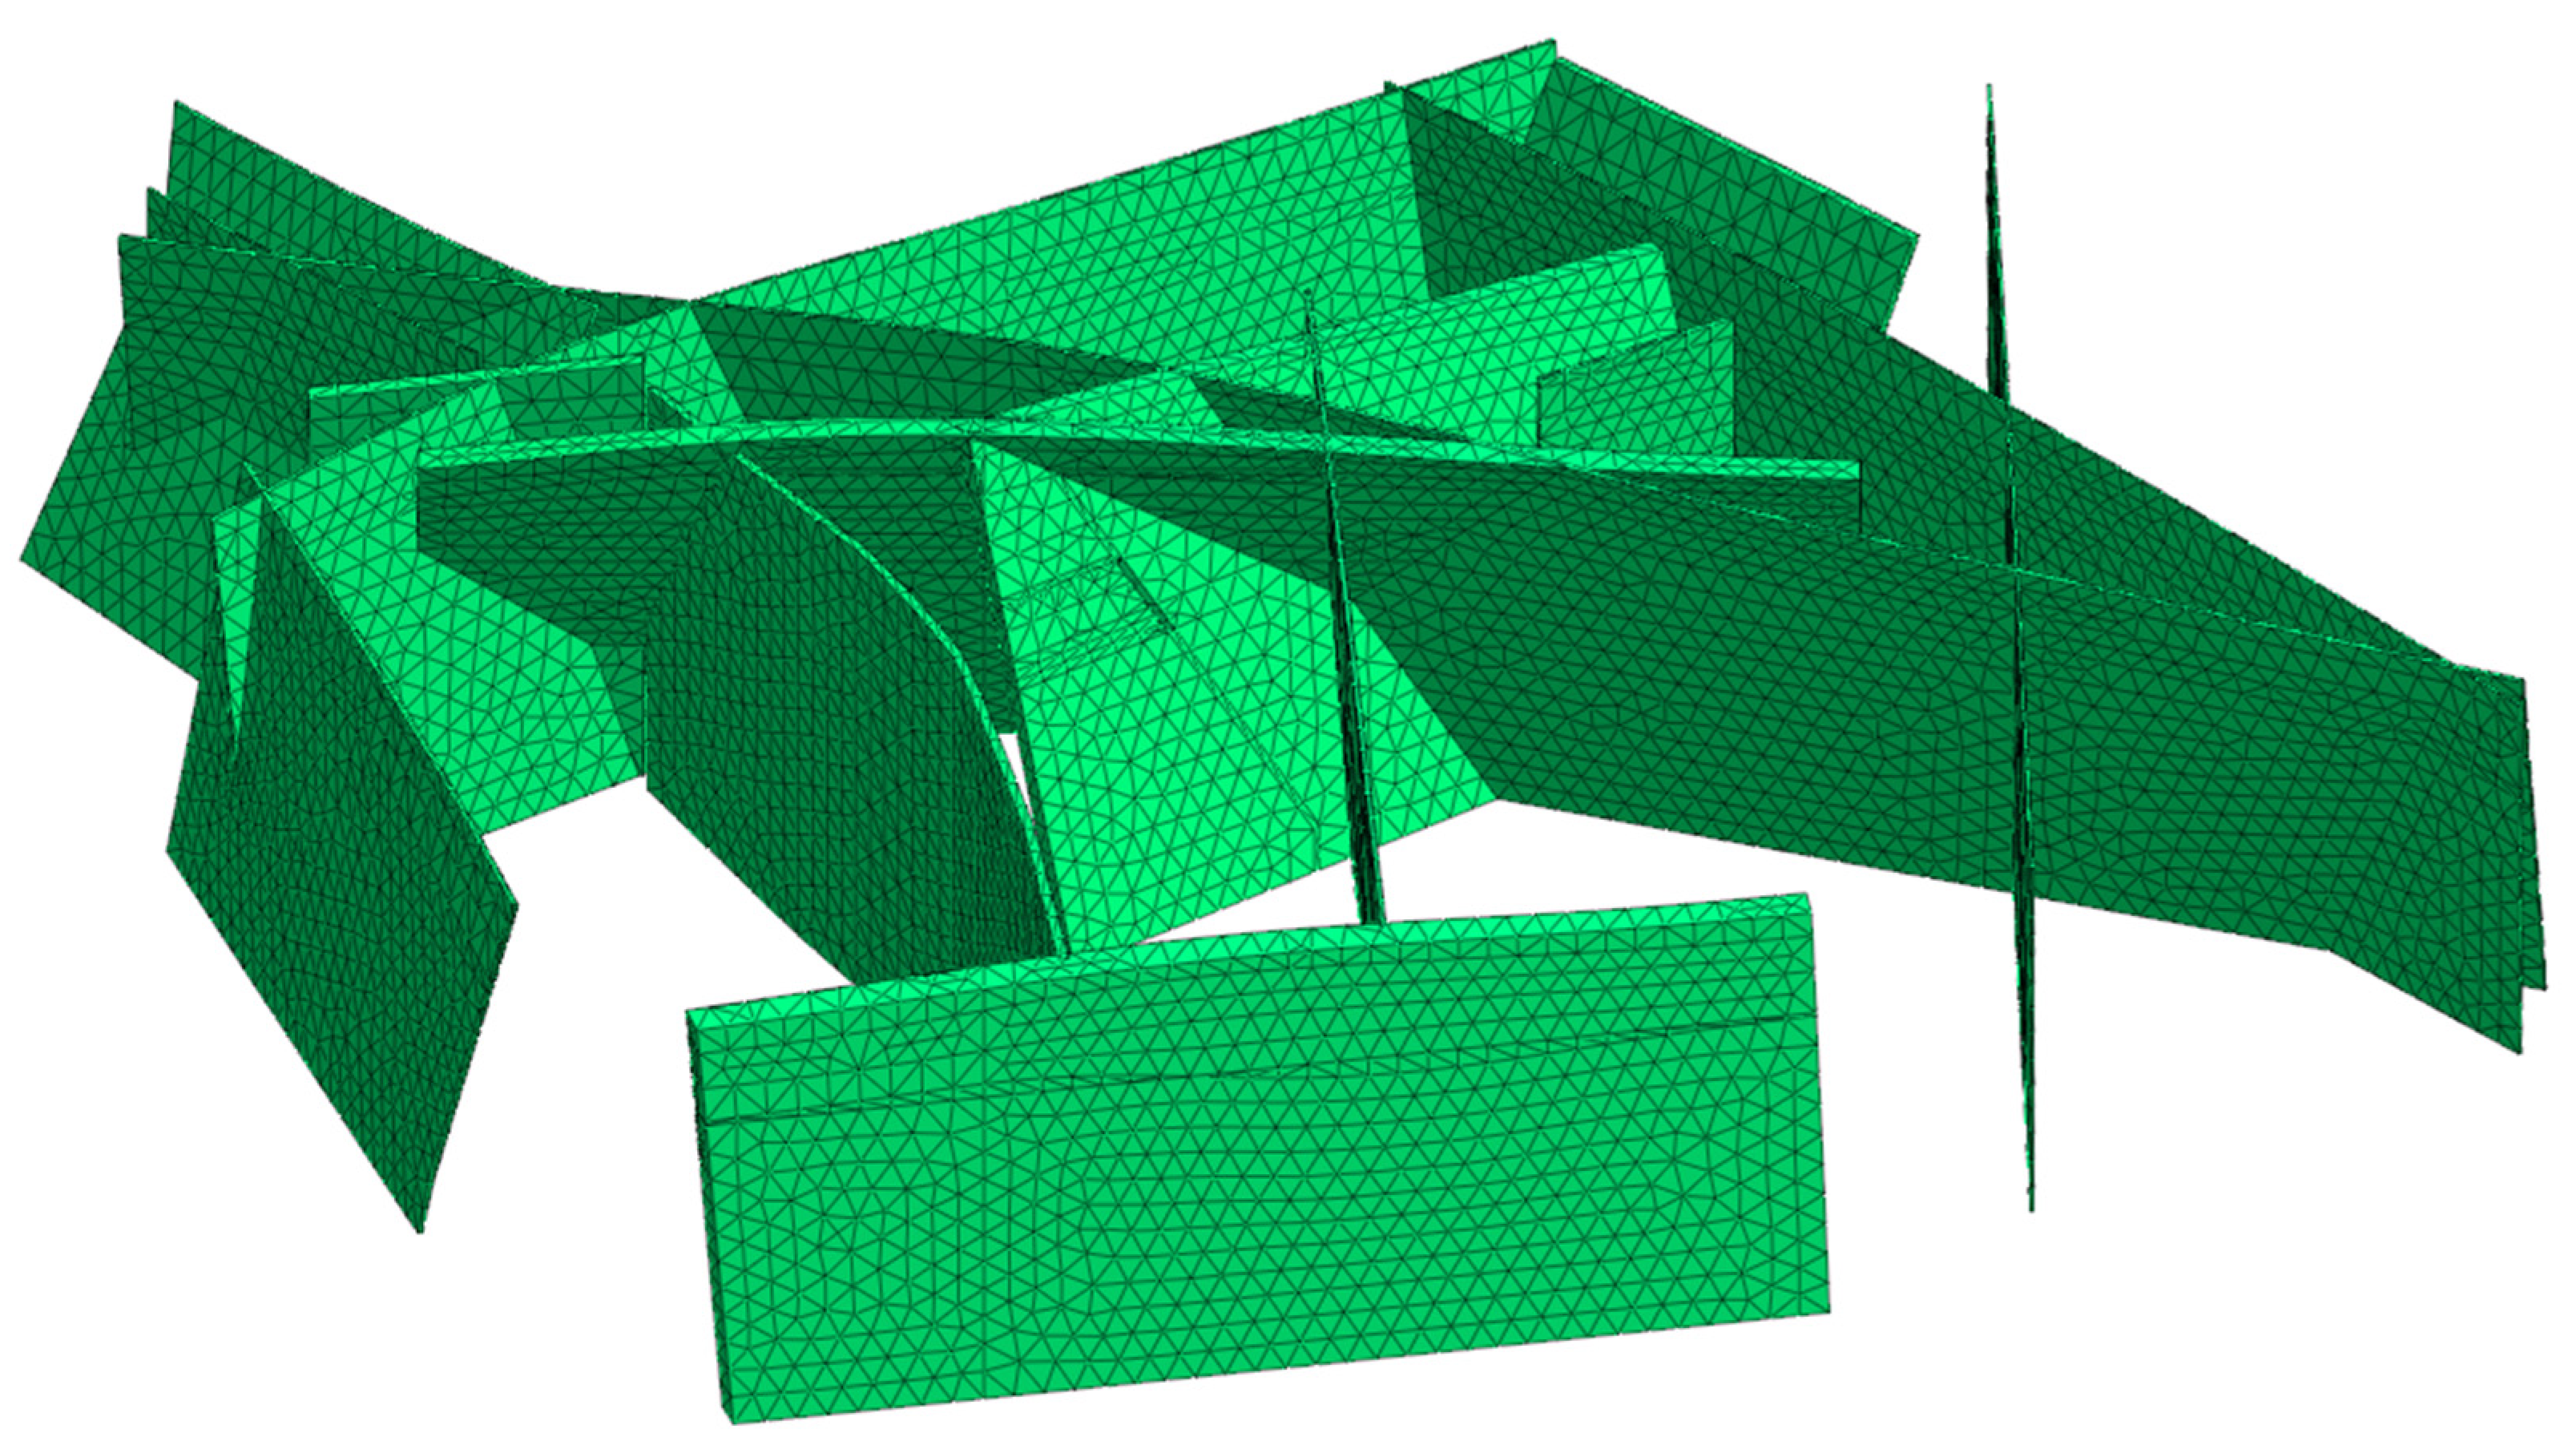
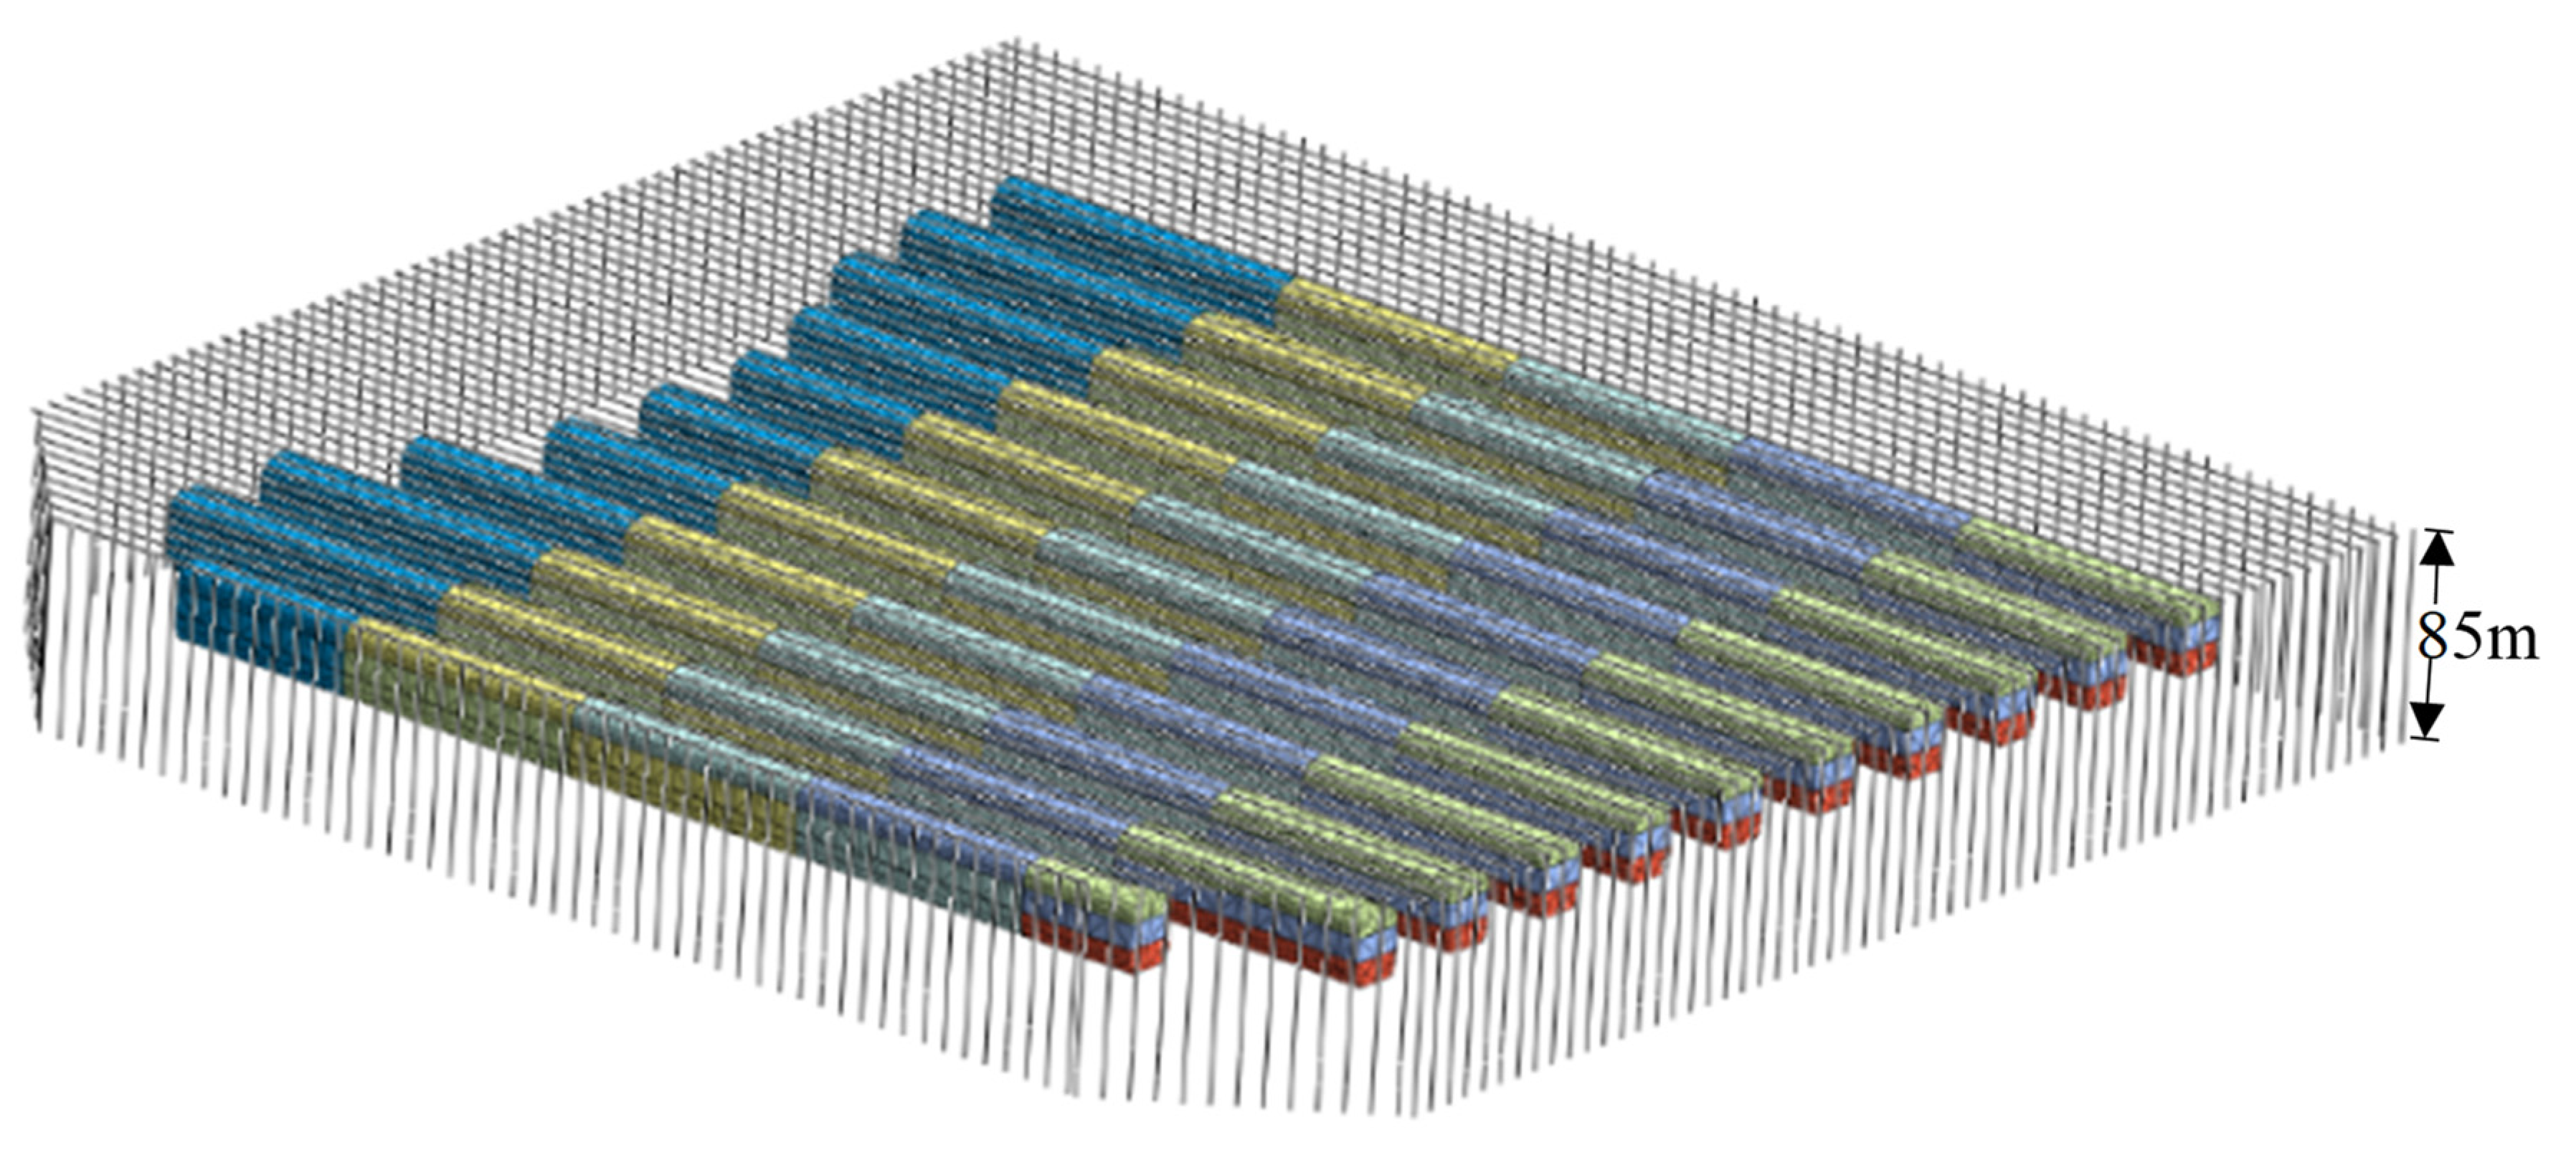
3.1. Hydrogeological Model
3.2. Governing Equation
3.3. Boundary Conditions
3.4. Material Parameters
4. Results and Discussion
4.1. Seepage Field and Seawater Intrusion in Natural State of Reservoir Site
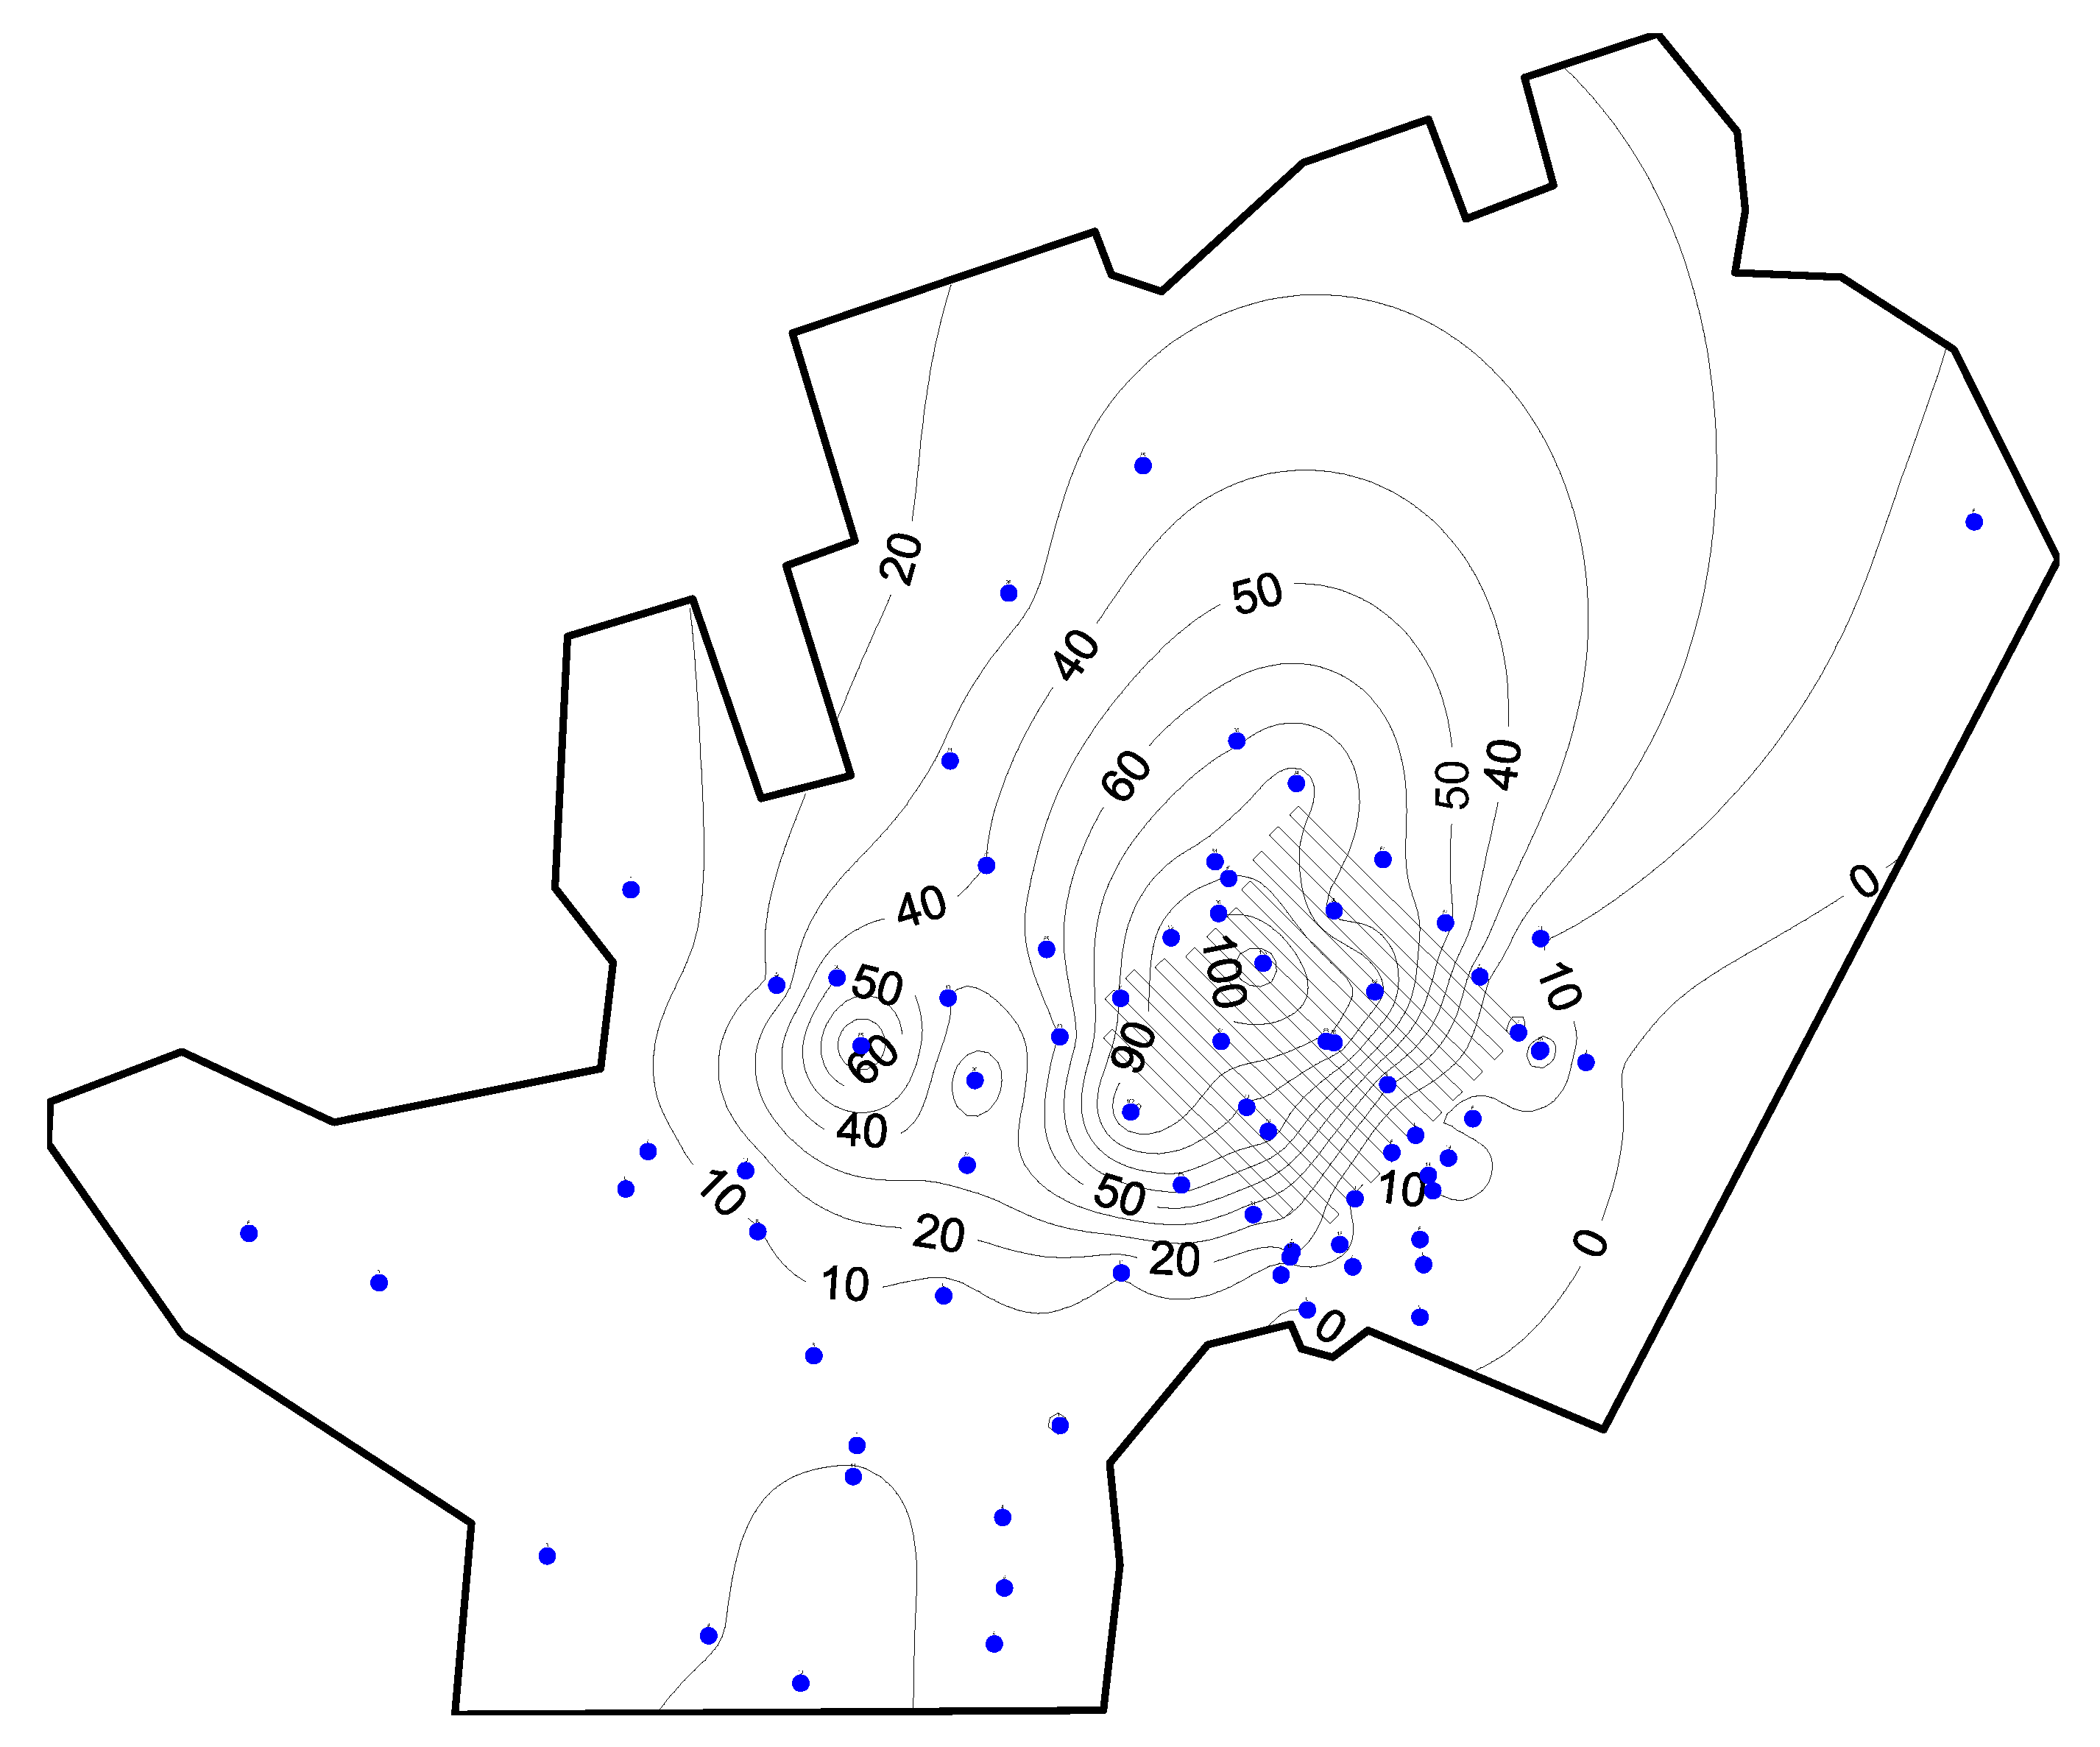
4.1.1. Natural Seepage Field in Reservoir Area
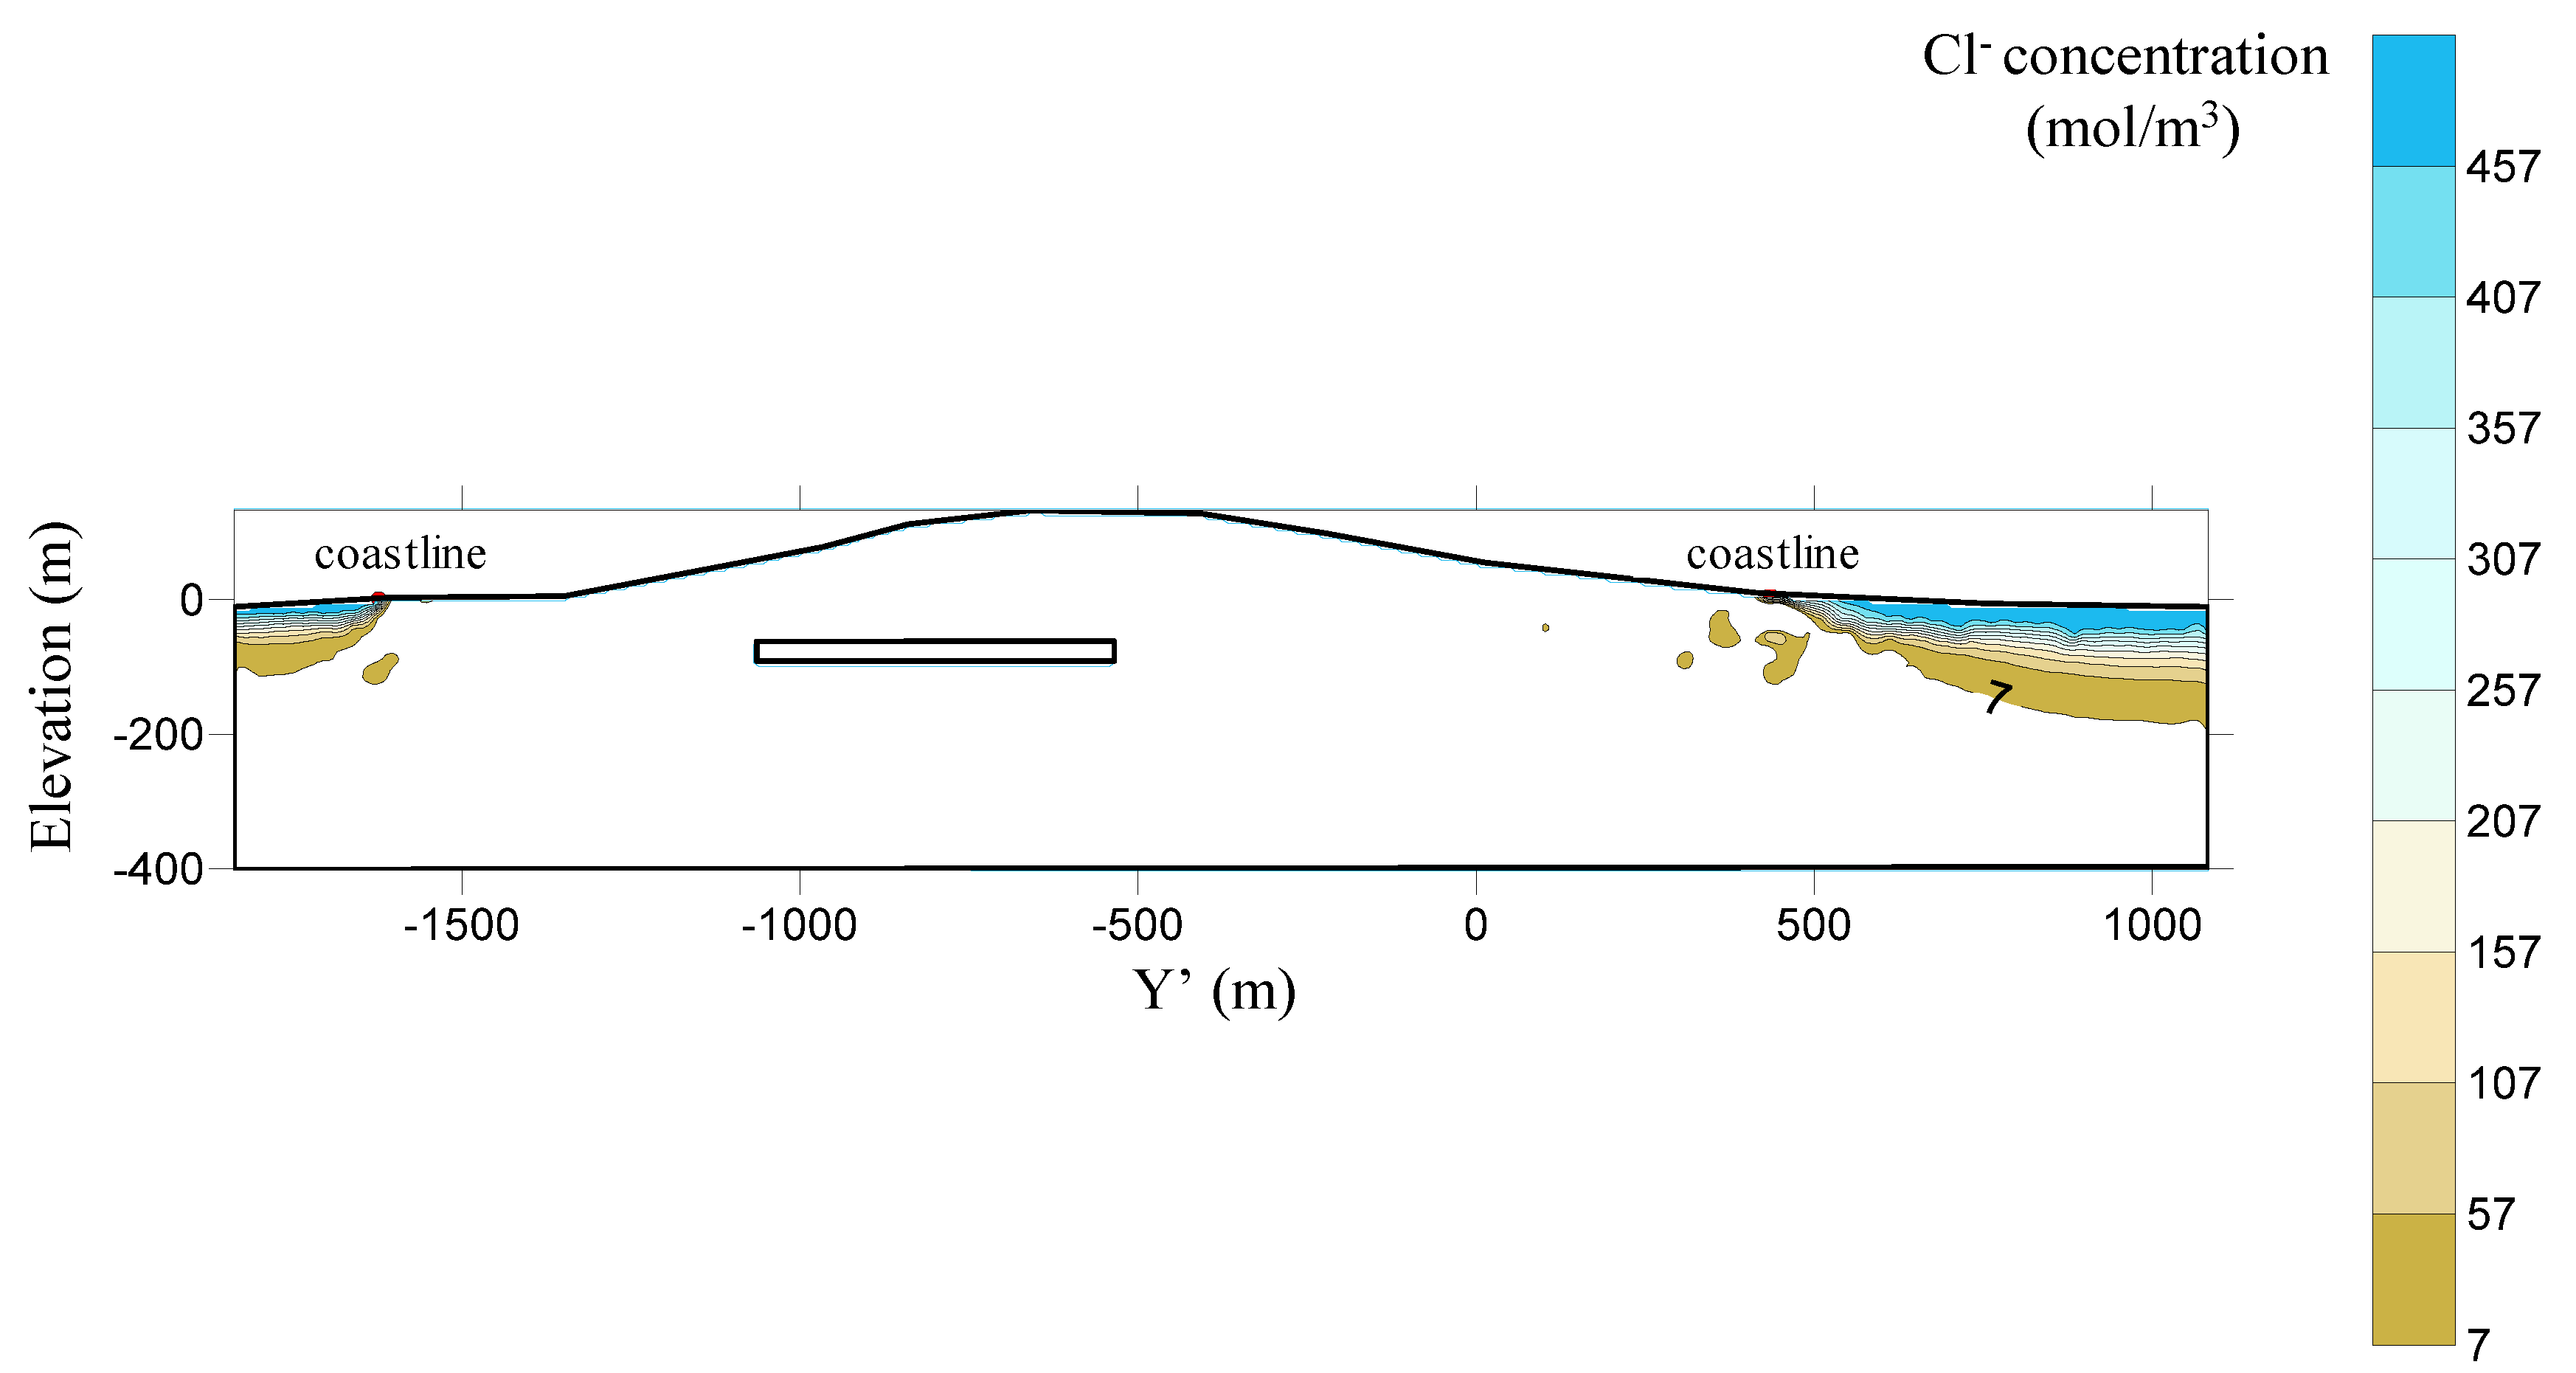
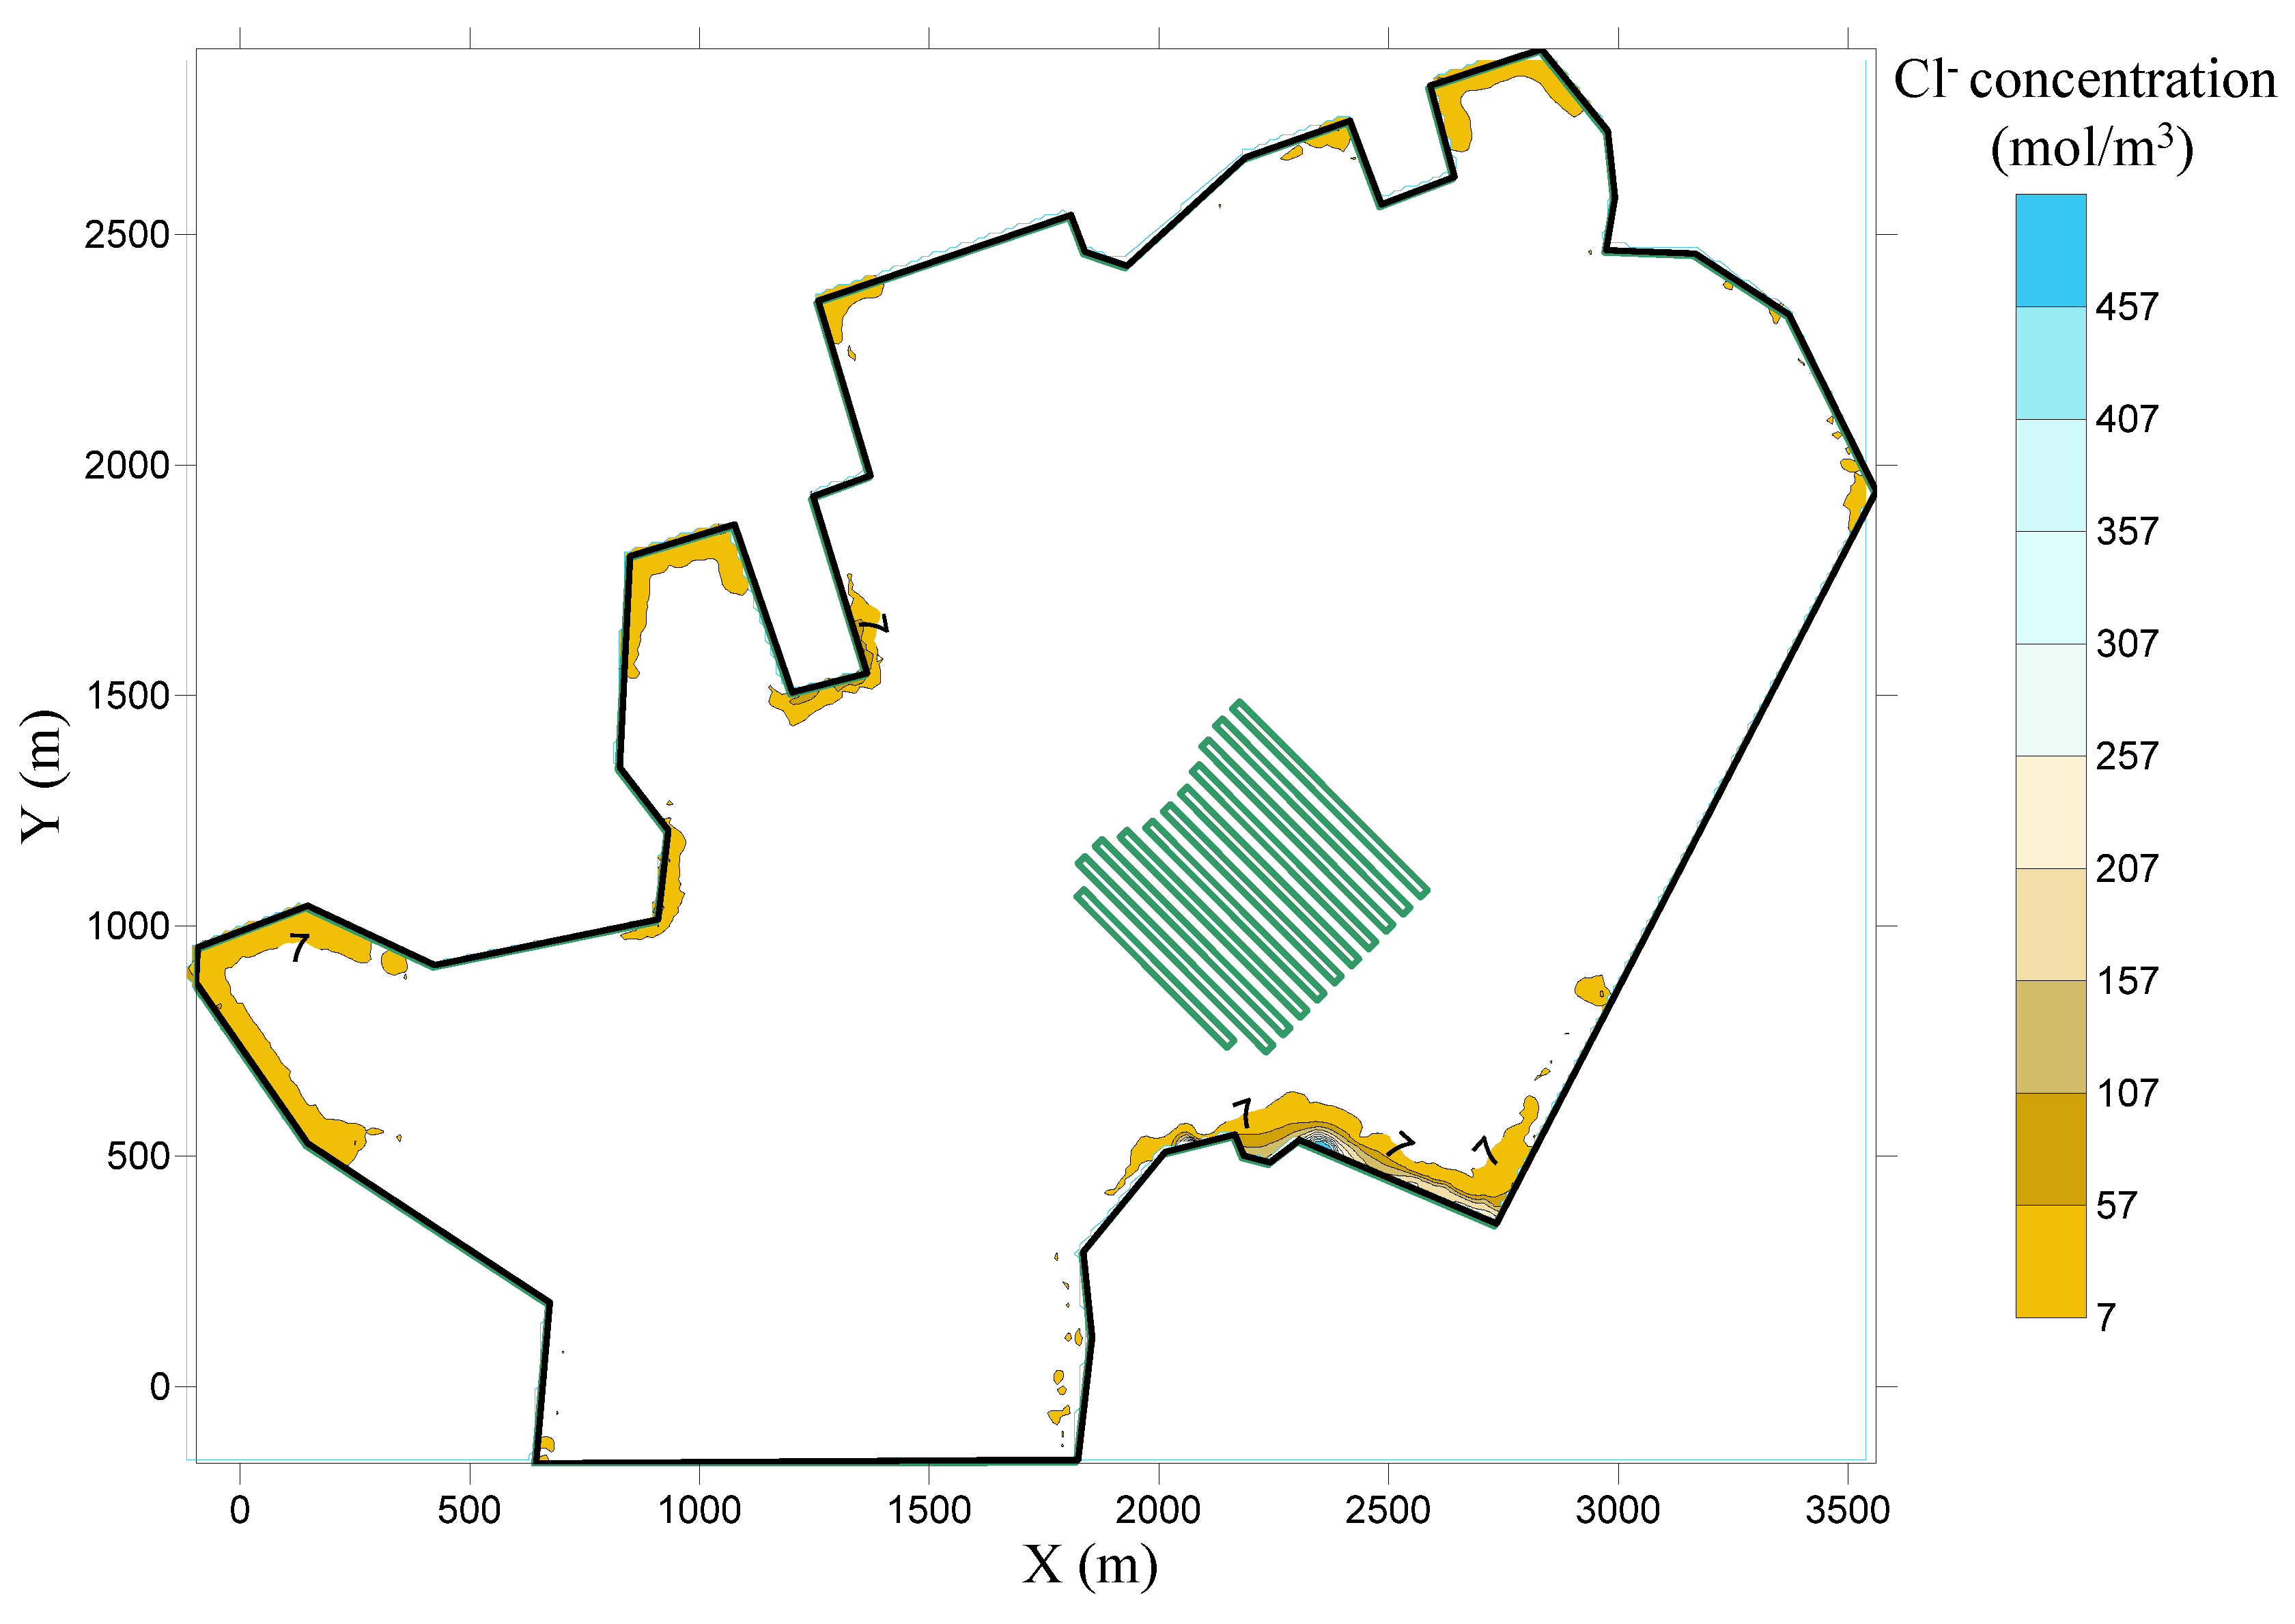
4.1.2. Seawater Intrusion Situation in The Reservoir Area before Construction
4.2. Unsteady Seepage Field and Seawater Intrusion Risk during the Cavern Construction
4.2.1. Unsteady Seepage Field
4.2.2. Seawater Intrusion Risk during Construction
4.3. Seawater Intrusion Risk and Control during the Cavern Operation
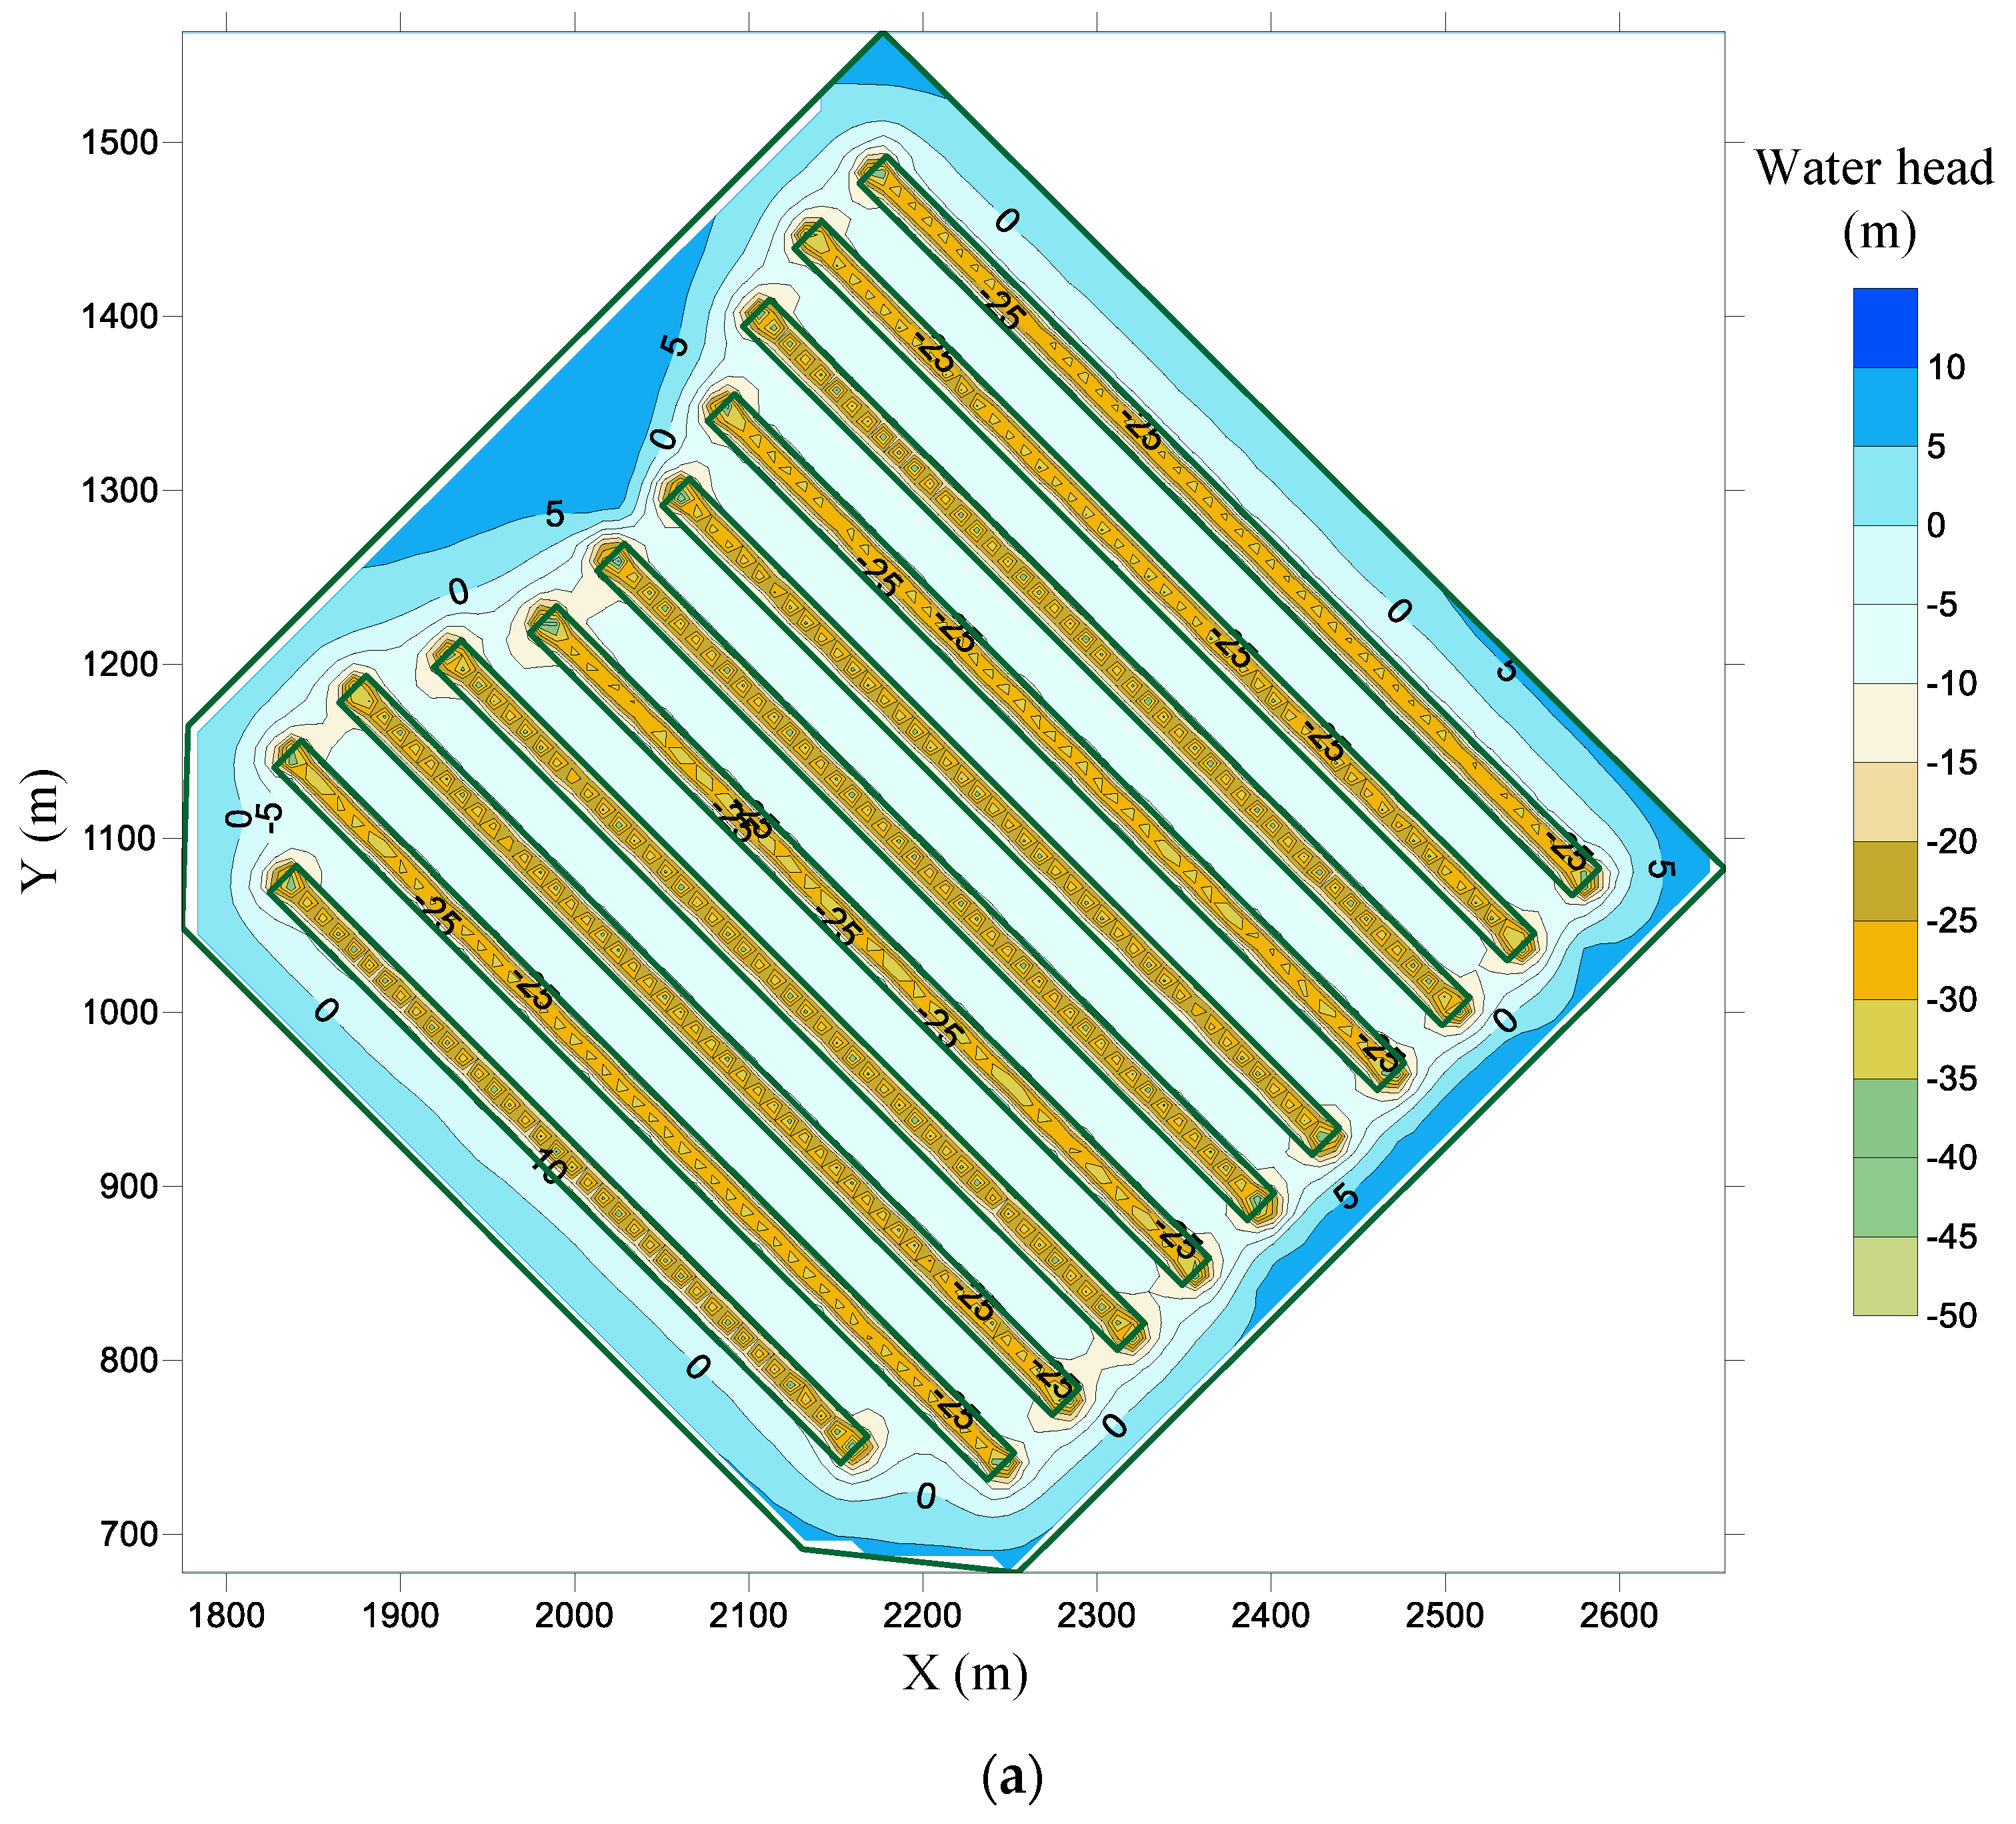
4.3.1. Seepage Field and Seawater Intrusion Risk with Horizontal Water Curtain System
- (1)
- Steady seepage field during operation
- (2)
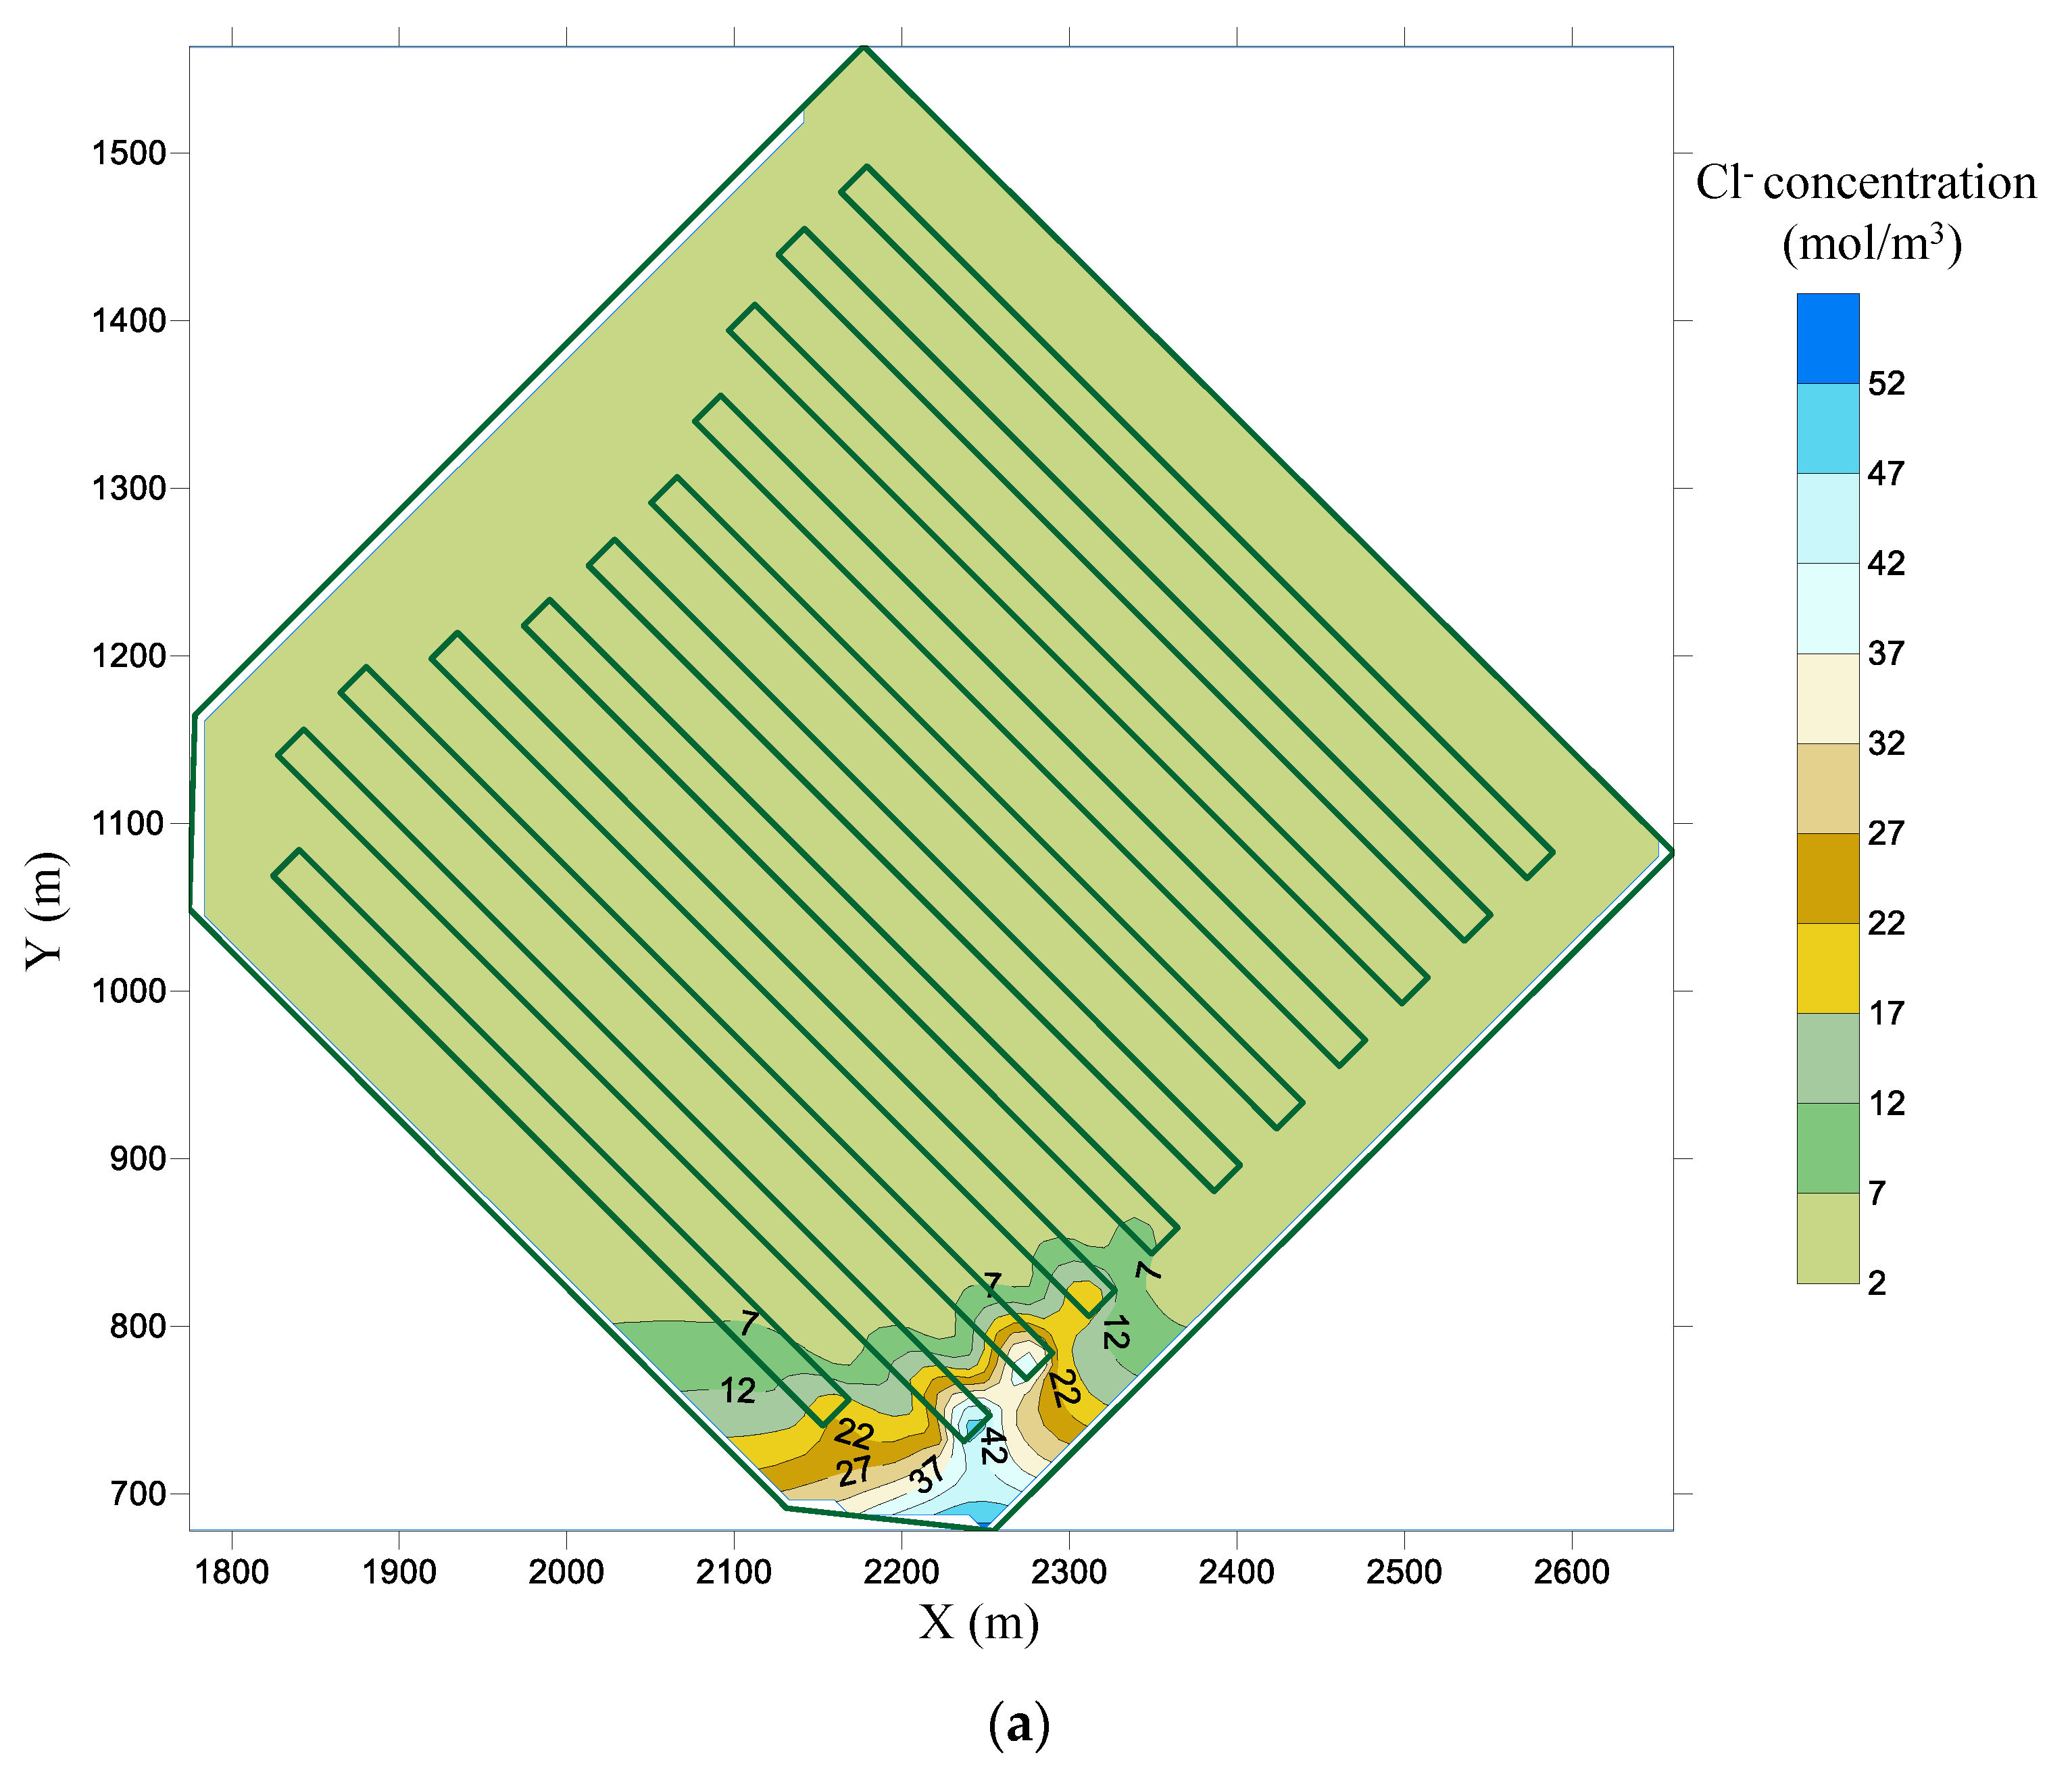
- Seawater intrusion risk
4.3.2. Seepage Field and Seawater Intrusion Risk with Horizontal and Vertical Water Curtain Systems
5. Conclusions
- (1)
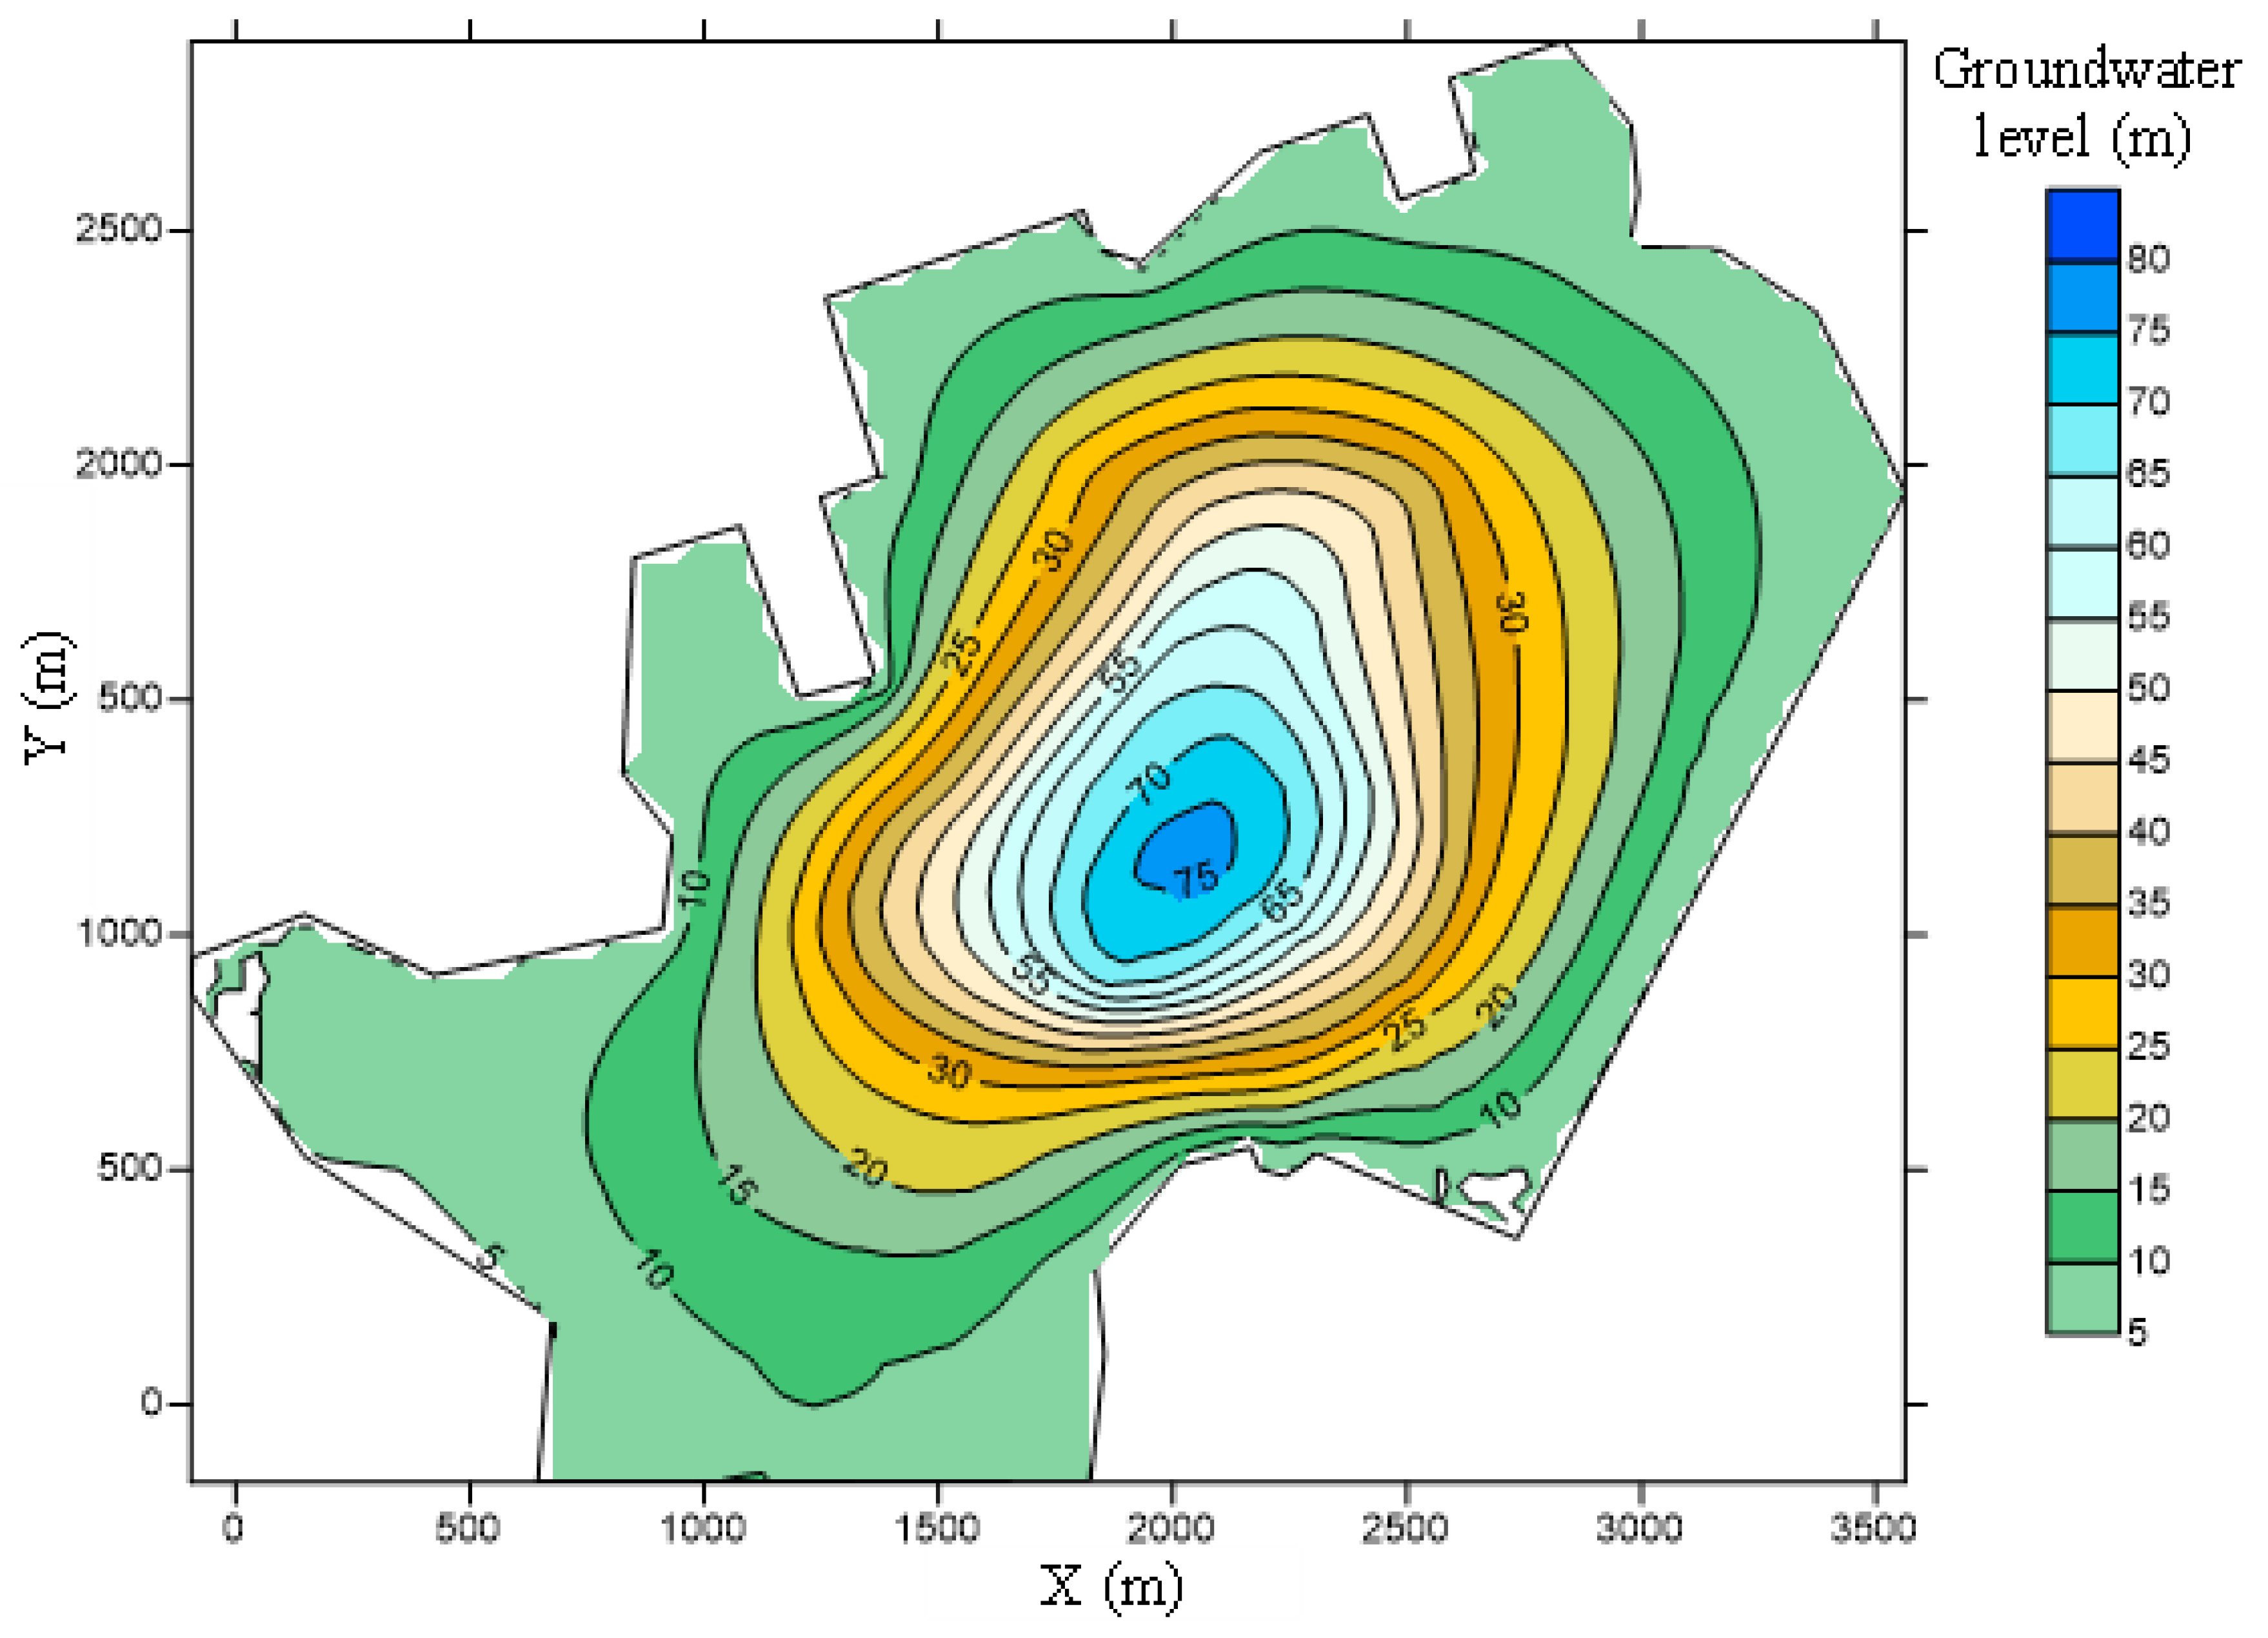
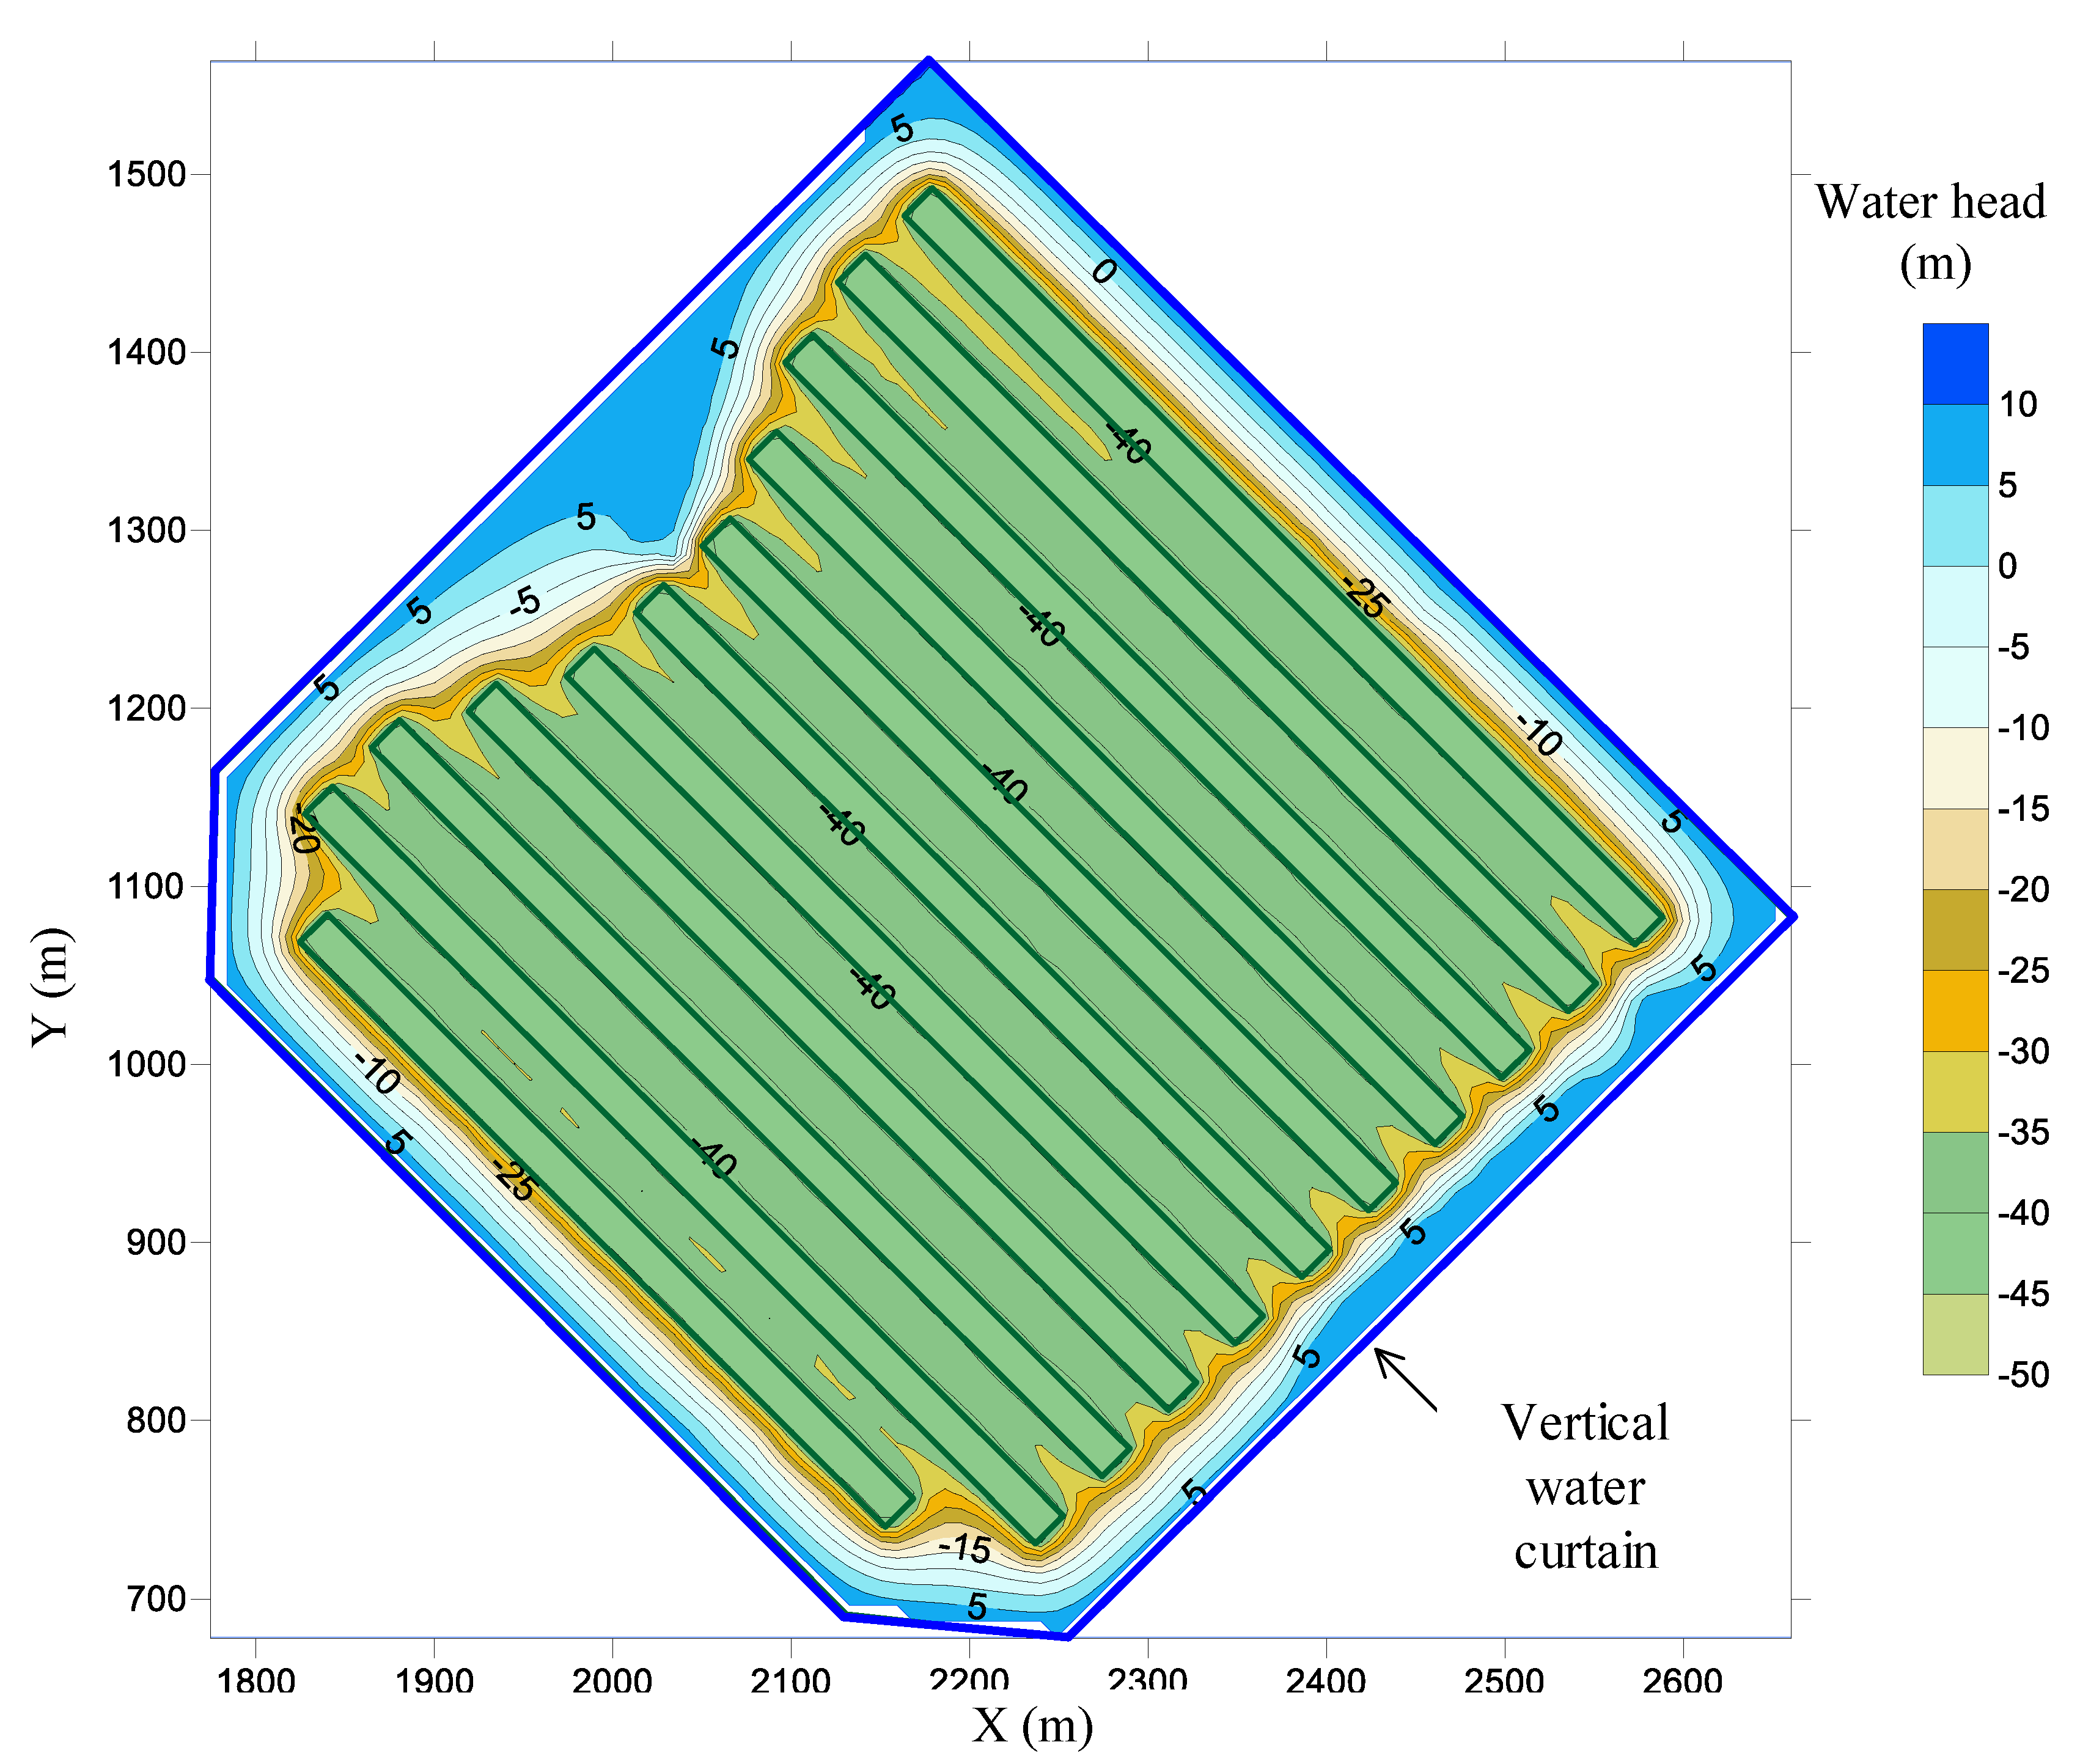
- The measured water level on the northwest side of the top of the cave is the highest, while it is significantly lower on the southeast side. Based on the inversion of the measurement data, the modeled natural seepage field is obtained as the initial seepage field prior to excavation. There is no threat of saltwater intrusion under natural conditions since the Cl− concentration in the cavern region is less than 7 mol/m3.
- (2)
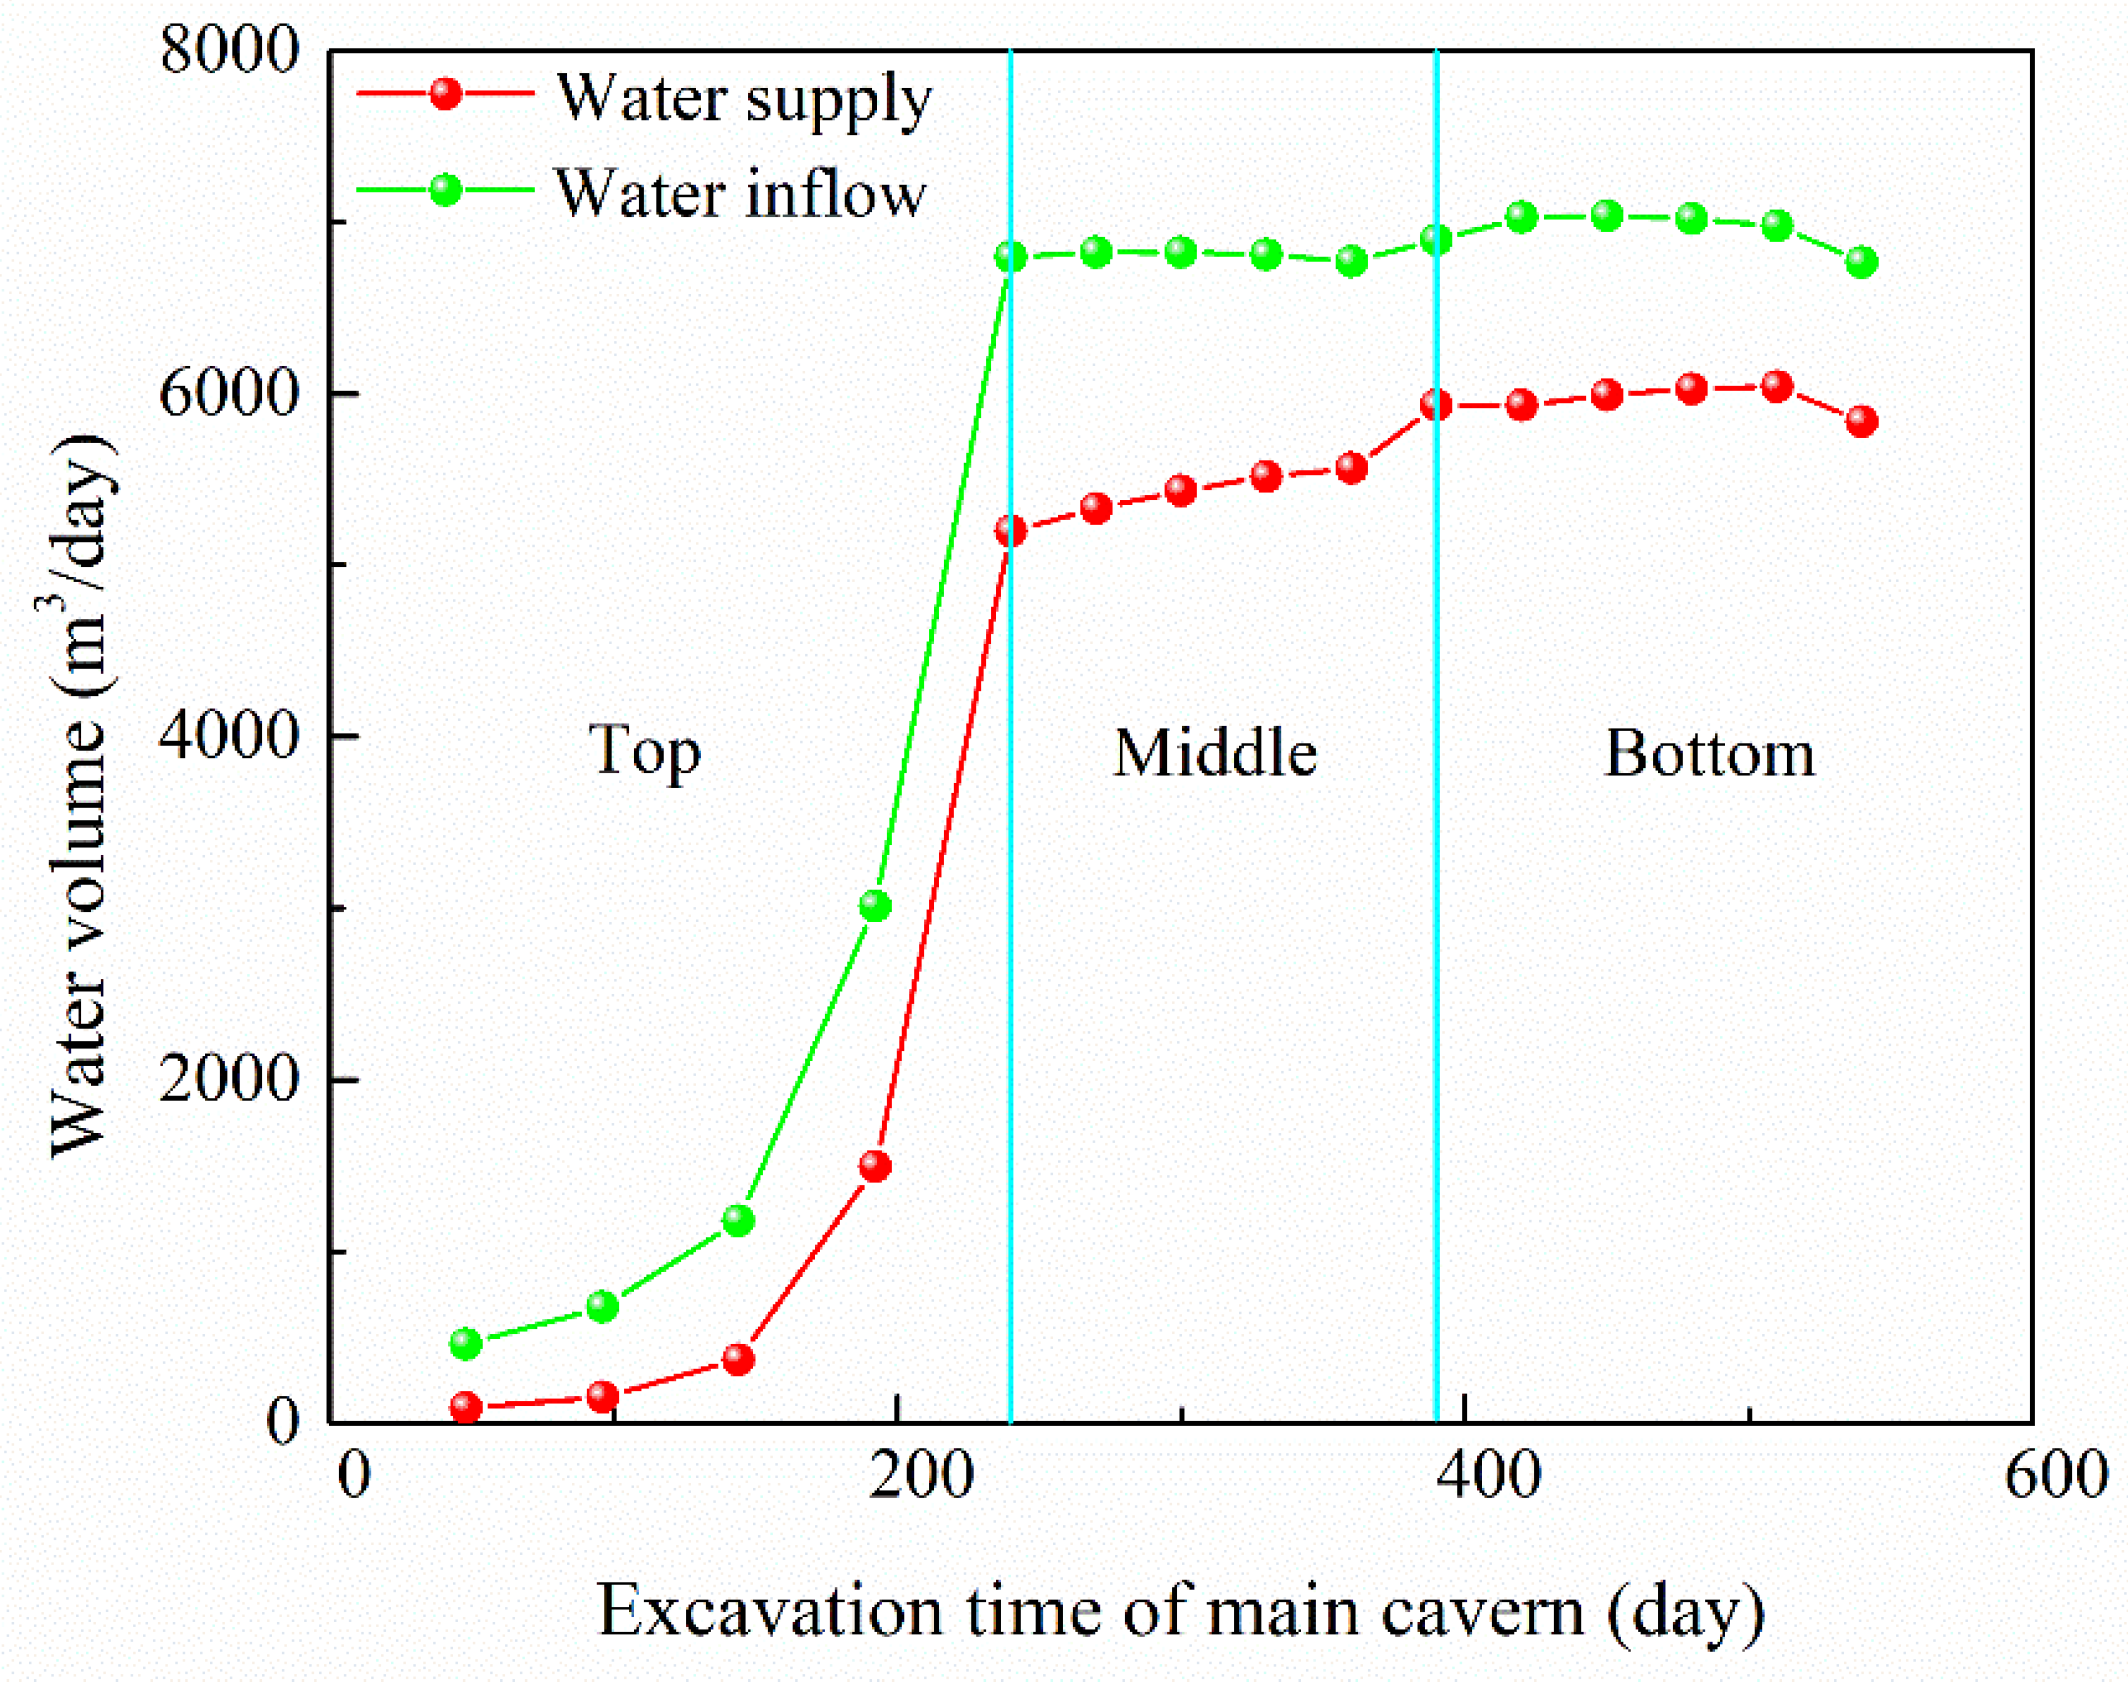
- The water inflows after excavating the top, middle, and bottom levels of the main cavern are 6797 m3/day, 6895 m3/day, and 6767 m3/day, respectively, under realistic permeability coefficient zoning and high tide conditions. The highest water supply from the water curtain during excavation is 6039 m3/day, which is less than the cavern’s water inflow. Although the flow direction close to the cavern is still from inland to the sea, the water level in the reservoir region reduced noticeably throughout the excavation phase, leading to the enhancement of dispersion from seawater to freshwater. This suggests minimal seawater intrusion risk during the excavation period.
- (3)
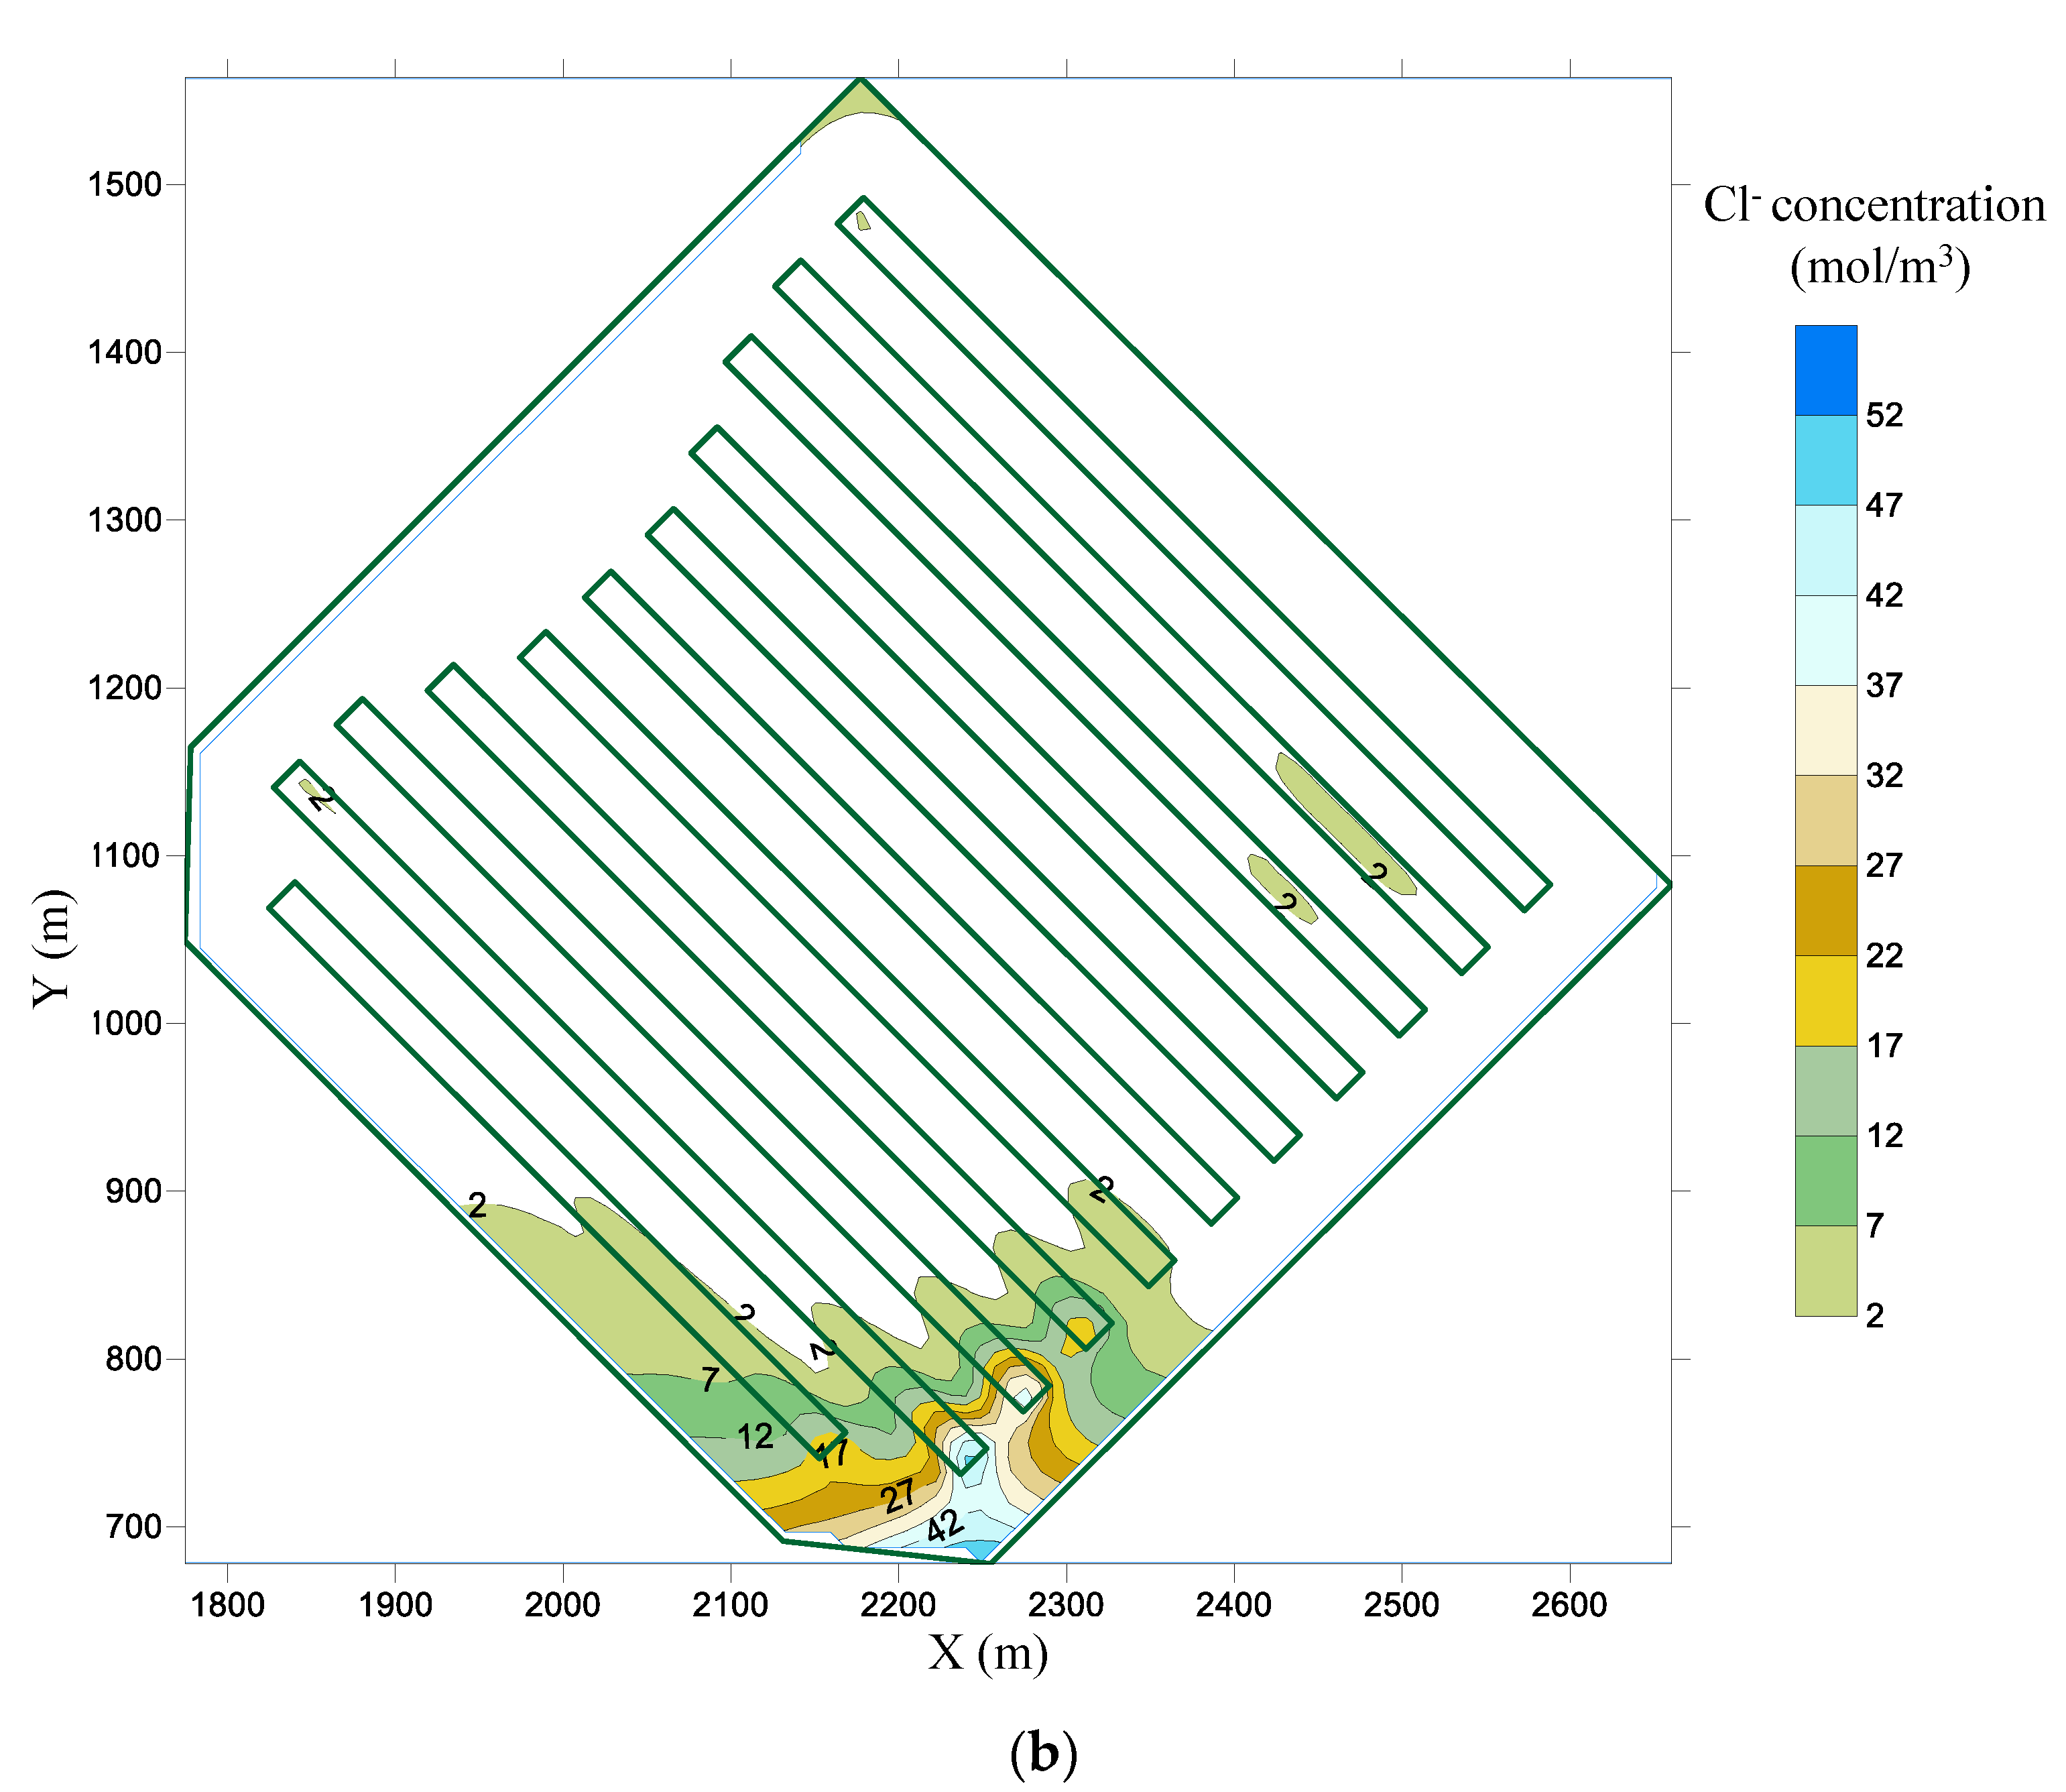
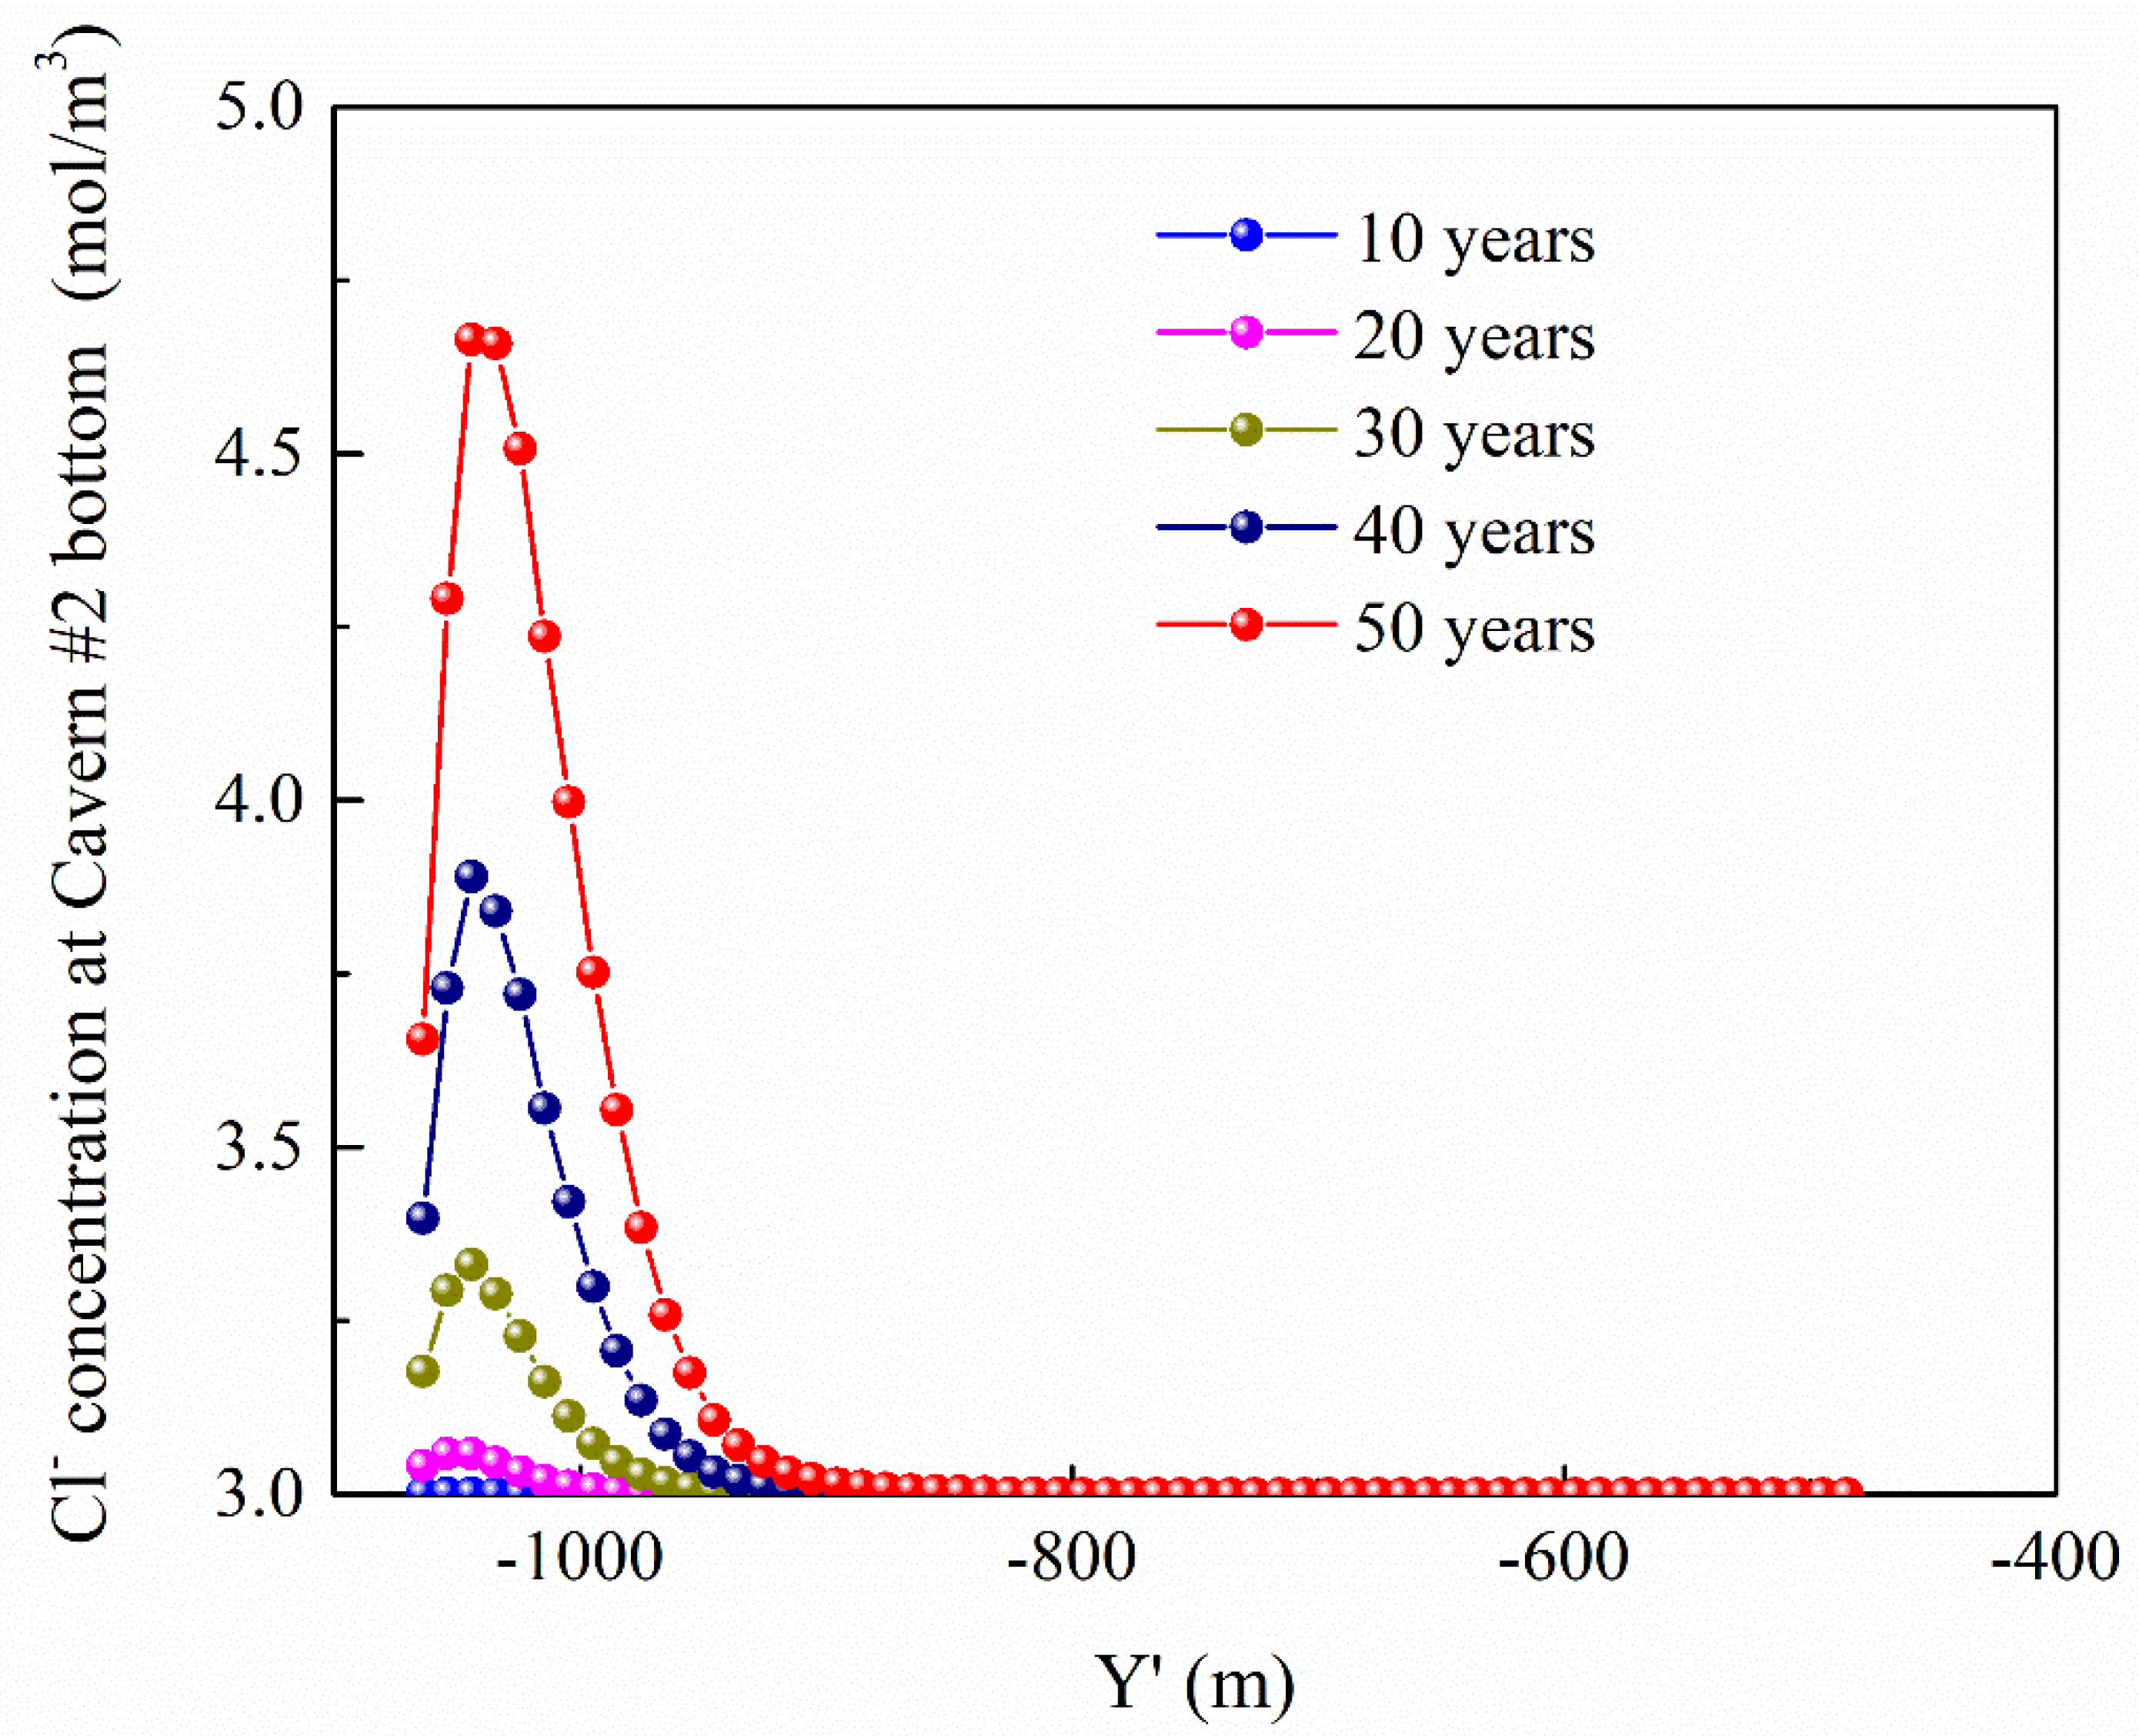
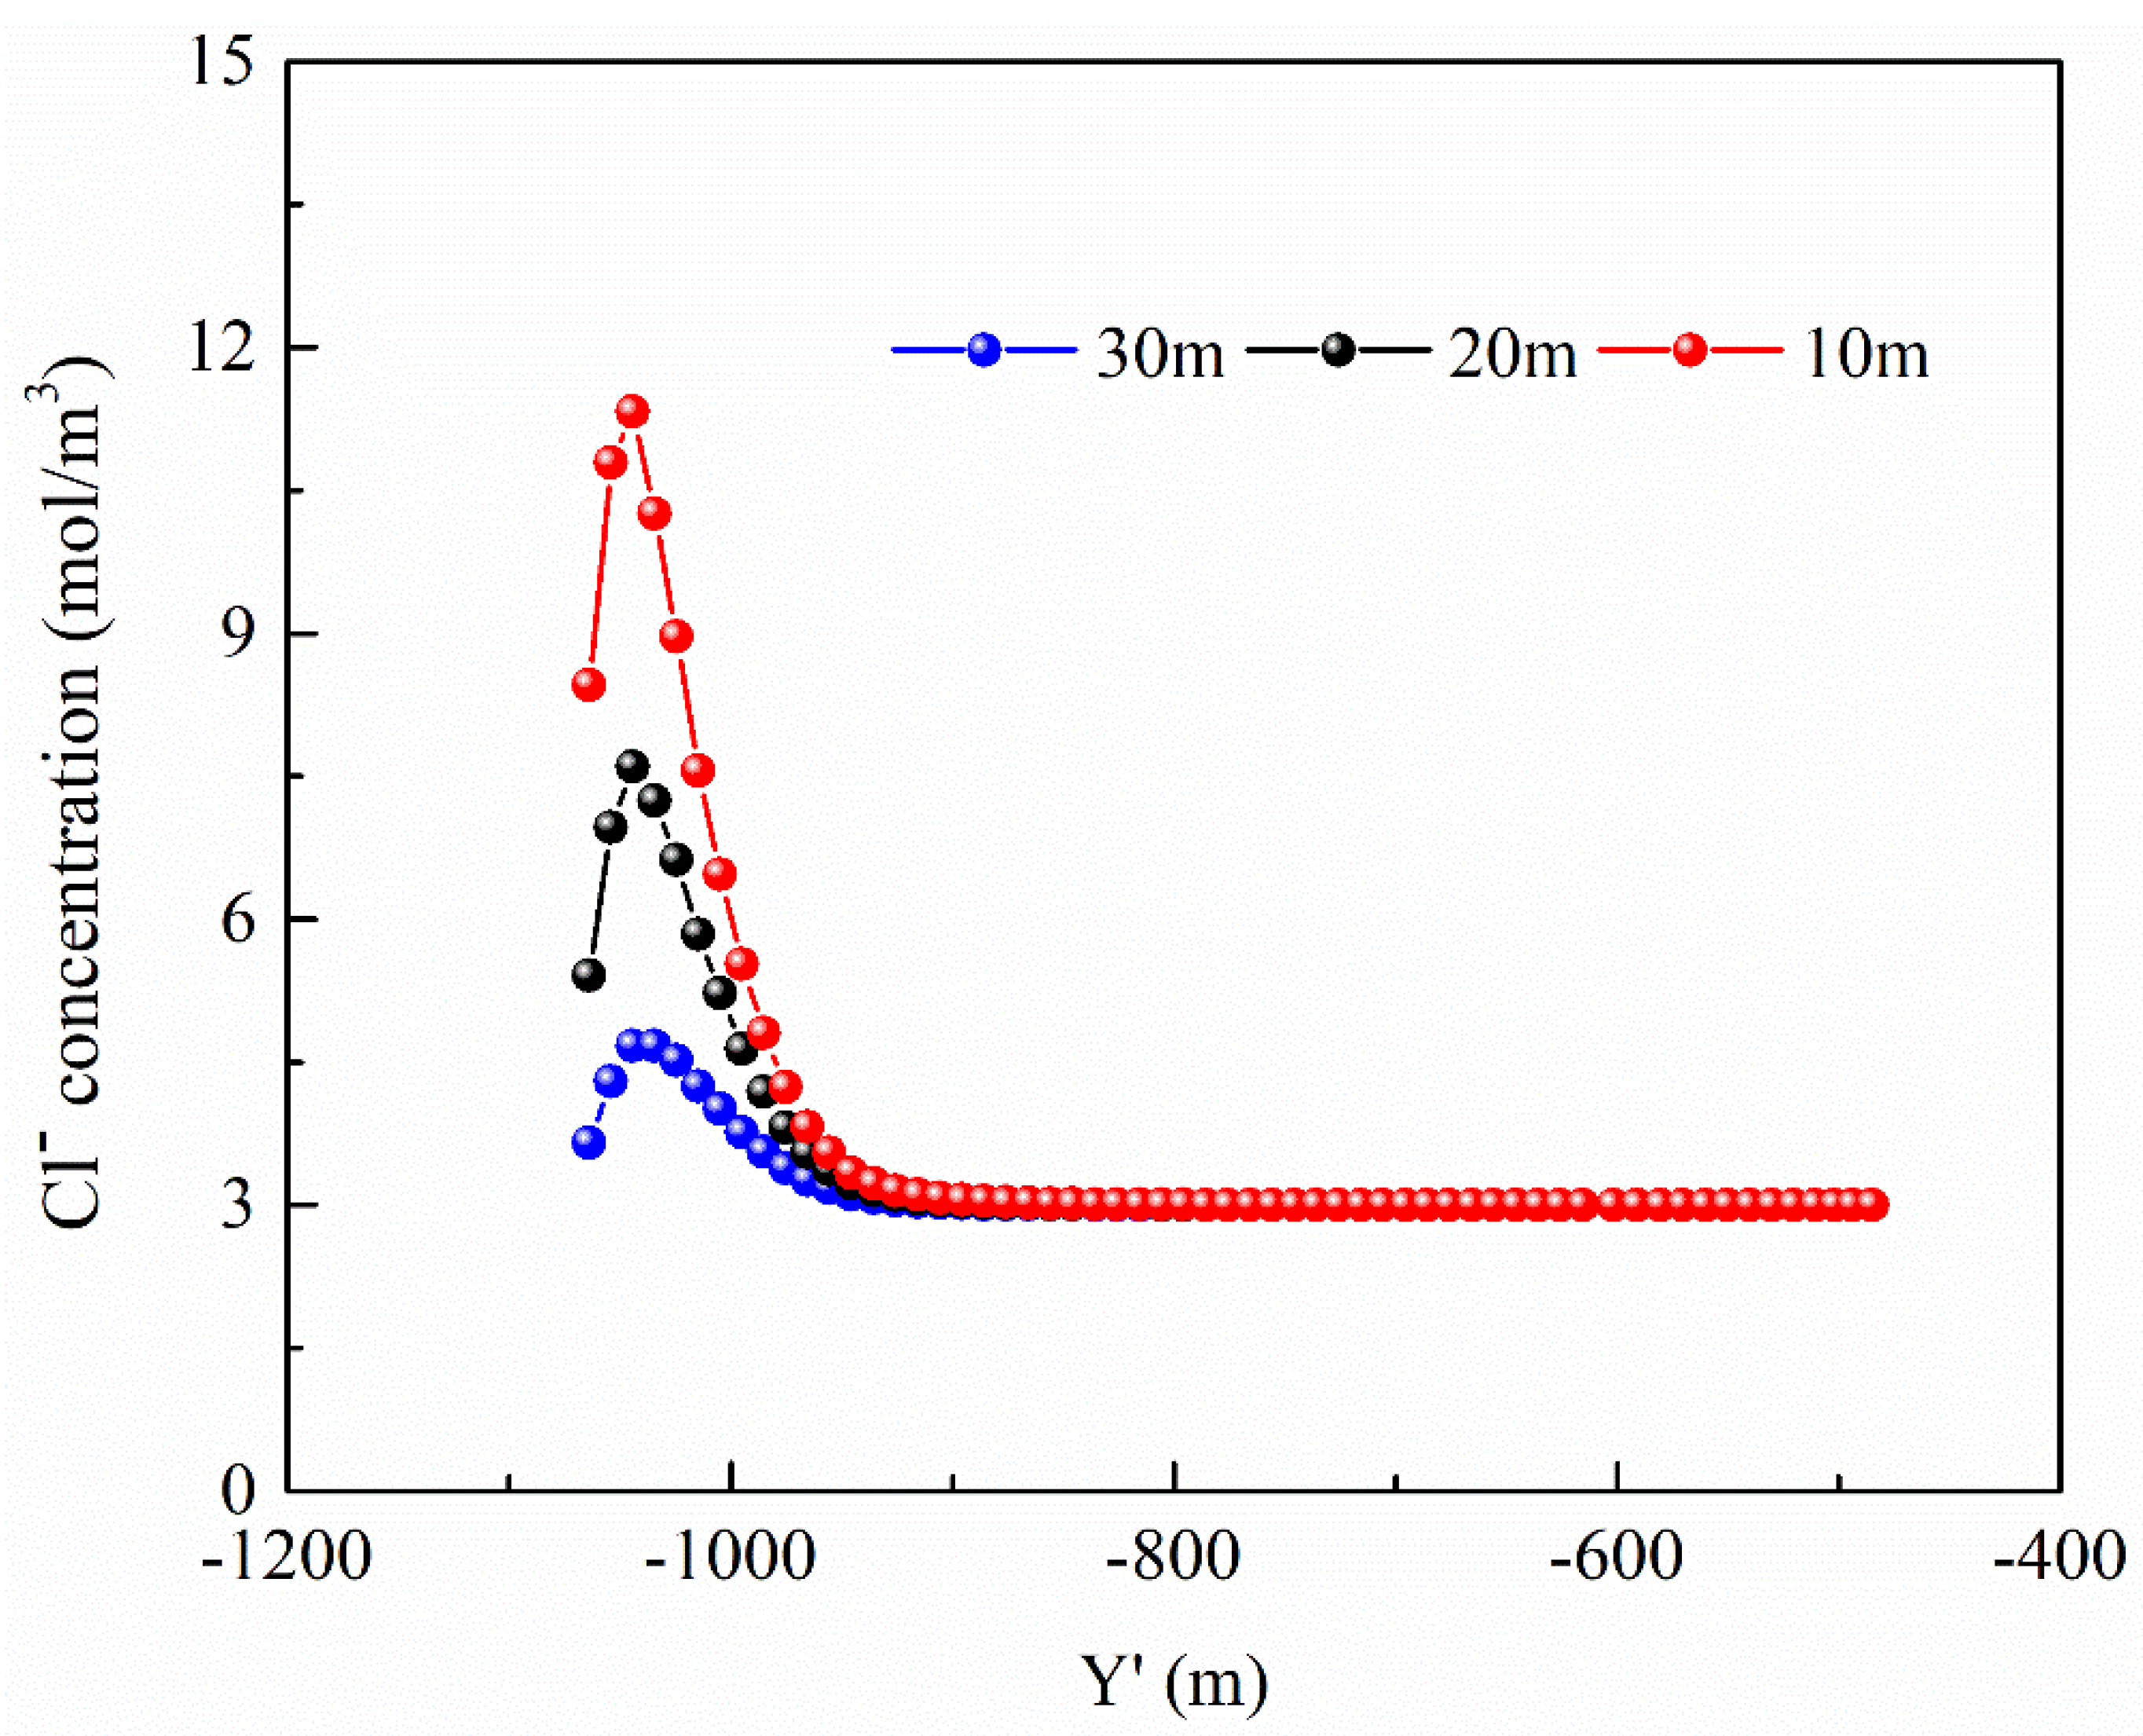
- The southeast of the reservoir area has the highest seawater invasion risk. When the horizontal curtain system is deployed solely, the Cl− concentration on the southeast side of the cavern group exceeds 7 mol/m3 after 18 years of operation, and moderate corrosion occurs in 50 years. If an additional vertical curtain system is implemented on the southeast side of the cavern group, the seawater intrusion can be effectively prevented to extend the cavern’s service life.
Author Contributions
Funding
Data Availability Statement
Conflicts of Interest
References
- Bai, Y.; Zhou, D.; Zhou, P. Modeling and analysis of oil import tariff and stockpile policies for coping with supply disruptions. Appl. Energy 2012, 97, 84–90. [Google Scholar] [CrossRef]
- Dou, M.; Zou, S.; Li, H.; Qing, F.; Huang, F.; Liao, X. Research Status and Prospects of Key Technologies for Underground Water-sealed Oil Storage Cave. IOP Conf. Ser. Earth Environ. Sci. 2020, 508, 012097. [Google Scholar] [CrossRef]
- Makita, T.; Miyanaga, Y.; Iguchi, K.; Hatano, T. Underground oil storage facilities in Japan. Eng. Geol. 1993, 35, 191–198. [Google Scholar] [CrossRef]
- Li, Y.; Zhang, G.; Liu, Y.; Zhou, C. A numerical procedure for modeling the seepage field of water-sealed underground oil and gas storage caverns. Tunn. Undergr. Space Technol. 2017, 66, 56–63. [Google Scholar] [CrossRef]
- Xue, Y.; Li, S.; Qiu, D.; Wang, Z.; Li, Z.; Tian, H.; Su, M.; Yang, W.; Lin, C.; Zhu, J. A new evaluation method for site selection of large underground water-sealed petroleum storage depots. Sci. China Technol. Sci. 2015, 58, 967–978. [Google Scholar] [CrossRef]
- Shi, L.; Zhang, B.; Wang, L.; Wang, H.; Zhang, H. Functional efficiency assessment of the water curtain system in an underground water-sealed oil storage cavern based on time-series monitoring data. Eng. Geol. 2018, 239, 79–95. [Google Scholar] [CrossRef]
- Werner, A.; Bakker, M.; Post, V.; Vandenbohede, A.; Lu, C.; AtaieAshatiani, B.; Simmons, C.Y.; Barry, D.A. Seawater intrusion processes, investigation and management: Recent advances and future challenges. Adv. Water Resour. 2013, 51, 3–26. [Google Scholar] [CrossRef]
- Lee, J.; Cho, B. Submarine groundwater discharge into the coast revealed by water chemistry of manmade undersea liquefied petroleum gas cavern. J. Hydrol. 2008, 360, 195–206. [Google Scholar] [CrossRef]
- Kim, J.; Kim, R.; Lee, J.; Chang, H. Hydrogeochemical characterization of major factors affecting the quality of shallow groundwater in the coastal area at Kimje in South Korea. Environ. Geol. 2003, 44, 478–489. [Google Scholar] [CrossRef]
- Jo, Y.; Lee, J.; Choi, M.; Cho, B. Characteristics of seepage water and groundwater in Incheon Coastal LPG storage cavern. J. Eng. Geol. 2010, 20, 1–12. [Google Scholar]
- Lim, J.; Lee, E.; Moon, H.; Lee, K. Integrated investigation of seawater intrusion around oil storage caverns in a coastal fractured aquifer using hydrogeochemical and isotopic data. J. Hydrol. 2013, 486, 202–210. [Google Scholar] [CrossRef]
- Lee, E.; Lim, J.; Moon, H.; Lee, K. Assessment of seawater intrusion into underground oil storage cavern and prediction of its sustainability. Environ. Earth. Sci. 2015, 73, 1179–1190. [Google Scholar] [CrossRef]
- Park, H.; Jang, K.; Ju, J.; Yeo, I. Hydrogeological characterization of seawater intrusion in tidally-forced coastal fractured bedrock aquifer. J. Hydrol. 2012, 446, 77–89. [Google Scholar] [CrossRef]
- Li, S.; Zhang, L.; Ma, X.; Xue, Y.; Jiang, Y. Space-time evolution behaviour of seepage field around a large underground petroleum storage caverns with groundwater curtaining. Rock. Soil. Mech. 2013, 34, 1979–1986. [Google Scholar]
- Cui, S.; Guo, S.; Gao, J. Research on water inflow into underground water sealed cave based on unsaturated flow. Chin. J. Undergr. Space. Eng. 2017, 13, 746–751. [Google Scholar]
- Kharroubi, A.; Farhat, S.; Agoubi, B.; Lakhbir, Z. Assessment of water qualities and evidence of seawater intrusion in a deep confined aquifer: Case of the coastal Djeffara aquifer (Southern Tunisia). J. Water Supply Res Technol. 2014, 63, 76. [Google Scholar] [CrossRef]
- Papadopoulou, M.P.; Dokou, Z.; Karatzas, G.P.; Zahariadi, C.I. Estimation of Seawater Intrusion Front in a Coastal Karstified System Using a Density-Dependent Flow Approach; Environmental Hydraulics–Christodoulou & Stamou, Ed.; Taylor & Francis Group: London, UK, 2010. [Google Scholar]
- Despina, K.; Maria, K.; Filippos, V.; Pantelis, S.; Stephen, K.; Nikos, L.S. A Transient ElectroMagnetic (TEM) Method Survey in North-Central Coast of Crete, Greece: Evidence of Seawater Intrusion. Geosciences 2018, 8, 107. [Google Scholar]
- Yan, F.; He, T.; Fan, W. Failure Mechanism of Subgrade When Surface Water Infiltrating through Fault and Fissure. In Proceedings of the 2011 International Symposium on Water Resource and Environmental Protection, ISWREP, Xi’an, China, 20–22 May 2011; pp. 426–429. [Google Scholar]
- Wang, F.; Jiang, X.; Niu, J. Numerical Simulation for Dynamic Response Characteristics of Tunnel near Fault. Electron. J. Geotech. Eng. 2016, 21, 5559–5576. [Google Scholar]
- Huyakorn, P.; Andersen, P.; Mercer, J.; White, H. Saltwater intrusion in aquifers: Development andtesting of a three-dimensional finite element model. Water Resour. Res. 1987, 23, 293–312. [Google Scholar] [CrossRef]
- Liu, H.; Qiao, L.; Wang, S.; Li, W.; Liu, J.; Wang, Z. Quantifying the containment efficiency of underground water-sealed oil storage caverns: Method and case study. Tunn. Undergr. Space Technol. 2021, 110, 103797. [Google Scholar] [CrossRef]
- Qiu, D.; Fu, K.; Xue, Y.; Li, Z.; Ning, Z.; Zhou, B. Seepage field prediction of underground water-sealed oil storage cavern based on long short-term memory model. Environ. Earth. Sci. 2021, 80, 561. [Google Scholar] [CrossRef]
- Li, Y.; Zhang, B.; Shi, L.; Ye, Y. Dynamic variation characteristics of seawater intrusion in underground water-sealed oil storage cavern under island tidal environment. Water 2019, 11, 130. [Google Scholar] [CrossRef] [Green Version]
- Wang, Z.; Li, W.; Li, Z.; Liu, X.; Liang, J.; Zhong, S. Groundwater response to oil storage in large-scale rock caverns with a water curtain system: Site monitoring and statistical analysis. Tunn. Undergr. Space Technol. 2020, 99, 103363. [Google Scholar] [CrossRef]
- Zhang, B.; Shi, L.; Yu, X.; Qi, S. Assessing the water-sealed safety of an operating underground crude oil storage adjacent to a new similar cavern—A case study in China. Eng. Geol. 2019, 249, 257–272. [Google Scholar] [CrossRef]
- Hosseini, N.; Bajalan, Z.; Khoei, A. Numerical modeling of density-driven solute transport in fractured porous media with the extended finite element method. Adv. Water Resour. 2020, 136, 103453. [Google Scholar] [CrossRef]
- Dai, Y.; Zhou, Z. Steady seepage simulation of underground oil storage caverns based on Signorini type variational inequality formulation. Geosci. J. 2015, 19, 341–355. [Google Scholar] [CrossRef]
- Li, W.; Wang, Z.; Qiao, L.; Liu, H.; Yang, J. Determination of the optimal spacing of water curtain boreholes for underground oil storage from the perspective of percolation theory. Tunn. Undergr. Space Technol. 2020, 97, 103246. [Google Scholar] [CrossRef]
- Xu, Z.; Gao, B.; Li, S.; Zhang, L.; Zhao, S.; Shi, X. A groundwater seal evaluation method based on water inflow for underground oil storage caverns. Tunn. Undergr. Space Technol. 2018, 82, 265–277. [Google Scholar] [CrossRef]
- Xue, Y.; Ning, Z.; Qiu, D.; Su, M.-x.; Li, Z.-q.; Kong, F.-m.; Li, G.-k. A study of water curtain parameters of underground oil storage caverns using time series monitoring and numerical simulation. J. Zhejiang Univ. Sci. A. 2021, 22, 165–181. [Google Scholar] [CrossRef]
- University of Science and Technology Beijing. Feasibility Study Report of an Underground Oil Storage Cavern; University of Science and Technology Beijing: Beijing, China, 2020. [Google Scholar]
- Mao, C. Seepage Computation Analysis and Control; China Water & Power Press: Beijing, China, 2003. [Google Scholar]
- Sun, N. Mathematical Modeling of Groundwater Pollution; Geological Publishing House: Beijing, China, 1989; pp. 33–37. [Google Scholar]


| Type of Rock Mass | Permeability Coefficient (m/s) | Specific Yield | Unit Storage Capacity (1/m) |
|---|---|---|---|
| Fault zone | 8.00 × 10⁻⁷ | 0.1 | 2 × 10⁻⁶ |
| Densely jointed zone | 1.00 × 10⁻⁷ | 0.1 | 2 × 10⁻⁶ |
| Gravel soil | 8.00 × 10⁻⁷ | 0.15 | 2 × 10⁻⁶ |
| Strongly weathered monzogranite | 8.00 × 10⁻⁷ | 0.1 | 2 × 10⁻⁶ |
| Strongly weathered gabbro | 8.00 × 10⁻⁷ | 0.1 | 2 × 10⁻⁶ |
| Strongly weathered gneissic granite | 8.00 × 10⁻⁷ | 0.1 | 2 × 10⁻⁶ |
| Moderately weathered gabbro | 3.08 × 10⁻⁷ | 0.02 | 1 × 10⁻⁶ |
| Moderately weathered monzogranite | 3.01 × 10⁻⁷ | 0.02 | 1 × 10⁻⁶ |
| Moderately weathered gneiss granite | 4.52 × 10⁻⁷ | 0.02 | 1 × 10⁻⁶ |
| Slightly weathered gabbro | 8.21 × 10⁻⁹ | 0.002 | 1 × 10⁻⁷ |
| Slightly weathered monzogranite | 2.46 × 10⁻⁸ | 0.002 | 1 × 10⁻⁷ |
| Slightly weathered gneissic granite | 1.27 × 10⁻⁸ | 0.002 | 1 × 10⁻⁷ |
| Water curtain section (elevation between −30 and −37 m) | 4.00 × 10⁻⁸ | 0.002 | 1 × 10⁻⁷ |
| Cavern section (elevation between −62 and 92 m) | 1.00 × 10⁻⁸ | 0.002 | 1 × 10⁻⁷ |
| Between bottom of water curtain and top of cavern (elevation between −37 and −62 m) | 2.00 × 10⁻⁸ | 0.002 | 1 × 10⁻⁷ |
| silt | 3.89 × 10⁻⁷ | 0.0001 | 1 × 10⁻⁸ |
| Continental shelf | 1.00 × 10⁻⁸ | 0.05 | 1 × 10⁻⁷ |
| Fractured zone | 3.89 × 10⁻⁷ | 0.1 | 2 × 10⁻⁶ |
| Type of Rock Mass | Longitudinal Dispersion Coefficient (m) | Transverse Dispersion Coefficient (m) | Molecular Diffusion Coefficient (m2/s) |
|---|---|---|---|
| Fault zone and strongly weathered rock mass | 2 | 0.5 | 2 × 10⁻⁷ |
| Moderately and slightly weathered rock mass | 1 | 0.1 | 2 × 10⁻⁸ |
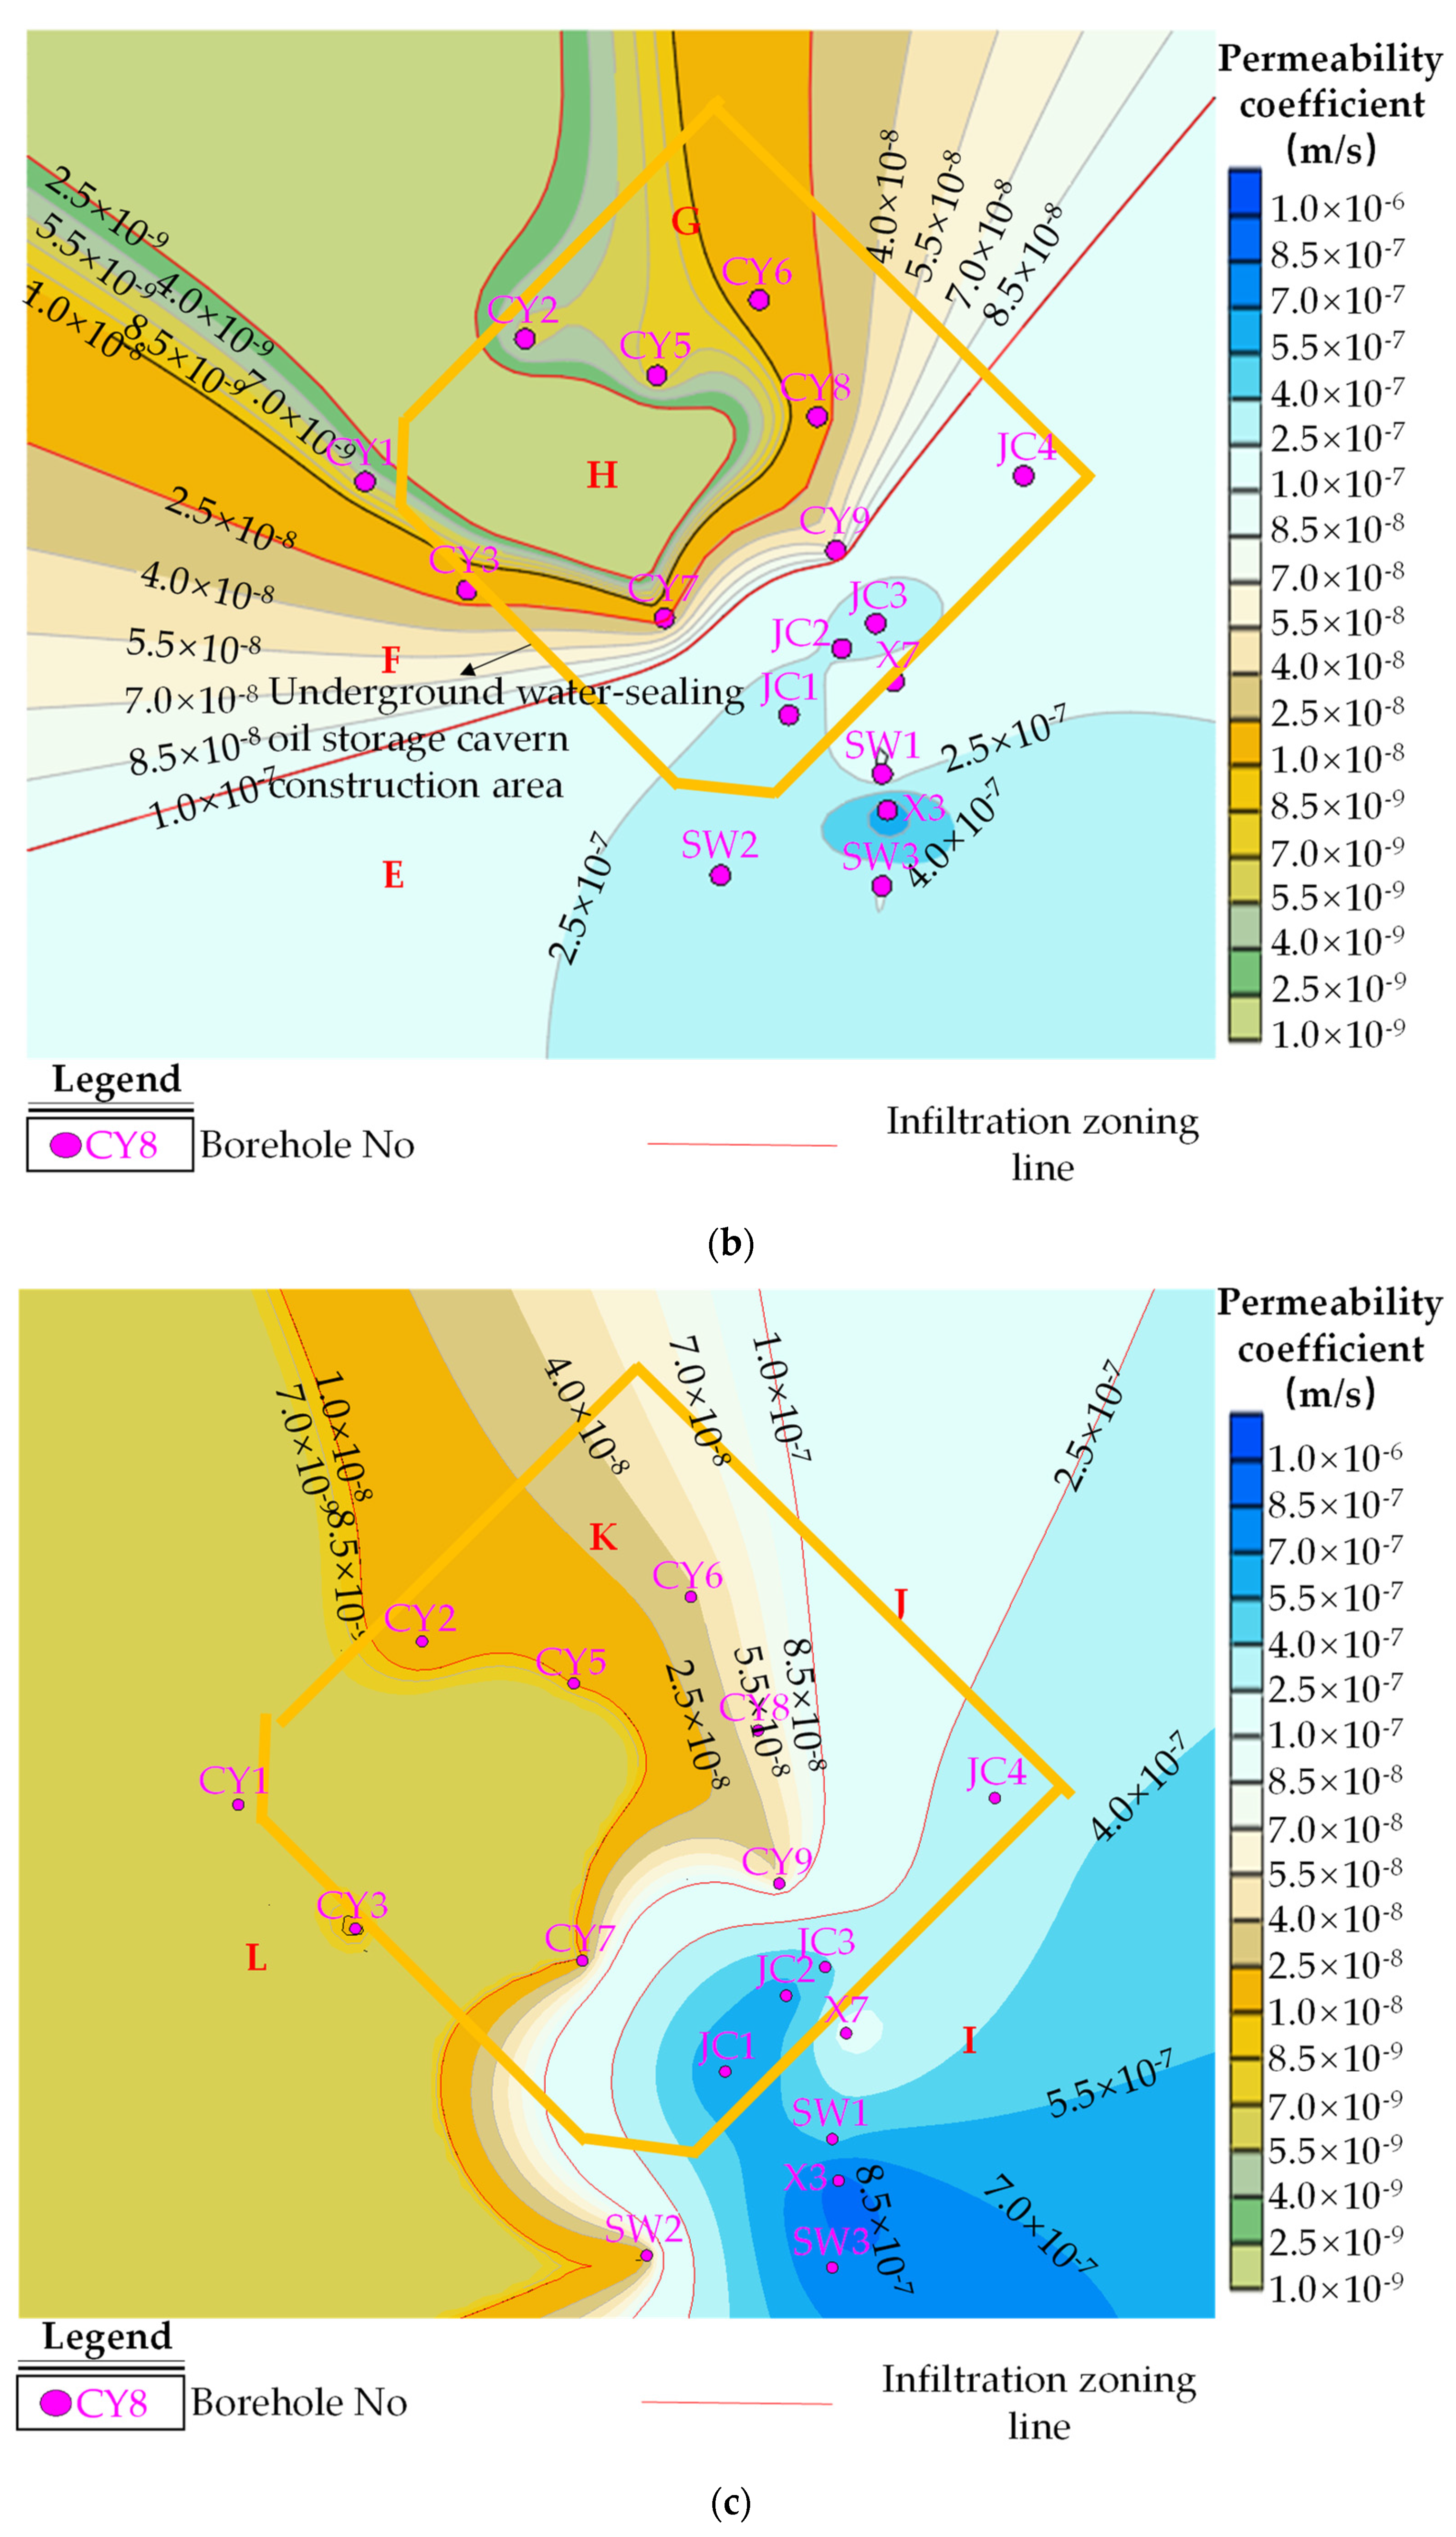
| Partition | Zone | Permeability Coefficient (m/s) |
|---|---|---|
| Elevation between −38 and −20 m (water curtain section) | A | 4 × 10⁻⁷ |
| B | 5 × 10⁻⁸ | |
| C | 5 × 10⁻⁹ | |
| D | 1 × 10⁻⁹ | |
| Elevation between −62 and −38 m (between water curtain and cavern top) | E | 3 × 10⁻⁷ |
| F | 3 × 10⁻⁸ | |
| G | 6 × 10⁻⁹ | |
| H | 1 × 10⁻⁹ | |
| Elevation between −92 and −62 m (cavern section) | I | 6 × 10⁻⁷ |
| J | 2 × 10⁻⁷ | |
| K | 5 × 10⁻⁸ | |
| L | 7 × 10⁻⁹ |
| Corrosion Rank | Micro Corrosion | Slight Corrosion | Moderate Corrosion | Strong Corrosion |
|---|---|---|---|---|
| Cl− concentration (mol/m3) | <3 | 3 ~ 14.3 | 14.3 ~ 143 | >143 |
Disclaimer/Publisher’s Note: The statements, opinions and data contained in all publications are solely those of the individual author(s) and contributor(s) and not of MDPI and/or the editor(s). MDPI and/or the editor(s) disclaim responsibility for any injury to people or property resulting from any ideas, methods, instructions or products referred to in the content. |
© 2022 by the authors. Licensee MDPI, Basel, Switzerland. This article is an open access article distributed under the terms and conditions of the Creative Commons Attribution (CC BY) license (https://creativecommons.org/licenses/by/4.0/).
Share and Cite
He, S.; Song, D.; Yang, L.; Miao, X.; Liang, J.; He, X.; Cao, B.; Zhao, Y.; Chen, T.; Zhong, W.; et al. Seawater Intrusion Risk and Prevention Technology of Coastal and Large-Span Underground Oil Storage Cavern. Energies 2023, 16, 339. https://doi.org/10.3390/en16010339
He S, Song D, Yang L, Miao X, Liang J, He X, Cao B, Zhao Y, Chen T, Zhong W, et al. Seawater Intrusion Risk and Prevention Technology of Coastal and Large-Span Underground Oil Storage Cavern. Energies. 2023; 16(1):339. https://doi.org/10.3390/en16010339
Chicago/Turabian StyleHe, Shengquan, Dazhao Song, Lianzhi Yang, Xiaomeng Miao, Jiuzheng Liang, Xueqiu He, Biao Cao, Yingjie Zhao, Tuo Chen, Wei Zhong, and et al. 2023. "Seawater Intrusion Risk and Prevention Technology of Coastal and Large-Span Underground Oil Storage Cavern" Energies 16, no. 1: 339. https://doi.org/10.3390/en16010339