Abstract
Supercritical boilers have become a major development trend in coal-fired power plants, and the air distribution strategy is a key factor in the design and operation of making it fully combustible. In this paper, the mathematical and physical models of a 350 MW supercritical boiler is established, and the optimal air distribution mode of the boiler at different load is determined based on the furnace outlet temperature, NOx concentration, and O2 content. The air distribution control strategies were derived and the corresponding procedures were established. 160 MW and 280 MW were selected for positive pagoda and 180 MW and 230 MW for waist reduced. At 290–350 MW load, the effect of adjusting the combustion damper opening on the outlet oxygen is weak, so preferentially adjusting the SOFA damper opening can achieve better results. The results show good thermal efficiency and emission performance and are applicable to adjust the air distribution mode to achieve fuller combustion of supercritical boilers.
1. Introduction
In the context of world energy shortages and global warming, a great deal of research has been devoted to oxygen-enriched combustion in an effort to achieve fuller combustion and reduce the emissions of pollutants [1]. Supercritical boilers have been developed for their good performance and high superheated steam parameters [2]. Supercritical boiler technology was introduced in Europe in the early 1990s, which steam generators usually operate at pressures of up to 350 bar [3]. It has the characteristics of low coal consumption, high thermal efficiency, better circulation, good environmental performance and high technical content [4,5]. Reasonable boiler air distribution can significantly improve the combustion state of the boiler, effectively reduce the heat loss of exhaust gas, reduce the heat loss due to incomplete combustion, and reduce the emission of nitrogen oxides [6]. In addition, the adjustment of primary and secondary air can provide the basis for adjusting the flame center position in the same layer within the boiler to prevent local overheating and coking of the water wall [7].
With the rise of CFD (computational fluid dynamics) and computational combustion in the 1970s, the application of 3D numerical simulations makes it possible to numerically study the nonlinear physical processes of fluid mechanics and heat and mass transfer. It has been applied to the combustion of pulverized coal in bench-scale, pilot and commercial boilers. It is an indispensable reference tool to guide the design of boiler structures and the operational control of combustion parameters in lieu of tedious experimental studies [8,9]. The air distribution strategy plays a crucial role in the operation of supercritical boilers. However, most of the current studies have focused on the simulation of computational models [10,11,12], volatile emissions [13,14], combustion processes [15,16,17], burner forms and fuel types [18,19,20]. There are still very few studies on air distribution models.
In recent years, a lot of research work has been carried out by many scholars to explore better air distribution patterns and CFD simulation studies on boiler performance and emissions. Buting Zhang et al. [21] analyzed the effects of primary air velocity, air distribution method and other factors on NOx emissions and boiler efficiency through a combustion adjustment test on a boiler. The results showed that the NOx emission would decrease and the boiler efficiency would decrease when the primary air speed increased. The secondary air distribution method has less effect on NOx emission. A simulation model on the optimal excess air coefficient was developed and validated by Y. Wang et al. The mechanism of the effect of excess air coefficient on boiler parameters and efficiency was predicted by CFD simulation. The effects of excess air coefficient on boiler operating efficiency, radiation characteristics and heat transfer characteristics were derived, and the optimal value of excess air coefficient was concluded. Chen, HW et al. [22] studied the effect of secondary and overfired separation air on boiler performance in a 300 MW utility boiler, and optimized the dampers opening of secondary and separation overfired air by genetic algorithm, and achieved the optimal operating parameters of secondary and overfired separation air by the optimization model, which provides a reference for the adjustment of secondary and overfired separation air. Li, S in et al. [23] conducted experiments on a 300 MWe utility boiler to investigate the effects of factors including overall excess air ratio, secondary air distribution pattern, dampers opening of CCOFA and SOFA, and pulverized coal fineness on improving the thermal efficiency of the boiler and reducing NOx emissions, and the optimal excess air ratio was obtained by comprehensive combustion adjustment. The NOx emission was reduced by 182 ppm (NOx reduction efficiency was 44%) through the adjustment of the damper opening. The effect of pulverized coal fineness on NOx emissions was negligible. The improvement of boiler thermal efficiency is not obvious, only 0.21% lower than before the low-NOx retrofit. Arablu, M et al. [24] studied a 250 MW dual-fuel boiler with the aim of reducing the formation of NOx in it by air staging and over-fire air. CFD simulations were performed to determine the optimal locations for mounting air and fuel injectors on the boiler walls. By installing injectors at these locations, NOx emissions can be reduced by more than 70% using OFA and air classification strategies. The simulation results were validated against real data obtained on a full-size boiler.
In this paper, a 350 MW supercritical boiler is established, and the basic opening and adjustment range of the secondary air valve under each load are determined by multiple sets of numerical simulation conditions to obtain the optimal air distribution mode and combustion damper opening. Meanwhile, the air distribution control strategy is set up. The work combines 3D simulation and control logic to study the power plant boiler. The effectiveness of the simulation results was confirmed by the available operational and design data. The research in this paper can provide an idea for the future automatic control of boiler combustion process [25].
2. Geometric and Physical Model
2.1. Geometric Model
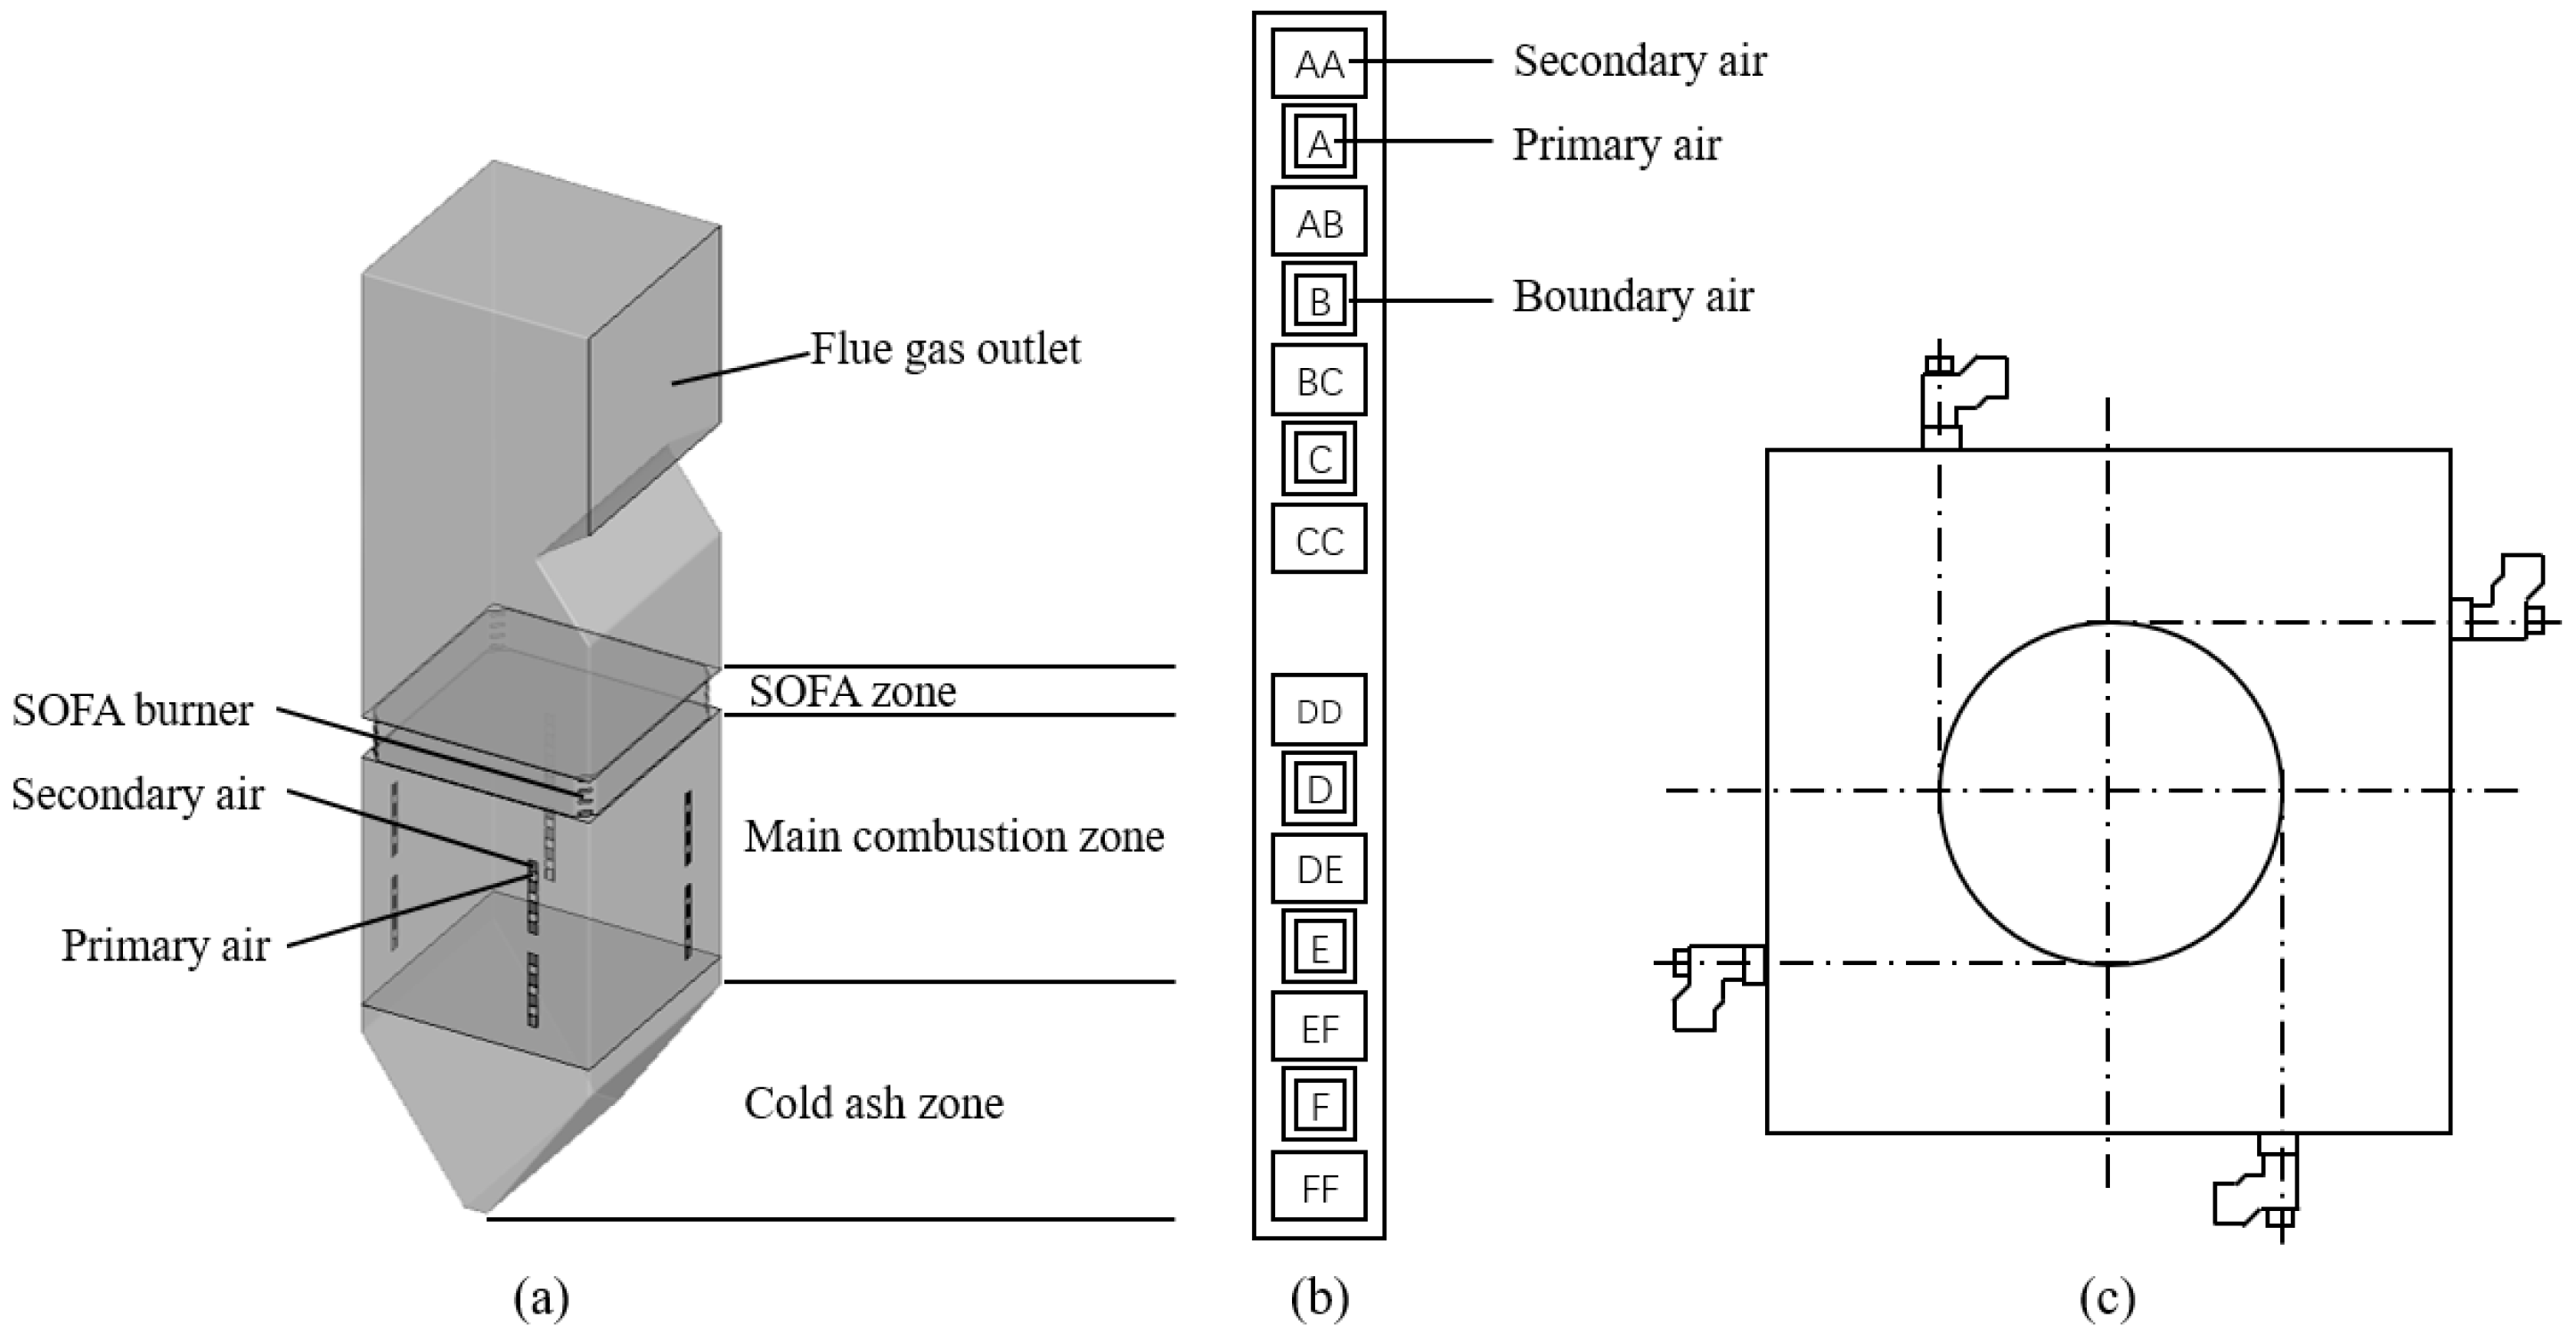
The simplified model of furnace and burner arrangement of the supercritical boiler is shown in Figure 1. The main structure size of the furnace is 14.6 m × 58.3 m (length × height). The burner is mainly located in the main combustion zone and is arranged with four-wall tangentially fired. Part of the pulverized coal and air are injected by the primary air (A–F), and the secondary air includes combustion air (AA–FF), separated over fire air (SOFA) and surrounding air. The surrounding air is used to ensure the stiffness of the primary air, and the SOFA air layout at four corners above the main combustion area, four layers in total (S1–S4). The secondary air is staged for fractional combustion to reduce NOx emissions, so that it can play more fully utilized [19]. The primary combustion area is arranged with 6 layers of primary air nozzles, each layer of primary air is equipped with a coal mill, five transport and one standby, the primary air of A layer nozzle is not opened during normal operation, each primary air nozzle is surrounded by circumferential wind, the wind speed is higher than the primary air, to enhance the stiffness of the primary air, to ensure that the cut circle is not deflected. In this case, 8 layers of combustion air nozzles are set, staggered with the primary air, and the SOFA burner is arranged in four corners of the cut circle, located above the main combustion area. There are 4 layers in total. The diameter of the imaginary tangent circle of the main burner area is 7.3 m.
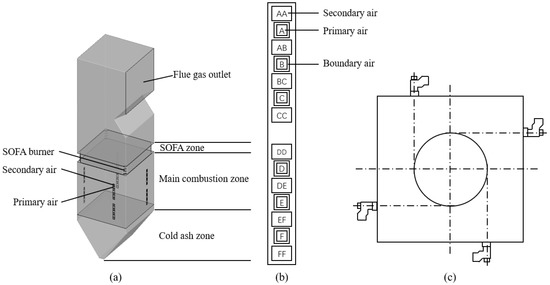
Figure 1.
Furnace structure and burner arrangement. (a) Furnace structure. (b) Burner arrangement. (c) Cross-section of main combustion zone.
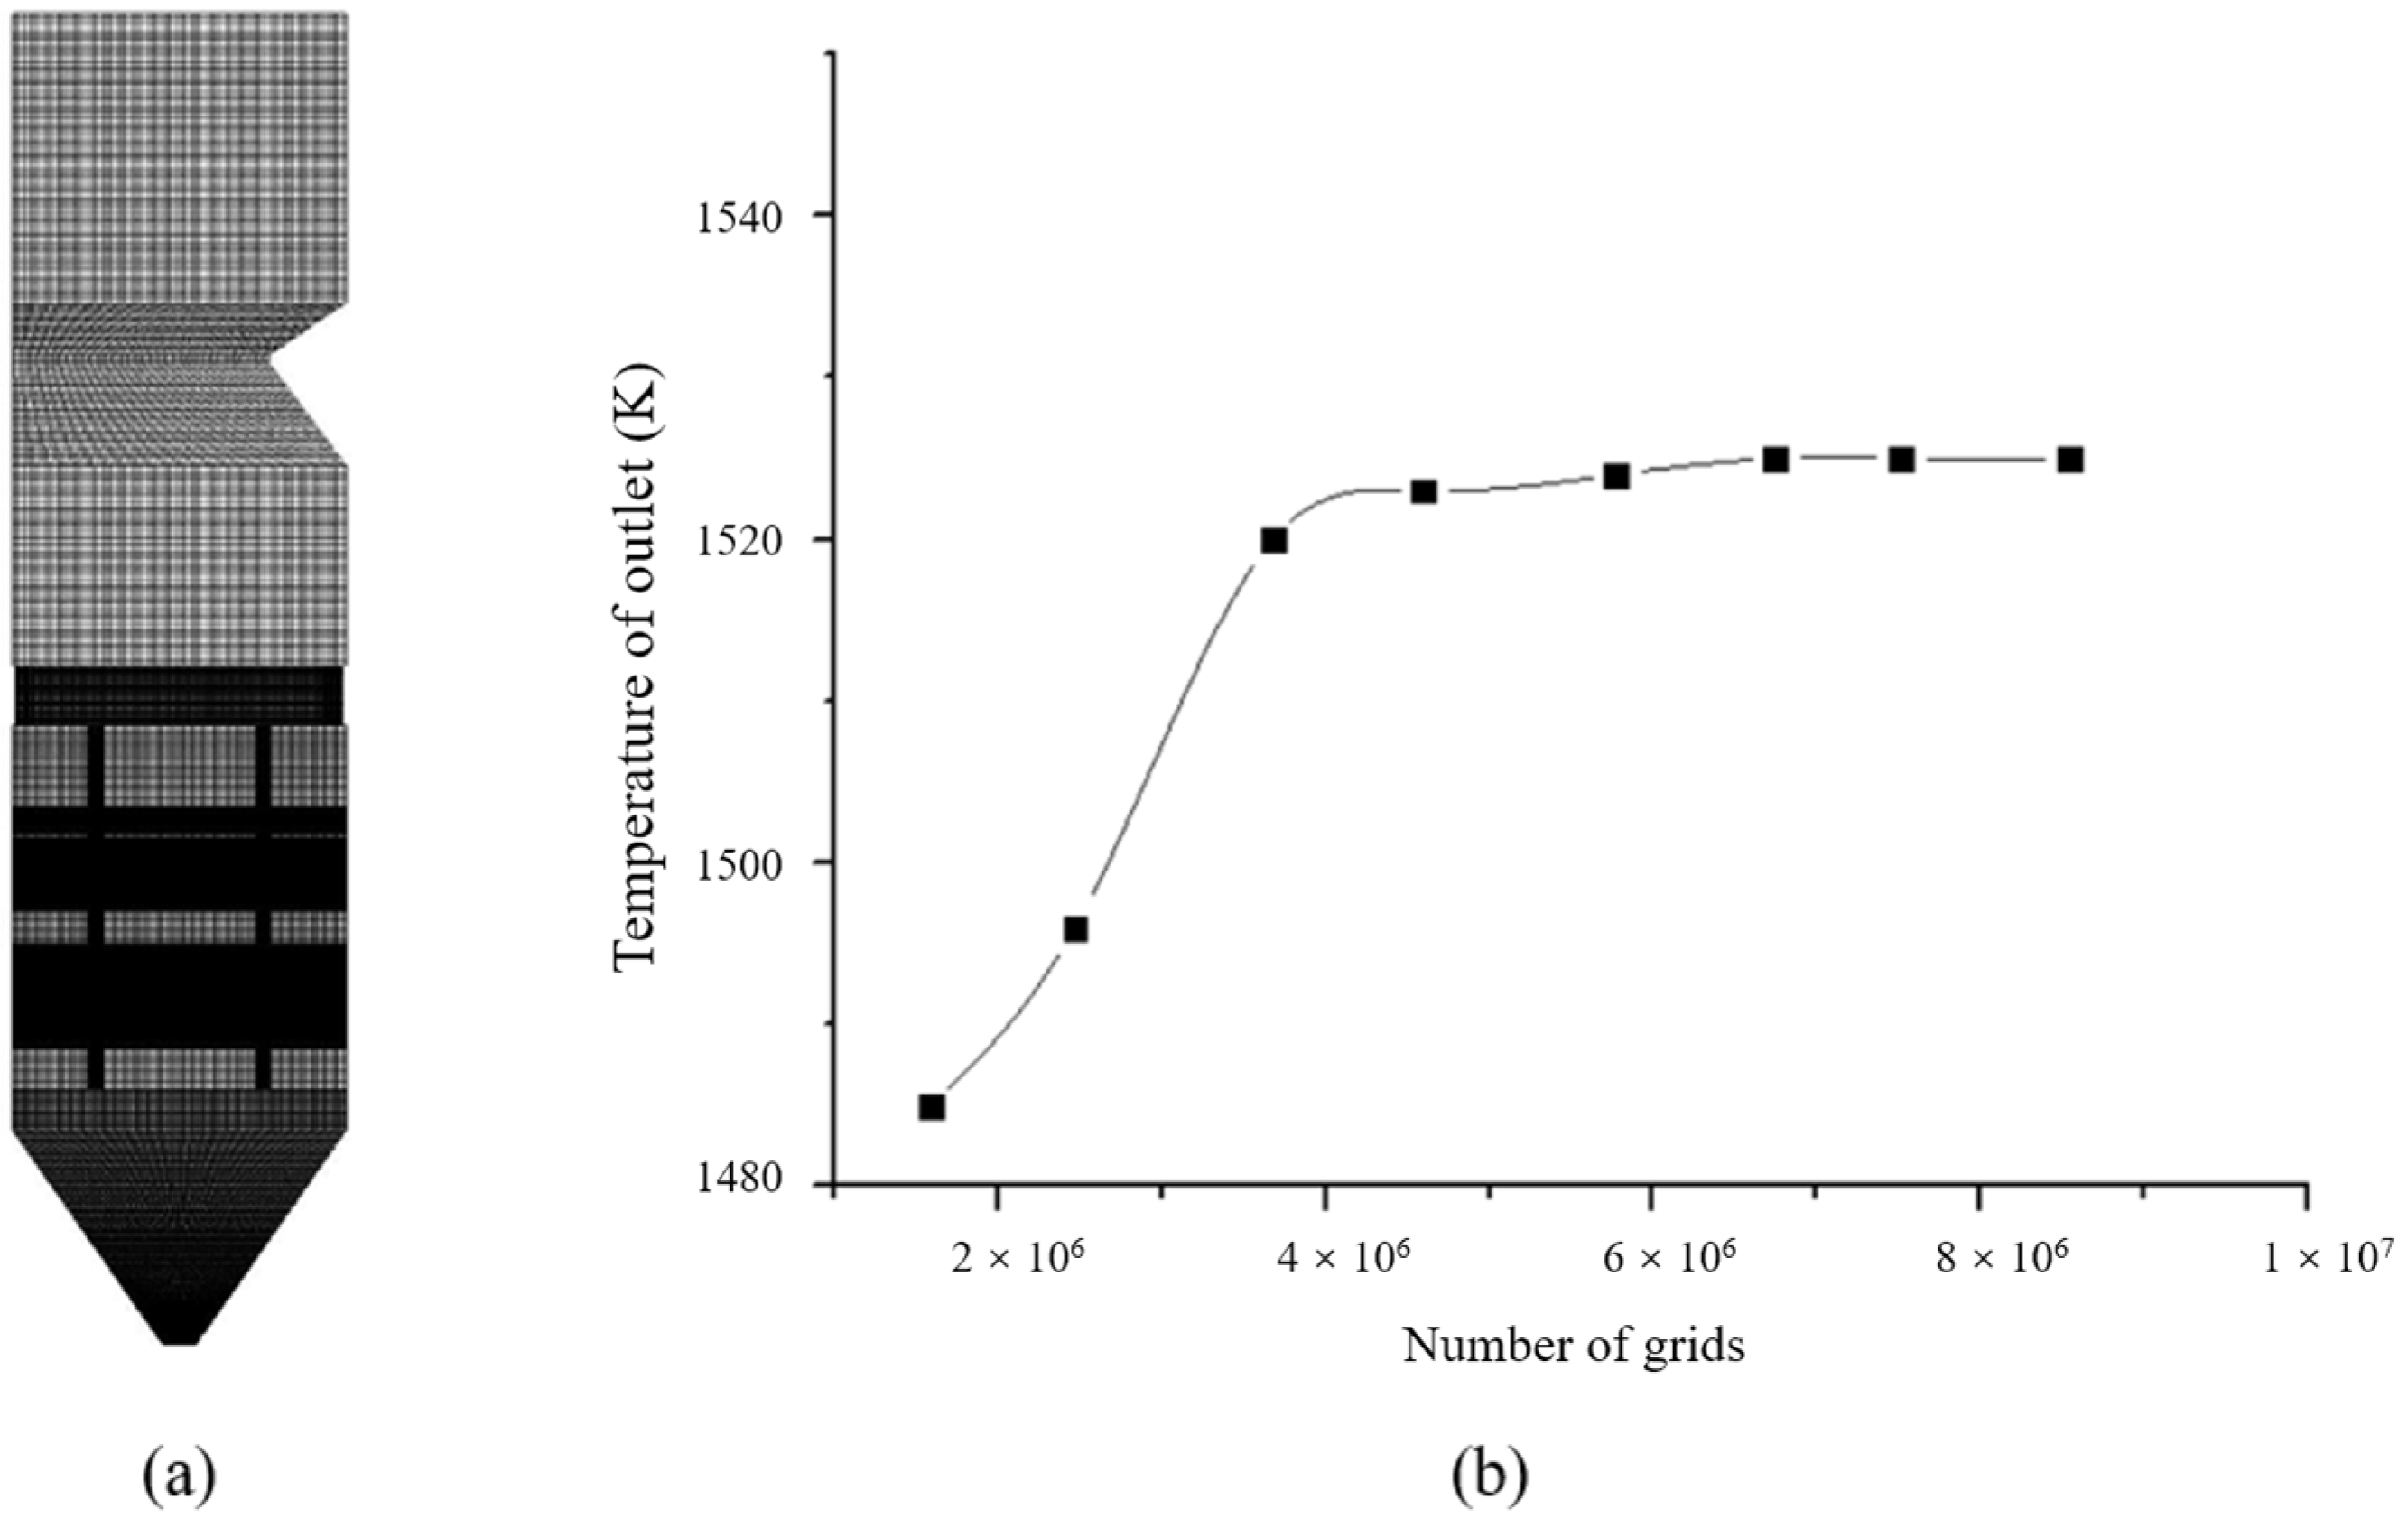
Meshing Geometric Models using structural meshes as shown in Figure 2a, and in this paper, the temperature of outlet is used as the test index, that is, this temperature of the simulation will not change with the increase of the number of grids. As shown in Figure 2b. when the number of grids increase to 4 × 10⁶, the temperature hardly changes with the number of grids, so hexahedral mesh with approximately 4 × 10⁶ grids was chosen.
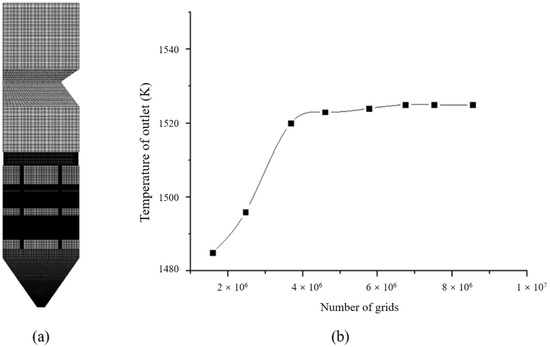
Figure 2.
Boiler calculation zone grid. (a) Grid model. (b) Grid independence analysis.
2.2. Physical Model
2.2.1. Gas Phase Turbulence Model
In the furnace, the change rate of various parameters is high, realizable k-epsilon model can prevent negative values, thus improving the accuracy of the results. In addition. according to the sensitivity analysis of RANS turbulence model by Xingsi Han [26], the realizable k-epsilon behaves quite stably and predicts nearly consistent results in all simulations. Therefore, the realizable k-ε model is chosen as the gas-phase turbulence model.
2.2.2. Particle Flow Model
In this study, the gas phase is a continuous phase and the pulverized coal particles are secondary phases with a small volume fraction, meeting the applicable conditions of the discrete phase mode, which can calculate the trajectory of these particles and the heat/mass transfer caused by particles. Taking into account the effects of phase coupling and interaction on single-phase, discrete phase model (DPM) was selected to simulate the flow of pulverized coal particles.
2.2.3. Volatilization Separate out Model
Volatile precipitation is the first step in the combustion of pulverized coal particles, which has a large impact on further combustion of volatile fraction and coke, Currently, there are single-step reaction model, two-step reaction model, and chemical percolation and devolatilization (CPD) model available for volatile fraction separate.
The CPD model is based on the physical and chemical structure of coal particles and uses lattice statistics to describe the process of gas volatilization and tar formation. The model treats coal as a network of aromatic rings connected by chemical bonds, and the process of volatiles precipitation is the process of network breakage and regeneration. unstable bonds in the coal are subjected to high temperatures and intermediates to generate polymer products and coke, respectively, which in turn produce light gases. Torresi et al. found that combining the CPD model for devolatilization with an intrinsic reactivity model for char combustion yielded better agreement for combustion species near the nozzle [27].
The calculation of this model requires the reaction kinetic parameters of coal, which is experimentally verified in the temperature range below 1500 K. The volatilization analysis out of the model in the simulation of this paper is calculated by using the CPD model.
2.2.4. Volatile Combustion Model
In the progress of combustion, pulverized coal and oxidizer enter the reaction zone as heterogeneous phases, so the combustion model for volatile fraction should be non-premixed combustion model [18], which is completely different from the premixed combustion model. In the non-premixed combustion model, the thermochemical reaction rate is controlled by mixing fraction [28,29].
The mixing fraction f (Equation (1)) can be written based on the atomic mass fraction as:
where: denotes the mass fraction of element i, the subscripts for and denotes the oxidizer inlet value, and the subscript fuel denotes the fuel inlet value, Equation (2) is commutative for all elements and the mixing fraction is uniquely defined, and the sum of the mass fractions of the secondary stream, fuel and oxidizer is always 1 in the case of the inclusion of the secondary stream (Equation (2)).
2.2.5. Coke Combustion Model
After volatilization is separated out, the combustion of the remaining coke fraction mainly consists of two processes, one is the diffusion of the oxidant to the surface of the coke particles, and the other is the reaction of the oxidant absorbed by the coke surface and the diffusion of the reaction products to the surrounding area [30].
The kinetic/diffusion reaction model is adopted for the combustion model of coke in this paper. The kinetic/diffusion reaction model considers that the surface reaction rate is controlled by both kinetics and diffusion, and the combustion rate equation is:
where: is the partial pressure of gaseous oxidant around the coke; is the diffusion rate coefficient; is the chemical reaction rate coefficient; is the diffusion rate constant; is the reaction rate constant; is the kinetic reaction constant considering the surface reaction and diffusion of coke particles.
2.2.6. NOX Generation Model
The prediction of is a post-processing process after the combustion simulation, and the transport equation is solved by the given flow field and combustion results, so the accurate combustion simulation results are crucial [31].
The control equations contain mass transport equations for the component, taking into account convection, diffusion, generation and consumption. For the thermal and fast mechanisms, only the transport equations for the component is required.
The control equation contains the mass transport equation of the component, taking into account convection, diffusion, generation, and consumption. For the thermal and fast mechanisms, only the transport equations for the component is required:
Fuel-based simultaneously tracks nitrogen-containing intermediates and solves the transport equations for the and components:
where: , and are the mass fractions of , and in the gas phase, respectively;, and are the source terms.
The main reactions for the formation of from nitrogen molecules in thermodynamic are as follows:
Consider the third reaction when approaching the equivalence condition:
For fuel-based , organic compounds containing nitrogen will increase the formation of during the combustion process, and the conversion of nitrogen in fuel to depends to a large extent on the initial concentration of nitrogen-containing compounds and the influence of combustion characteristics [16]. With the pyrolysis of nitrogen-containing compounds, radicals such as , , N, CN and HN (secondary intermediate nitrides) can undergo two reactions, one with O2 to form NO and the other with NO to form [32].
Since the generation of fast is low in the process of pulverized coal combustion, it can be ignored in the calculation process. The re-burning mechanism leads to NO reduction through the reaction of with hydrocarbons, which is effective in a range of 1600–2100 K. Sun et al. studied the emission behavior of during the combustion of pulverized coal and raw coal in an O2/CO2 environment and found that when the initial concentration of in the carrier gas is not equal to zero, it is reduced by coal or coal coke, as the initial concentration of increased, the calculated reduction ratio decreased. The reduction rate equation is [33]:
In summary, this simulation mainly deals with the generation of thermodynamic and fuel-based , and calculates the reigniting according to the maximum furnace chamber temperature.
2.3. Radiation Model
In FLUENT, The DO model can solve the radiation problem in the full optical depth interval, and can solve the radiation heat exchange between face-to-face, gas and particles in the combustion problem, while the model is applicable to the radiation of translucent media. In the combustion process of this paper, the radiation heat exchange of pulverized coal particles is also an essential part, so only the P-1 radiation model or DO model can be applied, after trial calculations DO model has moderate computational overhead, and considering its wider applicability, this paper adopts DO model as the radiation model.
DO model radiation propagation equation is:
where: is the position vector; is the direction vector; is the scattering direction vector; is the absorption coefficient; is the refraction coefficient; is the scattering coefficient; is the Stefan Boltzmann constant; is the radiation intensity; is the phase function; is the spatial stereo angle.
In the furnace, the gas phase contains pulverized coal particles, set refraction coefficient as 0.3 (m−1), and a large amount of CO2 and vapour will be generated after pulverized coal combustion, set absorption coefficient as 0.25 (m−1), all physical parameters are isotropism in the furnace, thus set refraction coefficient as 1.
2.4. Characteristic of Coal and Gases
The mass of pulverized coal jet is distributed equally by each open primary air door, and the temperature of pulverized coal is equal to the primary air temperature, and the maximum particle diameter of pulverized coal is set at 0.2 mm, the minimum particle diameter at 0.07 mm, and the average diameter at 0.13 mm. The boiler described in this paper uses lignite as the design coal, and its industrial analysis and Elemental analysis is shown in Table 1.

Table 1.
The coal powder consumption table (t/h).
The cp (Specific Heat) of the gas changes with the temperature, it is defined by piecewise-polynomial. The equation is:

Table 2.
The number of c1–c5.
2.5. Boundary Conditions
The inlet contains primary and secondary air (combustion air, perimeter air and SOFA air) inlets, all set as velocity inlets, turbulence intensity is taken as 5% of the average turbulent kinetic energy at the inlet, and characteristic length is taken as the equivalent diameter of the inlet, calculated as 4 S/L, where S is the cross-sectional area and L is the cross-sectional perimeter.
The primary air inlet is labelled A–F from above and below, where the A-level air inlet is kept in reserve, and the D-level air inlet is closed when the boiler load is lower than 280 MW, and the B-level air inlet is closed when the load is lower than 180 MW. The primary air volume accounts for about 1/3 of the total inlet air volume of the boiler, and the air speed varies in the range of 20–25 m/s. The primary air door opening state and air temperature setting of typical working condition are shown in Table 3, and the primary air temperature of other working condition changes according to the rule in the table.

Table 3.
The primary air damper opening state and wind temperature table (K).
The percentage of secondary air in combustion air, SOFA air and perimeter air is about 60%, 30% and 10%, and the air temperature of each type of secondary air is kept consistent, and the typical working condition of secondary air temperature is set as shown in Table 4, and the other working condition temperature is calculated by linear interpolation in the interval.

Table 4.
The secondary air wind temperature table (K).
In this paper, the wind speed of combustion wind and SOFA wind is taken as 45 m/s constant for the control variables, and the inlet air volume is adjusted by adjusting the damper area. The SOFA air inlet is la-belled S1–S4 from top to bottom, and the SOFA air volume decreases proportionally as the load decreases. In order to ensure the flow stiffness of SOFA air, the S1 layer is closed when the boiler load is below 280 MW, and the S1 and S3 layers are closed when the boiler load is below 180 MW. The opening degree is calculated by linear interpolation in the interval without changing the opening and closing state of the dampers, as shown in Table 5.

Table 5.
SOFA dampers opening status and opening degree table (%).
The boundary condition of outlet set as outflow, that is, the outlet is assumed to be a fully developed flow.
3. The Optimal Air Distribution Method under Typical Loads
The calculated operating conditions are for 6 typical loads. The furnace outlet temperatures (design values) for typical operating conditions are shown in Table 6.

Table 6.
The design value of furnace chamber outlet temperature (K).
The reasonable range of the average oxygen content of the furnace outlet under typical operating conditions is shown in Table 7, and the oxygen content of the furnace outlet under typical load calculated in this chapter should be close to the oxygen content at the nodes in the table.

Table 7.
The average oxygen content at the furnace outlet (%).
4. Simulation and Air Distribution Mode Selection
4.1. Cold State Simulation
The velocity field distribution can reflect the airflow and pulverized coal flow in the furnace. Good pulverized coal flow characteristics are very important to optimize the combustion characteristics in the furnace [34]. In this paper, the reliability of the model is verified by cold state and combustion simulation in the furnace under full load.
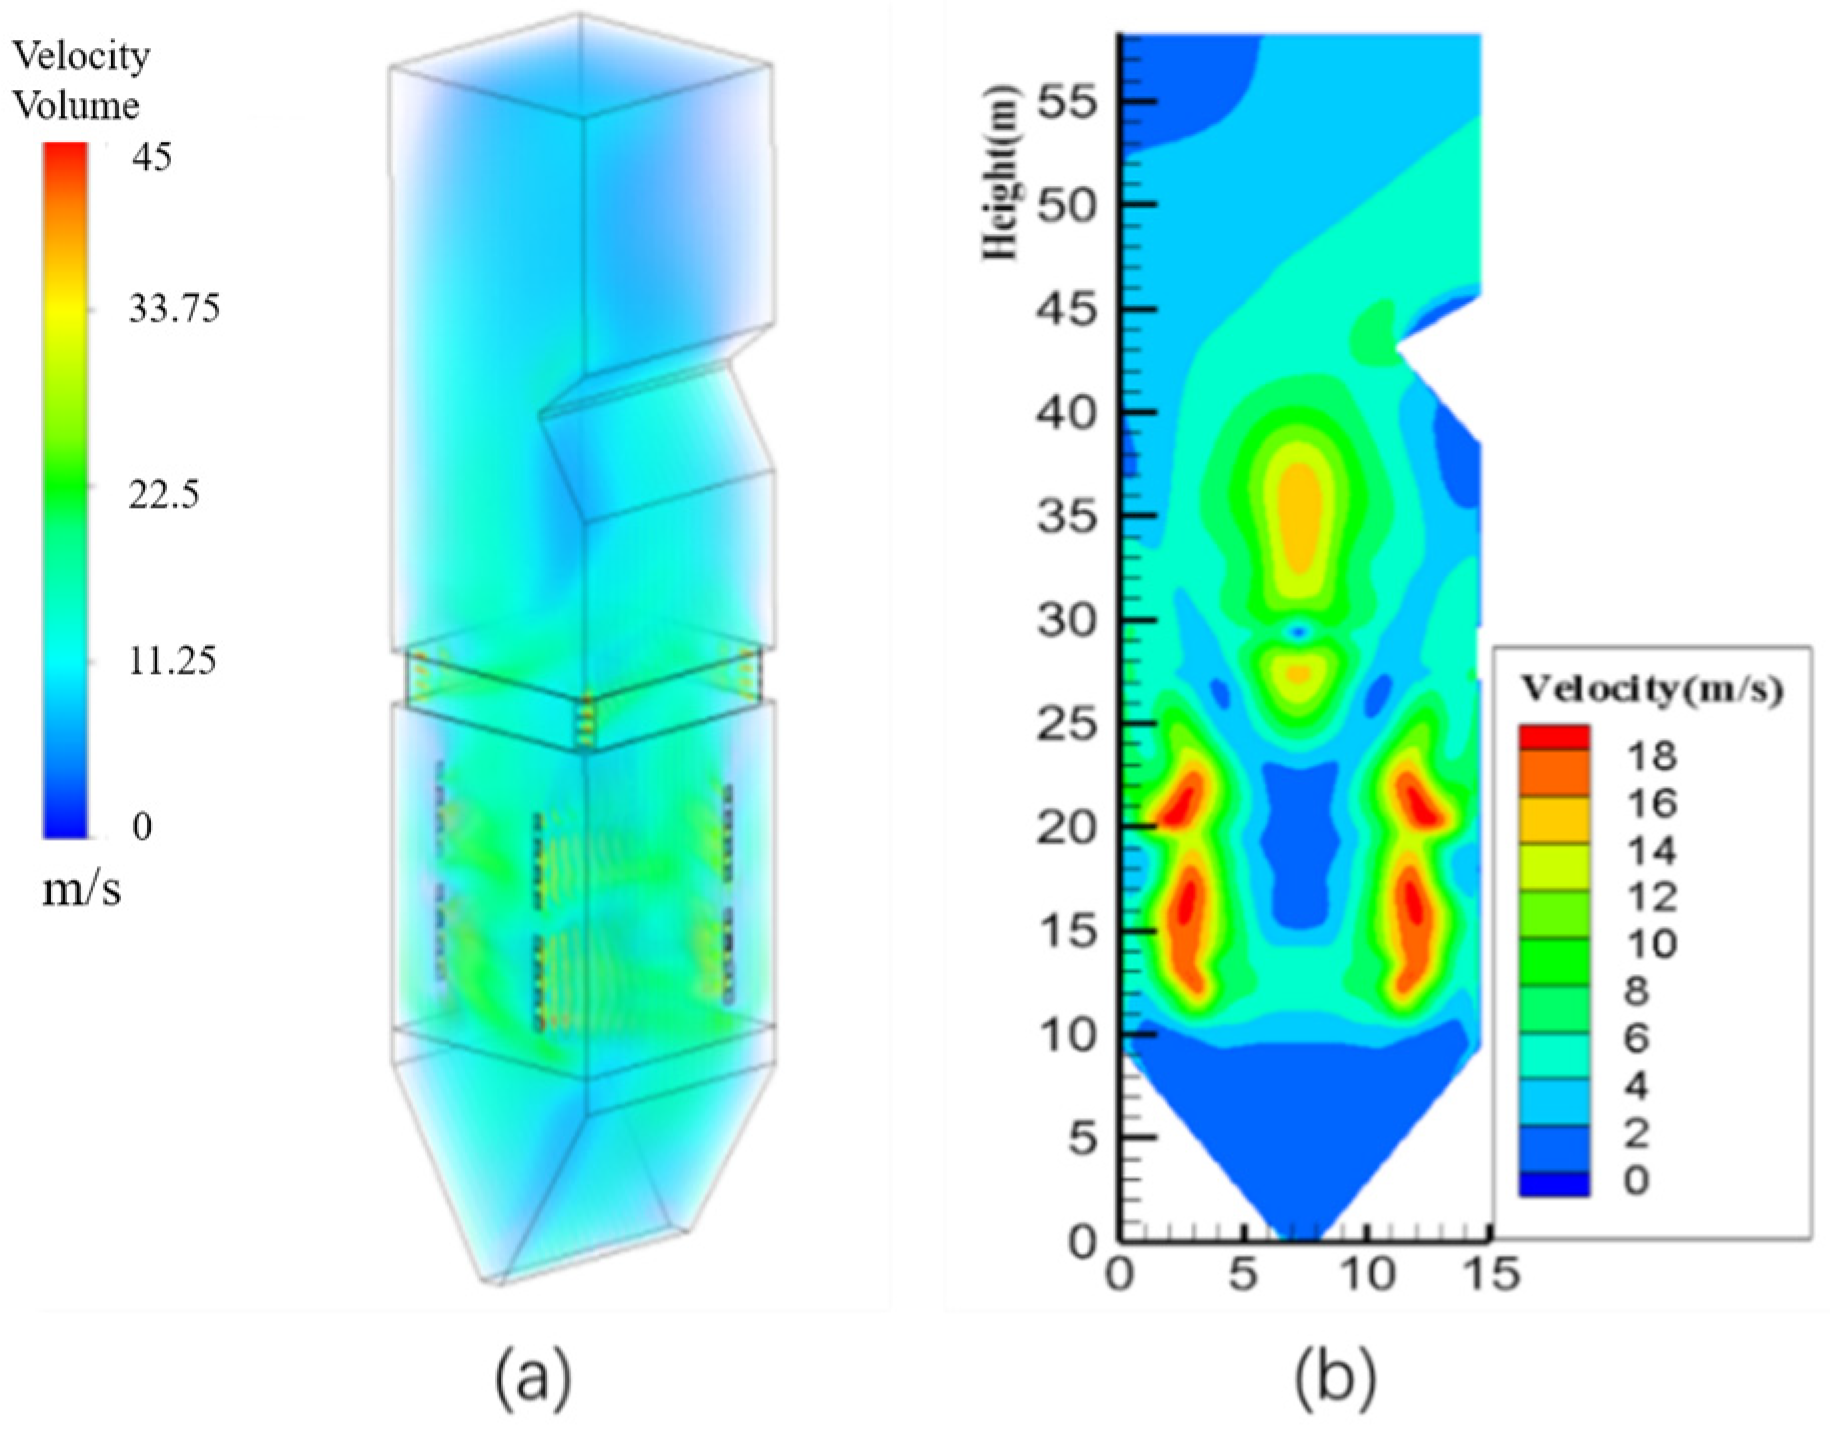
Figure 3a shows the contours diagram of longitudinal airflow velocity in furnace, it can be seen from the figure that after the airflow enters the furnace from the nozzle, it spirals upward under the impact of the four walls and other airflow, then a low-speed zone is formed in the center of the furnace. The main burner zone is four-wall tangential circle arrangement, while the SOFA burning zone is four-angle tangential circle arrangement. It can be seen from Figure 3b that the flow field changes caused by different tangential circle arrangement. The velocity value of the burner is relatively high, the mixture of pulverized coal and oxygen is sufficient, and the airflow distribution in the flow field is relatively uniform with less flow dead zone.
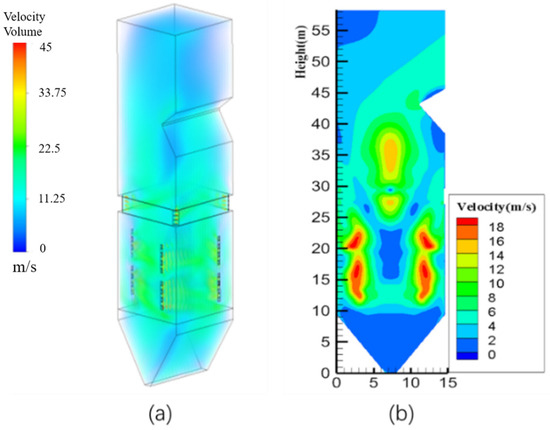
Figure 3.
Distribution contours diagram of longitudinal airflow velocity in furnace. (a) Velocity distribution. (b) Gas phase flow rate in the central longitudinal section.
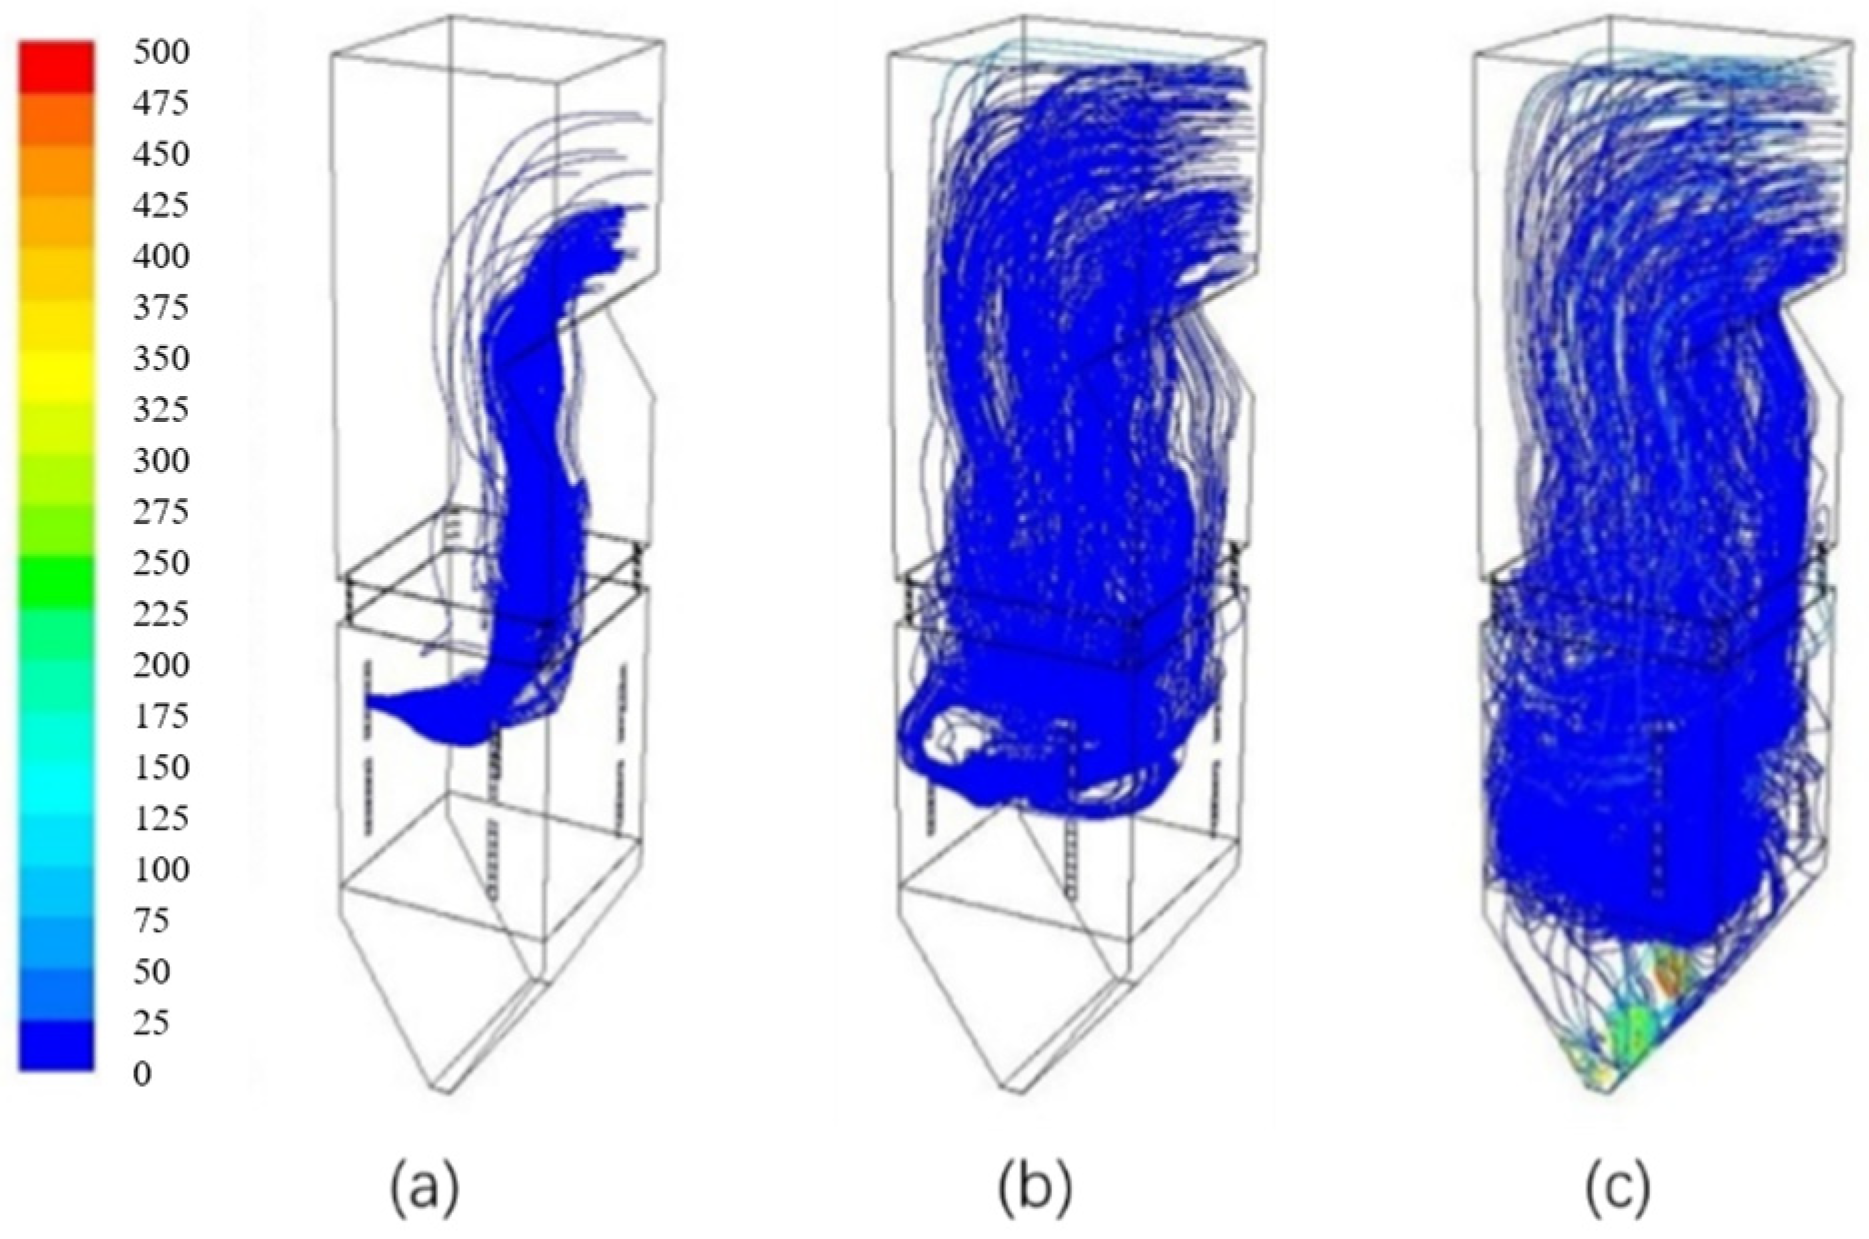
Under 350 MW load, Figure 4 shows the trajectory of pulverized coal particles in layers B, D and F, which describes the trajectory curve of pulverized coal ejected from the primary damper with time.
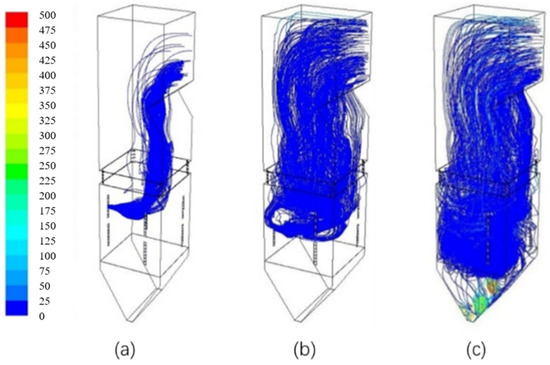
Figure 4.
The trajectory of pulverized coal particles. (a) B layer; (b) D layer and (c) F layer.
4.2. Combustion Simulation
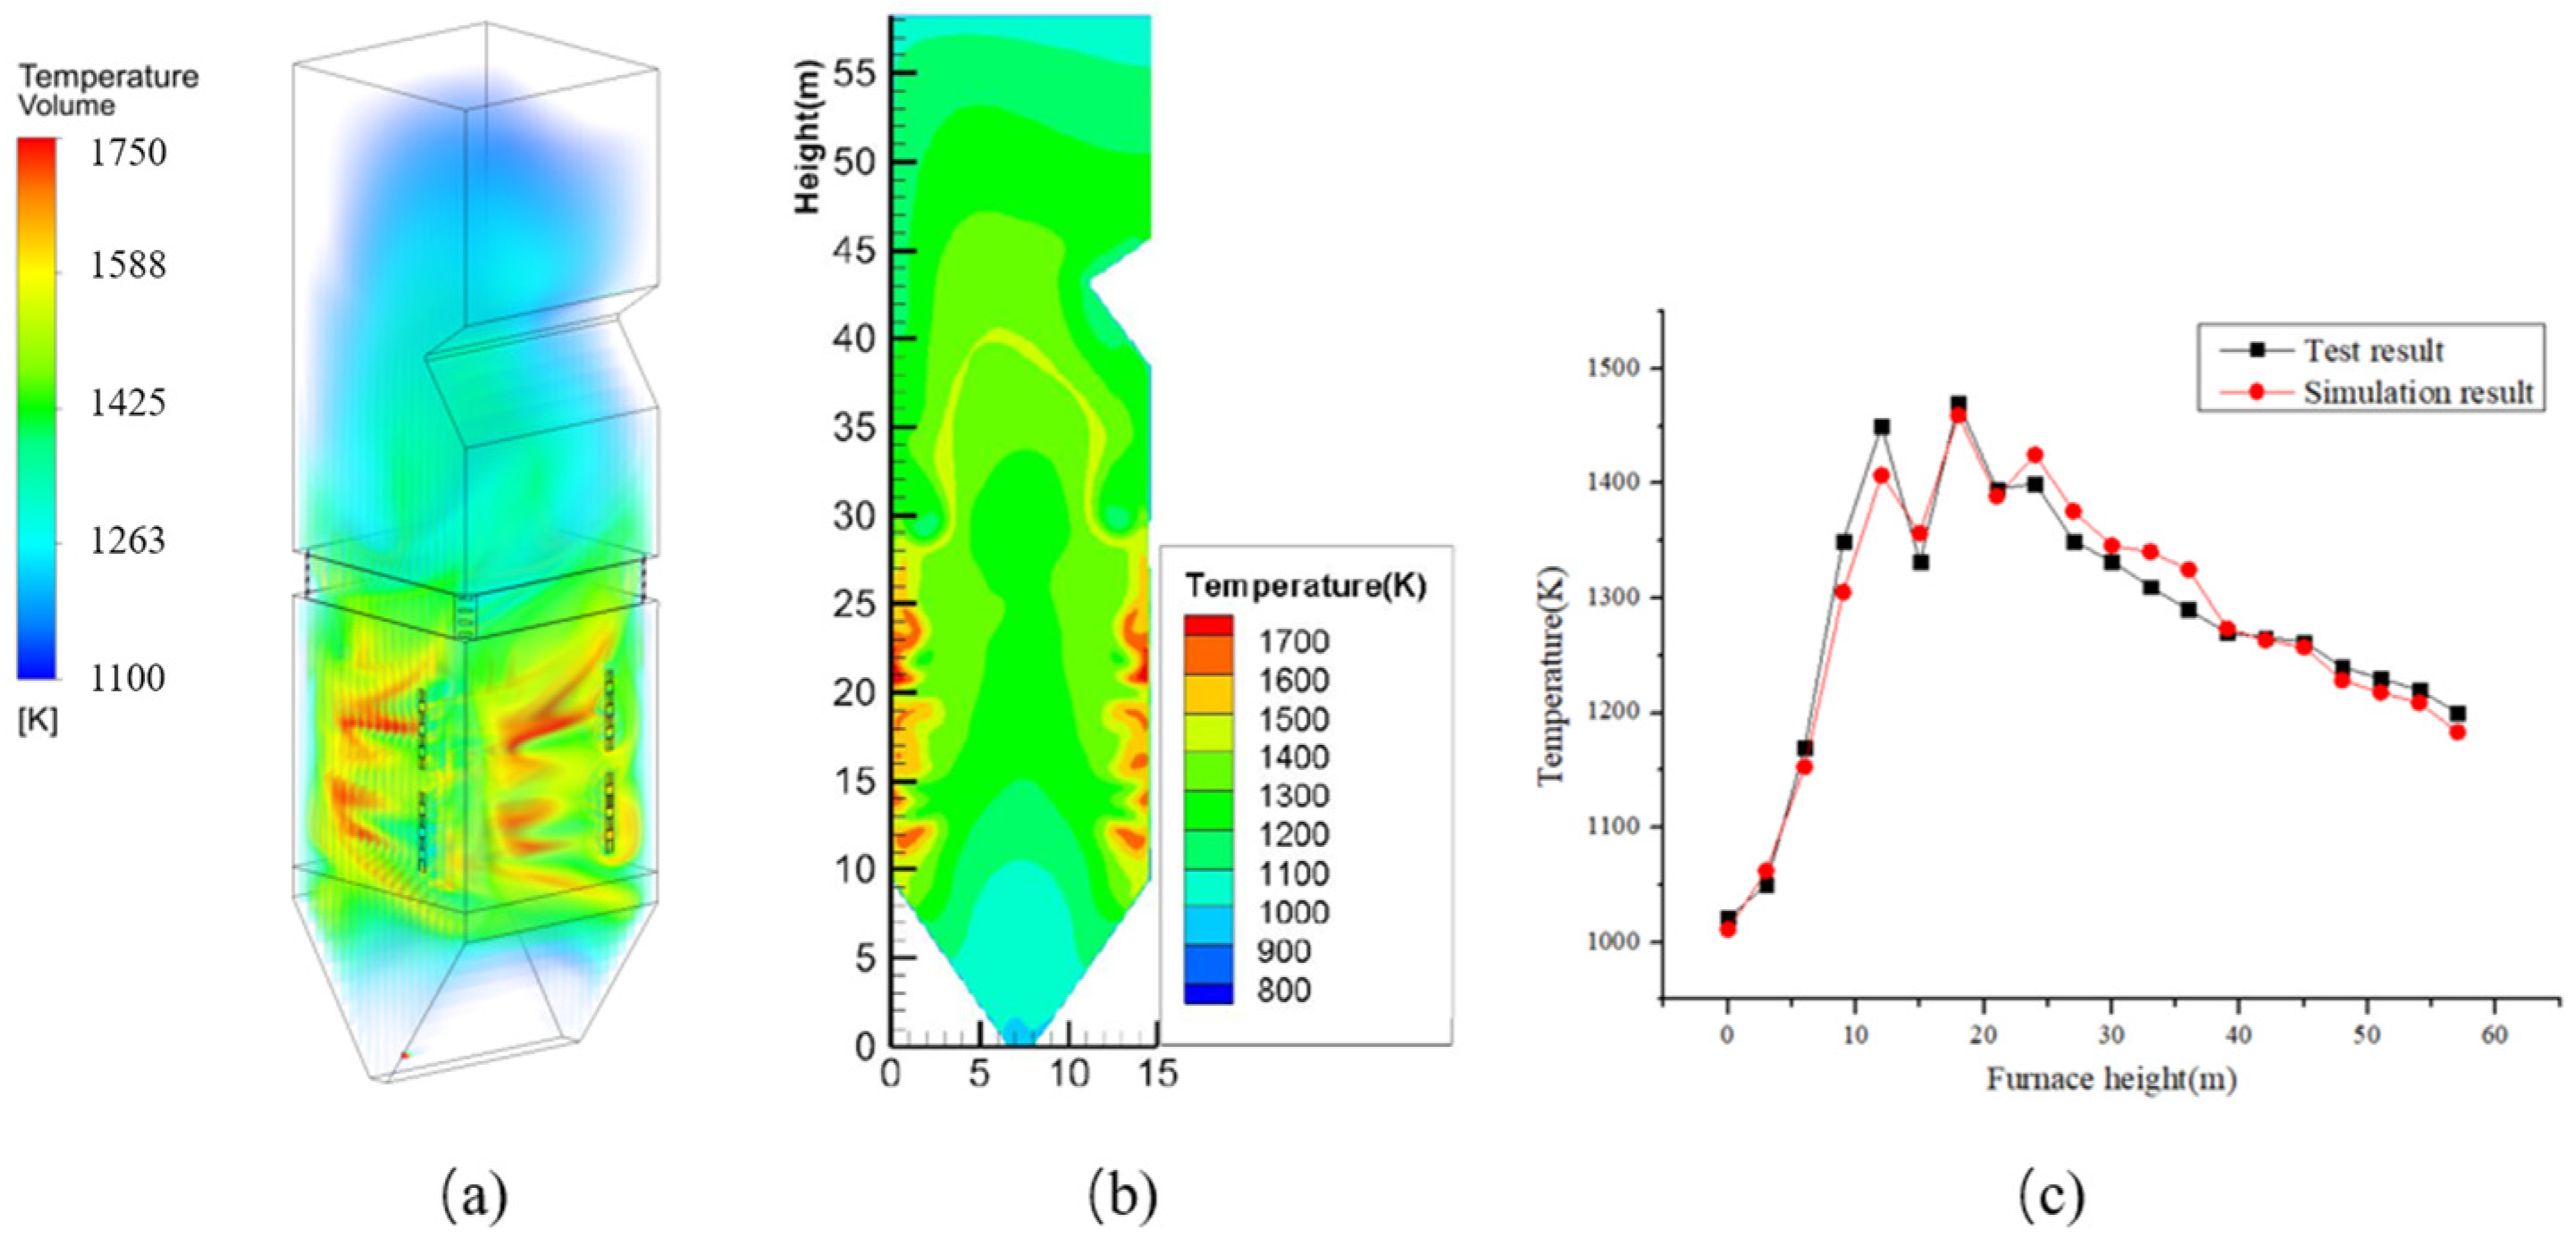
Figure 5 is the longitudinal temperature distribution of the furnace, from the figure can be seen in the furnace temperature distribution transition state and fullness of good, coal from the nozzle after the rapid heating ignition, release a lot of heat. The temperature field appears as a “hump” type high temperature zone. As can be seen from the folding diagram, the cold ash hopper, because it is far from the pulverized coal combustion area, no high-temperature flue gas flushing, only through the flue gas radiation heat absorption, the temperature gradient is the largest. Above the combustion zone, with the height of the furnace chamber rises, the combustible part gradually burned out, water-cooled walls absorb a lot of heat, smoke temperature gradually reduced, the distribution state for the center of high, near the wall area low. The average temperature of the flue gas at the exit of the furnace chamber is 1231 K, which is basically equal to the design value of 1258 K, and it has a good matching degree with the experimental data of the power plant, as shown in Figure 5c. In summary, the combustion temperature condition obtained from the simulation is basically consistent with the actual operation law of the power station.
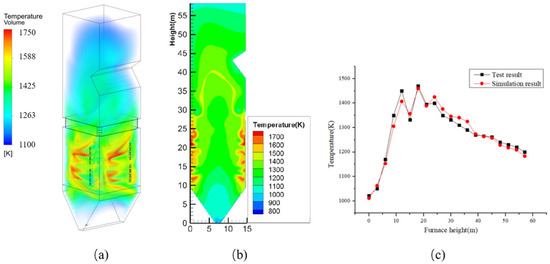
Figure 5.
Distribution diagram of longitudinal temperature in furnace. (a) Fluid domain temperature field. (b) Temperature cloud of central longitudinal section. (c) Curve of average temperature of furnace cross section with height.
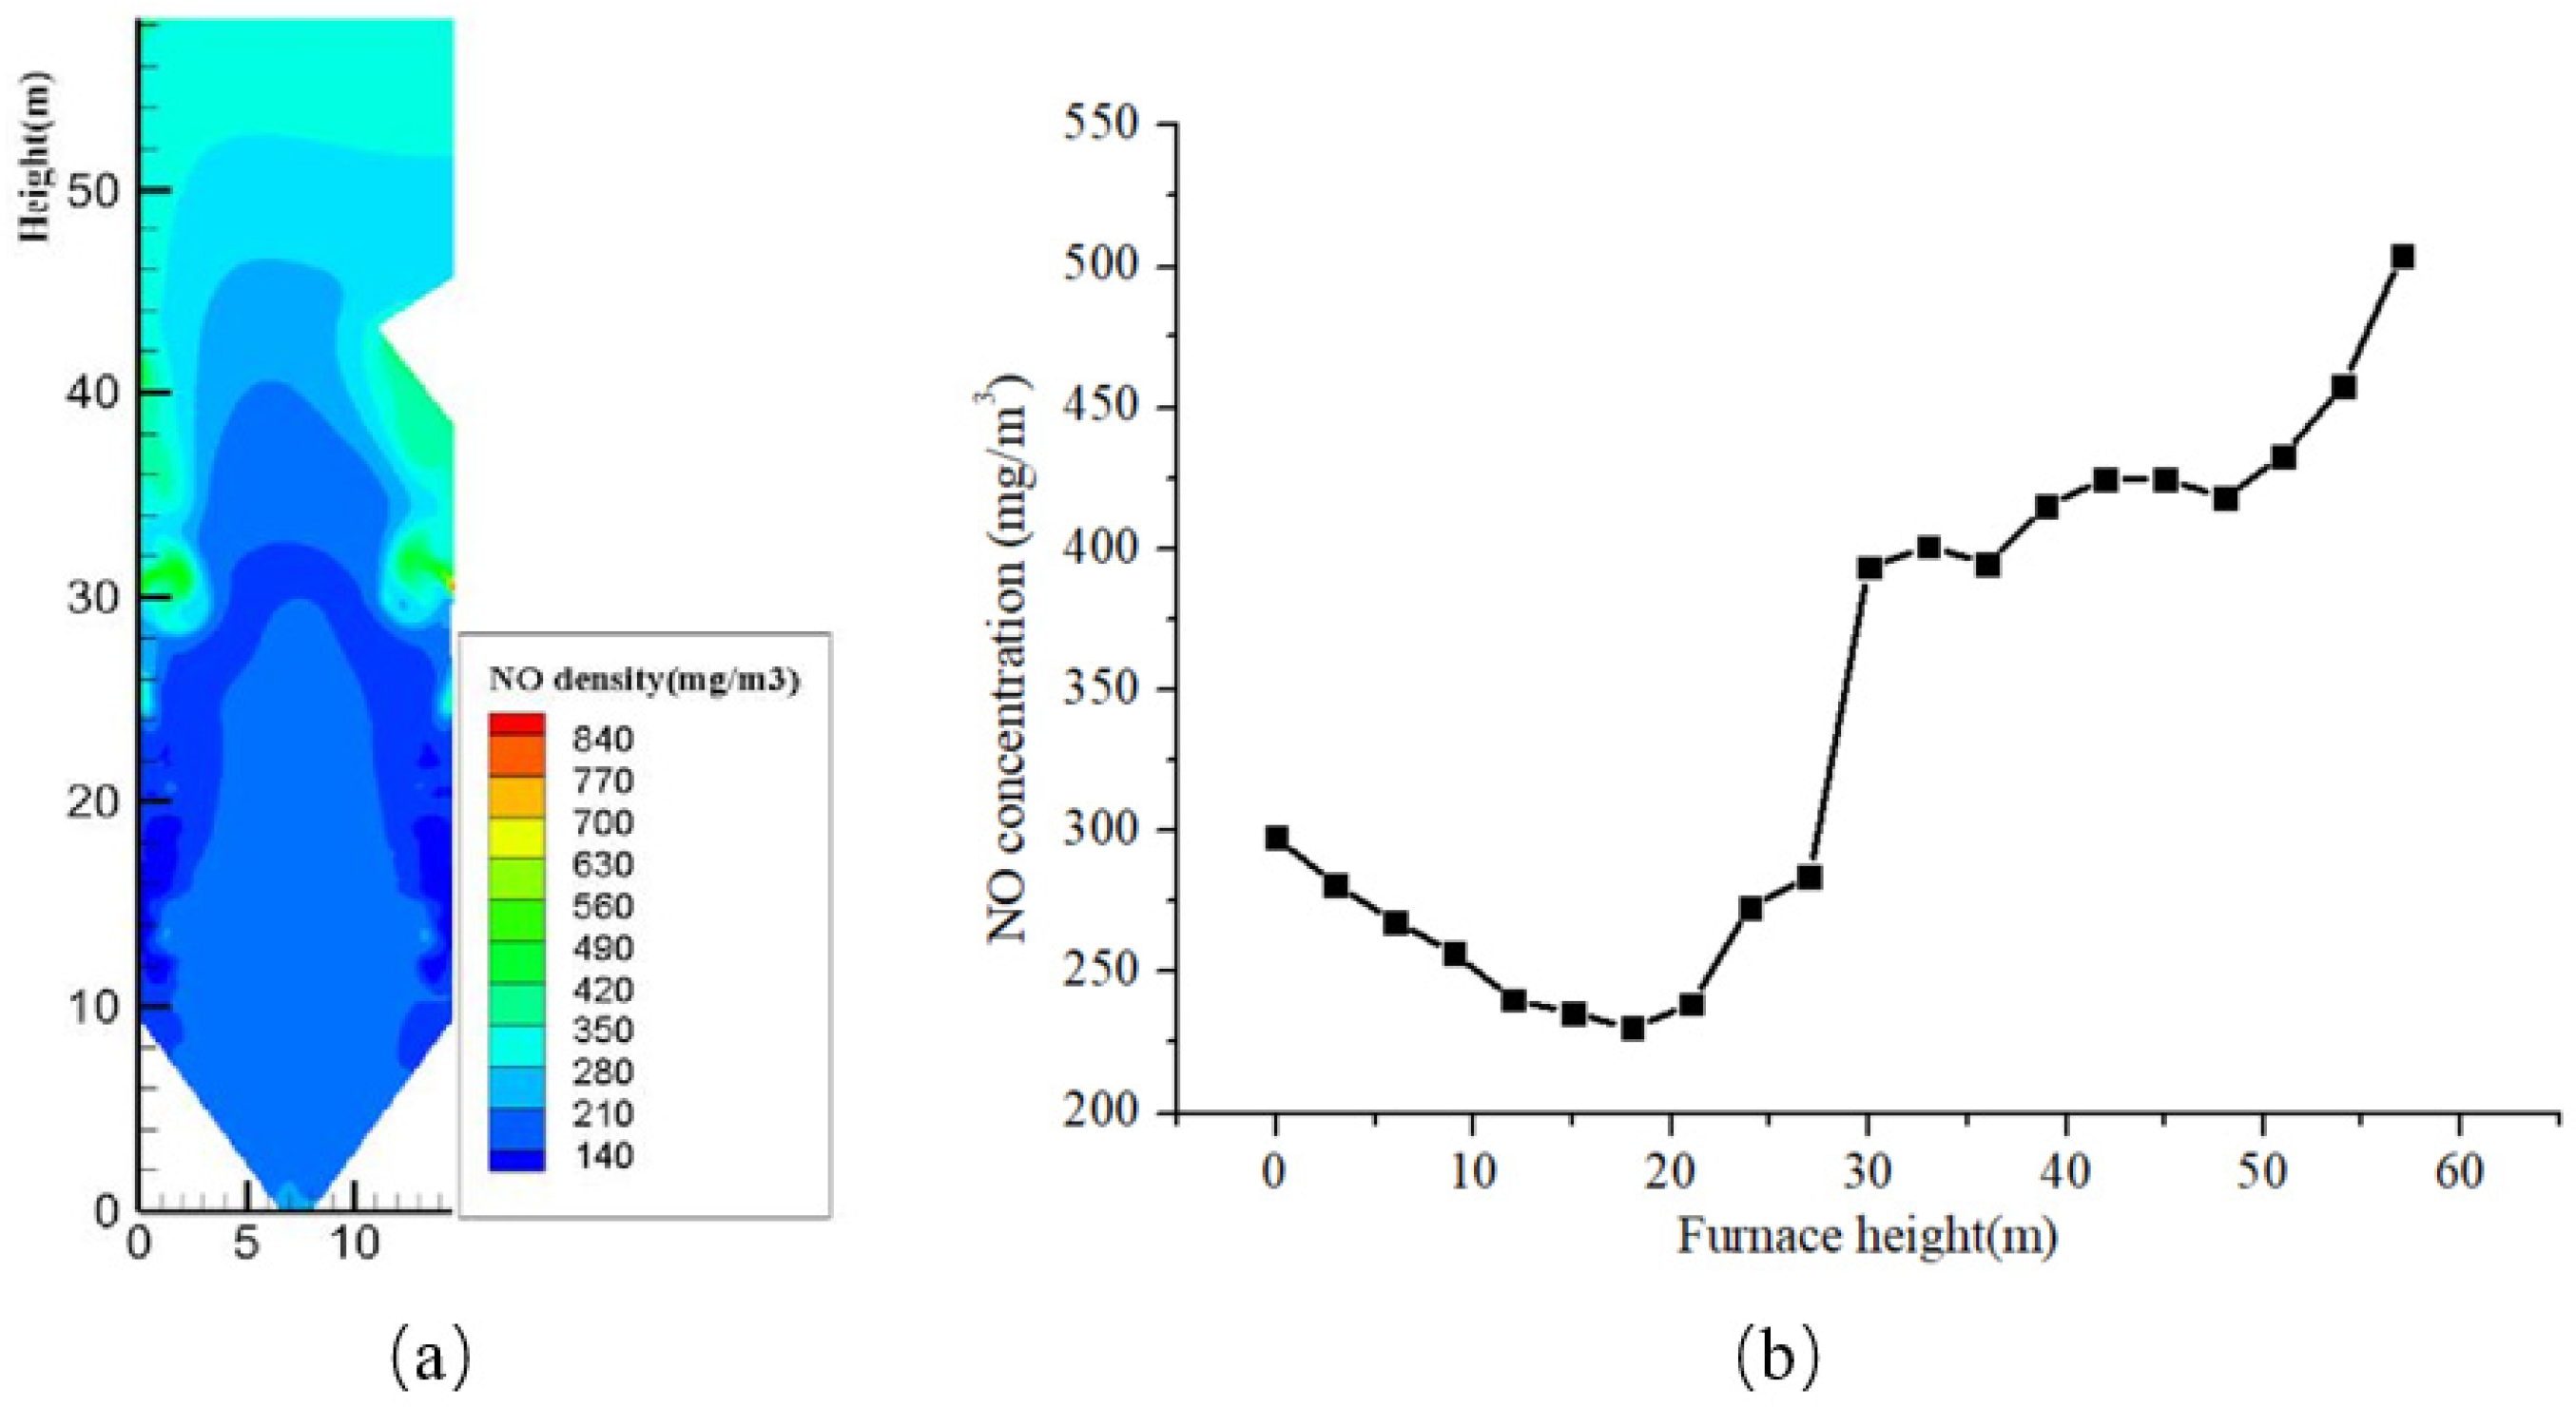
In the simulation process, the concentration of no is approximately replaced by the concentration of NOx, the Figure 6 shows the longitudinal distribution of NO concentration in the furnace. From the figure, it can be clearly observed that the restriction effect of oxygen-poor combustion on the formation of NO, and the main combustion zone is difficult to meet the formation condition of NO due to the extremely low oxygen content. Above the combustion zone, the concentration of NO increases with the height increasing, and due to the sudden supplement of oxygen, NO concentration has a jump near the sofa zone. The average concentration of NO at furnace outlet is 458.3 mg/m3. The variation law of no concentration is consistent with the actual law of power plant. To sum up, the model established in this paper has good reliability.
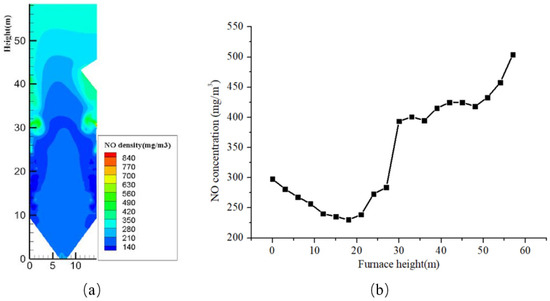
Figure 6.
Distribution diagram of NO concentration in 350 MW furnace (mg/m3). (a) NO concentration contours of central longitudinal section. (b) NO concentration curve with height.
4.3. Optimal Air Distribution Mode
In the boiler low load operation, the primary air by adjusting the air speed and close part of the dampers to adjust the air volume, the perimeter air with the state of the primary dampers and open and close. SOFA wind by adjusting the dampers open and close part of the dampers to adjust the air volume, combustion air by adjusting the dampers open to adjust the inlet air volume, the secondary air speed set within this paper is unchanged. Combustion air usually has the following types of air distribution: positive pagoda, waist reduction and inverted pagoda air distribution. In this subsection, the furnace exit temperature, NOx concentrations and the average oxygen content are used as the base criteria to determine the best combustion air distribution methods for 280 MW, 230 MW, 180 MW and 160 MW operating conditions.
Under 280 MW and 230 MW conditions, the primary air in the D layer of the furnace is closed, the corresponding perimeter air is closed, and the SOFA damper in the S1 layer is closed. Under 180 MW and 160 MW conditions, the primary air in the B and D layers of the furnace is closed, the corresponding perimeter air dampers is closed, the SOFA dampers in S1 and S3 layers are closed. The combustion air damper openings of the three different air distribution methods under the four conditions are shown in Table 8. P, W, I represent positive pagoda, waist reduction and inverted pagoda air distribution method, respectively, in which the total amount of incoming air of various air distribution methods is equal, and the combustion air damper opening in the FF layer does not change with the change of air distribution methods.

Table 8.
Combustion damper opening under different air distribution methods (%).
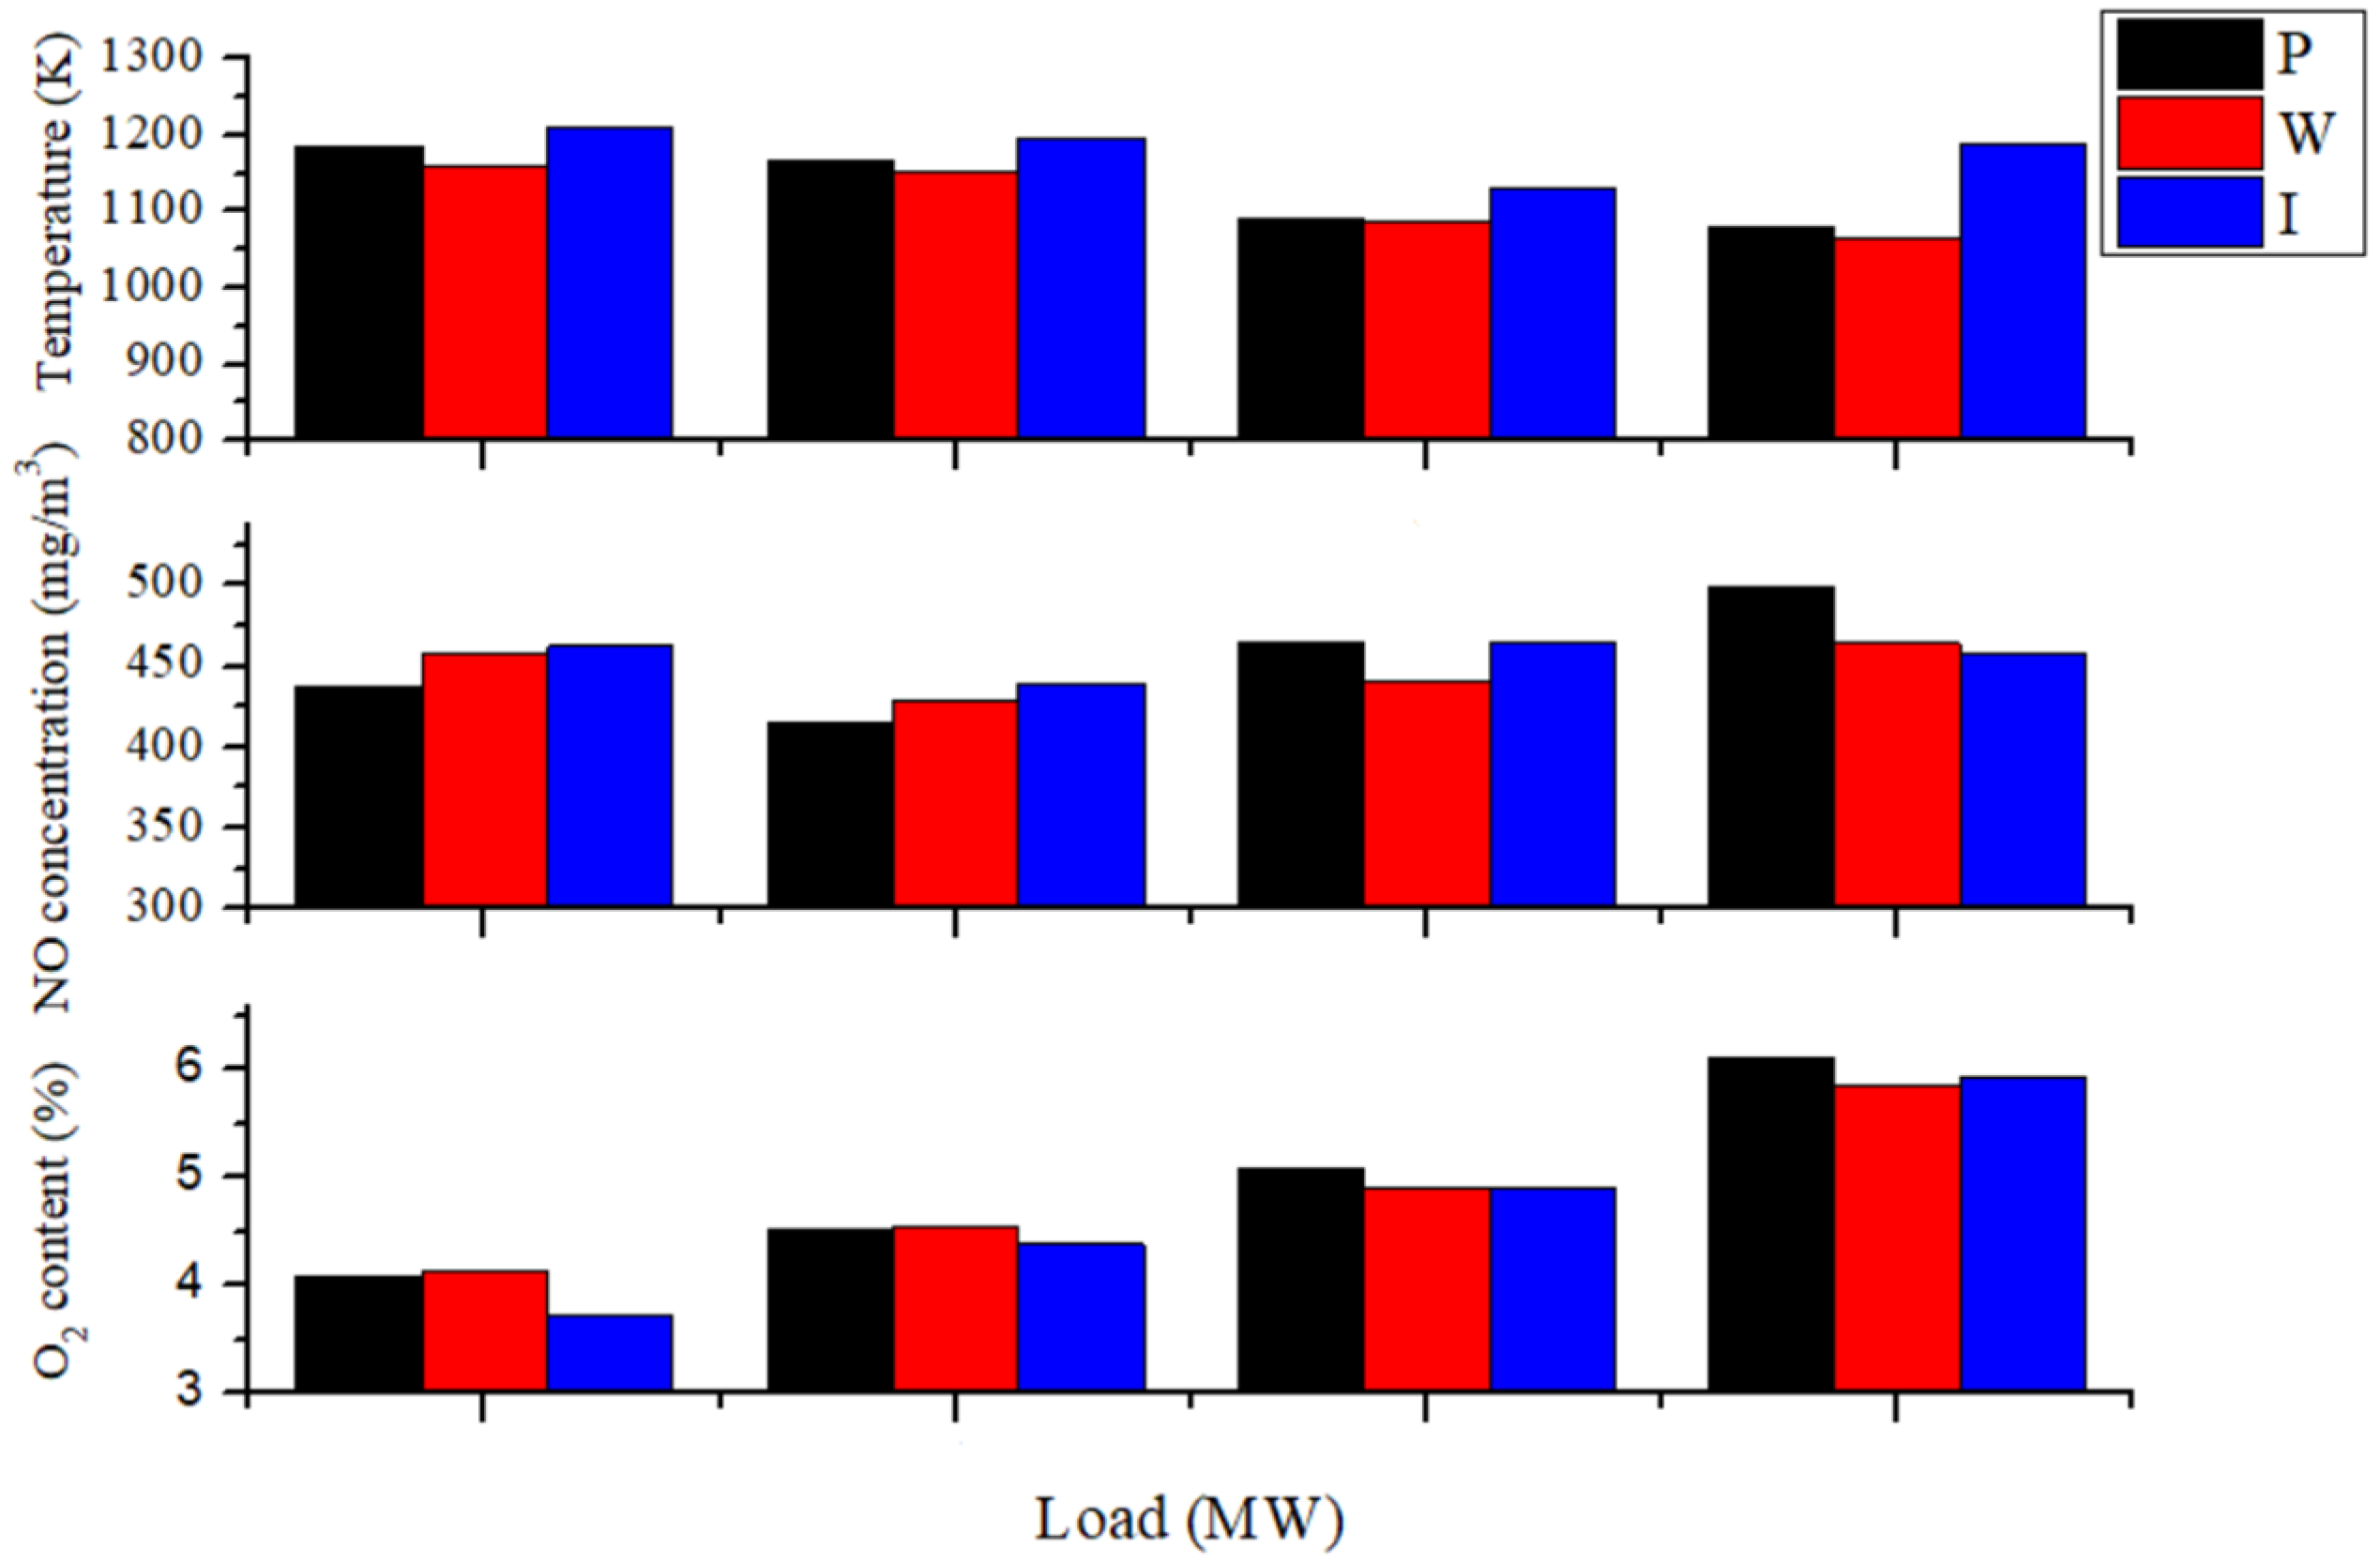
After simulation analysis, the data of temperature (T), NO concentration (NO) and O2 content (O2) at the outlet of the furnace for different loads and different air distribution methods are shown in Figure 7. The oxygen content at the furnace outlet increases with the decrease of load. The combustion temperature in the furnace is lower at low load, and in order to reduce the heat loss of incomplete combustion, the air volume is increased to ensure the full combustion of pulverized coal, and the lower the load, the higher the increase of oxygen volume. The NO emission does not decrease with the decrease of load. While the load decreases, the nitrogen content in the fuel and air decreases, the ignition temperature decreases, and the oxygen content in the flue gas increases. Comparing with the three air distribution schemes. Under 280 MW load, the NO emission concentration of positive pagoda air distribution is the lowest, and in terms of furnace exit temperature and average oxygen content, the difference between positive pagoda air distribution and the design value is the smallest, so positive pagoda air distribution scheme is chosen as the air distribution method of 280 MW load. Similarly, positive tower air distribution scheme is selected as the air distribution method for the combustion air at 160 MW load. The waist reduced air distribution scheme is selected as the air distribution method for the combustion air at 230 MW load and180 MW load.
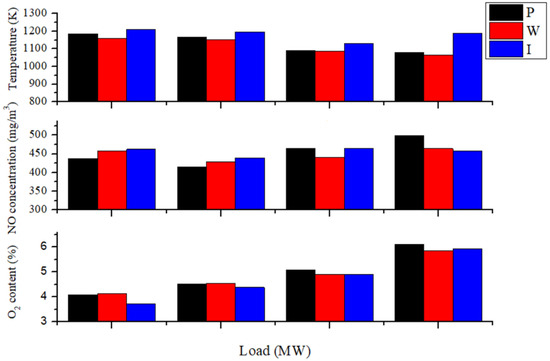
Figure 7.
Outlet temperature, NO concentration, O2 content at different loads.
Through the simulation under four working conditions, adjusting different combustion air dampers methods and observing the changes of the above three parameters, the optimal combustion air distribution methods for several typical loads were obtained, as shown in Table 9.

Table 9.
The table of optimal air distribution of combustion air under typical load (%).
5. Determine the Adjustment Strategy of Air Distribution
In the actual operation of power station boilers, the oxygen output from the furnace is used as the basis for adjusting the inlet air volume judgment. Based on the best air distribution method and SOFA damper opening state and opening degree table under typical load determined in the previous section, the overall increase and decrease of damper opening degree is calculated, and the law of the subsequent change of the average outlet oxygen quantity is calculated to invert the adjustment amount of the damper when the oxygen quantity is too much or not enough, and the adjustment capacity of the furnace outlet oxygen quantity under each load is set to be not less than ±2%. In addition to the typical load, the combustion state of some other integer loads (integer multiples of 10) is calculated. In the process of air distribution control, a small range of load variation is ignored and the boiler load is rounded up to a multiple of 10 MW. The logic of air distribution control under variable load conditions is designed based on the law of oxygen variation, and the program is written and the graphical user interface is built.
5.1. The Influence of the Combustion Air Damper Opening Adjustment
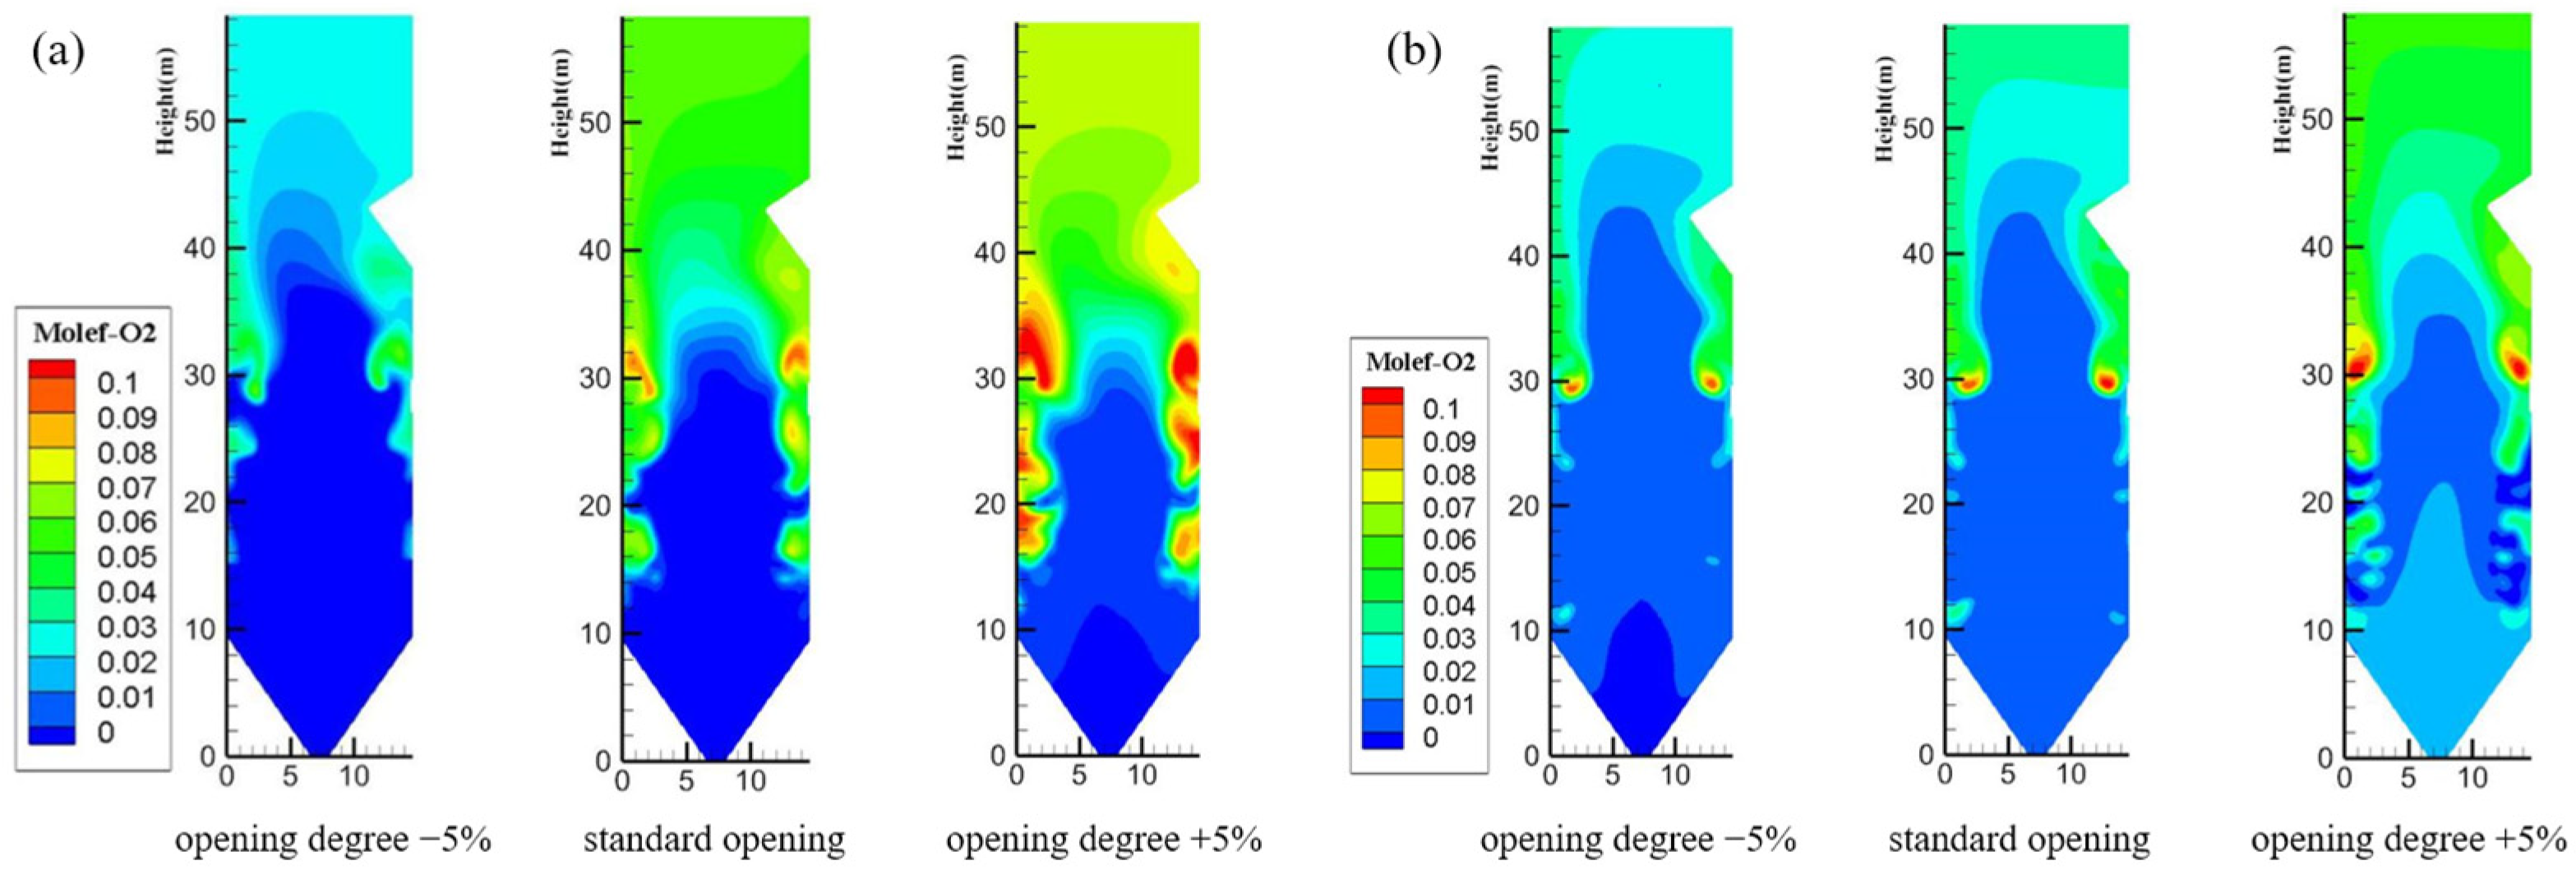
In the boiler secondary air, the proportion of combustion air accounts for about 60% of the air volume, SOFA air accounts for about 30%. The perimeter air volume is smaller and the opening and closing state is determined by the primary air door state, so here priority is given to calculating the impact of the change in the combustion air door opening on the oxygen output from the furnace chamber. This section calculates the oxygen output of the furnace for each load at the standard damper opening and the combustion damper opening of ±5% as a whole, with 180 MW and 320 MW load conditions as examples, and the simulation results are shown in Figure 8.
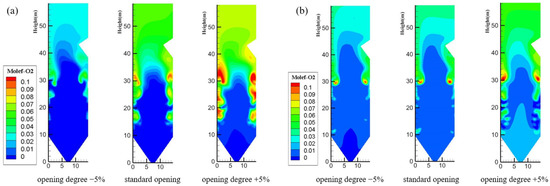
Figure 8.
The oxygen molar concentration distribution with variable combustion air opening. (a) 180 MW. (b) 320 MW.
Taking 180 MW load as an example, the furnace outlet oxygen standard value under 180 MW load is 5%, then the reasonable range under this load is 4.5% to 5.5%. The outlet oxygen content is 2.59%, 4.89% and 6.92%, respectively, under the combustion air damper opening degree at −5%, standard opening and +5% by simulation. In the actual operation process, for example, if the outlet oxygen content detected by the sensor is 4.1%, which is lower than the reasonable range, the air damper opening degree should be increased, and the increase range is:
where 5% refers to the base range of the dampers opening variation. In this case, (4.89 − 4.1%)/(4.89 − 2.59%) is the dampers adjustment ratio calculated based on the simulation results and the oxygen content monitoring value. The calculation result is rounded to the whole number.
Figure 8b shows the distribution of oxygen molar concentration for 320 MW operating conditions. The oxygen molar concentration distribution of the 320 MW operating condition, the oxygen content at the furnace exit under the three damper opening conditions are 2.97%, 3.56% and 6.16%, respectively. Under high load conditions, the main combustion zone is oxygen poor, and the effect of decreasing the combustion damper opening on the oxygen distribution in the furnace is not obvious, and the overall decrease of the combustion damper opening by 5% only reduces the outlet oxygen by 0.59%, while the effect of increasing the combustion damper opening on the oxygen distribution in the furnace is more obvious.
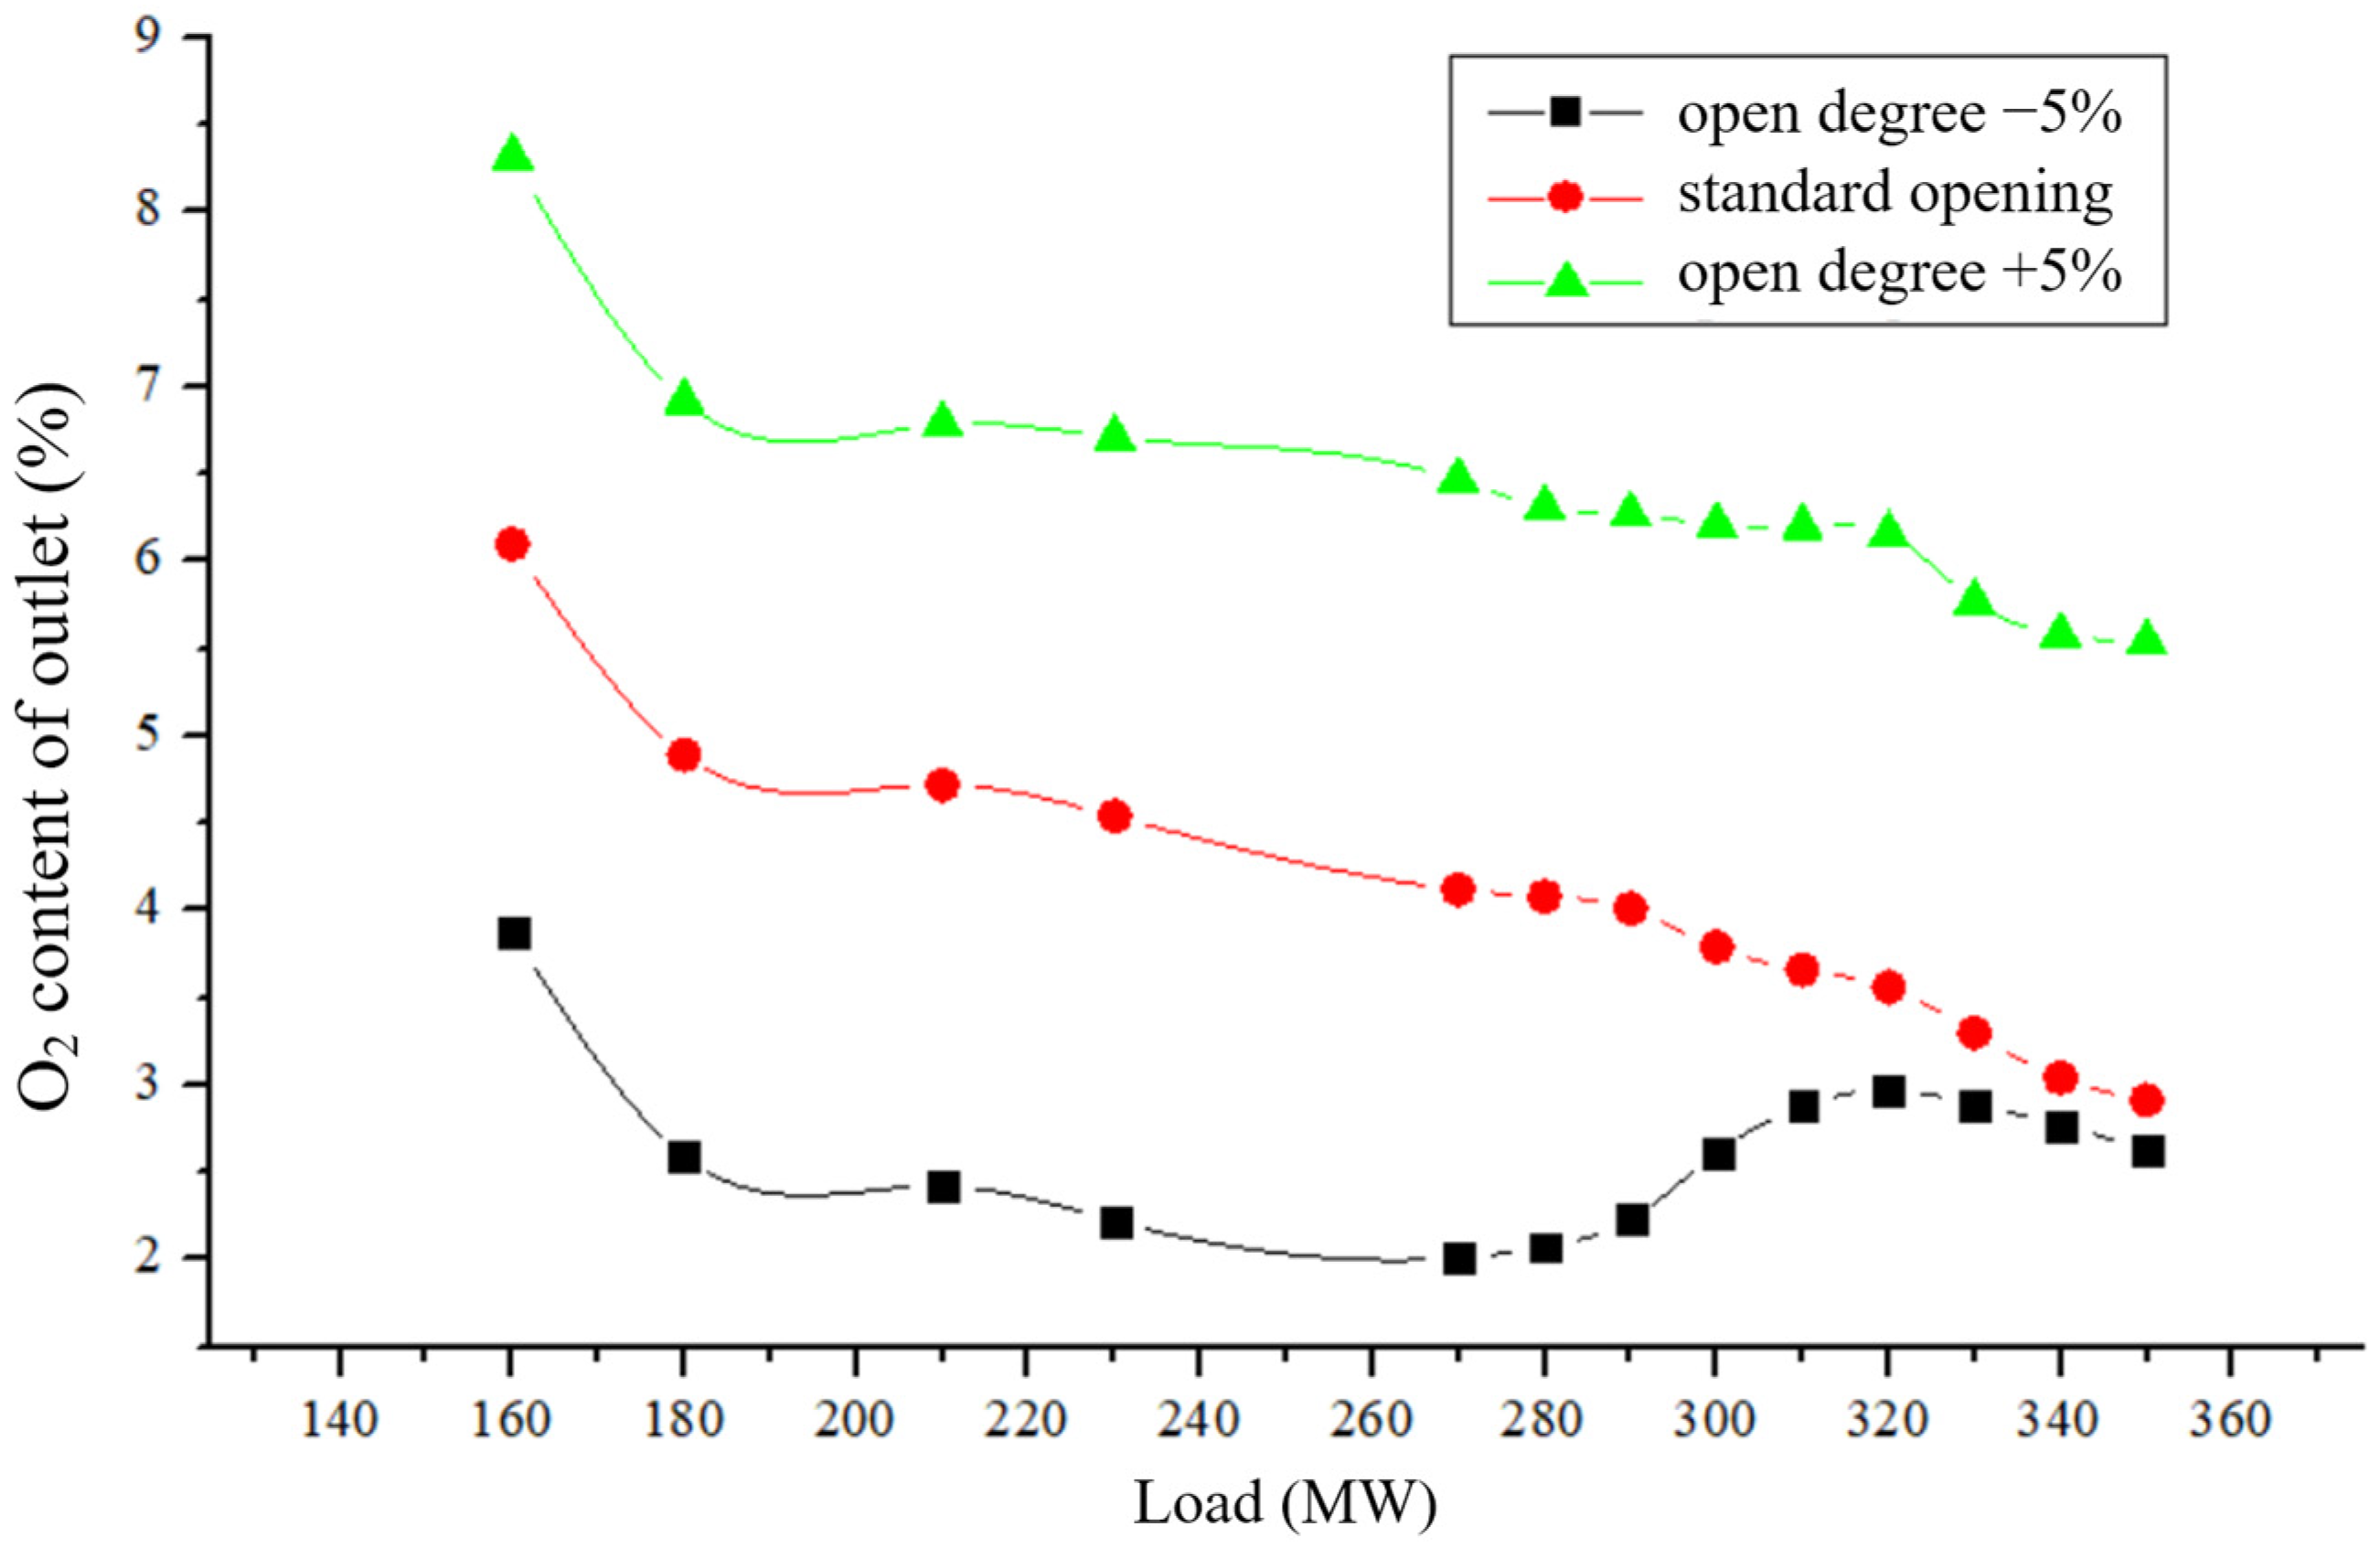
The comparison of the oxygen content of the furnace outlet under the combustion damper opening of ±5% and the standard opening was calculated, and the calculation conditions included all typical loads and some other loads (the calculation density was higher in the high load range), and the calculation results are shown in Figure 9.
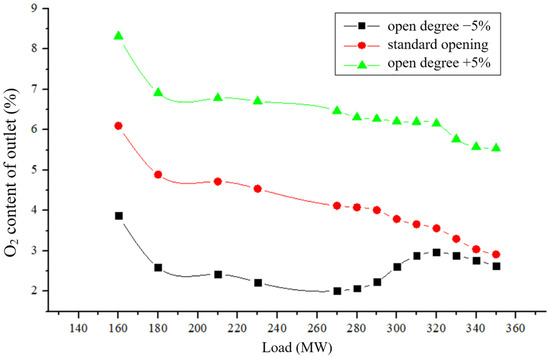
Figure 9.
The oxygen content of outlet at variable combustion damper opening.
In the range of 160–280 MW, the combustion air damper opening degree is ±5% can make the furnace outlet oxygen content change range reach ±2%. Among which the overall oxygen content at 160 MW condition is significantly different from that at other conditions. In the range of 280–350 MW, the influence of reducing the combustion air damper opening degree on the outlet oxygen is gradually reduced. It is unlikely that increasing the air content of combustion air alone can effectively solve the problem of low outlet oxygen content.
5.2. Effect of Adjusting the Opening of the Secondary Dampers
When the boiler load is higher than 280 MW and the oxygen level at the furnace outlet is lower than the reasonable range, consider adjusting the SOFA air and combustion air dampers opening jointly to improve the oxygen level above the furnace chamber. The SOFA air dampers opening status and opening degree in the Table 10. are all typical load conditions, and the dampers opening status under the rest of the load is calculated by linear interpolation. If the SOFA air dampers are adjusted to 100% opening and still cannot meet the requirements, the combustion air dampers will be adjusted. Under the full load 350 MW working condition, the SOFA air damper opening is already 100%, and only the combustion air damper can be adjusted.

Table 10.
SOFA dampers opening status and opening degree (%).
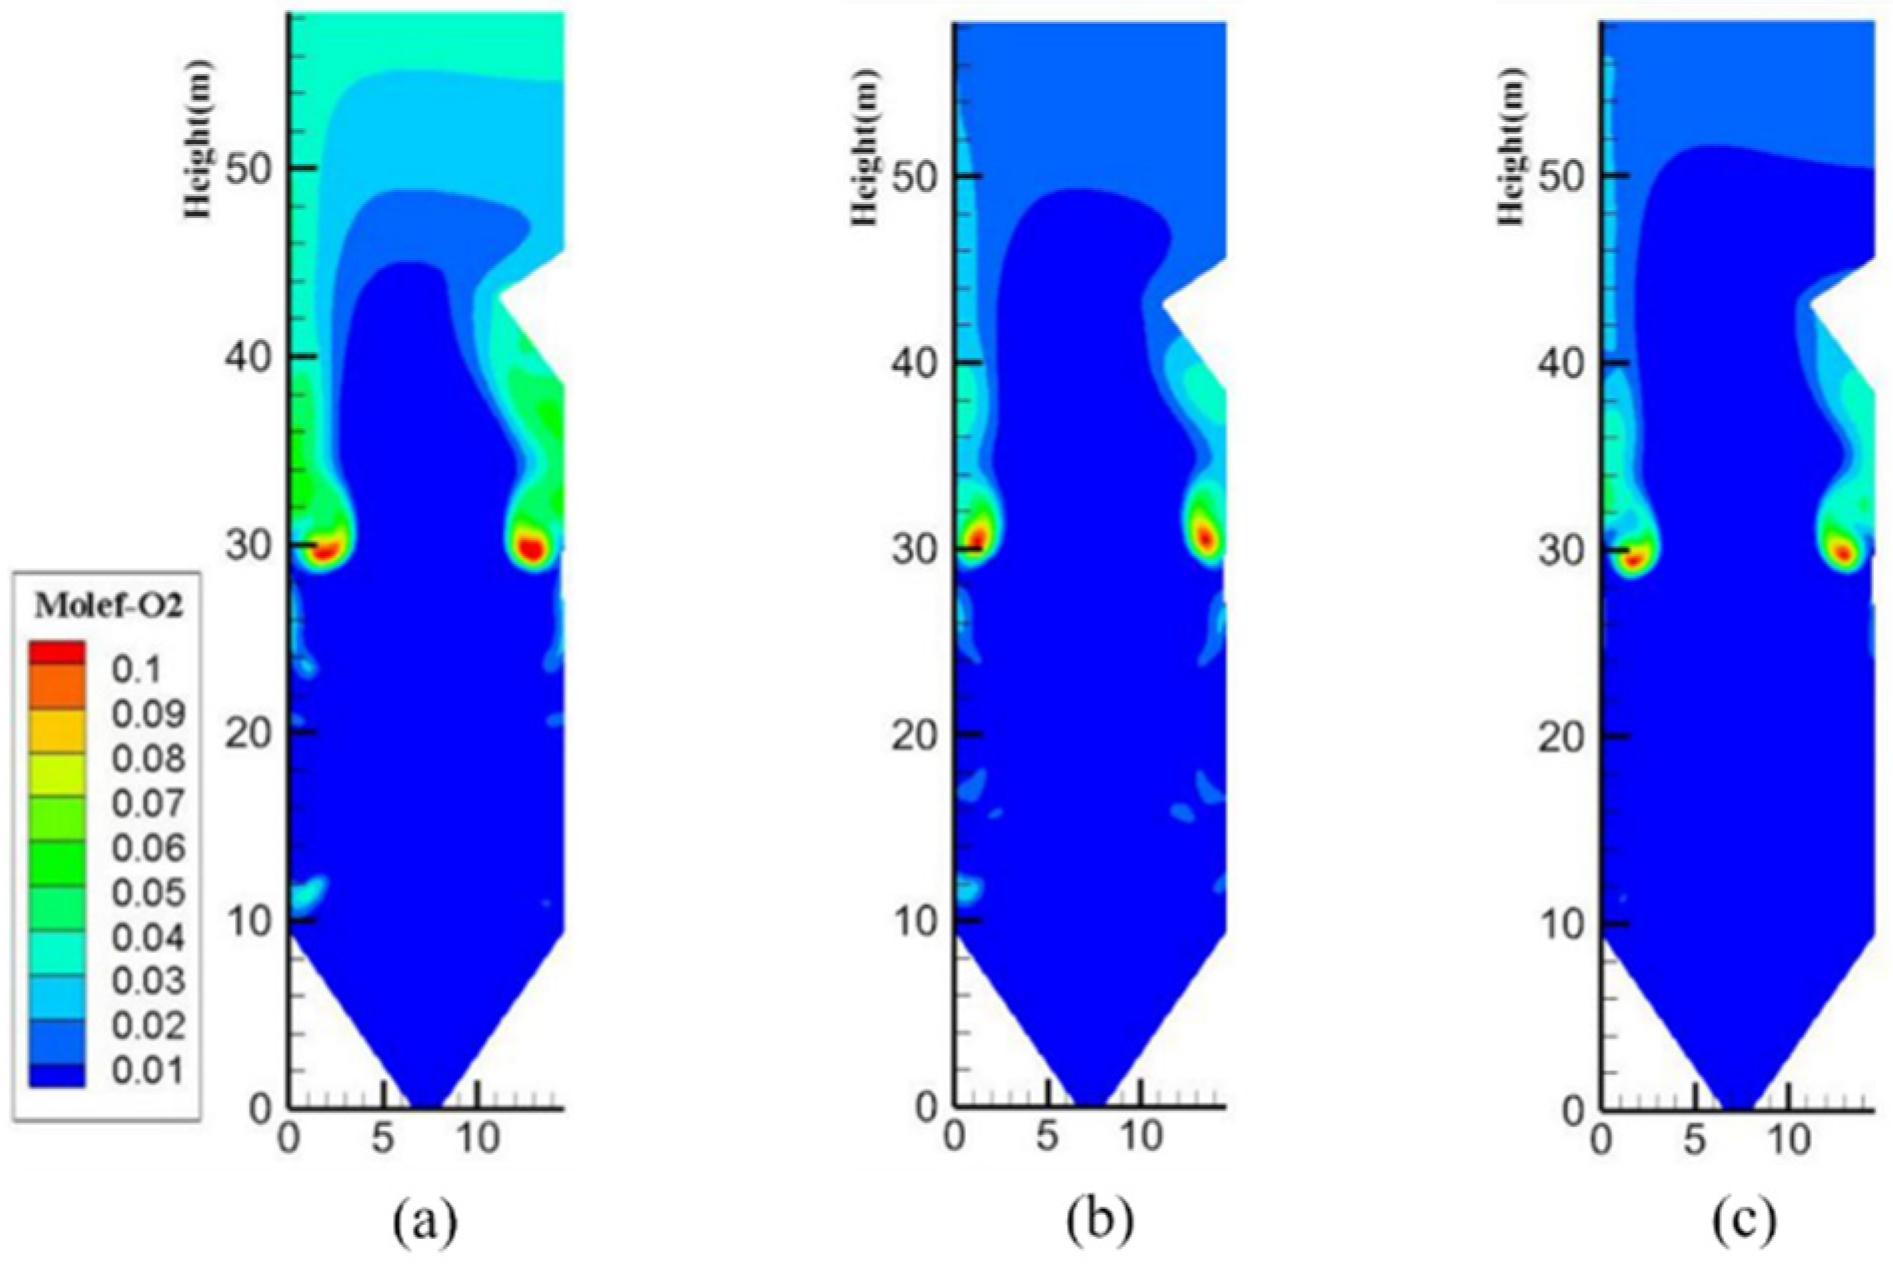
The oxygen distribution after reducing the 350 MW combustion damper door opening is shown in Figure 10 The overall reduction of the damper opening by 5%, 10% and 15% results in 2.63%, 1.77% and 0.59% of the furnace outlet oxygen, respectively, while the outlet oxygen at the standard opening is 2.91%, i.e., 15% reduction of the combustion damper can meet the requirement of 2% reduction of the outlet oxygen.
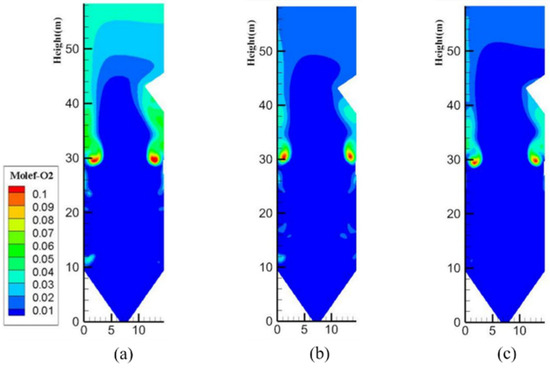
Figure 10.
Variable combustion air opening 350 MW oxygen molar concentration distribution. (a) Opening degree −5%. (b) Opening degree −10%. (c) Opening degree −15%.
Calculation of the effect of secondary air adjustment on the oxygen level at the furnace port under 290–350 MW load conditions is shown in Table 11.

Table 11.
290–350 MW influence of different air distribution modes on the outlet oxygen.
5.3. Air Distribution Control Strategy
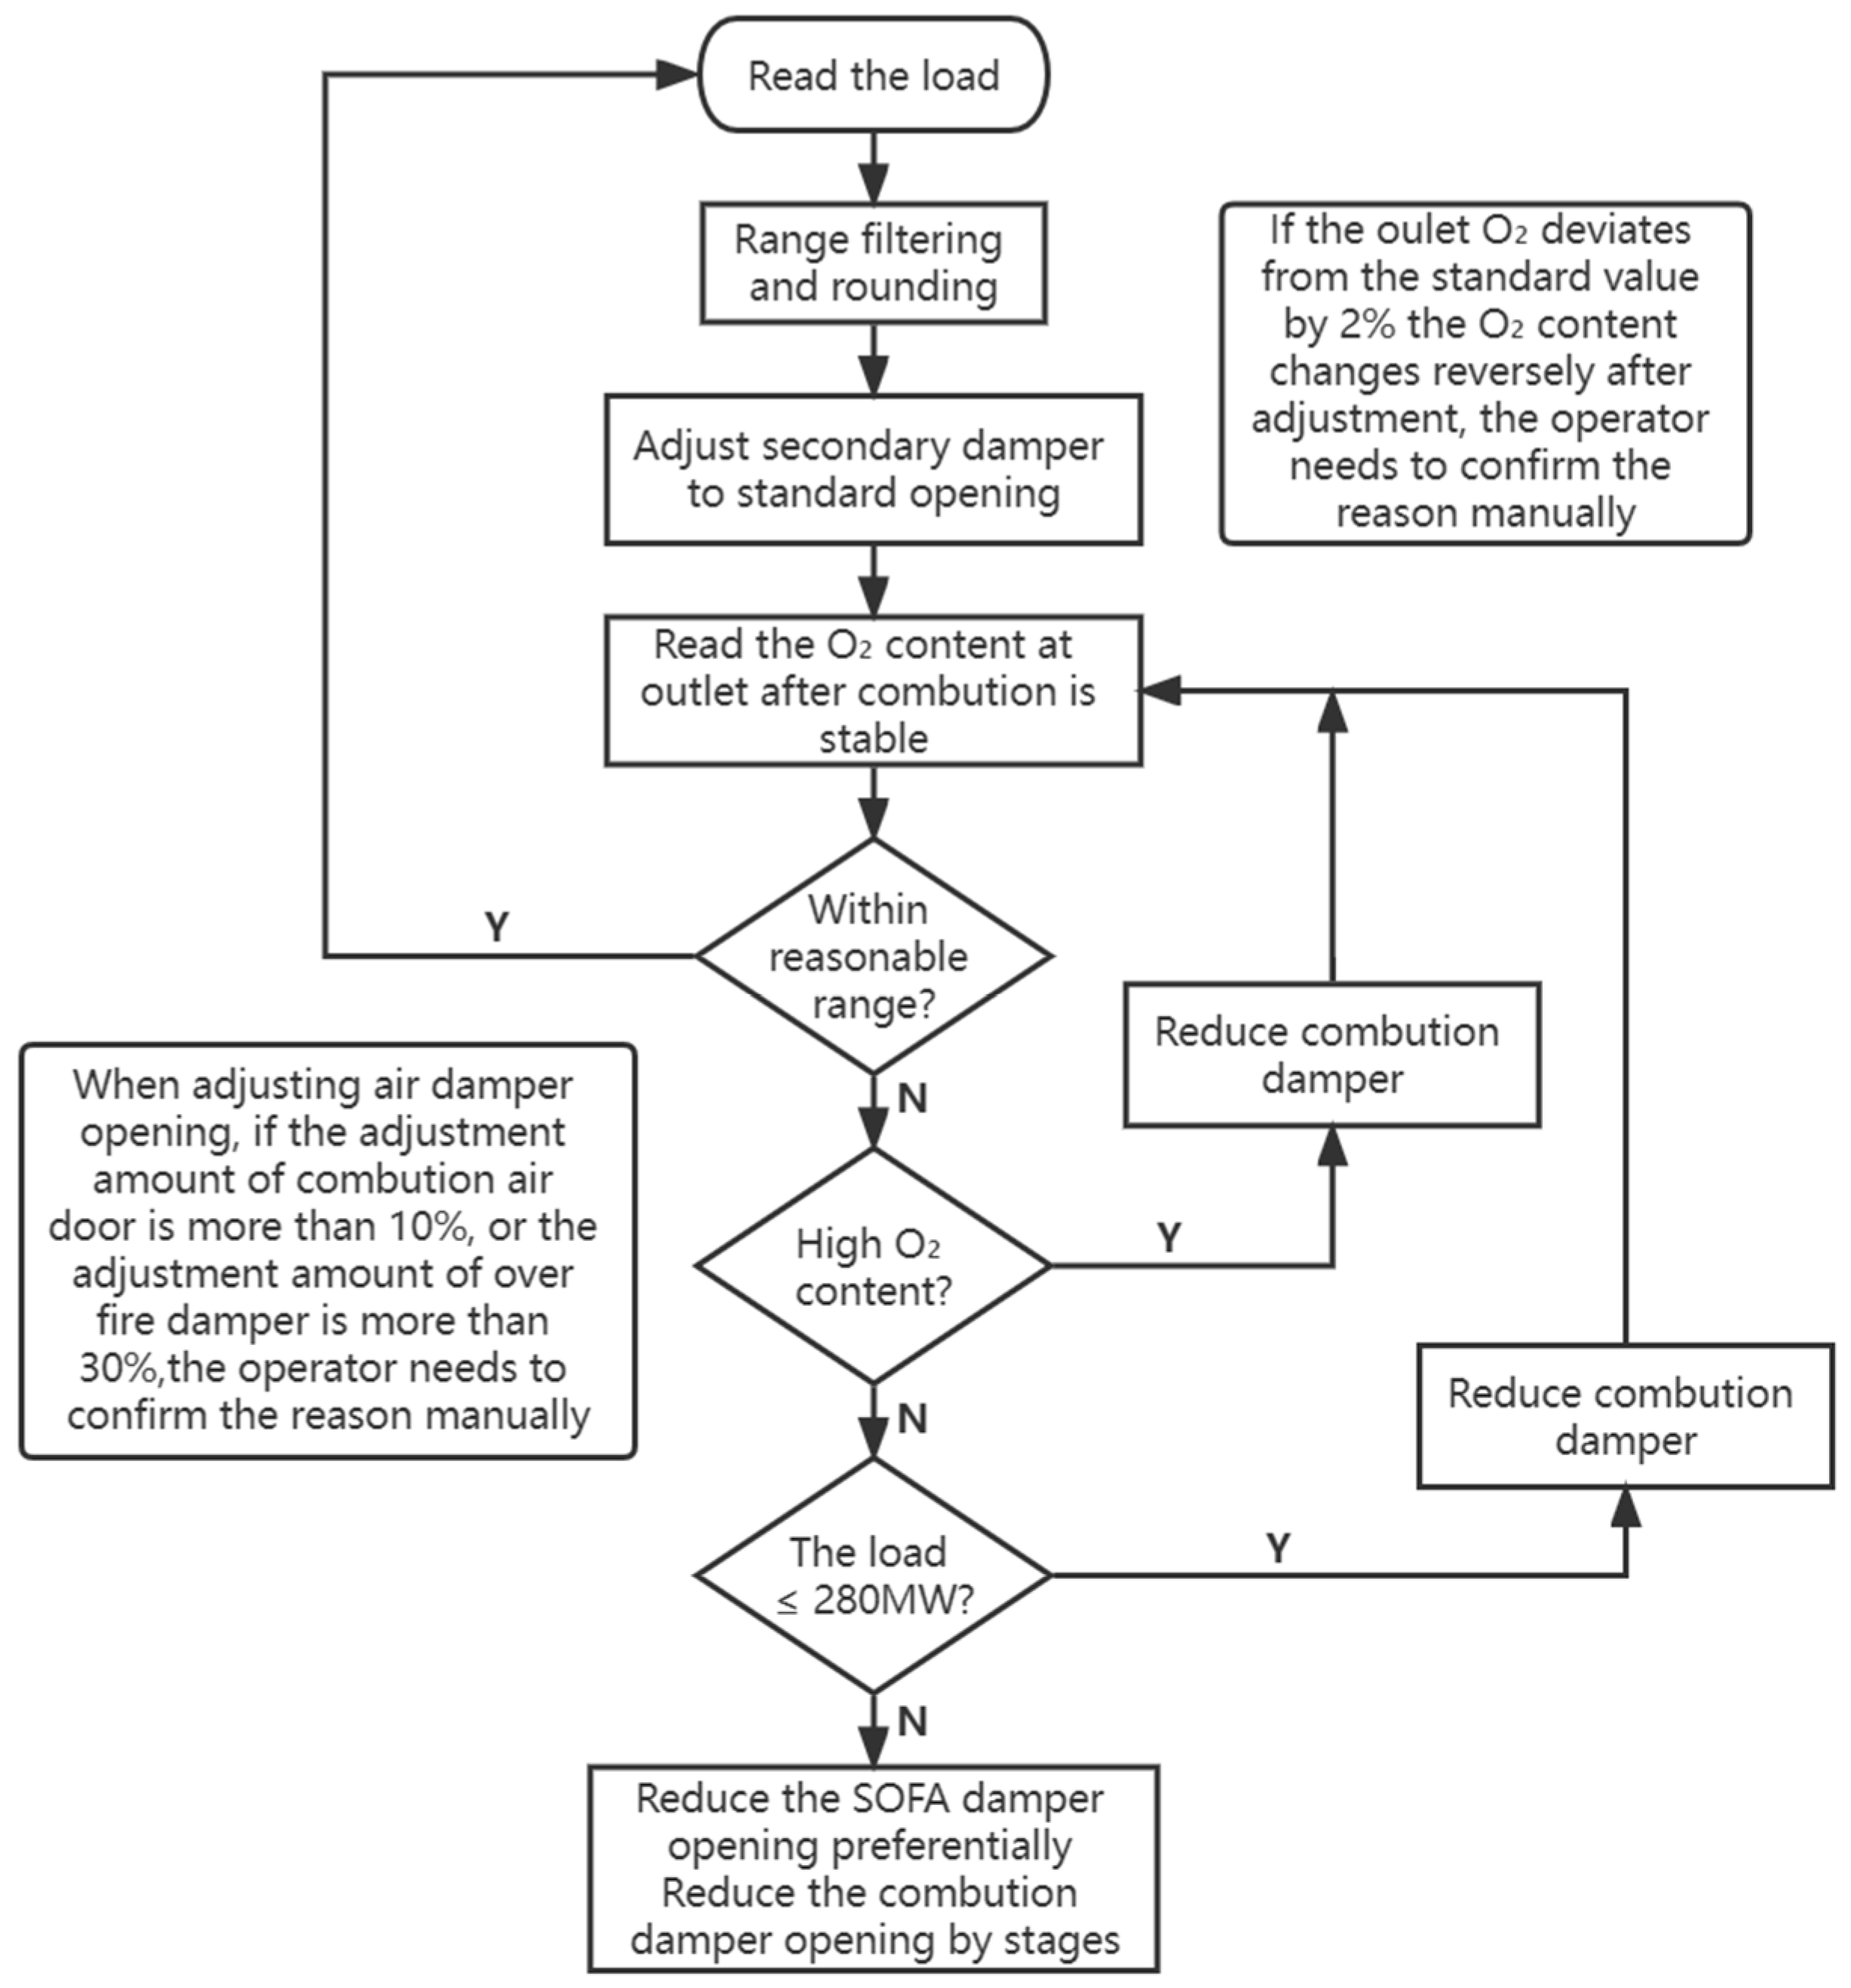
Based on the data obtained from the previous article, the program is written to automatically control the boiler air distribution, because the actual operation of the power station boiler ignores the small range of load changes, the data used and the boiler load in the control process are integer multiples of 10, in the simulation process, because the law is more similar, part of the low load conditions are not calculated, here the linear interpolation method instead of finding. Considering the accuracy of the actual air distribution process, the program is written In consideration of the accuracy of the actual air distribution process, the dampers involved in the process are rounded. The program is written with the boiler load and the furnace outlet oxygen as the input quantity, and the combustion air and SOFA dampers opening as the variable output quantity, and the brief program flow is shown in Figure 11.
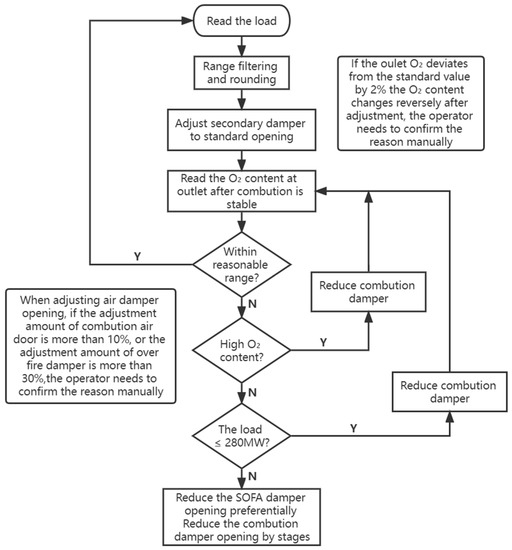
Figure 11.
Flow chart of air distribution control strategy.
(1) The program intermittently reads the boiler load, setting the initial read load as Q1 and the later read load as Qn. When the difference between Q1 and Qn is less than 10 MW, it is defined as a small load change and the program ignores it. When the difference between Q1 and Qn is greater than 10 MW, the program starts running again from the read load and redefines Q1. The filtered load is subjected to rounding operation.
(2) Adjust the parameters of primary air, pulverized coal and circumferential air according to the load, and adjust the combustion air and SOFA air to the standard opening according to Table 4 and Table 9 and linear interpolation calculation.
(3) When the combustion state in the furnace is stable (the time required is unknown here), read the oxygen concentration of the sensor at the furnace outlet, and if the oxygen content is in a reasonable range, keep the existing damper opening unchanged until the load changes or the outlet oxygen level is abnormal.
(4) If the oxygen content is not in a reasonable range, adjust the secondary damper opening according to some data in Table 10 and data in Table 11. When the oxygen content is high, adjust by reducing the combustion damper opening. When the oxygen content is low and the load is less than or equal to 280 MW, adjust by increasing the combustion damper opening. When the oxygen content is low and the load is greater than 280 MW, increase the SOFA damper opening as a priority, and if it cannot meet the demand, increase the combustion damper opening in sections on this basis.
(5) When one secondary air damper adjustment still cannot meet the demand, multiple adjustments will be made, and the adjustment range will be based on the effect of the previous adjustment on the export oxygen quantity. When the adjustment is too much, if the oxygen quantity changes from below the reasonable range to above the reasonable range after one adjustment, the adjustment will also be reverse linear based on the effect of the previous adjustment on the export oxygen quantity.
6. Conclusions
This paper takes one supercritical 350 MW coal-fired boiler as the research object, carries out thermal calculation of furnace combustion. It calculates the relatively better air distribution method under typical load, and the change law of oxygen quantity at the outlet of the furnace with the adjustment of secondary air volume, and builds a model of air distribution control strategy based on the simulation results.
The cold state simulation calculation under full load and the combustion calculation of each load were carried out, and the combustion and emission results of each working condition were processed and analyzed, in which the oxygen content at the furnace outlet increased with the decrease of load, and the NO emission did not decrease with the decrease of load, and the effect of combustion air on the reduction in flue gas temperature was more obvious at lower loads. Under the low load operating conditions, the combustion conditions of four typical operating conditions of positive pagoda, reduced waist and inverted pagoda air distribution methods were calculated, respectively. The better performing air distribution method was selected, positive pagoda air distribution was selected at 160 MW and 280 MW load, and positive pagoda air distribution was selected at 180 MW and 230 MW load.
Based on the selected air distribution method and SOFA damper opening status and degree, the overall increase and decrease of the damper opening, calculate the law of the export average oxygen change, invert the adjustment amount of the damper when the oxygen is too much or not enough, and design the air distribution control logic under variable load conditions based on the law of oxygen change, in which when the oxygen is high, it can be adjusted by reducing the opening degree of the combustion damper. When the oxygen is low and the load is less than or equal to 280 MW, it can be adjusted by increasing the opening degree of the combustion damper. when the oxygen level is low and the load is greater than 280 MW, the priority is to increase the opening of the SOFA damper, and if the demand cannot be met, the opening of the combustion damper will be increased on this basis.
However, in actual working conditions, the air distribution structure of boiler is more complex, and the rules of air dampers at each floor are different, and the secondary air speed varies in a small range, so there is a certain error in the calculation results.
Author Contributions
Methodology, Z.J.; Resources, Y.Z.; Writing—original draft, Y.S.; Writing—review & editing, Y.J. All authors have read and agreed to the published version of the manuscript.
Funding
Royal Academy of Engineering of United Kingdom under the UK-China Industry Academia Partnership Programme scheme (UK-CIAPP\201).
Data Availability Statement
No new data were created or analyzed in this study. Data sharing is not applicable to this article.
Conflicts of Interest
The authors declare no conflict of interest.
References
- Han, S.; Iop. Research on the market mechanism of generation grid load storage interaction to promote new energy consumption. In Proceedings of the 2020 International Symposium On Energy Environment and Green Development, Chongqing, China, 20 November 2020. [Google Scholar]
- Stanytsina, V.; Artemchuk, V.; Bogoslavska, O.; Zaporozhets, A.; Kalinichenko, A.; Stebila, J.; Havrysh, V.; Suszanowicz, D. Fossil Fuel and Biofuel Boilers in Ukraine: Trends of Changes in Levelized Cost of Heat. Energies 2022, 15, 7215. [Google Scholar] [CrossRef]
- Horbaniuc, B.; Marin, O.; Dumitraşcu, G.; Charon, O. Oxygen-enriched combustion in supercritical steam boilers. Energy 2004, 29, 427–448. [Google Scholar] [CrossRef]
- Bartela, Ł.; Gładysz, P.; Ochmann, J.; Qvist, S.; Sancho, L.M. Repowering a Coal Power Unit with Small Modular Reactors and Thermal Energy Storage. Energies 2022, 15, 5830. [Google Scholar] [CrossRef]
- Lyu, J.F.; Yang, H.R.; Ling, W.; Nie, L.; Yue, G.X.; Li, R.X.; Chen, Y.; Wang, S.L. Development of a supercritical and an ultra-supercritical circulating fluidized bed boiler. Front. Energy 2019, 13, 114–119. [Google Scholar] [CrossRef]
- Ma, D.F.; Hao, X.H. Status and Prospect of Large-scale Circulating Fluidized Bed Boiler. Adv. Mater. Res. 2012, 516–517, 444–447. [Google Scholar] [CrossRef]
- Wang, Y.H.; Li, X.Y.; Mao, T.Q.; Hu, P.F.; Li, X.C. Mechanism modeling of optimal excess air coefficient for operating in coal fired boiler. Energy 2022, 261, 125128. [Google Scholar] [CrossRef]
- Johar, C. Leveraging CFD to Boost HVAC System Engineering. ASHRAE J. 2018, 60, 68–72. [Google Scholar]
- Arab, M.A.; Gamil, A.I.; Syam, T.; Umer, M.; Ghani, S.; IEEE. Air Expulsion Analysis of an Industrial Air Valve Using CFD. In Proceedings of the 2021 12th International Conference On Mechanical And Aerospace Engineering (ICMAE), Virtual Conference, 9–12 December 2021; pp. 552–557. [Google Scholar]
- Xiao, H.; Bai, J.B.; Wu, Y.G.; Wang, J.Q.; Yang, X.H.; Zhang, G.F. Dynamic simulation of a large scale 260t/h CFB boiler Based on SIMUCAD Platform. In Proceedings of the 2009 ISECS International Colloquium On Computing, Communication, Control, And Management, Sanya, China, 8-9 August 2009; Volume IV, pp. 246–249. [Google Scholar]
- Kang, Y.W.; Xue, Y.; Huang, W.; Li, Y.F. A Nonlinear Lumped-parameter Dynamic Model of Power Plant Boiler Superheater. Adv. Mater. Res. 2013, 732–733, 57–62. [Google Scholar] [CrossRef]
- Shen, H.S.; Wu, Y.X.; Zhou, M.M.; Zhang, H.; Yue, G.X.; Lyu, J.F. Large eddy simulation of a 660 MW utility boiler under variable load conditions. Front. Energy 2021, 15, 124–131. [Google Scholar] [CrossRef]
- Hernik, B.; Zablocki, W. Numerical research of combustion with a minimum boiler load. Arch. Thermodyn. 2020, 41, 93–114. [Google Scholar] [CrossRef]
- Wang, C.L.; Liu, Y.; Zheng, S.; Jiang, A.P. Optimizing combustion of coal fired boilers for reducing NOx emission using Gaussian Process. Energy 2018, 153, 149–158. [Google Scholar] [CrossRef]
- Horvath, Z.; Jandacka, J.; Malcho, M. Simulation of air flow in hot-air boiler. In Proceedings of the Experimental Fluid Mechanics 2006, Liberec, Czech Republic, 6–7 December 2016; pp. 73–78. [Google Scholar]
- Fang, F.; Sun, L.L. Joint Modeling and Simulation of Furnace Combustion. In Proceedings of the 29th Chinese Control Conference, Chongqing, China, 28–30 May 2017; pp. 1307–1312. [Google Scholar]
- Epelbaum, G.; Zhang, H.W. Process Simulation of a large mass burn Waste-Tb-Energy boiler by the combination of CFD software programs. Prog. Comput. Fluid Dyn. 2007, 7, 11–18. [Google Scholar] [CrossRef]
- Kraszkiewicz, A. The Combustion of Wood Biomass in Low Power Coal-Fired Boilers. Combust. Sci. Technol. 2016, 188, 389–396. [Google Scholar] [CrossRef]
- Rastvorov, D.V.; Osintsev, K.V.; Toropov, E.V. Influence of burner form and pellet type on domestic pellet boiler performance. IOP Conf. Ser. Earth Environ. Sci. 2017, 87, 032034. [Google Scholar] [CrossRef]
- Ahn, J.; Jang, J.H. Combustion and heat transfer characteristics in a combustion chamber of a 13-step grate wood pellet firing boiler. J. Mech. Sci. Technol. 2018, 32, 1033–1040. [Google Scholar] [CrossRef]
- Zhang, B.T.; Wang, C.Y.; Qin, Q.; Li, L. Influence of Boiler Combustion Adjustment on NOx Emission and Boiler Efficiency. Adv. Mater. Res. 2013, 732–733, 234–237. [Google Scholar]
- Chen, H.W.; Liang, Z.W. Damper opening optimization and performance of a co-firing boiler in a 300 MWe plant. Appl. Therm. Eng. 2017, 123, 865–873. [Google Scholar] [CrossRef]
- Li, S.; Xu, T.M.; Hui, S.; Wei, X.L. NOx emission and thermal efficiency of a 300 MWe utility boiler retrofitted by air staging. Appl. Energy 2009, 86, 1797–1803. [Google Scholar] [CrossRef]
- Arablu, M.; Poursaeidi, E. Using CFD for NO (x) emission simulation in a dual fuel boiler. Combust. Explos. Shock. Waves 2011, 47, 426–435. [Google Scholar] [CrossRef]
- Jin, Y.; Zhang, X.; Zhang, Y.; Quan, M.; Xing, Y. Analysis of Numerical Simulation and Strategy Overview of a 350 mw Supercritical Boiler Air Distribution Regulation. In Proceedings of the 17th UK Heat Transfer Conference (UKHTC2021), Manchester, UK, 5–7 September 2021. [Google Scholar]
- Han, X.; Sagaut, P.; Lucor, D. On sensitivity of RANS simulations to uncertain turbulent inflow conditions. Comput. Fluids 2012, 61, 2–5. [Google Scholar] [CrossRef]
- Torresi, J.; Ebert, G.; Pellegrini, M. Vaccines licensed and in clinical trials for the prevention of dengue. Hum. Vaccines Immunother. 2017, 14, 1–14. [Google Scholar] [CrossRef] [PubMed]
- Ramanujachari, V.; Balakrishna, S.; Ganesan, S. Probability density function approach to non-premixed turbulent flames. Indian J. Pure Appl. Math. 2000, 31, 1339–1351. [Google Scholar]
- Hafiz, M.; Nelwan, L.O.; Yulianto, M. CFD-based Analysis of Non-Premixed Combustion Model in Biomass Grate Furnaces. In Proceedings of the 2nd International Conference on Agricultural Engineering For Sustainable Agricultural Production (Aesap 2017), Bogor, Indonesia, 23–25 October 2017. [Google Scholar]
- Bartonova, L. Element behaviour in coal combustion—Comparison of element contents in unburnt carbon, coal and bottom ash. Chem. Listy 2006, 100, 798–802. [Google Scholar]
- Dong, H.; Zhang, Y.; Du, Q.; Gao, J.; Shang, Q.; Feng, D.; Huang, Y. Generation and Emission Characteristics of Fine Particles Generated by Power Plant Circulating Fluidized Bed Boiler. Energies 2022, 15, 6892. [Google Scholar] [CrossRef]
- Gao, Z.Y.; Chen, D.F.; Du, W.Y.; Wu, X.F.; Wang, X.J.; IEEE. Numerical Investigation on the NO Emissions of W-shaped Boiler At Different Air Distributions. In Proceedings of the 2010 Asia-Pacific Power And Energy Engineering Conference (APPEEC), Chengdu, China, 28–31 March 2010. [Google Scholar]
- Zhijun, S.; Sheng, S.; Xing, N.; Jun, X.; Qi, L.; Yun, Z.; Lushi, S.; Song, H.; Jun, X.; Anchao, Z. The Investigation of NOx Formation and Reduction during O2/CO2 Combustion of Raw Coal and Coal Char. Energy Procedia 2015, 66, 69–72. [Google Scholar] [CrossRef]
- Nie, L.; Lu, J.Y.; Deng, Q.G.; Gong, L.M.; Xue, D.Y.; Yang, Z.Z.; Lu, X.F. Study on the Uniformity of Secondary Air of a 660 MW Ultra-Supercritical CFB Boiler. Energies 2022, 15, 3604. [Google Scholar] [CrossRef]
Disclaimer/Publisher’s Note: The statements, opinions and data contained in all publications are solely those of the individual author(s) and contributor(s) and not of MDPI and/or the editor(s). MDPI and/or the editor(s) disclaim responsibility for any injury to people or property resulting from any ideas, methods, instructions or products referred to in the content. |
© 2022 by the authors. Licensee MDPI, Basel, Switzerland. This article is an open access article distributed under the terms and conditions of the Creative Commons Attribution (CC BY) license (https://creativecommons.org/licenses/by/4.0/).

