
Energy Efficiency of Heavy-Duty Vehicles in Mexico


Abstract
:1. Introduction
1.1. Fuel Consumption Determination in HDVs
1.1.1. Estimation of Fuel Consumption in HDVs
1.1.2. Measurement of Fuel Consumption in HDVs
- Recording manually the whole trip’s fuel consumption. Transport companies and/or vehicle owners have developed platforms where fleet operators report the amount of fuel loaded and the distance traveled until the next fill-up. Results from this alternative can be biased by third parties’ interests involved in the fuel supply business.
- Performing on-road tests using Portable Emissions Measurement Devices (PEMS); The instruments involved and the resources required to carry on the tests are highly costly, limiting the number of vehicles and the duration of the test to the resources available. To overcome these difficulties, and as an approximation, researchers select a few vehicles (~10), instrument them with a PEMS, in some cases simulate the load with water tanks, and made them reproduce a driving cycle that represents the driving pattern of the region of interest [13] or track the vehicle following a specific route [14]. At the same time, they measure their fuel consumption and tailpipe emissions under lab conditions using a chassis dynameter or by on-road tests. This methodology is repeatable and reproducible. It isolates the effect of external conditions, such as driving habits and road conditions. Thus, it is suitable to evaluate the energy performance of the vehicle’s technology. The representativeness of the driving cycle and of the sampled vehicles remains a subject of discussion. Furthermore, several studies have reported differences between the results obtained following this methodology and the fuel consumption observed in real life;
- Monitoring the instant fuel consumption via the vehicle On-Board Diagnostic (OBD) port. It consists of reading the information from different sensors of the Engine Control Unit (ECU) via the OBD port, i.e., air flow, engine temperature, engine speed, intake air temperature, manifold absolute pressure, vehicle speed, and the driver demanded acceleration and torque or directly the fuel consumption. The data obtained is used to quantify the accumulated used fuel or the flow that is injected into the engine [15]. This method was previously validated by Pepper (2010) [16] and Quirama et al. (2020) [17], who obtained differences lower than 3% when compared to the standard gravimetric method specified by SAE [18]. OBD is an interface used by telematics service companies [19]. The low cost of this alternative makes it suitable for monitoring the fuel or energy consumption of a representative sample of vehicles for a long time (~1 year).
1.2. Previous Works Focused on the Determination of HDVs’ Fuel Consumption
1.2.1. Fuel Consumption in Buses
1.2.2. Fuel Consumption in Trucks
1.2.3. The Influence of the after-Treatment System on Fuel Consumption
1.2.4. Fuel Consumption as a Function of Vehicle Age
1.2.5. The Influence of Topographic Conditions on Fuel Consumption
1.2.6. Attempts to Obtain National Baselines of Fuel Consumption
1.3. About This Work
- Establishment of the nationwide real-world energy consumption baseline of HDVs used for the transport of people and goods in Mexico;
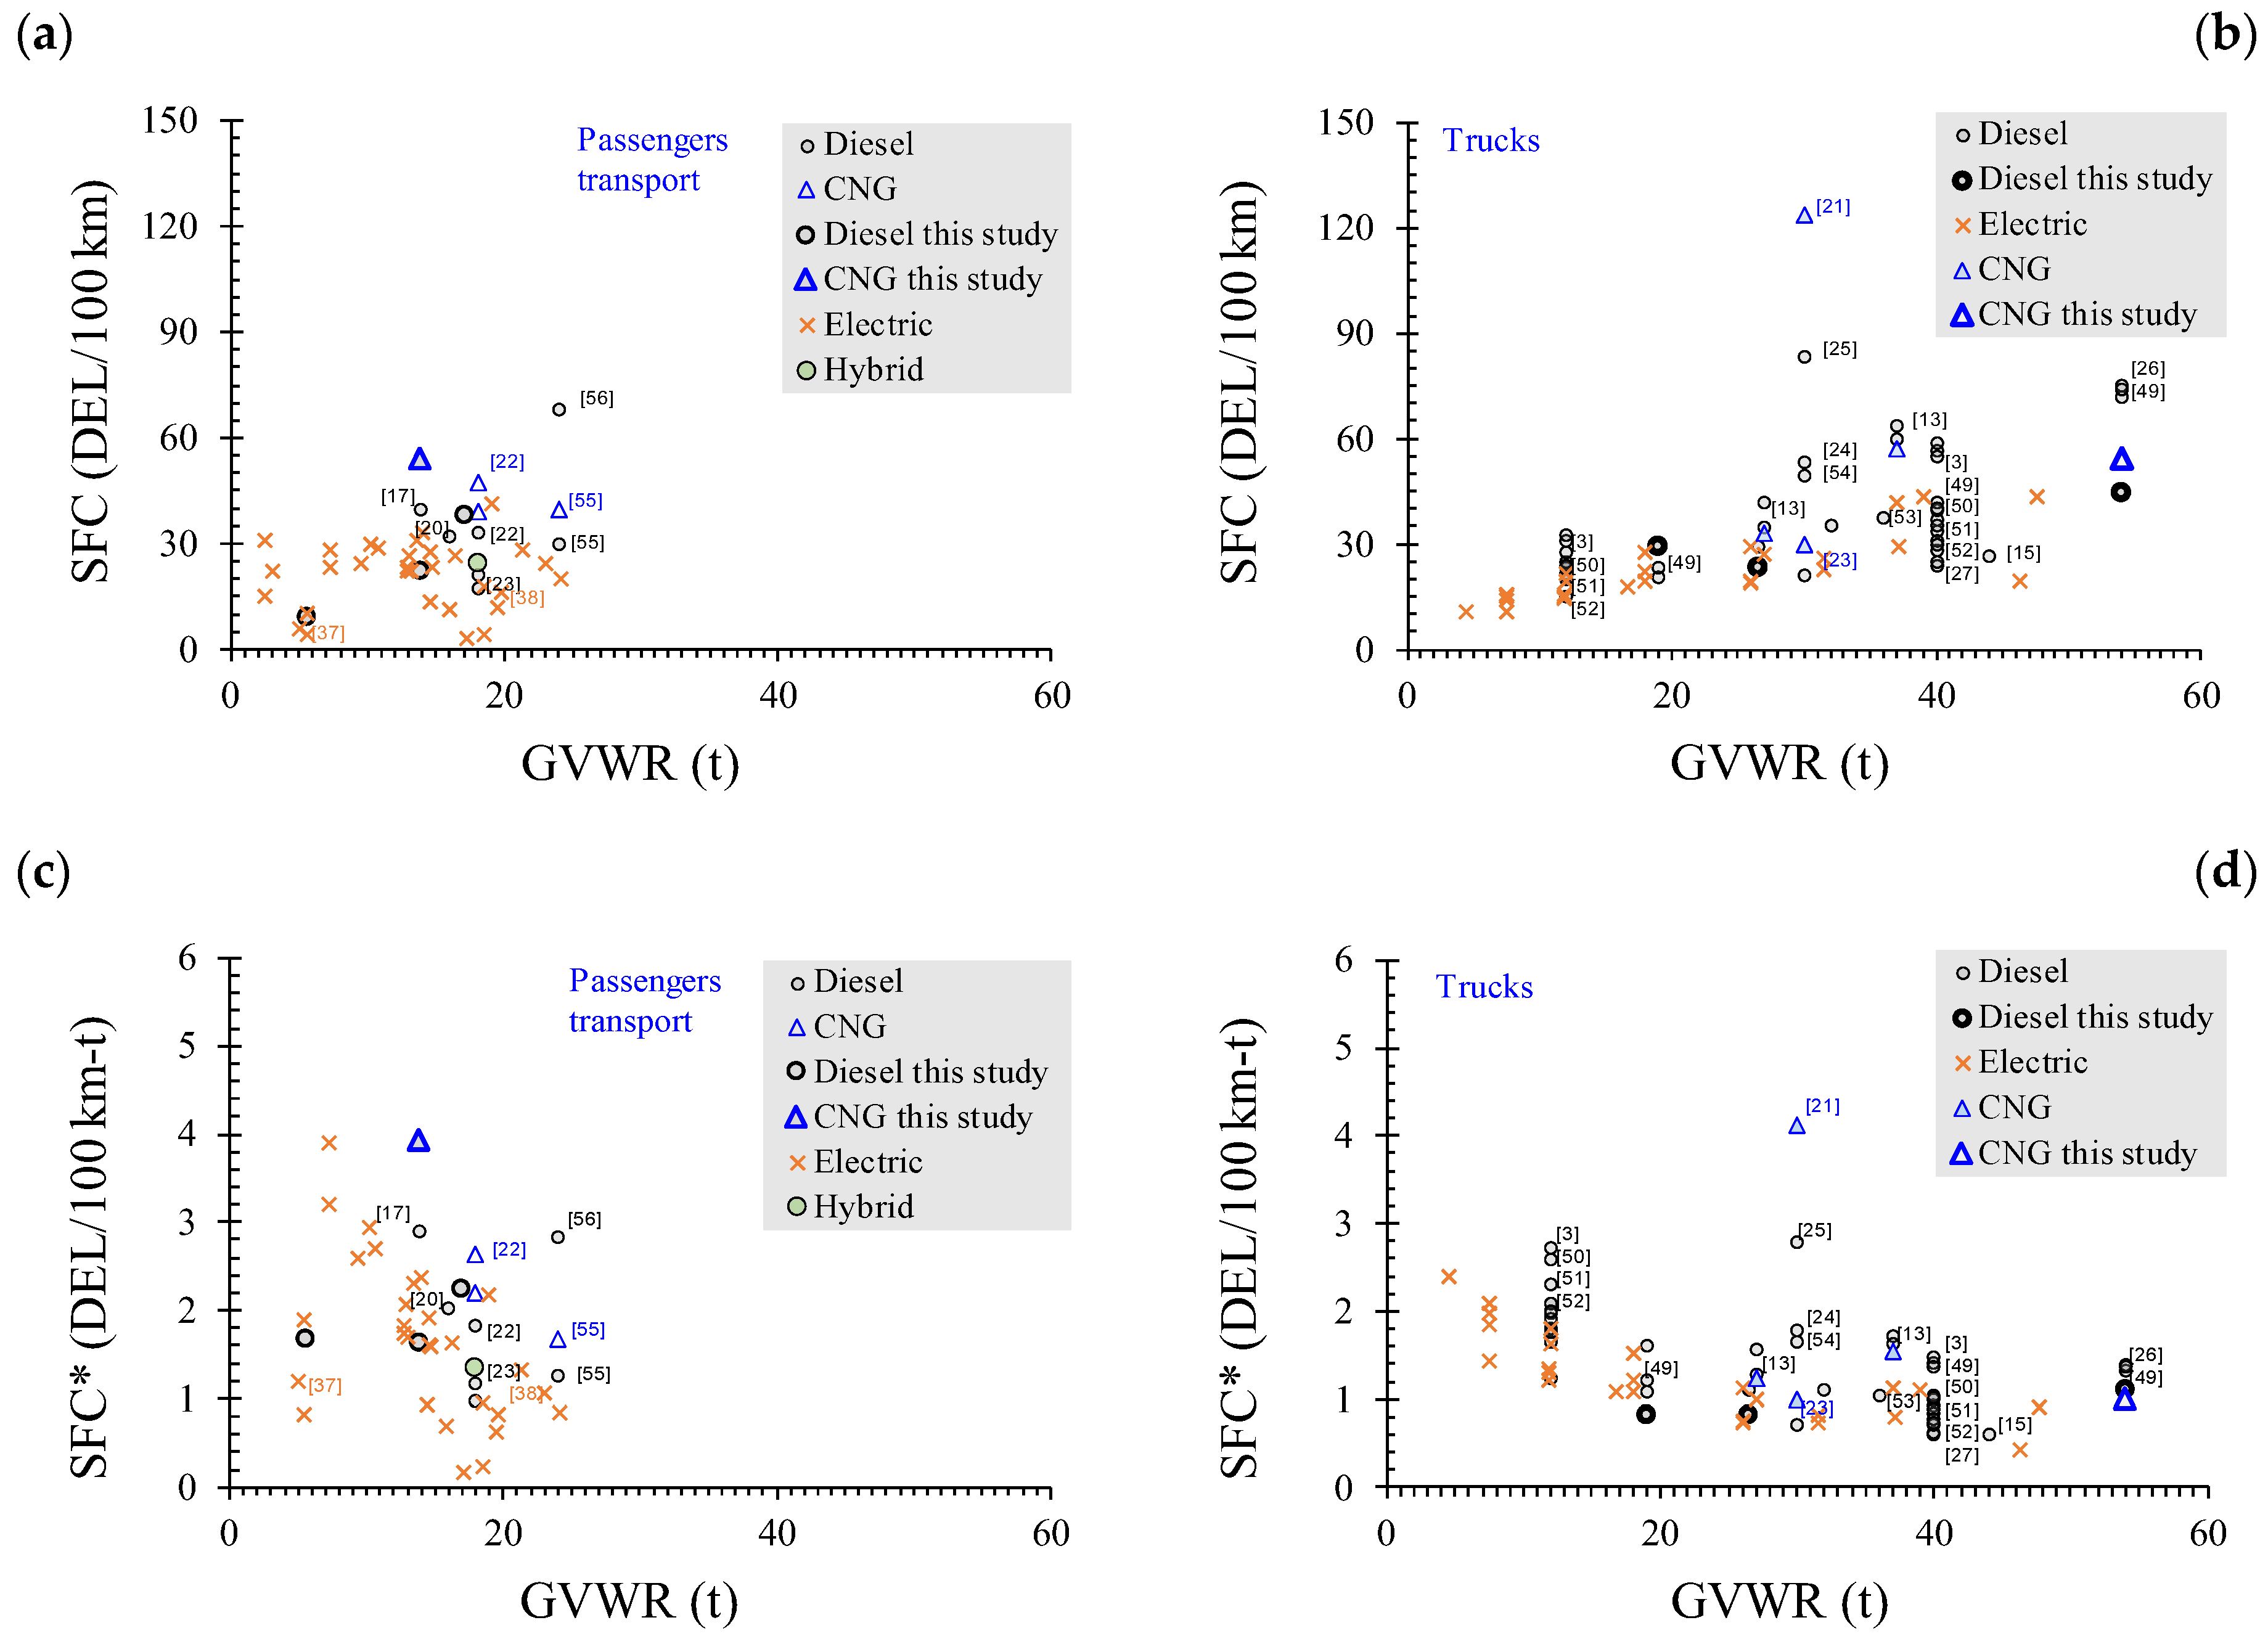
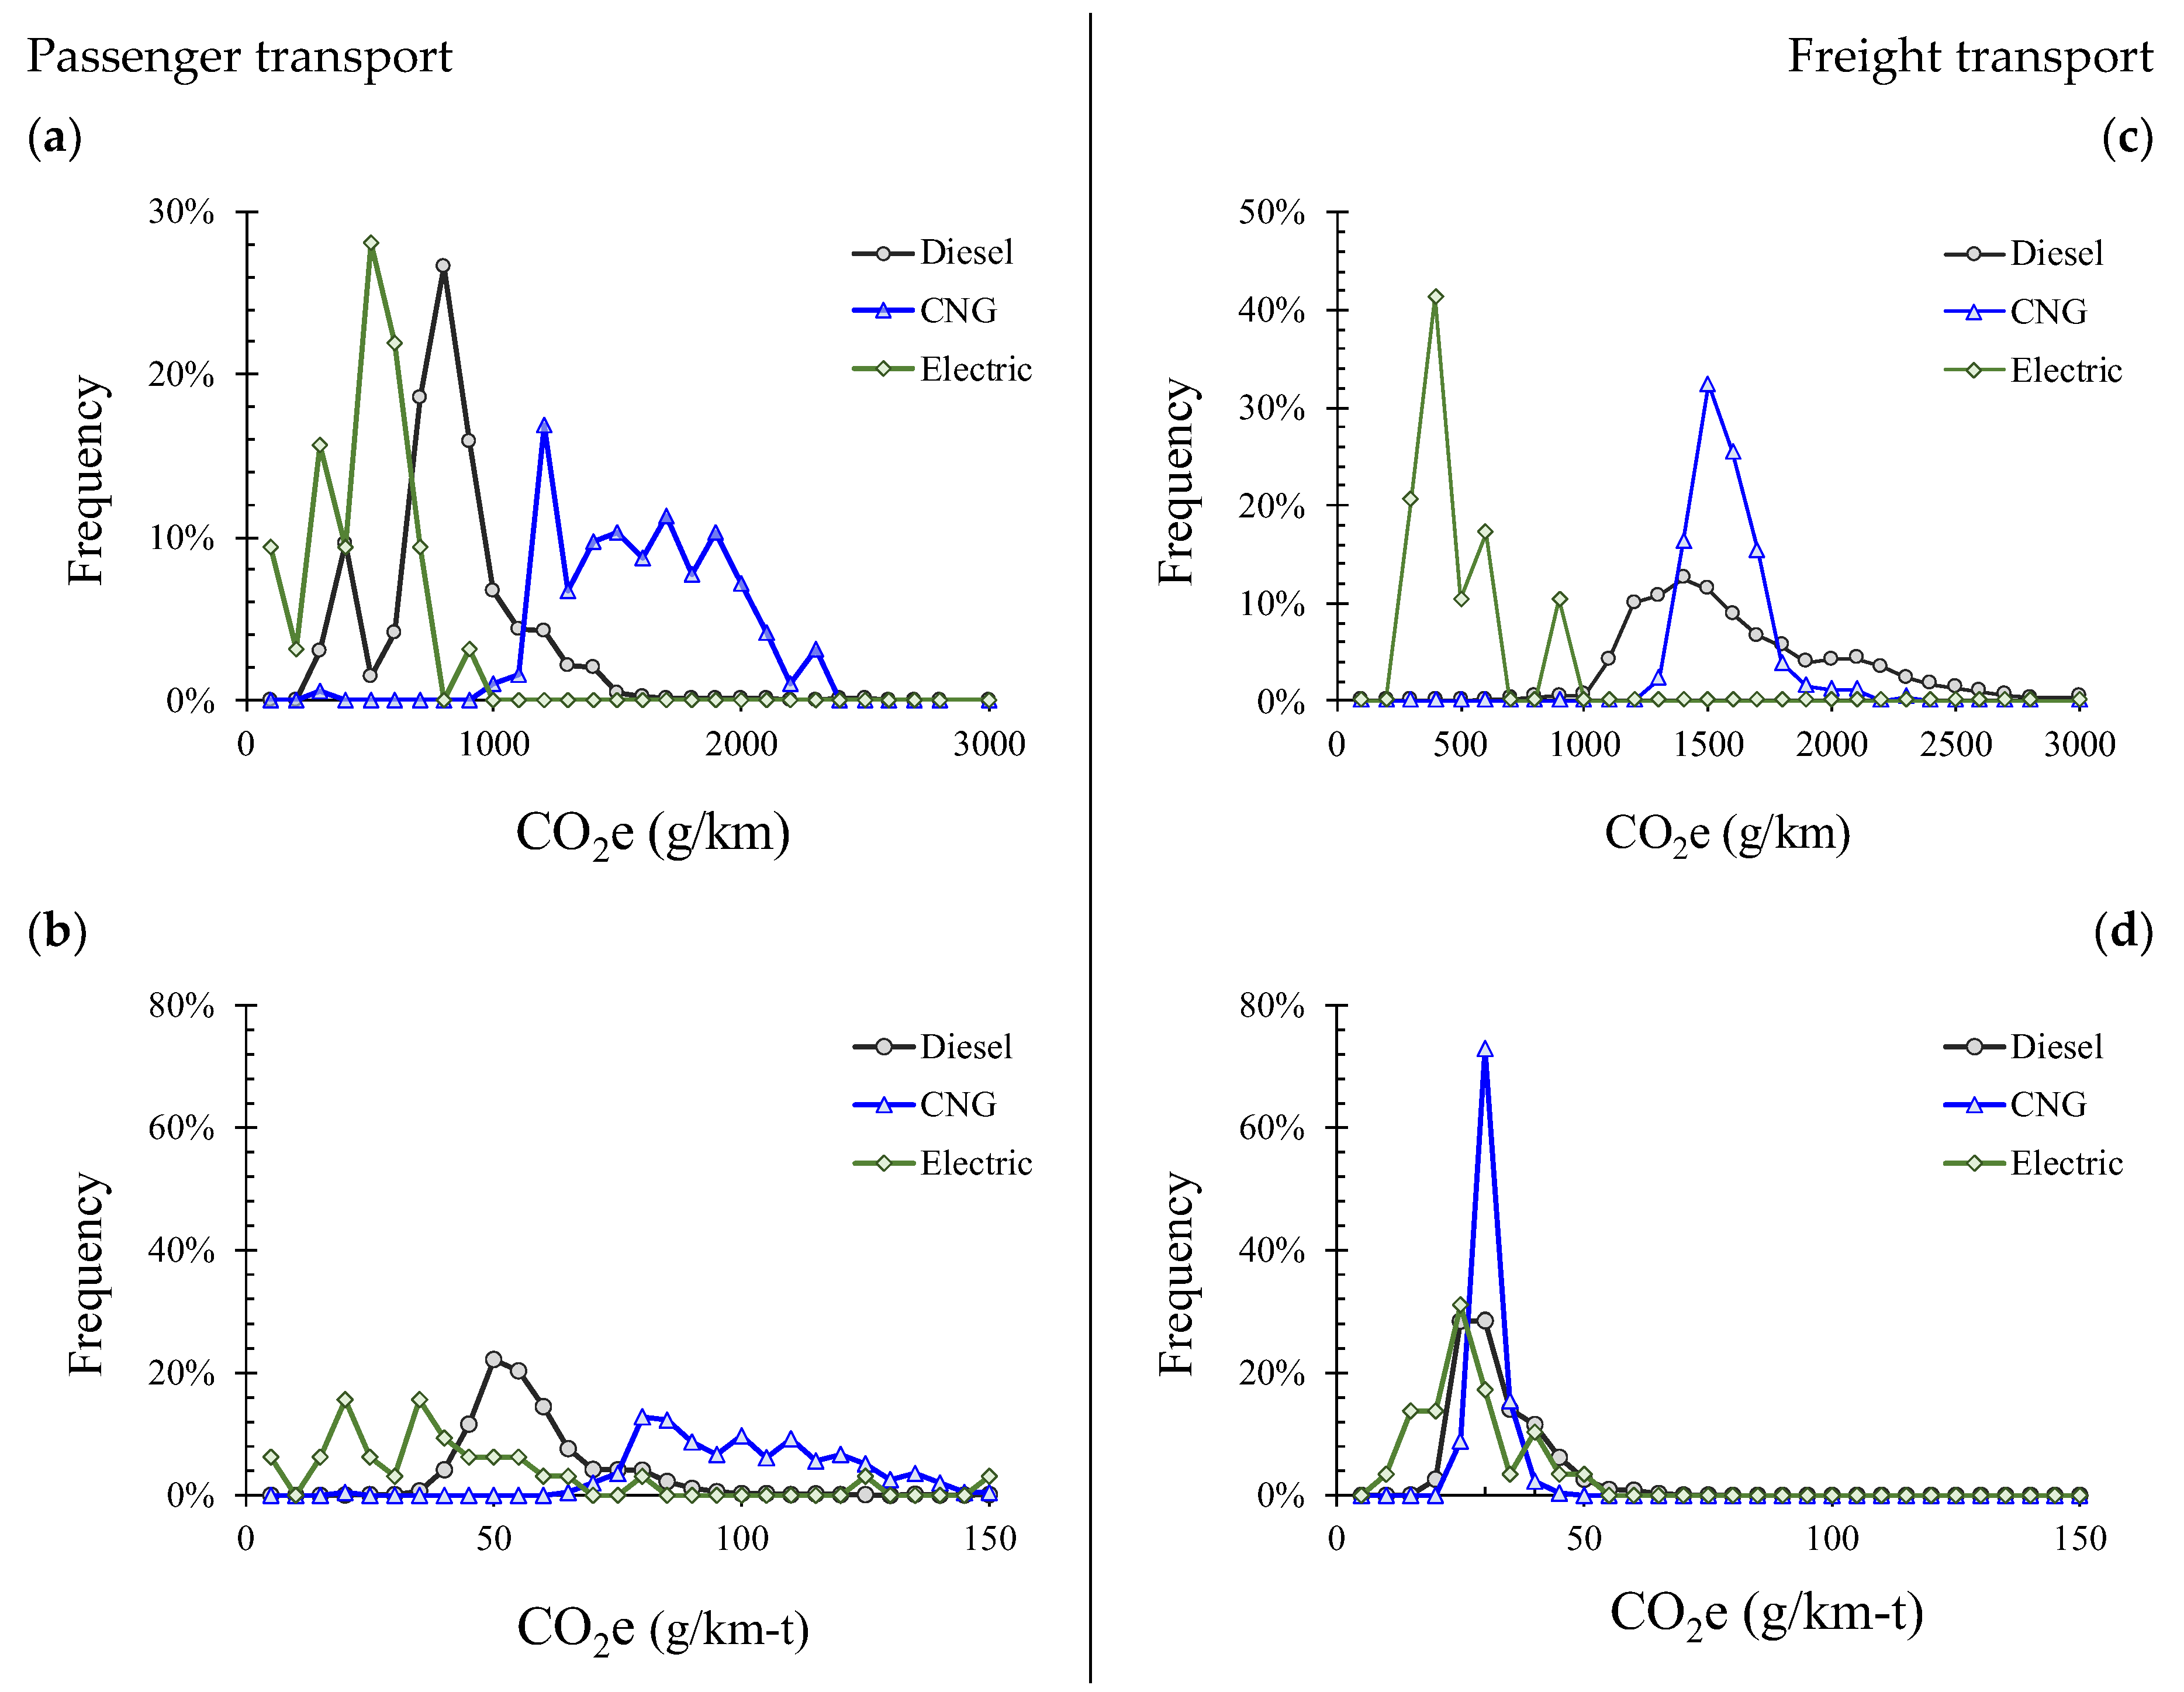
- Evaluation of the energy consumption and greenhouse gas emissions of vehicles with different energy sources (diesel, CNG, and electricity)
Relevance of the Contributions
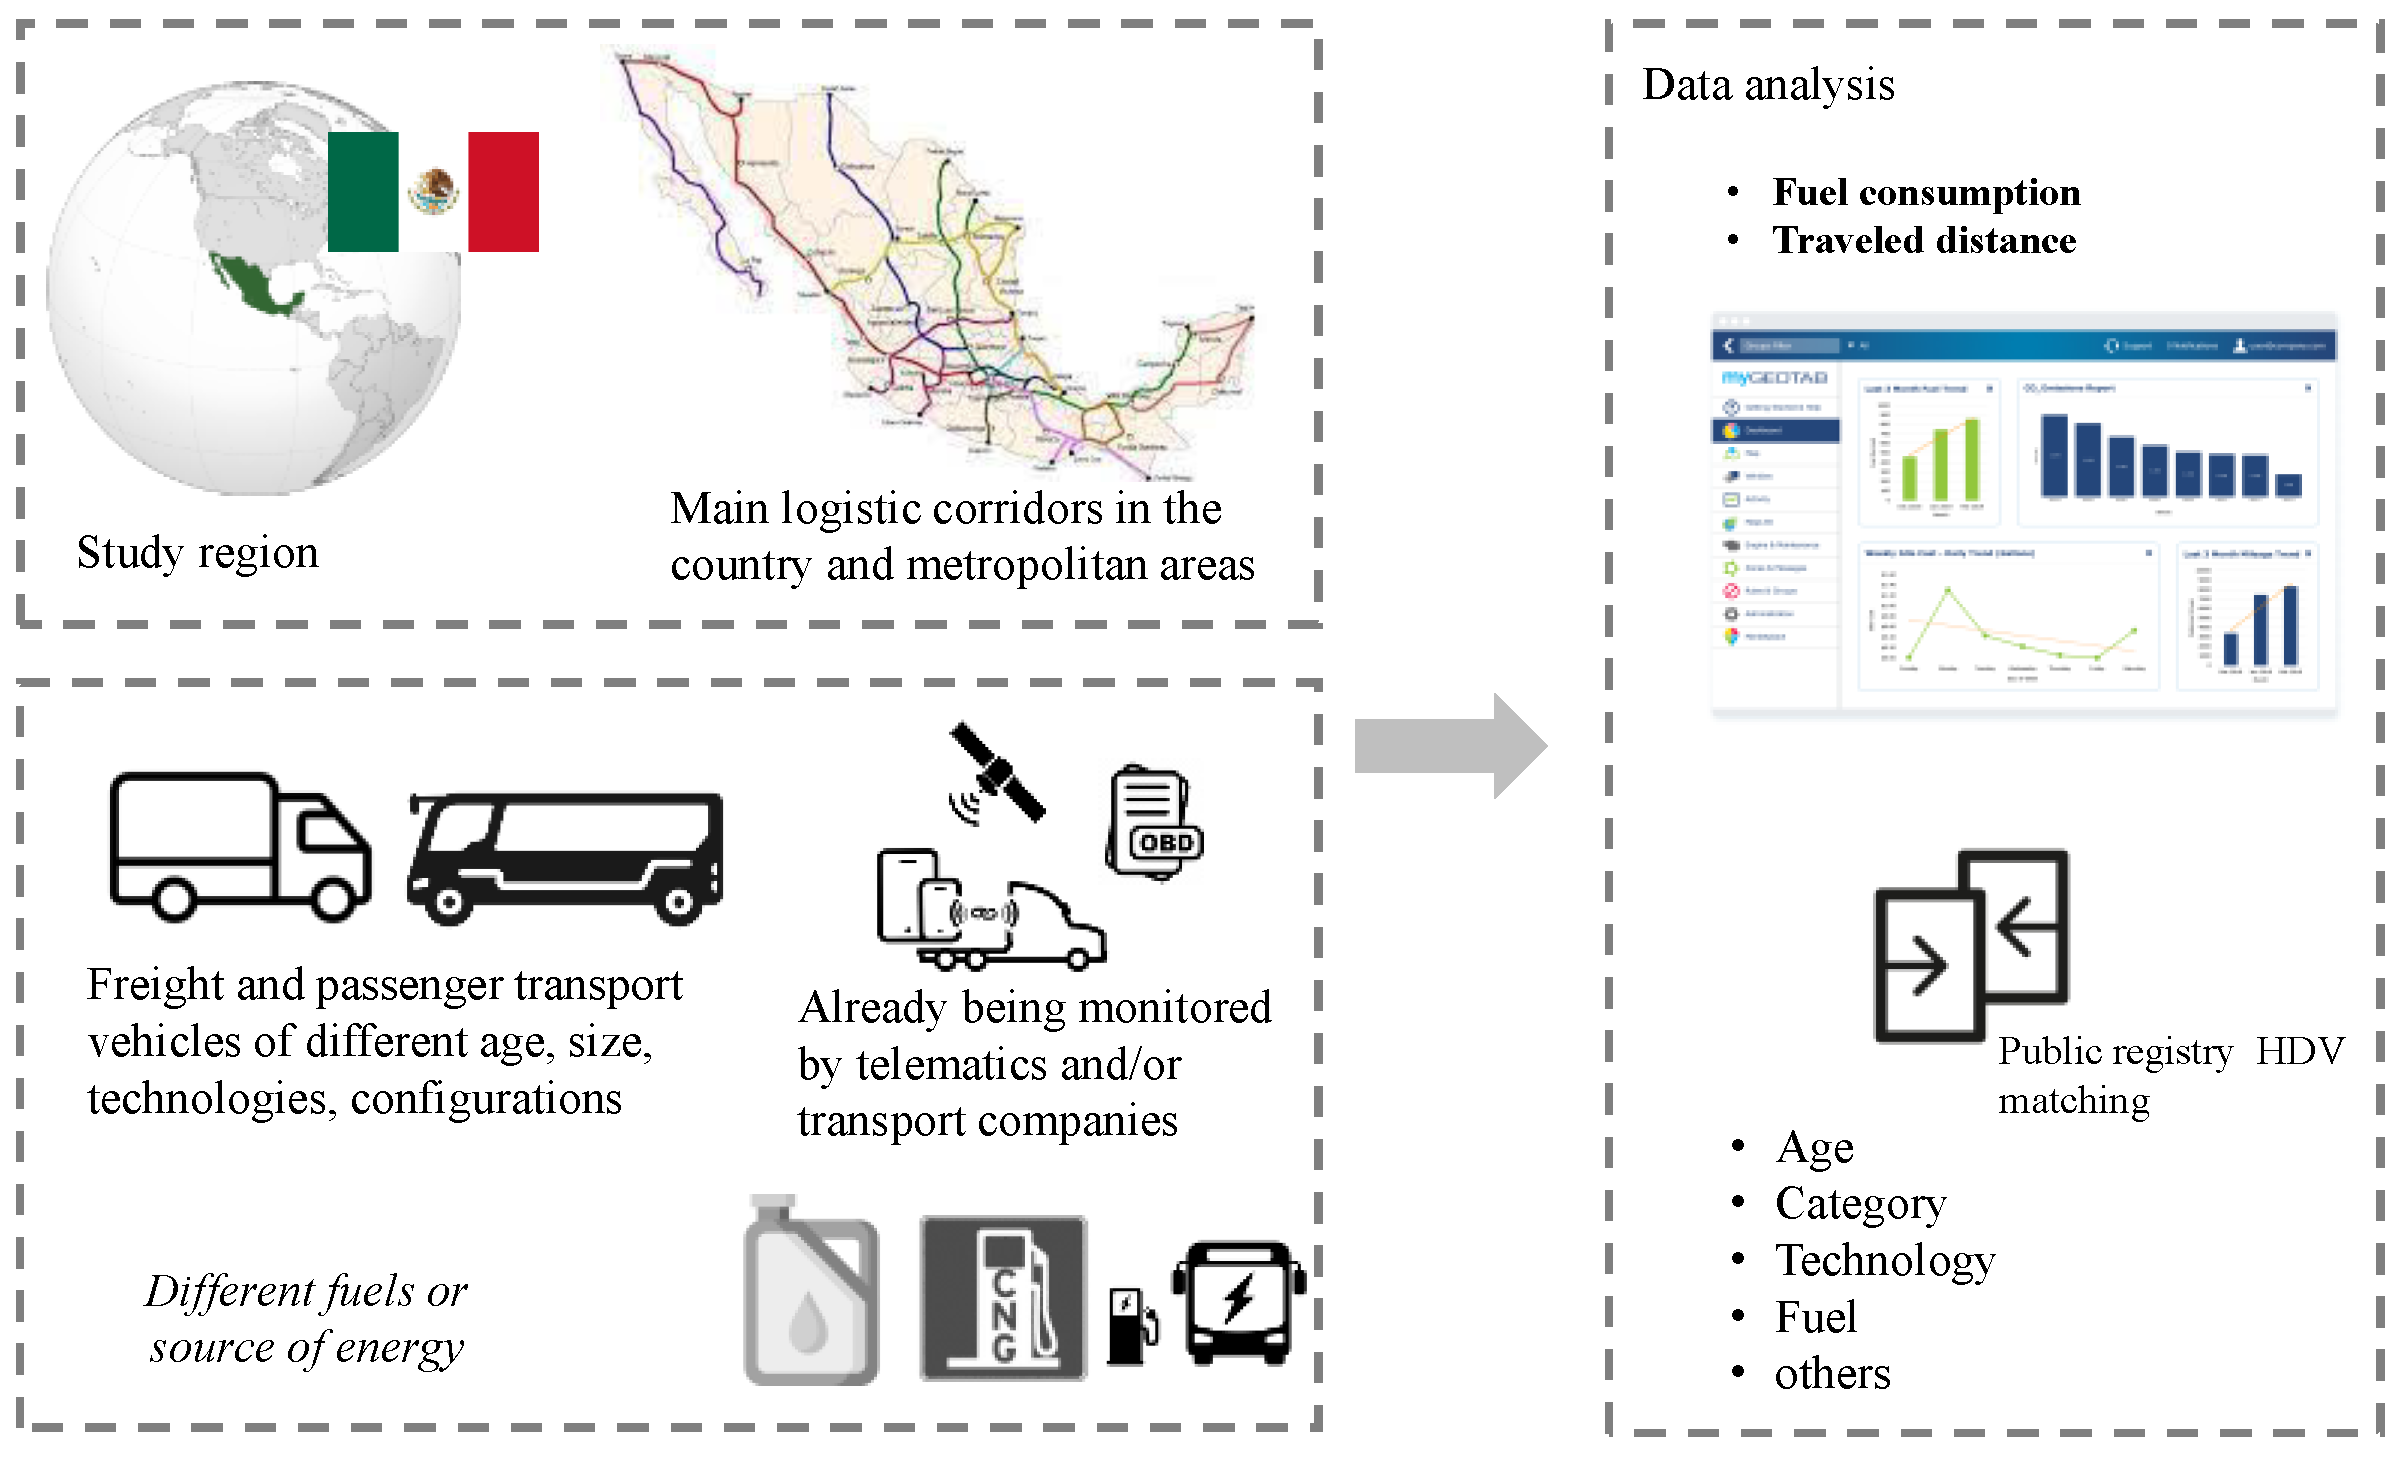
2. Methodology
2.1. Region of Study
2.2. Fuel Characteristics
2.3. HDVs in Mexico
2.4. Sample
2.4.1. Diesel Vehicles
2.4.2. CNG Vehicles
2.4.3. Electric Vehicles
2.5. Instrumentation and Data Gathering
2.6. Data Quality Analysis
2.7. Determination of the SFC
2.8. GHG Emissions
3. Results
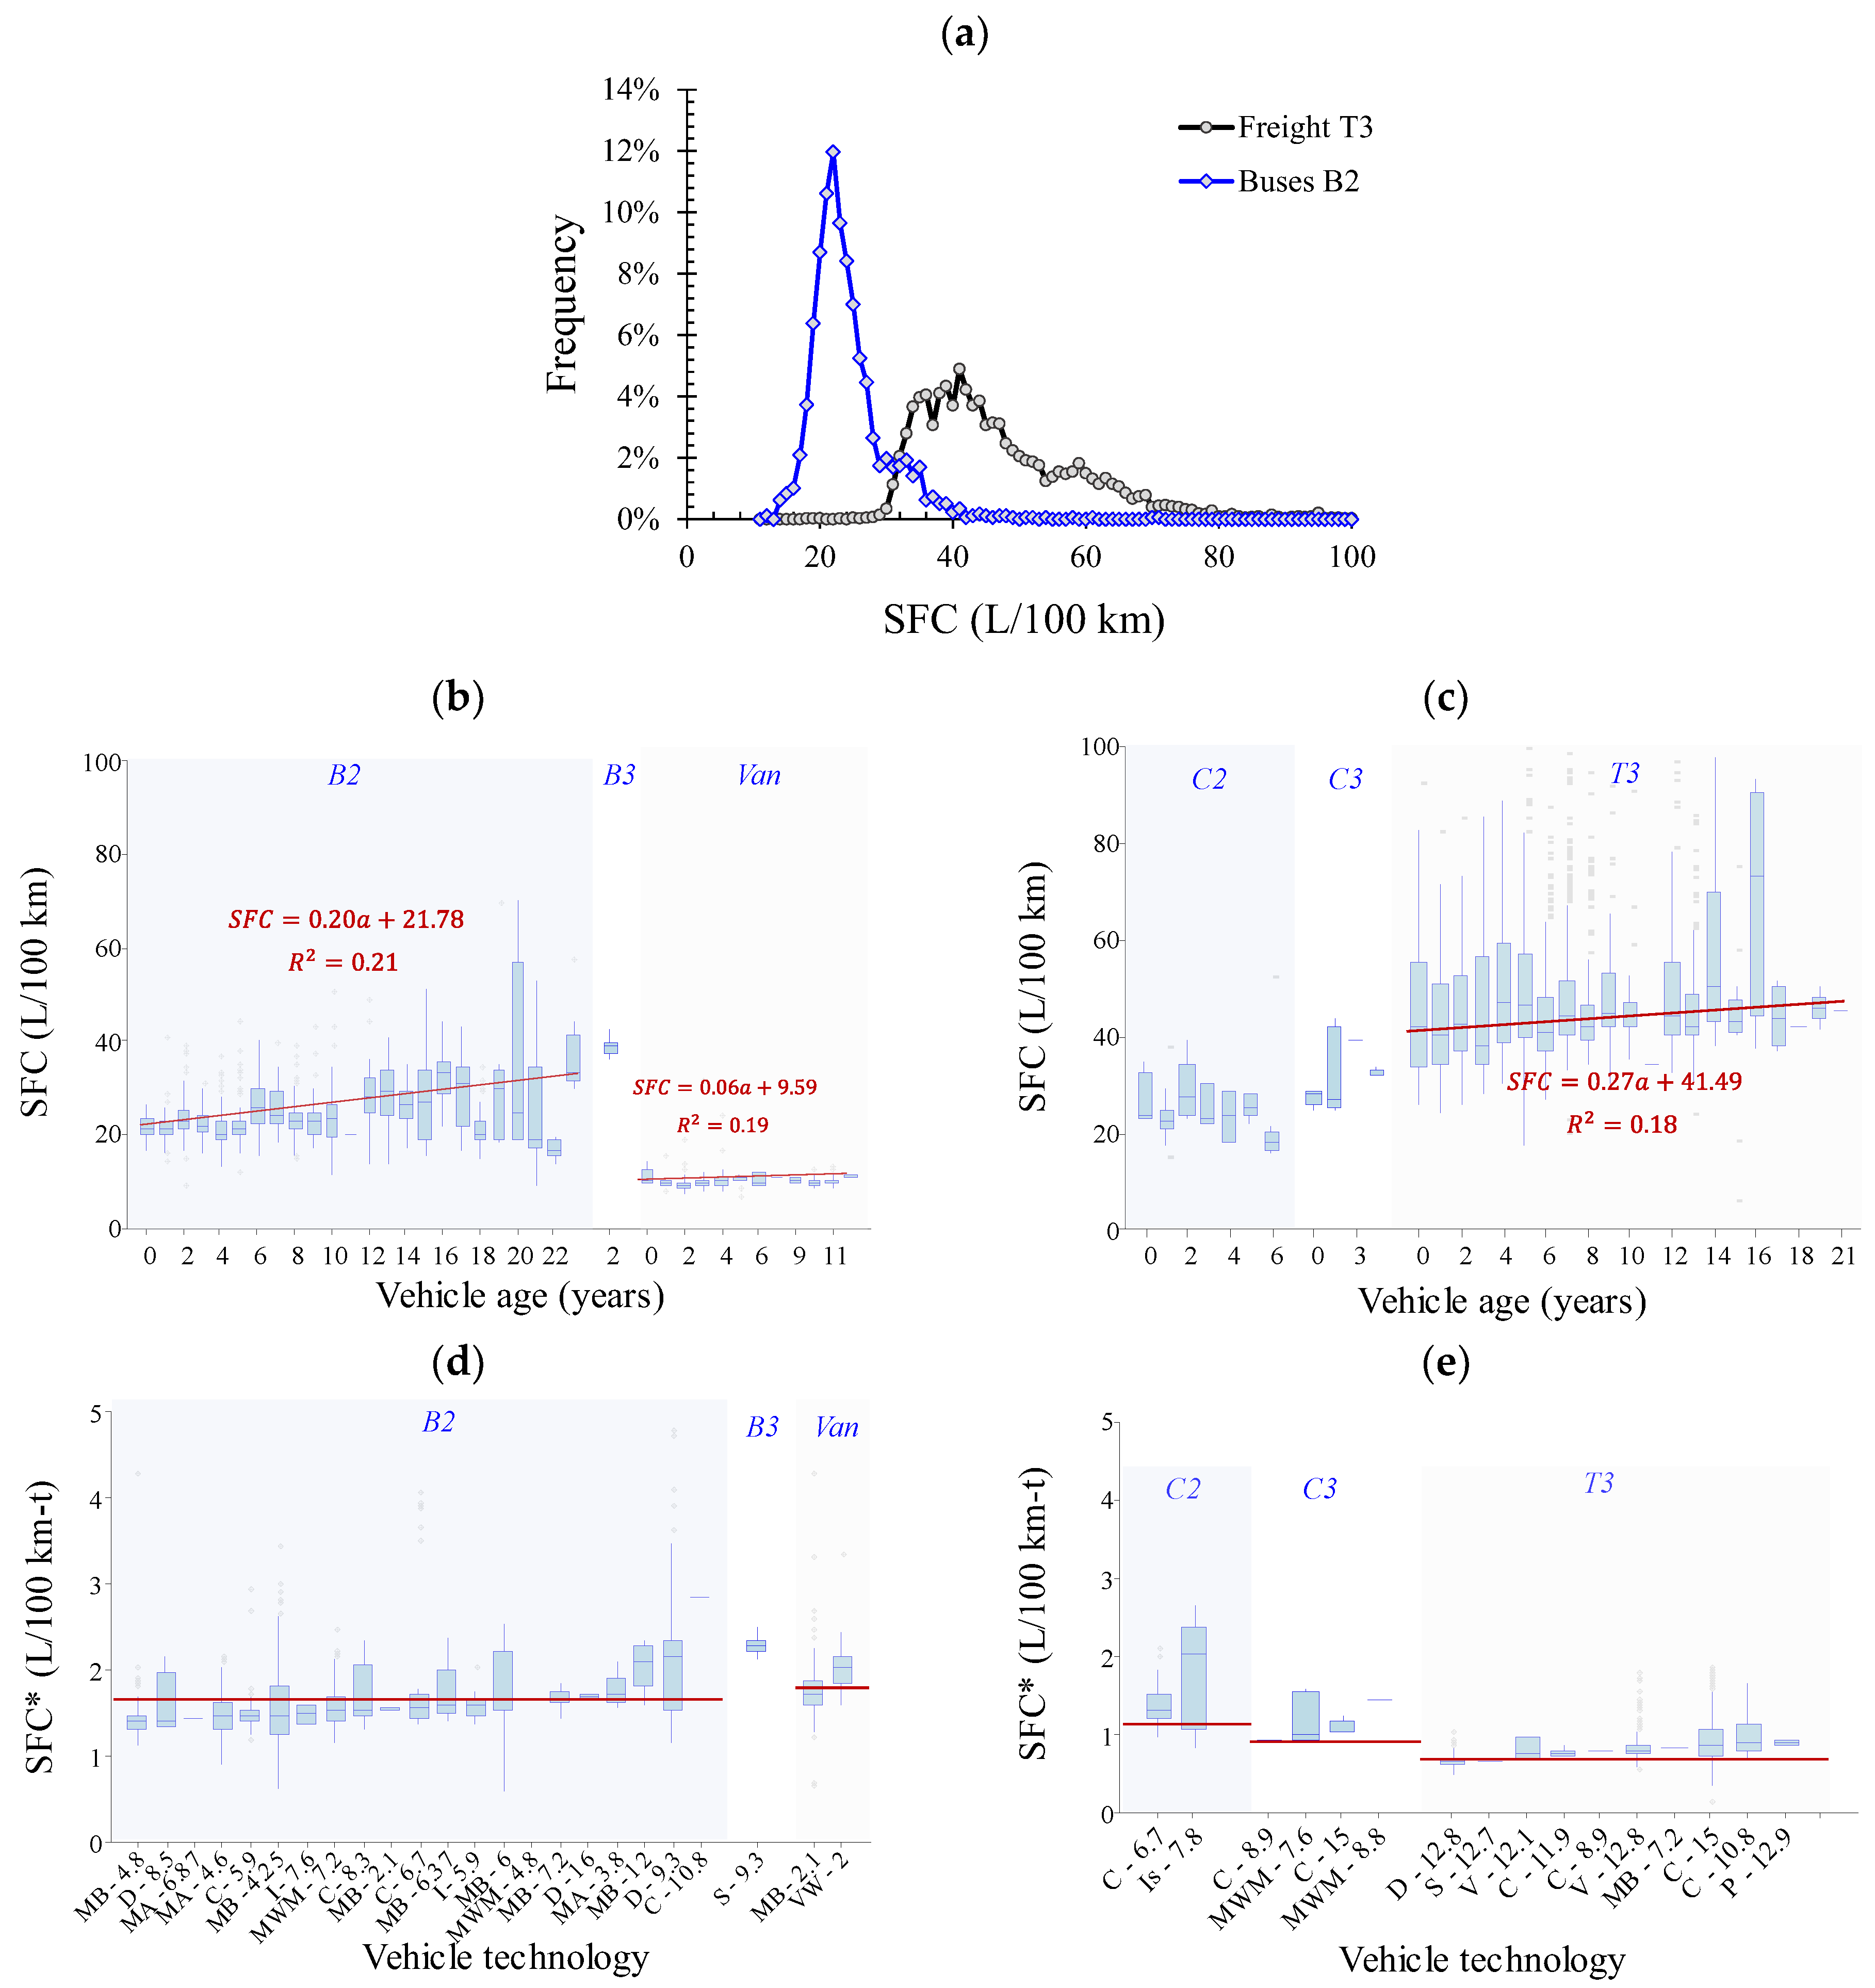
3.1. Diesel SFC
3.1.1. Effect of Vehicle Age
- Improvements in the energy performance of new technologies are counterbalanced by the inclusion of additional after-treatment systems that demand additional energy consumption;
- As occurs with any new technology, drivers need additional training to adjust their driving habits to it, and this process could take months. Thus, the observed SFC of new vehicles does not necessarily correspond to their best performance;
- Fleet administrators tend to disregard worst-performing vehicles regardless of vehicle age. Considering that the cost associated with fuel consumption represents 40–50% of the total operative cost, fleet administrators tend to disregard the vehicles that, under the frequent conditions of use (traveled routes, load percentage, usual drivers, etc.), exhibit high fuel consumption. Thus, the observed SFC of old vehicles corresponds to the vehicles that, under the local conditions, exhibit satisfactory SFC.
3.1.2. Effect of Vehicle Technology
3.2. CNG Consumption
- The city’s topography is not suitable for this type of vehicle due to its high variability. Thus, vehicles’ engines are subjected to accelerations and decelerations that do not allow them to operate in their optimal performance ranges;
- Maintenance costs are three to four times higher than diesel vehicles;
- The region of operation (northwest of Mexico) has faced natural gas shortage during summer.
3.3. Electricity Consumption of HDV
3.4. GHG Emissions
4. Suggested Alternatives to Decarbonize the Transport Sector in Mexico
- Promote the use of electric vehicles to transport people and goods in urban areas. In Mexico, as in the majority of the LATAM countries, most of the people move using private or public transport services. Buses move at low speeds, due mainly to traffic congestion, covering short distances (<50 km/route). Under these circumstances of low autonomies and low speed, electric buses have been shown to have a lower total cost of ownership (TCO), higher energy efficiency, and lower GHG emissions than diesel vehicles. Electric vehicles have the potential to reduce up to 52% of the emission of GHG in countries, such as Mexico, where electricity is obtained mainly (90%) from thermal power plants;
- Establishment of a threshold limit of GHG emissions per kilometer traveled and a ton of payload transported to any vehicle fleets (fleets larger than five vehicles) equivalent to a 20% reduction of the current value (22.42 g CO2e/km-t for T3) to be accomplished in the next 5 years. This alternative will force companies in the transport services to increase the energy efficiency of the transport service without limiting their economic growth. Transport providers will look after low-emission technologies, lighter vehicles, logistics improvements, better driving habits, fleet renewable, and any other complementary strategy to reduce energy consumption. For the case of passengers, the threshold value should be expressed per ton of GVWR, and a threshold value of 41.5 g CO2e/km-t (15.16 g CO2e/km-pas) is recommended for B2 buses;
- Energy efficiency limits for HD vehicles addressed to manufacturers. Vehicle manufacturers should be responsible for the actual performance of their vehicles under the local conditions of use, which is far beyond complying with energy performance obtained in laboratory tests that, after all, can be manipulated. We suggest the use of 34.7 DEL/100 km for T3 vehicles and 17.9 DEL/100 km for B2 buses.
5. Conclusions
Author Contributions
Funding
Data Availability Statement
Acknowledgments
Conflicts of Interest
Appendix A

| Source | Country | Objective | Model Year | Emission Standard | GVWR | Fuel | Method | Results | |
|---|---|---|---|---|---|---|---|---|---|
| Delgado, Rodríguez, & Muncrief, (2017) [3] | European Union | To establish through simulation modeling the current efficiency baseline levels of European trucks and to estimate the potential for fuel consumption reduction through different technology packages in the 2020–2030-time frame. | T | 2016 | NA | 40 t Tractor-Trailer (TT) 12t Rigid Truck (RT) | D | VECTO simulation model with Urban delivery (UD), regional delivery (RD) & long haul (LH) test cycles | TT: UD 28.20–58.81 L/100 km RD 25.00–46.38 L/100 km LH 23.56–36.96 L/100 km RT: UD 21.6 L/100 km RD 19.9 L/100 km LH 24.9 L/100 km |
| EPA, NHTSA, & DOT, (2016) [49] | US | To establish standards for medium- and heavy-duty vehicles that would improve fuel efficiency and cut carbon pollution to reduce the impacts of climate change. | T | 2017 | NA | 14.9 t >14.9 t | D | Laboratory tests for engines and GEM model for the whole vehicle | TT: 71.8–75.2 L/100 km RT: 20.48–30.47 L/100 km |
| Delgado, Miller, Sharpe, & Muncrief, (2016) [50] | Brazil, China, EU, India, US | To estimate the potential for technology improvements to reduce the fuel consumption of key HDV segments in markets around the world. | T | 2016 | NA | 40 t Tractor-Trailer (TT) 12T Rigid Truck (RT) | D | Autonomy simulation model with certified driving cycles | Brazil 39.8 L/100 km for TT and 23.7 L/100 km for RT China: 41.6 L/100 km for TT and 21.2 L/100 km for RT UE: 33.6 L/100 km for TT and 23.0 L/100 km for RT India; 54.8 L/100 km for TT and 24.9 L/100 km for RT US: 40.4 L/100 km for TT and 27.6 L/100 km for RT |
| ICCT, (2019) [51] | Japan | To update a new fuel economy standard for new on-road heavy-duty vehicles as part of the government’s ongoing effort to reduce the country’s petroleum usage and greenhouse gas (GHG) emissions. | T&B | 2015 | NA | 40t (T) 18t (B) | D | Engine dynamometer and vehicle simulation model (does not specify the name of the tool) | TT: 35.21 L/100 km OT: 14.08 L/100 km TA: 14.88 L/100 km TB: 20.96 L/100 km GB: 16.47 L/100 km BA: 17.51 L/100 km |
| Ragon & Rodríguez, (2021) [52] | European Union | To understand how the industry currently performs compared to the targets set out by the European Commission | T | 2018 | NA | NA | D | Vecto Simulation Model | RT: 23. 9–31.1 L/100 km TT: 30.8–32.7 L/100 km |
| Malik & Tiwari (2017) [27] | India | To estimate freight transportation fleet fuel consumption | T | 2017 | BSI, BSII, and BSIII. ** | NA | D (4921) | Origin and destination survey | 23.81–29.5 L/100 km |
| Aroua, Lhomme, Redondo-Iglesias, & Verbelen, (2022) [53] | France | To evaluate fuel savings varying power train components | T | NA | NA | 36.2 t | D (1) | Vecto Simulation Model | 37.38 L/100 km |
| Quiros et al., (2016) [13] | California, US | Compare vehicles emissions in different routes and driving conditions (i.e., regional, urban, etc.) | T | 2007–2014 | EPA 2007, EPA 2013 | 27.0–37.0 t | D CNG, H (7) | On-road measurement with PEMS | Diesel: 34.5–63.6 L/100 km CNG *: 33–57 [DEL/100 km] Hybrid: 42–60 L/100 km |
| Sandhu et al., (2021) [21] | United States | Characterize duty cycle, fuel use, and tailpipe exhaust emissions rates of recent model year CNG front-loader and side-loader refuse trucks | T | 2012–2013 | NA | 30.0 t | CNG * (6) | On-road measurement with SAE J1939 scan tool | 123.78 [DEL/100 km] |
| Sandhu et al., (2015) [24] | United States | Determine the real-world OpMode based duty cycles and rates of fuel use and emissions for roll-off refuse trucks | T | 2005–2012 | EPA 2004, EPA 2010 | 30.0 t | D (6) | On-road measurement with SAE J1939 scan tool | 53.5 L/100 km |
| (Sandhu et al., (2016) [25] | United States | Characterize the activity, fuel use, and emissions of 84 diesel side loader refuse trucks | T | 2003–2012 | EPA 2004, EPA 2010 | 24–30 t | D (6) | On-road with SAE J1939 scan tool | 83.5 L/100 km |
| Huertas et al., (2022) [26] | Colombia | Evaluate actual km-by-km fuel consumption and external factors effects | T | 2007–2020 | EPA 1998, Euro IV | 32–52 t | D (48) | On-road with SAE J1939 scan adapter | 50–80 L/100 km |
| Díaz-Ramirez et al., (2017) [48] | Colombia | Determine influencing factors on fuel consumption in a heavy-duty truck fleet and evaluate the impact of eco-driving programs | T | 2008 (1) 2012 (4) | EPA 1998 | 10.4–54.54 t | D(5) | On-road, telematics | 3.11 [L/100 km-t] |
| Mane, Djordjevic, & Ghosh, (2021) [54] | Ireland | Determine critical factors influencing fuel consumption in HDVs | T | 2010–2019 | Euro V, Euro VI | 30 t | D (22) | On-road, telematics | 49.6 L/100 km |
| Zhang et al., (2014) [22] | China | Evaluate impacts on fuel consumption and CO2 emissions from operating conditions | B | NA | Euro II to Euro V | 15–18 t | D (62) CNG (9) LNG (2) H (2) | SEMTECH-DS PEMS | Diesel: 33 L/100 km CNG *: 47.4 [DEL/100 km] LNG *: 39.5 [DEL/100 km] Hybrid: 24.3 L/100 km |
| Quirama, Giraldo, Huertas, & Jaller, (2020) [17] | Mexico | Represent local driving patterns through driving cycle construction methodologies | B | 2012–2014 | EPA 2004 | 13.85 t | D (15) | OBD interface | 40 L/100 km |
| Perrotta et al., (2019) [15] | London | Verify the accuracy of a fuel consumption estimation model comparting with real measurements | T | NA | NA | 44 t | NA (1110) | On-road with SAE J1939 scan tool | 26.50 L/100 km |
| Lv et al., (2020) [23] | China | Characterize emissions under real driving conditions | T | 2016–2018 | China IV China V | NA | LNG (2) D (4) | On-road PEMS | LNG * 30 L/100 km Diesel: 21 L/100 km |
| Gómez et al., (2021) [55] | Madrid | Analyze the pollutant emissions under real driving emissions | B | 2016 | Euro VI | 24–25 t | D (1) CNG (1) | HORIMBA OBS-ONE PEMS | Diesel: 30 L/100 km LNG *: 40 L/100 km |
| Chikishev & Chainikov, (2022) [56] | Russia | Study the influence of external operating conditions on the fuel consumption of a bus operating on a regular city route. | B | NA | NA | NA | D (1) | On-road, telematics | 46–68 L/100 km |
| Ghafarpasand et al., (2021) [20] | Middle east | Study the urban bus fleet in terms of driving behavior, emission performance, and emission estimation under real-world conditions | B | NA | Euro II, Euro III, Euro IV | 16 t | D (20) | On-road PEMS | 28.9–32.4 L/100 km |
| Pineda et al., (2022) [38] | Mexico | Model the electrification opportunities of two lines of the Bus Rapid Transit System (BRT) “Metrobus” of Mexico City. | B | NA | NA | 15 | E (9) | Telematics system | 16.35 [DEL/100 km] |
| Dewesoft, (2022) [37] | Mexico | Evaluate the energy needed to operate electric minibuses on various routes in Mexico City. | B | NA | NA | 5 | E (1) | Telematics system | 5.95 [DEL/100 km] |
References
- IEA. The Future of Trucks—Implications for Energy and the Environment; International Energy Agency: Paris, France, 2017. [Google Scholar]
- SCT. Estadística Básica del Autotransporte Federal. 2021. Available online: https://www.sct.gob.mx/transporte-y-medicina-preventiva/autotransporte-federal/estadistica/ (accessed on 31 July 2021).
- Delgado, O.; Rodriguez, F.; Muncrief, R. Fuel Efficiency Technology in European Heavy-Duty Vehicles: Baseline and Potential for the 2020–2030 Timeframe. 2017. Available online: https://theicct.org/wp-content/uploads/2021/06/EU-HDV-Tech-Potential_ICCT-white-paper_14072017_vF.pdf (accessed on 18 February 2022).
- Fontaras, G.; Zacharof, N.G.; Ciuffo, B. Fuel consumption and CO2 emissions from passenger cars in Europe—Laboratory versus real-world emissions. Prog. Energy Combust. Sci. 2017, 60, 97–131. [Google Scholar] [CrossRef]
- UNEP. What We Do? 2022. Available online: https://www.unep.org/explore-topics/transport/what-we-do/partnership-clean-fuels-and-vehicles/what-we-do (accessed on 30 November 2021).
- AMGNV. Asociación Mexicana de Gas Natural Vehicular. 2022. Available online: https://amgnv.org/ (accessed on 20 March 2022).
- CRE. NOM-016-CRE-2016. 2016. Available online: https://www.dof.gob.mx/nota_detalle.php?codigo=5450011&fecha=29/08/2016 (accessed on 14 December 2021).
- SECRE. NORMA Oficial Mexicana NOM-001-SECRE-2010, Especificaciones del Gas Natural. 2010. Available online: https://www.dof.gob.mx/normasOficiales/3997/sener/sener.htm#:~:text=de%20emergencia%20severa)-,NORMA%20Oficial%20Mexicana%20NOM%2D001%2DSECRE%2D2010%2C%20Especificaciones,que%20dice%3A%20Estados%20Unidos%20Mexicanos. (accessed on 4 December 2022).
- European Commission. Vehicle Energy Consumption calculation TOol—VECTO. 2021. Available online: https://ec.europa.eu/clima/eu-action/transport-emissions/road-transport-reducing-co2-emissions-vehicles/vehicle-energy-consumption-calculation-tool-vecto_es (accessed on 5 December 2021).
- EPA. Greenhouse Gas Emissions Model (GEM) for Medium- and Heavy-Duty Vehicle Compliance. 2022. Available online: https://www.epa.gov/regulations-emissions-vehicles-and-engines/greenhouse-gas-emissions-model-gem-medium-and-heavy-duty (accessed on 25 July 2022).
- Delgado, O.; Lutsey, N. Advanced Tractor-Trailer Efficiency Technology Potential in the 2020–2030 Timeframe; 2015. Available online: https://theicct.org/wp-content/uploads/2021/06/ICCT_ATTEST_20150420.pdf (accessed on 2 March 2022).
- Franco, V.; Delgado, O.; Muncrief, R. Heavy-Duty Vehicle Fuel-Efficiency Simulation: A Comparison of US and EU Tools; International Council on Clean Transportation: Washington, DC, USA, 2015. [Google Scholar]
- Quiros, D.C.; Thiruvengadam, A.; Pradhan, S.; Besch, M.; Thiruvengadam, P.; Demirgok, B.; Carder, D.; Oshinuga, A.; Huai, T.; Hu, S. Real-World Emissions from Modern Heavy-Duty Diesel, Natural Gas, and Hybrid Diesel Trucks Operating Along Major California Freight Corridors. Emiss. Control Sci. Technol. 2016, 2, 156–172. [Google Scholar] [CrossRef] [Green Version]
- Giraldo, M.; Huertas, J.I. Real emissions, driving patterns and fuel consumption of in-use diesel buses operating at high altitude. Transp. Res. Part D Transp. Environ. 2019, 77, 21–36. [Google Scholar] [CrossRef]
- Perrotta, F.; Parry, T.; Neves, L.C.; Buckland, T.; Benbow, E.; Mesgarpour, M. Verification of the HDM-4 fuel consumption model using a Big data approach: A UK case study. Transp. Res. Part D Transp. Environ. 2018, 67, 109–118. [Google Scholar] [CrossRef]
- Pepper, G.T. Methods and System for Determining Consumption and Fuel Efficiency in Vehicles. U.S. Patent No. 7,774,130, 10 August 2010. [Google Scholar]
- Quirama, L.F.; Giraldo, M.; Huertas, J.I.; Jaller, M. Driving cycles that reproduce driving patterns, energy consumptions and tailpipe emissions. Transp. Res. Part D Transp. Environ. 2020, 82, 102294. [Google Scholar] [CrossRef]
- SAE. Fuel Consumption Test Procedure—Type II J1321_202010. 2020. Available online: https://www.sae.org/standards/content/j1321_202010 (accessed on 10 March 2022).
- Kushiro, N.; Oniduka, Y.; Sakurai, Y. Initial Practice of Telematics-Based Prognostics for Commercial Vehicles: Analysis Tool for Building Faults Progress Model for Trucks on Telematics Data. Procedia Comput. Sci. 2017, 112, 2155–2164. [Google Scholar] [CrossRef]
- Ghaffarpasand, O.; Talaie, M.R.; Ahmadikia, H.; Khozani, A.T.; Shalamzari, M.D.; Majidi, S. Real-world assessment of urban bus transport in a medium-sized city of the Middle East: Driving behavior, emission performance, and fuel consumption. Atmos. Pollut. Res. 2021, 12, 113–124. [Google Scholar] [CrossRef]
- Sandhu, G.S.; Frey, H.C.; Bartelt-Hunt, S.; Jones, E. Real-world activity, fuel use, and emissions of heavy-duty compressed natural gas refuse trucks. Sci. Total Environ. 2021, 761. [Google Scholar] [CrossRef]
- Zhang, S.; Wu, Y.; Liu, H.; Huang, R.; Yang, L.; Li, Z.; Fu, L.; Hao, J. Real-world fuel consumption and CO2 emissions of urban public buses in Beijing. Appl. Energy 2014, 113, 1645–1655. [Google Scholar] [CrossRef]
- Lv, L.; Ge, Y.; Ji, Z.; Tan, J.; Wang, X.; Hao, L.; Wang, Z.; Zhang, M.; Wang, C.; Liu, H. Regulated emission characteristics of in-use LNG and diesel semi-trailer towing vehicles under real driving conditions using PEMS. J. Environ. Sci. 2020, 88, 155–164. [Google Scholar] [CrossRef]
- Sandhu, G.S.; Frey, C.H.; Bartelt-Hunt, S.; Jones, E. In-use activity, fuel use, and emissions of heavy-duty diesel roll-off refuse trucks. J. Air Waste Manag. Assoc. 2015, 65, 306–323. [Google Scholar] [CrossRef] [PubMed]
- Sandhu, G.S.; Frey, H.C.; Bartelt-Hunt, S.; Jones, E. Real-world activity, fuel use, and emissions of diesel side-loader refuse trucks. Atmos. Environ. 2016, 129, 98–104. [Google Scholar] [CrossRef]
- Huertas, J.I.; Serrano-Guevara, O.; Díaz-Ramirez, J.; Prato, D.; Tabares, L. Real vehicle fuel consumption in logistic corridors. Appl. Energy 2022, 314, 118921. [Google Scholar] [CrossRef]
- Malik, L.; Tiwari, G. Assessment of interstate freight vehicle characteristics and impact of future emission and fuel economy standards on their emissions in India. Transp. Res. Part D Transp. Environ. 2017, 108, 121–133. [Google Scholar] [CrossRef]
- INEGI; SCT; IMT. Red Nacional de Caminos Documento Técnico Descriptivo. 2015, Volume 1. Available online: https://www.snieg.mx/DocAcervoINN/documentacion/inf_nvo_acervo/SNIGMA/Red_Nacional_Caminos/documento_tecnico_descriptivo_rnc_2019.pdf (accessed on 20 March 2022).
- White, B.; Kirsch, F.; Levin, S.; Skinner, I.; Norris, J.; Jones, L. Analysis of Fuel Economy and GHG Emission Reduction Measures from Heavy Duty Vehicles in Other Countries and of Options for the EU. 2017. Available online: https://ec.europa.eu/clima/sites/clima/files/transport/vehicles/heavy/docs/analysis_fuel_economy_hdv_en.pdf (accessed on 28 February 2022).
- SCT. Estadística Básica del Autotransporte Federal. 2022. Available online: https://www.sct.gob.mx/fileadmin/DireccionesGrales/DGAF/EST_BASICA/EST_BASICA_2021/Estadística_Básica_del_Autotransporte_Federal_2021.pdf (accessed on 15 March 2022).
- SCT. NORMA Oficial Mexicana NOM-012-SCT-2-2017, Sobre el peso y Dimensiones Máximas con los que Pueden Circular los Vehículos de Autotransporte que Transitan en las vías Generales de Comunicación de Jurisdicción Federal. 2017. Available online: https://www.dof.gob.mx/nota_detalle.php?codigo=5508944&fecha=26/12/2017#gsc.tab=0 (accessed on 30 November 2021).
- Jung, S.H. Stratified Fisher’s exact test and its sample size calculation. Biom. J. 2014, 56, 129–140. [Google Scholar] [CrossRef] [Green Version]
- CRE. Precios de Gasolinas y Diésel Reportados por los Permisionarios. 2022. Available online: https://www.cre.gob.mx/ConsultaPrecios/GasolinasyDiesel/GasolinasyDiesel.html (accessed on 20 March 2022).
- Freightliner. The Road to Sustainability. 2019. Available online: https://freightlineradsaem.azureedge.net/content/dam/enterprise/documents/2912-vocational_natural_gas_trucks_-2019-05-31.pdf (accessed on 15 June 2022).
- Freightliner. Natural Gas Fuel Your Future. 2021. Available online: https://freightlineradsaem.azureedge.net/content/dam/enterprise/documents/3642-new_cascadia_natural_gas_sell_-2019-06-13-1.pdf (accessed on 15 June 2022).
- Kenworth. Kenworth T680 Next Generation Offers Cummins Westport ISX12N Near-Zero Emissions Natural Gas Engine. 2021. Available online: https://www.kenworth.com/about-us/news/kenworth-t680-next-generation-offers-cummins-westport-isx12n-near-zero-emissions-natural-gas-engine/ (accessed on 20 March 2022).
- Dewesoft. Evaluación del Consumo de Energía en Minibús Eléctrico. 2022. Available online: https://dewesoft.com/es/case-studies/evaluacin-del-consumo-energetico-de-un-minubus-electrico (accessed on 21 December 2022).
- Pineda, L.; Jimenez, C.; Delgado, O. Estrategia Para el Despliegue de Flota Eléctrica en el Sistema de Corredores de Transporte Público de Pasajeros de la Ciudad de México “ Metrobús ”: Líneas 3 y 4. 2022. Available online: https://theicct.org/wp-content/uploads/2022/03/hdv-latam-estrategia-despliegue-flota-electrica-sistema-corredores-transporte-publico-ciudad-mexico-metrobus-lineas-3-y-4.pdf (accessed on 30 April 2022).
- Nasa, J.P.L. NASA Shuttle Radar Topography Mission Global 3 arc Second. 2013. Available online: https://lpdaac.usgs.gov/products/srtmgl3v003/ (accessed on 20 June 2021).
- Pavlovic, J.; Fontaras, G.; Broekaert, S.; Ciuffo, B.; Ktistakis, M.A.; Grigoratos, T. How accurately can we measure vehicle fuel consumption in real world operation? Transp. Res. Part D Transp. Environ. 2021, 90, 102666. [Google Scholar] [CrossRef]
- SENER. Programa de Desarrollo del Sistema Eléctrico Nacional. 2018. Available online: https://www.gob.mx/cms/uploads/attachment/file/331770/PRODESEN-2018-2032-definitiva.pdf (accessed on 15 April 2022).
- Kelley Blue Book. What Is MPGe? Everything You Need to Know. 2021. Available online: https://www.kbb.com/car-advice/what-is-mpge/#:~:text=MPGe%20stands%20for%20miles%20per,electricity%20as%20its%20fuel%20source (accessed on 30 April 2022).
- IPCC. Climate Change 2014: Synthesis Report. Contribution. In Climate Change 2014: Synthesis Report. Contribution of Working Groups I, II and III to the Fifth Assessment Report of the Intergovernmental Panel on Climate Change; IPCC: Geneva, Switzerland, 2014. [Google Scholar]
- SEMARNAT; INECC. Inventario Nacional de Emisiones de Gases y Compuestos de Efecto Invernadero. 2019. Available online: https://www.gob.mx/inecc/acciones-y-programas/inventario-nacional-de-emisiones-de-gases-y-compuestos-de-efecto-invernadero (accessed on 30 March 2022).
- DBEIS; DEFR. Greenhouse Gas Reporting: Conversion Factors 2021. 2022. Available online: https://www.gov.uk/government/publications/greenhouse-gas-reporting-conversion-factors-2021 (accessed on 23 February 2022).
- INECC. Factores de Emisión Para los Diferentes Tipos de Combustibles Fósiles que se Consumen en México (Volume 52). 2014. Available online: http://www.inecc.gob.mx/descargas/cclimatico/2014_inf_parc_tipos_comb_fosiles.pdf (accessed on 24 May 2022).
- SEMARNAT. Inventario Nacional de Emisiones de Contaminantes Criterio (INEM). 2019. Available online: https://www.gob.mx/semarnat/acciones-y-programas/inventario-nacional-de-emisiones-de-contaminantes-criterio-inem (accessed on 15 March 2022).
- Díaz-Ramirez, J.; Giraldo-Peralta, N.; Flórez-Ceron, D.; Rangel, V.; Mejía-Argueta, C.; Huertas, J.I.; Bernal, M. Eco-driving key factors that influence fuel consumption in heavy-truck fleets: A Colombian case. Transp. Res. Part D Transp. Environ. 2017, 56, 258–270. [Google Scholar] [CrossRef]
- EPA; NHTSA; DOT. Greenhouse Gas Emissions and Fuel Efficiency Standards for Medium- and Heavy-Duty Engines and Vehicles—Phase 2. 2016. Available online: https://www.epa.gov/regulations-emissions-vehicles-and-engines/final-rule-phase-2-greenhouse-gas-emissions-standards (accessed on 14 November 2021).
- Delgado, O.; Miller, J.; Sharpe, B.; Muncrief, R. Estimating the Fuel Efficiency Technology Potential of Heavy-Duty Trucks in Major Markets around the World. 2016. Available online: https://www.globalfueleconomy.org/media/404893/gfei-wp14.pdf (accessed on 18 February 2022).
- ICCT. Second-Phase Fuel Economy Standards for On-Road Heavy-Duty Vehicles in Japan; International Council on Clean Transportation: Washington, DC, USA, 2019; Available online: https://theicct.org/wp-content/uploads/2021/06/Japan_HDV_FE_Phase_2_20190129.pdf (accessed on 30 November 2021).
- Ragon, P.-L.; Rodríguez, F. No. 2021-35; CO2 emissions from trucks in the EU: An analysis of the heavy-duty CO2 standards baseline data. National Academies of Sciences, Engineering, and Medicine: Washington, DC, USA, 2021.
- Aroua, A.; Lhomme, W.; Redondo-Iglesias, E.; Verbelen, F. Fuel saving potential of a long haul heavy duty vehicle equipped with an electrical variable transmission. Appl. Energy 2022, 307, 118264. [Google Scholar] [CrossRef]
- Mane, A.; Djordjevic, B.; Ghosh, B. A data-driven framework for incentivising fuel-efficient driving behaviour in heavy-duty vehicles. Transp. Res. Part D Transp. Environ. 2021, 95, 102845. [Google Scholar] [CrossRef]
- Gómez, A.; Fernández-Yáñez, P.; Soriano, J.A.; Sánchez-Rodríguez, L.; Mata, C.; García-Contreras, R.; Armas, O.; Cárdenas, M.D. Comparison of real driving emissions from Euro VI buses with diesel and compressed natural gas fuels. Fuel 2021, 289, 119836. [Google Scholar] [CrossRef]
- Chikishev, E.; Chainikov, D. Assessment of External Factors Influence on the Route Fuel Consumption of a Diesel Bus Operating on a City Route. Transp. Res. Procedia 2022, 61, 354–360. [Google Scholar] [CrossRef]


| Parameter | Units | Diesel | CNG |
|---|---|---|---|
| Natural state | - | Liquid | Gas |
| Cetane number | - | 45 (min) | - |
| Research octane number | - | - | 130 |
| Lower heating value | MJ/kg | 45.61 | 46.31 |
| Density | kg/m3 | 826 | 0.844 |
| Sulfur content | ppm | 15–500 (max) | 150 (max) |
| Use | Fuel | Category | Manufacturer | Age | Sample Size |
|---|---|---|---|---|---|
| Freight | Diesel | C2 | International | 0–5 years | 12 |
| Isuzu | 0–5 years | 6 | |||
| 5–10 years | 9 | ||||
| Kenworth | 0–5 years | 33 | |||
| C3 | Kenworth | 0–5 years | 7 | ||
| International | 0–5 years | 9 | |||
| T3 | Chevrolet | more than 10 years | 1 | ||
| Freightliner | 0–5 years | 274 | |||
| 5–10 years | 48 | ||||
| more than 10 years | 42 | ||||
| International | 0–5 years | 19 | |||
| 5–10 years | 50 | ||||
| more than 10 years | 1 | ||||
| Kenworth | 0–5 years | 2398 | |||
| 5–10 years | 828 | ||||
| more than 10 years | 228 | ||||
| Scania | 0–5 years | 1 | |||
| Volvo | 0–5 years | 10 | |||
| 5–10 years | 364 | ||||
| more than 10 years | 71 | ||||
| CNG | T3 | Freightliner | 0–5 years | 1 | |
| 5–10 years | 7 | ||||
| Kenworth | 0–5 years | 187 | |||
| 5–10 years | 64 | ||||
| Electric * | C2, C3, and T3 | BYD | Brand new vehicles | 18 | |
| Mitsubishi | 1 | ||||
| Orten | 6 | ||||
| Mercedes Benz | 1 | ||||
| Kenworth | 1 | ||||
| Volvo | 2 | ||||
| Passenger | Diesel | B2 | Ayco | 0–5 years | 59 |
| 5–10 years | 44 | ||||
| more than 10 years | 9 | ||||
| Chevrolet | more than 10 years | 1 | |||
| Dina | 0–5 years | 203 | |||
| 5–10 years | 81 | ||||
| more than 10 years | 15 | ||||
| International | 0–5 years | 42 | |||
| 5–10 years | 1 | ||||
| Irizar | 0–5 years | 20 | |||
| 5–10 years | 12 | ||||
| more than 10 years | 78 | ||||
| Marco polo | 0–5 years | 1 | |||
| 5–10 years | 1 | ||||
| more than 10 years | 11 | ||||
| MCI | 5–10 years | 1 | |||
| more than 10 years | 6 | ||||
| Mercedes Benz | 0–5 years | 175 | |||
| 5–10 years | 142 | ||||
| more than 10 years | 253 | ||||
| Oisa | 0–5 years | 10 | |||
| Scania | 0–5 years | 1 | |||
| Vissta | 5–10 years | 1 | |||
| Volkswagen | 0–5 years | 578 | |||
| 5–10 years | 25 | ||||
| B3 | Marco polo | 0–5 years | 37 | ||
| V | Mercedes Benz | 0–5 years | 188 | ||
| 5–10 years | 43 | ||||
| more than 10 years | 34 | ||||
| Volkswagen | 0–5 years | 18 | |||
| CNG | B2 | Dina | 0–5 years | 95 | |
| Hyundai | 0–5 years | 100 | |||
| Electric * | V, B2, and B3 | BYD | Brand new vehicles | 20 | |
| Mercedes Benz | 1 | ||||
| Orten | 1 | ||||
| Goldstone | 1 | ||||
| Lion | 1 | ||||
| Foton | 2 | ||||
| Zhongton | 1 | ||||
| King Long | 1 | ||||
| Avevai | 1 | ||||
| Karsan Jest BMW | 1 | ||||
| Yutong | 2 |
| Variable | Instrument/Method | Features | Sampling Frequency |
|---|---|---|---|
| Position, speed | GPS | Position: ~2 m Speed: ~0.05 m/s | 1–20 s |
| Fuel consumption | OBD | Through injection time | 1–20 min |
| Manual record of the fuel needed to refill the vehicle tank | N/A | After each trip | |
| Altitude | Digital Elevation Model | Based on (NASA JPL, 2013 [39]) Accuracy: ~90 m | 1–20 s |
| Weight | Reported by manufacturer | N/A | N/A |
| Fuel | Generation * | Efficiency | WtT Emitted GHG |
|---|---|---|---|
| % | % | g CO2e/DEL | |
| Coal | 7 | 39 | 4636.03 |
| Natural gas | 56 | 46 | 2090.12 |
| Fuel oil | 10 | 30 | 2640.51 |
| Geothermal | 10 | 100 ** | 0 |
| Solar | 100 ** | 0 | |
| Wind | 100 ** | 0 | |
| Hydraulic | 7 | 100 ** | 0 |
| Nuclear | 3 | 34 | 0 |
| Other | 7 | N/D | N/D |
| Energy Source | WtT | TtW | WtW | ||
|---|---|---|---|---|---|
| CO2 | CH4 | N2O | |||
| kg CO2e/DEL | kg/DEL | kg/DEL | kg/DEL | kg CO2e/DEL | |
| Diesel | 0.64 * | 2.73 | 0.0001 | 0.0001 | 3.42 |
| CNG | 0.45 * | 2.18 | 0.0035 | 0.0001 | 2.76 |
| Electric | 1.97 | 0.00 | 0.0000 | 0.0000 | 1.97 |
| Segment | Category | Number of Axles | Number of Wheels | GVWR [t] | Vehicle | % in Segment Fleet * | Diesel | CNG | Electric | |||||||||
|---|---|---|---|---|---|---|---|---|---|---|---|---|---|---|---|---|---|---|
| SFC [DEL/100 km] | SFC * [DEL/100 km-t] | CO2 (W2W) [g/km] | CO2 (W2W) [g/km-t] | SFC [DEL/100 km] | SFC * [DEL/100 km-t] | CO2 (W2W) [g/km] | CO2 (W2W) [g/km-t] | SFC [DEL/100 km] | SFC * [DEL/100 km-t] | CO2 (W2W) [g/km] | CO2 (W2W) [g/km-t] | |||||||
| Passengers | Van ** | 2 | 4 | 6.5 |  | 5.0 | 9.33 | 1.70 | 319 | 58.01 | N/D | N/D | N/D | N/D | 5.65 | 0.86 | 111 | 16.99 |
| B-2 | 2 | 6 | 14–19 |  | 95.0 | 22.72 | 1.52 | 777 | 51.92 | 56.19 | 3.75 | 1551 | 103 | 22.65 | 2.72 | 446 | 53.55 | |
| B-3 | 3 | 8–10 | 17–27.5 |  | ~0.0 | 38.48 | 2.26 | 1316 | 77.46 | N/D | N/D | N/D | N/D | 30.29 | 2.09 | 597 | 41.08 | |
| Freight | C-2 | 2 | According to the trailer configuration | 19 |  | 20.3 | 23.02 | 1.21 | 787 | 41.43 | N/D | N/D | N/D | N/D | 16.97 | 1.50 | 334 | 29.60 |
| C-3 | 3 | 24–27.5 |  | 15.7 | 29.39 | 1.07 | 1005 | 36.55 | N/D | N/D | N/D | N/D | 21.88 | 0.84 | 431 | 16.58 | ||
| T-3 | 3 | 46.5–54.5 |  | 63.2 | 44.25 | 0.82 | 1513 | 28.03 | 54.38 | 1.01 | 1501 | 27.79 | 36.96 | 0.99 | 728 | 19.46 | ||
Disclaimer/Publisher’s Note: The statements, opinions and data contained in all publications are solely those of the individual author(s) and contributor(s) and not of MDPI and/or the editor(s). MDPI and/or the editor(s) disclaim responsibility for any injury to people or property resulting from any ideas, methods, instructions or products referred to in the content. |
© 2022 by the authors. Licensee MDPI, Basel, Switzerland. This article is an open access article distributed under the terms and conditions of the Creative Commons Attribution (CC BY) license (https://creativecommons.org/licenses/by/4.0/).
Share and Cite
Serrano-Guevara, O.S.; Huertas, J.I.; Quirama, L.F.; Mogro, A.E. Energy Efficiency of Heavy-Duty Vehicles in Mexico. Energies 2023, 16, 459. https://doi.org/10.3390/en16010459
Serrano-Guevara OS, Huertas JI, Quirama LF, Mogro AE. Energy Efficiency of Heavy-Duty Vehicles in Mexico. Energies. 2023; 16(1):459. https://doi.org/10.3390/en16010459
Chicago/Turabian StyleSerrano-Guevara, Oscar S., José I. Huertas, Luis F. Quirama, and Antonio E. Mogro. 2023. "Energy Efficiency of Heavy-Duty Vehicles in Mexico" Energies 16, no. 1: 459. https://doi.org/10.3390/en16010459
APA StyleSerrano-Guevara, O. S., Huertas, J. I., Quirama, L. F., & Mogro, A. E. (2023). Energy Efficiency of Heavy-Duty Vehicles in Mexico. Energies, 16(1), 459. https://doi.org/10.3390/en16010459