Abstract
The constant development of civilization increases environmental pollution as a result of industrial activity and transport. Consequently, human activity in this area is restricted by regulations governing the permissible emission of harmful substance components into the environment. These include substances emitted by combustion engines, the use of which remains high in many industries. Consequently, research is being conducted to reduce the emissions of harmful exhaust components from existing and newly manufactured internal combustion engines. This research presents a used semi-truck engine, in which an innovative Compressed Natural Gas (CNG) supply system was applied. Using this fuel supply installation allows a mass exchange of the base diesel fuel to natural gas of up to 90%. The study evaluated the effect of the diesel/CNG exchange ratio for different engine operating conditions (engine load, speed) on the concentration of toxic components, such as CO, NO, NO2, NOX, as a sum of NO, NO2, CH4, C2H4, C2H6, C3H8, NH3, and CH2O. The use of a dual-fuel system had a positive effect on the emissions of some harmful exhaust components, even in an engine from a vehicle that had been running for many years on diesel and at high mileage, but, simultaneously, the emissions of some harmful exhaust gas components increased.
Keywords:
diesel-CNG; CNG; dual-fuel; alternative fuel; exhaust gas composition; exhaust emissions; CO; NO; NO2; NOX CH4; C2H4; C2H6; C3H8; NH3; CH2O 1. Introduction
This study is a continuation of an article [1] published by the authors in the Energies journal. The second article in the series aims to extend and complete the knowledge on emissions of harmful components of exhaust gases and their changes by dual-fuel engines fuelled with natural gas and diesel fuel. The previous article described in detail the principle of operation of dual-fuel engines running on liquid and gaseous fuels and the test methodology.
Theoretically, dual-fuel engines that succeed in creating a homogeneous mixture of low-reactive fuel and air allow both fuels to be burned with an efficiency comparable to that of an HCCI (Homogeneous Charge Compression Ignition) engine. In the case of dual-fuel combustion, this type of engine operation is considered as a RCCI engine (Reactivity Controlled Compression Ignition), described in detail in other works by the authors [1,2]. The basics of the operation of this type of engine will be cited here as an introduction, a more detailed description can be found in our paper [3] based on dozens of other bibliographic references.
In a dual-fuel Compression Ignition (CI) engine, a motor is fed indirectly by a high-octane-number and low-reactive fuel which, in the presented research, was CNG. Then, after a compression process the high-cetane-number fuel is injected into the combustion chamber which, as a result of self-ignition, leads to the ignition of the liquid fuel and then the gaseous fuel as well. Such a combination is the most popular version of the “Dual-Fuel” CI power supply. There are some good reasons in favor of using such a simply solution, including the high percentage of replacement value and easy modification of the engine [4].
Purpose of the Study and Literature Review
The purpose of the study was to present the emissions and their changes from the tests carried out in order to enable them to be compared with other research works of this type.
There are only a small number of studies in a similar vein in the current literature—most research work is already based on the concept of homogeneous mixture combustion, which allows significantly more efficient use of fuel, and it was not the authors’ aim to compare emissions with this type of engine. Such engines are well described in [5], while publications on engine emission tests, in which the combustion chamber of a used engine dismantled from a Euro-3-compliant semi-truck was not interfered with and only the engine feed system was optimized, were not found by the authors. It should be emphasized that this type of modification is mainly carried out by Polish companies that are market leaders with one of the largest production potentials in this field [6,7,8,9]. Modifications of this type are currently very strongly developed in the authors’ country; however, there are a small number of publications on the subject, so the authors undertook the task of investigating an engine with this type of installation.
In one study [10], emissions were investigated for load characteristic test runs, which cannot be compared with the results published in this article. Study [11] tested engines from newer generation trucks in Steady-State SET Cycle tests, which is not equivalent to the studies published within this article. Although when comparing the general trends in emission changes the directions of changes are in line with the results of our study, the lack of fundamental possibility to compare the values for different types of tests has been proven many times, which was reminiscently examined and presented by Prof. Merkisz in a recent publication [12].
In another study [13], emissions were investigated in a small diesel engine (historically the smallest factory-produced diesel engine designed for cars), which cannot be compared with an engine from a semi-truck. Similar research was also carried out on an older engine [14], also manufactured in Poland. This research is also not equivalent to the research carried out for this article. An even smaller engine was dealt with by researchers in [15], in which emissions were examined in a cursory manner at several operating points with which no meaningful comparison can be made. A similarly sized engine was investigated by [16]. The commonness of research on engines of this type is due to the ease of performing this type of research and the cost effectiveness of conducting this type of research, hence the large number of university publications on small power engines. The largest number of publications on the subject of dual-fuel engines have been presented by Professors Rolf Reids [17] and Garcia [18], and all of their studies as mentioned when citing publication [5] are on higher generation engines, which also makes it impossible to make a clear reference. However, it should also be noted that the paper presents emission results and describes the mechanism of formation and changes of emissions for the following compounds that have not yet been described in the available literature: C2H4-ethene, C2H6-ethane, C3H8-propane, NH3–ammonia, and CH2O-formaldehyde. From our point of view, these are unique studies that have not been described in any of the available literature.
It Is also necessary to bear in mind the changes that occur in the engine systems during the test, in which the flow rates may change, due to, for example, a reduction in the capacity of the fuel or air filters [19], which has a significant impact on the engine performance and may affect the differences between individual test runs, and which, due to the difficulty in estimating changes in these values, are not corrected within the calculations for this article [20].
2. Materials and Methods
The degree of substitution/replacement of the base fuel with gaseous fuel can be considered as a percentage degree or energy degree. In the study under consideration, the replacement ratio for the dual-fuel engine was determined as a level ratio of high-octane fuel consumed to the whole fuels used by the engine. This parameter was determined based on Equation (1) [4]:
where is diesel fuel hourly engine consumption in kg at the time when engine is running only on diesel, and is diesel fuel hourly engine consumption in the time when engine is running on both fuels, i.e., CNG and diesel fuel.
This is an effective way of illustrating how much liquid fuel is physically substituted by gaseous fuel, although it is also generally accepted to use the value of replacement ratio calculated from the energy ratio of substituted fuels. This method is used by other researchers [14,21,22,23], it is also defined by a contemporary standard [24], or book publications [4,25]. It is advisable, however, to determine the value to which we refer in the following part of the study as presented in Formula 1. In this way, we avoid the problem of determining the exact calorific value of the gaseous fuel used. The fractional composition of the gas on the Polish market, from which the fuel was obtained, can be very large, which was already described in detail by the authors in their first joint publication [26]. The assumption of certain rigid defined values could lead to significant cognitive errors, which the authors tried to avoid.
As part of the study, when comparing the emission results of the individual harmful components of exhaust gases, they were also compared to the emission standards currently in force, as defined by regulations in force in the European Union [27,28] and those that are being prepared for introduction as part of further regulations [27,28,29]. The current standard and the scenarios for the standards to be introduced in the future are presented in Table 1.

Table 1.
A tabular overview of the emission limits of the individual exhaust gas components for the different Euro standards, with revisited emission limits according to the alternative scenarios for Euro 7 [27,28,29].
The emission values specified in the emission standards for the Euro standards cannot be directly related to the results that were achieved in this study, but they can be used for an indicative comparison of the results achieved with the applicable standards. This is because a different type of test is carried out to meet these standards (in this case, the WHTC—the World Harmonized Transient Cycle test [30]), but there are areas of work included in the tests that were also carried out for the present study [31].
The goal of our research was to determine in the experimental way the effect of replacement ratio of diesel fuel by CNG, defined by Equation (1), on the emission of individual exhaust components, CO, NO, NO2, NOX CH4, C2H4, C2H6, C3H8, NH3, and CH2O, in fixed operating states in an innovative, non-factory CNG/diesel dual-fuel supply system in a used semi-truck unit engine
All tests were carried out with the semi-truck’s VOLVO FH13 D13C460 EU5EEV (338 kW) engine. All-important information about the engine, test bench, and testing parameters are described in our previous article [1].
“The tested engine, according to the approval documents, met the requirements of the EURO V standard when it left the factory,” said authors in [32]. The tests and results of useful engine measurements were brought down to normal conditions [33].
Methodology for Determining the Effect of the CNG/ON Substitution Factor on Engine Emission
Diesel fuel EN-590 from one production batch was used for the tests. Lack of reference fuel according to document [34] allows the use of fuel similar to the reference fuel. Therefore, determining the actual values of the engine operating characteristics (operation on commercial fuel from a random petrol station) can be considered an advantage that makes the research and results more realistic.
The tests were carried out on a properly and optimally tuned external natural gas supply system. The power and torque characteristics of the engine in dual-fuel mode largely coincided with the factory characteristics.
Flue gas temperature changes are shown in the test results as shown (Figure 1 and Figure 2), or the emission of individual gaseous components, i.e., CO (Figure 3 and Figure 4), NO and NO2 (Figure 5, Figure 6, Figure 7 and Figure 8), NOX (Figure 9 and Figure 10), CH4 (Figure 11 and Figure 12), C2H6 (Figure 13 and Figure 14), NMOC (Non-Methane Organic compounds on Figure 15 and Figure 16), C2H4 (Figure 17 and Figure 18), NH3 (Figure 19 and Figure 20), and CH2O (Figure 21 and Figure 22). Every even chart number shows percentage changes of the substance or group of substances measured. In order to simplify the analysis and determine the changes taking place, the results are also presented by comparing the relative results obtained for diesel oil/CNG and diesel fuel only (right side of the figures). The following tests were carried out:
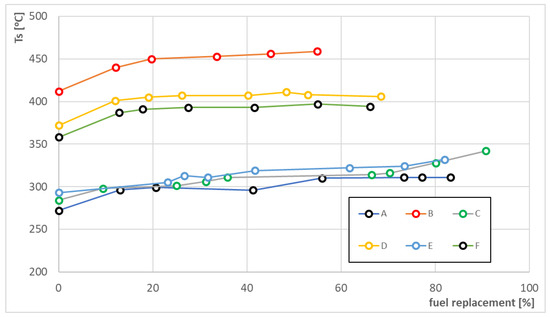
Figure 1.
Curves from A to F showing the exhaust gas temperatures for individual engine operating points, where the rotation speed, power, and torque were constant, as a replacement function of diesel fuel replaced by CNG.
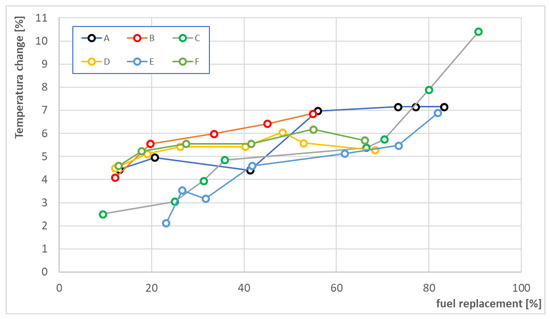
Figure 2.
Curves from A to F showing the changes in the exhaust gas temperatures as the comparison of exhaust gas temperature noted only in single fuel (diesel) working mode for individual engine operating points, where the rotation speed, power, and torque were constant, as a dual-fuel mode (where engine uses CNG and diesel fuel) replacement function.
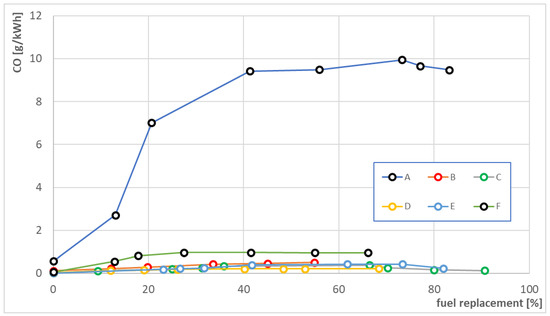
Figure 3.
Curves from A to F showing engine’s emission of CO (carbon monoxide) for individual engine operating points, where the rotation speed, power, and torque were constant, as a replacement function of diesel fuel replaced by CNG.
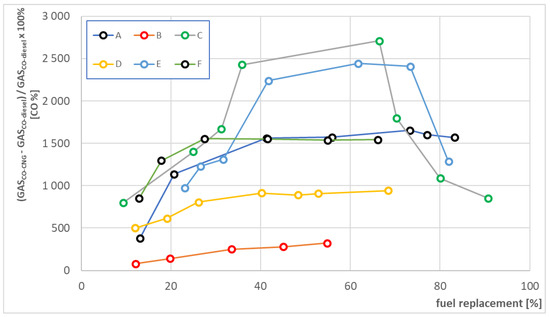
Figure 4.
Emission changes of carbon monoxide in the exhaust gas for individual engine operating points (rotation speed, torque) in comparison to point zero of replacing diesel/CNG as a function of replacing diesel/CNG. Curves from A to F showing the changes of the emission of carbon monoxide as the comparison of exhaust gas temperature noted only in single fuel (diesel) working mode for individual engine operating points, where the rotation speed, power, and torque were constant, as a dual fuel mode (where engine uses CNG and diesel fuel) replacement function.
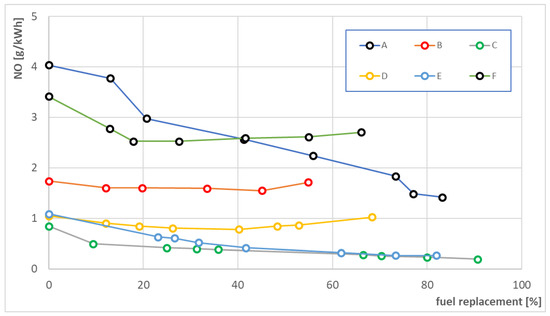
Figure 5.
Curves from A to F showing engine’s emission of NO (nitric oxide), for individual engine operating points, where the rotation speed, power, and torque were constant, as a replacement function of diesel fuel replaced by CNG.
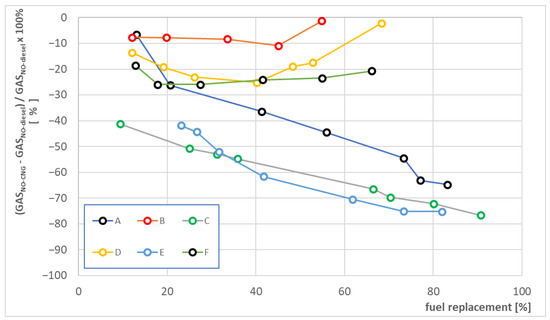
Figure 6.
Curves from A to F showing the changes in the emission of nitric oxide as the comparison of exhaust gas temperature noted only in single fuel (diesel) working mode for individual engine operating points, where the rotation speed, power, and torque were constant, as a dual fuel mode (where engine uses CNG and diesel fuel) replacement function.
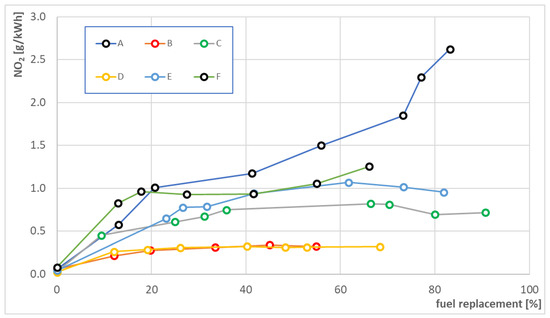
Figure 7.
Curves from A to F showing engine’s emission of NO2 (nitrogen dioxide), for individual engine operating points, where the rotation speed, power, and torque were constant, as a replacement function of diesel fuel replaced by CNG.
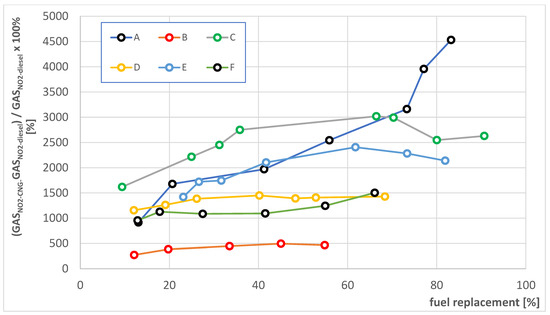
Figure 8.
Curves from A to F showing the changes in the emission of nitrogen dioxide as the comparison of exhaust gas temperature noted only in single fuel (diesel) working mode for individual engine operating points, where the rotation speed, power, and torque were constant, as a dual-fuel mode (where engine uses CNG and diesel fuel) replacement function.
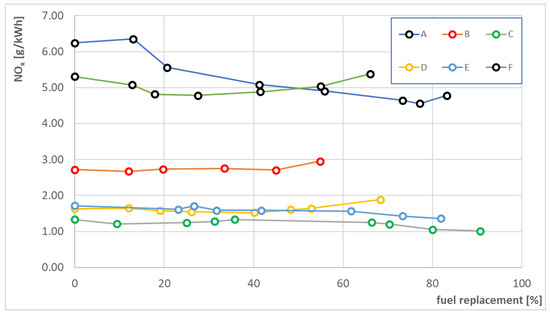

Figure 9.
Curves from A to F showing engine’s emission of NOX (nitrogen oxides), for individual engine operating points, where the rotation speed, power, and torque were constant, as a replacement function of diesel fuel replaced by CNG.
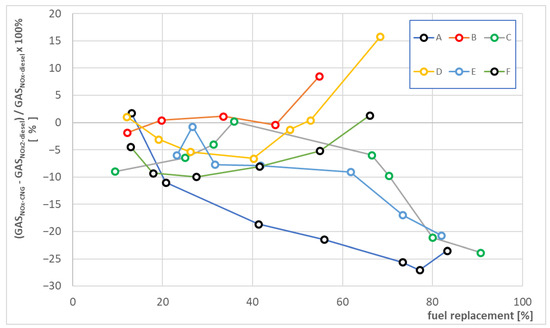
Figure 10.
Curves from A to F showing the changes in the emission of nitrogen oxides as the comparison of exhaust gas temperature noted only in single fuel (diesel) working mode for individual engine operating points, where the rotation speed, power and torque were constant, as a dual-fuel mode (where engine uses CNG and diesel fuel) replacement function.
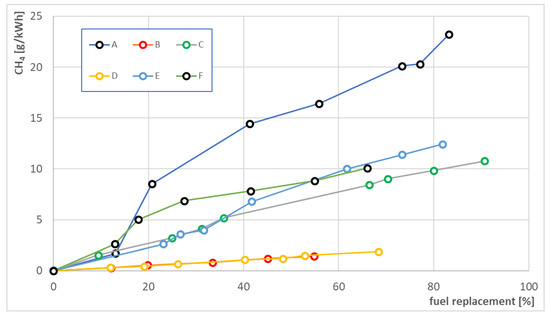
Figure 11.
Curves from A to F showing engine’s emission of CH4 (methane), for individual engine operating points, where the rotation speed, power, and torque were constant, as a replacement function of diesel fuel replaced by CNG.
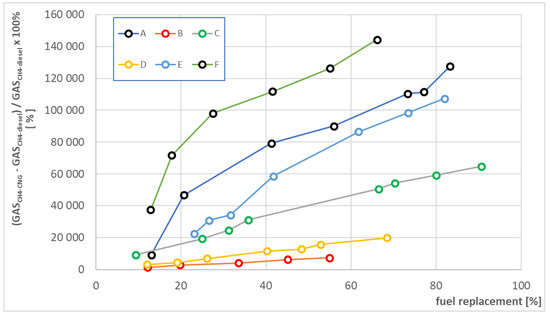
Figure 12.
Curves from A to F showing the changes in the emission of methane as the comparison of exhaust gas temperature noted only in single fuel (diesel) working mode for individual engine operating points, where the rotation speed, power, and torque were constant, as a dual-fuel mode (where engine uses CNG and diesel fuel) replacement function.
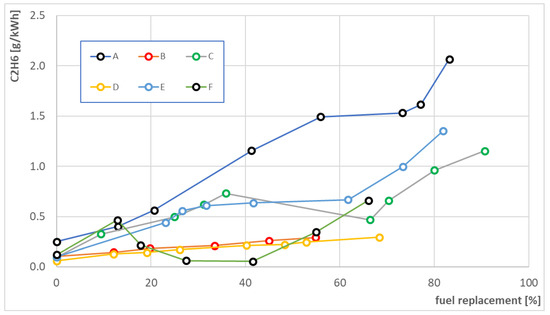
Figure 13.
Curves from A to F showing the engine’s emission of C2H6 (ethane), for individual engine operating points, where the rotation speed, power, and torque were constant, as a replacement function of diesel fuel replaced by CNG.
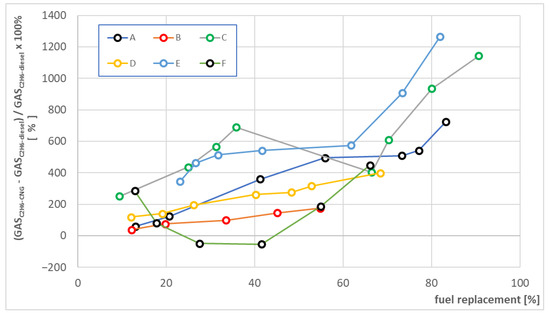
Figure 14.
Curves from A to F showing the changes of the emission of ethene as the comparison of exhaust gas temperature noted only in single fuel (diesel) working mode for individual engine operating points, where the rotation speed, power, and torque were constant, as a dual-fuel mode (where engine uses CNG and diesel fuel) replacement function.
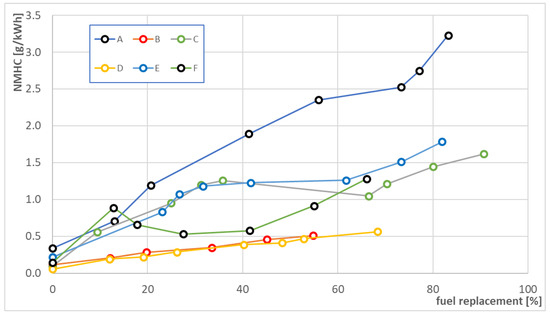
Figure 15.
Curves from A to F showing engine’s emission of NMOC (Non-Methane Organic Compounds), for individual engine operating points, where the rotation speed, power, and torque were constant, as a replacement function of diesel fuel replaced by CNG.
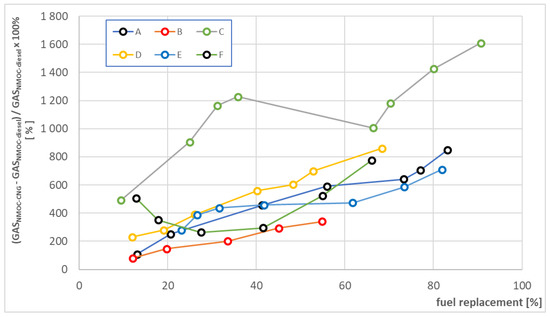
Figure 16.
Curves from A to F showing the changes in the emission of NMOC as the comparison of exhaust gas temperature noted only in single fuel (diesel) working mode for individual engine operating points, where the rotation speed, power, and torque were constant, as a dual-fuel mode (where engine uses CNG and diesel fuel) replacement function.
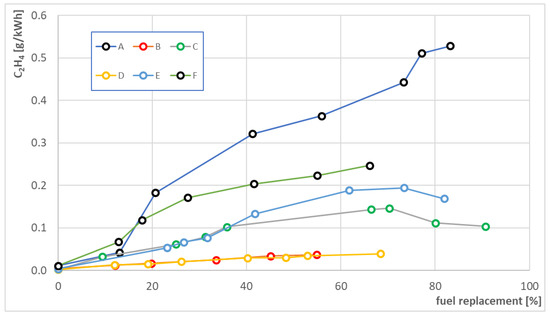
Figure 17.
Curves from A to F showing engine’s emission of C2H4 (ethene), for individual engine operating points, where the rotation speed, power, and torque were constant, as a replacement function of diesel fuel replaced by CNG.
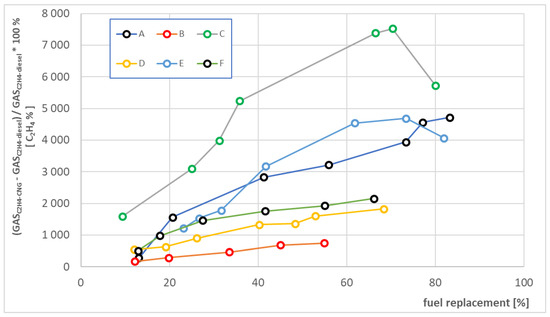
Figure 18.
Curves from A to F showing the changes in the emission of ethene as the comparison of exhaust gas temperature noted only in single fuel (diesel) working mode for individual engine operating points, where the rotation speed, power, and torque were constant, as a dual-fuel mode (where engine uses CNG and diesel fuel) replacement function.
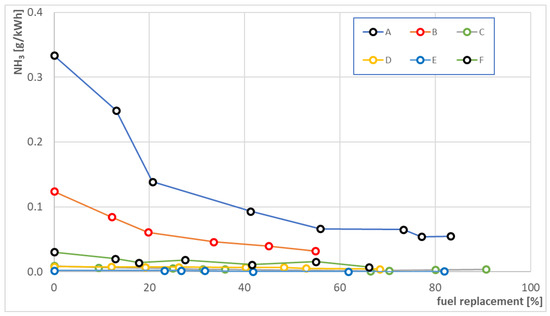
Figure 19.
Curves from A to F showing engine’s emission of NH3 (ammonia), for individual engine operating points, where the rotation speed, power, and torque were constant, as a replacement function of diesel fuel replaced by CNG.
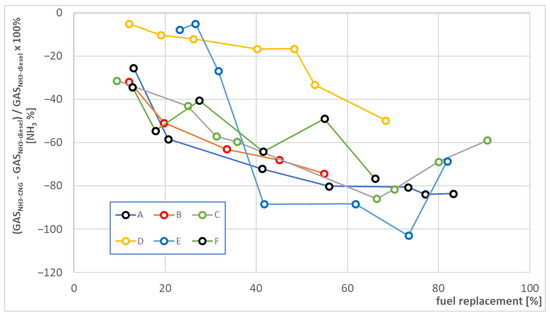
Figure 20.
Curves from A to F showing the changes in the emission of ammonia as the comparison of exhaust gas temperature noted only in single fuel (diesel) working mode for individual engine operating points, where the rotation speed, power, and torque were constant, as a dual-fuel mode (where engine uses CNG and diesel fuel) replacement function.
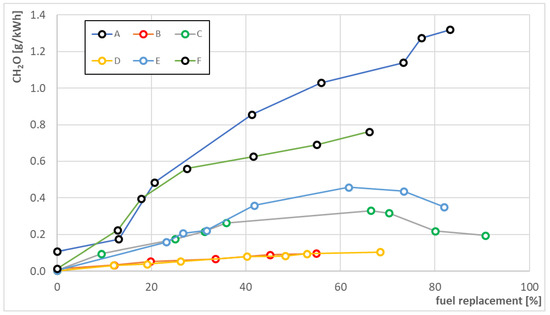
Figure 21.
Curves from A to F showing engine’s emission of CH2O (formic formaldehyde), for individual engine operating points, where the rotation speed, power, and torque were constant, as a replacement function of diesel fuel replaced by CNG.
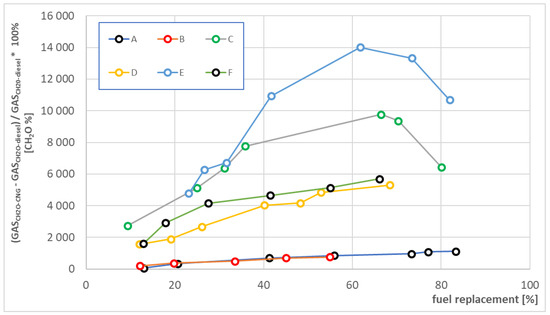
Figure 22.
Curves from A to F showing the changes in the emission of formic formaldehyde as the comparison of exhaust gas temperature noted only in single fuel (diesel) working mode for individual engine operating points, where the rotation speed, power, and torque were constant, as a dual-fuel mode (where engine uses CNG and diesel fuel) replacement function.
- For two values of load torque in a constant engine speed of 1100 rpm for approx. 520 Nm (61 kW), which was shown on charts as a curve “A”, and 1150 Nm (139 kW), which was shown on charts as a curve “B”;
- For two values of load torque in a constant engine speed of 1300 rpm for approx. 480 Nm (67 kW), which was shown on charts as a curve “C”, and 980 Nm (134 kW), which was showed on charts as a curve “D”;
- For two values of load torque in a constant engine speed of 1500 rpm, approx. 500 Nm (79 kW), which was shown on charts as a curve “E”, and 1040 Nm (163 kW), which was shown on charts as a curve “F”.
These are the conditions in which the engine most frequently operates, as identified during road tests of the semi-truck from which the engine was derived. The operating points correspond to the most operationally relevant operating areas of the engine modified to run on dual fuel. The working points identified here were also consulted with and accepted by the manufacturer involved in the production and further distribution of the dual-fuel controller developed by our research team.
Emissions of harmful exhaust constituents were calculated following EN ISO 8178-1 on the measurement of exhaust emissions from piston engines [35]. Changes in emissions were calculated as the ratio of the difference between the emissions of an engine operating in dual-fuel (DF) mode at a given operating point and the emissions of that engine operating in single-fuel (SF) mode at a given operating point to the emissions of that engine in single-fuel (SF) mode at that operating point, expressed as a percentage, as in the following formula:
where DF emission is the emissions of an engine operating in dual-fuel mode at a given point in its operation, and SF emission is the emissions of an engine operating in single-fuel mode at a given point in its operation.
An innovative, dedicated, diesel/CNG EG Diesel DI supply system in software version 1.7.2 was installed on a VOLVO D13C 460 semi truck’s engine.
Key features of this installation include:
- -
- Two injectors working in parallel-supplying one cylinder, mounted in a transition plate fitted between the head and the intake manifold;
- -
- The operating pressure of the system: CNG-8 bar;
- -
- Gas injection rail supply double-sided to avoid pressure drops;
- -
- An achieved energy conversion rate of up to 95% for diesel/CNG, which is significantly better than installations generally available on the market;
- -
- The installation is dedicated to a specific engine family/brand, when changing engines, it is re-optimized on a dynamometer bench;
- -
- A bypass valve used in the intake system to regulate boost pressure when running on CNG to avoid knocking combustion.
It was possible to include the implementation of the following functions in the dedicated software:
- -
- Automatic changeover to dual-fuel operation when conditions are met—minimum reducer temperature, minimum engine crankshaft speed, and others;
- -
- Adaptation of the switching time from mono- to bi-fuel operation between cylinders to maintain engine stability;
- -
- Method of implementation of diesel to CNG changeover—fixed value or after map shaft rpm/diesel dose;
- -
- Minimum diesel pilot dose;
- -
- Factor which changes the gas dosage relative to the calculated diesel dosage x;
- -
- Reduction in the diesel dose in proportion to the preset replacement of diesel by CNG;
- -
- Possibility to program any coefficient of substitution of diesel by CNG over the whole field of work-speed-dose of basic fuel diesel;
- -
- Possibility of programming any gas injection start angle in relation to GMP in the whole working field-rotational-speed dose of the basic fuel, i.e., diesel;
- -
- Correction of gas dose in relation to the pressure in the engine intake system and the engine crankshaft speed—the function is necessary for the engine power correction-after switching to diesel/CNG supply;
- -
- Possibility of programming correction of the gas dosage in relation to the pressure in the engine intake system and to the engine crankshaft speed—a function necessary for correcting the engine power after switching to diesel/CNG supply;
- -
- Throttle control using bypass over the entire operating field-speed-base fuel dose diesel—after map or fixed value. This function is designed to reduce the pressure in the intake system by bleeding some of the air into the intake pipe before the charge air coolers.
The following optimization criteria, in order of importance, were adopted during the optimization studies previously carried out for the individual control maps:
- -
- No occurrence of detonation combustion during CNG fueling;
- -
- Maximum diesel substitution by CNG;
- -
- Obtaining the same useful power at a given accelerator pedal position and speed;
- -
- Limitation of the increase in exhaust gas temperature at the turbocharger outlet;
To develop optimum control maps for the diesel/CNG system, control maps had to be determined for the following controller functions:
- -
- Function-> Gas inj. end moment, end of injection angle—depending on engine speed—maximum engine power, and no knocking combustion were taken as criteria for the optimal value of the end of injection angle;
- -
- Diesel/CNG exchange/replacement ratio depending on engine speed with engine load identified as diesel output dose—the maximum value of the aforementioned ratio without the occurrence of knocking combustion was adopted as the criterion for the optimal diesel/CNG exchange/replacement ratio depending on engine speed and dose;
- -
- Correction of the gas dosage in relation to boost pressure—the function allows the generated power to be corrected after switching over to diesel/CNG. The correction allows the gas dosage to be increased or decreased to obtain the same effective power as diesel operation;
- -
- DSC function RPM/DIESEL DOSE bypass throttle opening map as a function of shaft speed and calculated ON dose as a criterion for optimum ON/CNG exchange/replacement ratio, were adopted as functions of crankshaft speed and liquid fuel dose. The maximum value of the abovementioned ratio was adopted without the occurrence of knocking combustion.
These maps were determined prior to the verification tests presented here.
Once the maps were determined for the individual controller parameters, they were entered into the controller software—the controller was considered to be programmed optimally.
3. Results
The obtained results of the tests and calculations are summarized graphically and tabulated as a summary of the results. The following graphs show each component’s emissions and the relative change in emissions. Results are presented for three engine speeds, for each speed the engine was operated at low and high torque. The level of replacement of diesel by CNG shown on the x-axis of the graphs was calculated according to Formula (1).
As a result of our research, the emissions of individual harmful components of the exhaust gas depending on fuel replacement ratio of diesel by CNG were calculated. Based on these results, charts were developed showing the degree of increase or decrease in the emissions of individual exhaust constituents for each degree of substitution of diesel fuel by natural gas.
For the individual correlations of the fuel replacement ratio of diesel by natural gas with the engine load and its rotational speed, abbreviated designations were adopted to represent the given set of operating parameters maintained during the tests. This makes it easier to describe and present the obtained test results. They are summarized in Table 2.
Table 2.
The definitions of research parameters in engine tested phases.
The degree of substitution, for which the results of the emission of unwelcome components of the exhaust gas were lowest, is presented in Table 3. Furthermore, the values of the absolute change (increase or decrease) in the emission of a given component in relation to its emission when running on diesel fuel have been presented using graphs, in the same way as in the previous study by the authors [1], which facilitates a comparison of the results obtained with the results of the concentrations of individual components of the exhaust gases.
Table 3.
The replacement of diesel/CNG setting with the lowest emission of harmful components.
Figure 1 shows the temperature of the engine exhaust gas, while the following diagrams illustrate the emission of unwanted exhaust gases elements and their changes at individual points of engine operation.
Figure 1 shows the effect of the diesel/CNG exchange ratio for six engine operating states with constant engine parameters differing in speed and load on the turbocharger output exhaust gas temperature. The graph illustrating the course of the exhaust gas temperature of the tested engine was already presented in the previous publication of the series [1]; however, it is important for the subsequent analysis of the test results, where the exhaust gas temperature has a significant impact on the course of combustion and the possibility of the occurrence of certain chemical reactions affecting the final emission of individual harmful components from the exhaust gas. The exhaust gas temperatures in the individual runs are directly correlated with the load under which the engine was operating—runs A, C, and E, for which the engine load was lower, also had an exhaust gas temperature slightly lower than in the case of runs B, D, and F, in which the load was more than twice as high. A clear increase in the absolute value of the exhaust gas temperatures in the diesel/CNG replacement coefficient of about 50–60 °C at the final point is visible. The changes in exhaust gas temperature can be seen in both Figure 1 and the following Figure 2, which show the relative values of the temperature changes. In the same way, the two graphs will show the emission levels of the harmful components of the exhaust gas, and the levels of change in emissions of the harmful components of the exhaust gas.
The temperatures in all runs increased with natural gas replacing diesel. According to the theory in [36], in a dual-fuel engine fueled with natural gas and diesel, the exhaust gas temperature should decrease. In the case of the tests carried out, the temperature rises, which is indicative of an insufficient homogeneous mixing of natural gas and air and the problem of post-combustion vaporization in the later phase of combustion due to insufficient areas in which the air required to burn the fuel was not available. Such poor areas are caused by a change in the way that additional fuel is burned, and this was thoroughly described in previous work by the authors [1]. It is also worth noting that the temperature changes are most pronounced at the lowest values of diesel-to-CNG substitution and the highest values of diesel-to-CNG substitution. This may be indicative of the extreme changes that occur in the engine in these cases, as at low replacement values these are changes from single-fuel to dual-fuel operation, and at high replacement values (runs B, C, E), the limit of knocking combustion may already appear, indicating extreme utilization of the amount of CNG that can be used. Figure 2 shows the relative changes in exhaust gas temperature calculated related to the exhaust gas temperature achieved with diesel combustion, according to [37] in reference to the Kelvin temperature scale.
Figure 2 shows the relative temperature changes, which clearly show an upward trend in temperature increments relative to the reference temperature reached, when the engine is fueled with diesel, as the degree of substitution of diesel for natural gas increases. This trend holds for all test runs—there are temporary drops at individual points, but the overall upward trend in temperature rise is visible. Irrespective of the temporary changes in exhaust gas temperature increases, the exhaust gas temperature invariably rises at all operating points relative to the exhaust gas temperatures of the single-fuel-powered engine, with the lowest increase achieved in run E being just over 2%. The highest temperature increase was recorded for test run C where it exceeded 10%. It is worth noting that this highest recorded increase was achieved with the highest degree of substitution achieved in the entire test run of over 90%. This demonstrates the clear, direct influence of the degree of diesel/CNG substitution on the combustion temperature in the combustion chamber.
Figure 3 shows that the CO emissions have a very strong upward trend for one of the engine modes (A) in which the increase already occurs sharply for the first point with the smallest substitution of diesel for natural gas. At this load (low load of 0.5 kNm) and speed (low revs, 1100 rpm), CO emissions were already noticeably higher at the lowest applied CNG dose to the engine. These values deviate significantly from the emission values for the other phases of engine operation, which may be indicative of serious fuel combustion problems in this area of engine operation. High CO emissions may be indicative of incomplete combustion of both diesel and CNG. This problem did not arise for any of the other test runs, and although run F is also characterized by noticeably higher CO emissions, all runs apart from a test run A are characterized by values so small that their cross-characterization misses the point, as the values are within the measurement error. These are operating modes with extremely opposite test assumptions, where for run A the speed and load were set to the lowest of the accepted values, while for run F the load and engine speed was set to the highest. It is therefore difficult to find a correlation between the two runs, but it can certainly be assumed that fuel combustion was incomplete in both cases, and this is a problem for this type of engine, which should meet modern emission standards.
The emission limit for CO in Euro VI is set at 4000 mg/kWh, while for Euro VII it is 1500, or 400 mg/kWh, respectively. This is well illustrated by the fact that for five out of the six test tests carried out, the recorded emissions are clearly below the Euro VI limit, and the more liberal Euro VII scenario. The problem, however, is the emissions for test A where there was a clear deterioration in combustion quality, significantly exceeding any acceptable emissions standard. This mileage (A) would not meet either the newer Euro VII or Euro VI emission standards, nor the Euro V emission standard to which the test engine was factory operated. This demonstrates the significant deterioration in combustion quality in this test run.
One important factor contributing to the increase in CO emissions is the low boost pressure associated with the low amount of exhaust gas generated. The low charge pressure does not favor adequate mixing of air and fuel, which promotes the post-mix in the cylinders with a spatially varying excess air ratio, which is an important factor affecting the creation of both CO and unburned HC.
Although Figure 4 shows that only sample run A appears to show a strong increase in CO emissions with increasing substitution of diesel by CNG, it is clear from Figure 5 that the increases are quite intense for most of the runs that were tested. It can be shown that runs B and D, generated at high engine load, are characterized by a greater increase in CO emissions with low substitution of diesel by CNG and a negligible further increase with higher substitution of diesel by CNG. The waveforms A and F, described in Figure 5 as having the highest CO emissions, after a very strong increase in emissions at low diesel substitution by CNG hardly increase any further when diesel substitution by CNG is increased above a value of 40%. The strongest increases in CO emissions were characterized by runs C and E, in which the strongest increase occurs in the range of diesel substitution by CNG from 30% to 40%. An important difference for these two runs is also that the most intense increases at high levels of diesel substitution by CNG are followed by an even more intense decrease in CO emissions above 50% liquid-fuel substitution. This indicates a significant deterioration in combustion quality at certain values of diesel substitution by CNG in certain areas of engine operation. This may be primarily due to the poor mixing of gaseous fuel with air and a failure to adapt the shape of the combustion chamber to the new engine operating conditions. It is worth noting that the increases for all ratios are high and range from several hundred to several thousand percent. The theoretical assumptions that describe dual-fuel engines present these engines as more efficient, cleaner, and more economical than classic CI engines, so the research carried out here clearly shows that this depends on other factors and will not always be true.
Figure 5 shows that NO emissions decrease in all test runs for most areas of operation, but these are not large decreases, and for some runs, after small decreases, above certain replacement values they start to increase. For runs B and D, the limit is the replacement of diesel by CNG at around 40%, while for run F the limit is already 20% fuel replacement.
NO emissions assimilated to NOX emissions allowed under Euro VI or Euro VII standards exceed the permissible standards many times over. The limit for Euro VI is 460 mg/kWh, while for Euro VII it is 120 and 400 mg/kWh. Within the limits of the Euro VI emission standard, the engine was operating at high levels of diesel substitution by CNG (above 60%) for runs C and E, where the engine load was low, but this was not a condition that allowed NO emissions to be reduced; as for run A, the NO emissions were cumulatively one of the two highest of all runs. The NO emission levels for four of the six test runs would allow the engine to meet the Euro V emission standard for which it was factory prepared. The emission limit for NO and NO2 is 2000 mg/kWh in this standard, and was exceeded in two test runs, A and F, where the emissions were significantly higher; however, it is worth noting that this engine would also not have met the Euro V standard when running on diesel, and the emissions when running on diesel for run A were twice as high as that allowed by the standard. The decreasing trend in NO emissions with increasing substitution of diesel by natural gas is indicative of a trend towards potentially meeting the emissions standard that a depleted engine converted to dual fuel would no longer meet (in the case of mileage A, this could even be achieved with substitutions over 60%). This shows that simply converting a depleted diesel engine to run on CNG/diesel oil bi-fuel does not easily meet the newer emission standards, but may allow emissions of harmful exhaust constituents to return to the emission standard in force at the date of the engine’s manufacture.
Figure 6 shows that increases in NO emissions only occurred in three cases for higher degrees of diesel substitution by CNG. This is the case for runs B, D, and F, and these are runs where the engine was running at a higher load. These increases follow earlier decreases and are small, starting above 40% CNG replacement of diesel. In contrast, test runs A, C, and E, in which the engine was under low load, are characterized by a continuous decrease of an approximately linear nature as the degree level of diesel replacement by natural gas increases.
These results do not show similarities with the temperature of the exhaust gases, local combustions with a higher temperature than the background could raise the average temperatures. This problem was described in previous work by the authors [1]. It is worth noting, however, that at lower engine loads, an increase in the proportion of CNG in the fuel supplied to the engine contributes to lower NO emissions, which may be related to the fact that the combustion temperature is lower the higher the CNG content is, and the combustion run itself is smoother. Increases in mileage B, D, and F where the engine load is high may be precisely due to the less stable combustion course. Decreases in NO concentration, on the other hand, most likely result from a reduced availability of methane used by the engine. There is a reverse correlation where there is an increase in the degree of fuel exchange and a decrease in the value of the excess air coefficient [38].
Figure 7 shows NO2 emissions. The emissions of NO2 for all test run increase steadily with an increasing substitution of diesel for CNG. The emission level for all runs starts from a similar level which corresponds to the emission level for an engine running only on diesel and is roughly similar. It then increases steeply for all runs to stabilize at around 0.3 g/kWh for two runs (B and D) with substitution values greater than 20%, and for the remaining runs the emissions increase further. The strongest increase can be observed, especially for high substitution rates of more than 60% for run A, where emissions exceed 2.5 g/kWh for the highest CNG/diesel substitution rate examined. The other runs at substitution rates above 40% stabilize at around 1 g/kWh, indicating an approximately similar combustion pattern for the three runs. Changes in NO2 emissions are correlated with changes in exhaust gas temperature. An increase in flue gas temperature (Figure 2) results in an increase in NO2 concentration in the flue gas [39].
The NO2 emissions assimilated to the NOX emissions allowed under the Euro VI or Euro VII standards exceed the permissible standards many times over. The limit for Euro VI is 460 mg/kWh, while for Euro VII it is 120 and 400 mg/kWh, and it is clear that these standards can only be met by this engine when running on pure diesel in mono-fuel mode. Once dual fuel is introduced, NO2 emissions increase so strongly that it becomes impossible to meet today’s emission standards. The Euro V NOX emission limit would allow the achieved emission levels for five of the six test runs, in which NO2 emissions did not exceed 1.5 g/kWh and the limit was set at 2000 mg/kWh (NO + NO2). Run A, when substituting close to, and exceeding, 80% natural gas for diesel, exceeded the 2 g/kWh emission level which would disqualify this run from being able to meet the Euro V standard.
Figure 8 shows that the increase in NO2 emissions is most clearly visible, as in Figure 7, which shows that run A, where the increase is the most intense and, with the highest degree of substitution of diesel by CNG, reaches more than 4500% relative to the emission values of the diesel-only engine. All of the sample runs visible in the graph illustrate increases at levels of several hundred to several thousand percent, which is high. However, Figure 8 shows that the correlation between lines B, D, and F is more apparent, where the emission increases are linear with a small incremental increase in emission increases. These waveforms were produced when the engine was operated at a higher load, which may indicate a similar pattern of phenomena for these tests, and it is worth noting that for these waveforms the NO emission increases as higher replacement of diesel fuel with natural gasare growing even stronger. The differences between NO and NO2 emissions may be due to the way in which these substances are formed. This has already been described previously in our study [1], where intensive growth with an initial small degree of replacement was noticed. Authors from [40,41] clearly described the mechanism of NO2 formation in an internal combustion (IC) engine.
NOX emissions represent the sum of NO and NO2 emissions. For both of these components, the opposite correlation was shown to increase as a function of engine load during the tests. Figure 9 shows that the summed emissions of both these components assume a linear character, confirming previous observations regarding this correlation between both components. For runs B, D, and F, in which the engine load is higher, NO emissions increased more intensively than for NO2 in Figure 10, showing that the absolute values of NOX emissions are linear with little variation but take on varying emission values. It is noticeable that the emission values increase slightly in these runs for diesel substitution by CNG exceeding 40%, and this can also be seen in Figure 10. In contrast, for runs A, C, and E, a slight decrease in NOX emissions can be seen as the degree level of diesel substitution by CNG increases, which can also be seen in the runs of Figure 10.
NOX emissions in dual-fuel operations are no longer as fundamentally different from NOX emissions for single-fuel operations as they are for NO2 emissions. This is due to the much higher proportion of total NO in NOx than NO2, the amount of which is proportionally lower.
Figure 10 shows that the changes in the NOX emission values, although clearly visible, are in a very small range of a few tens of percent at most. This is due to the correlation between NO and NO2 emissions described earlier and the fact that NO share of NOX emissions proportion is a much higher than NO2 and changes with increasing substitution of diesel by CNG also reached a maximum of a few tens of percent.
NO2 emissions, compared to NOX emissions, allowed the limit to be exceeded many times over, under Euro VI or Euro VII standards. The limit for Euro VI is 460 mg/kWh, while for Euro VII it is 120 and 400 mg/kWh. It is therefore clear that these emission levels were not achieved during this test. This is not due to the specific operation of the engine in dual-fuel mode per se, as the NOX emission levels in single-fuel and dual-fuel operations were similar, but rather due to the mileage and factory preparation of the engine used in the tests to meet the respective emission standard. This is because the engine had to comply with the Euro V emission standard, in which the NOX emission limit was set at 2 g/kWh [22]. This limit was exceeded for half of the tests prepared for this paper, which may indicate the technical condition of the tested engine.
Figure 11 shows that CH4 emissions, as the degree of substitution of diesel by CNG increases, also increase steadily for all engine loads and speeds. The increase in emissions is directly due to the increase in methane present in the combustion chamber and is produced by not burning all of the fuel supplied to the engine. Emission levels vary from one engine run to the next, and it is characteristic that for two runs (B and D), the emission levels and their variation are virtually identical, and this is the lowest emission level achieved in this study—not exceeding 2 g/kWh. The other trials reached levels of several g/kWh and, in the case of run F, close to 25 g/kWh.
The CH4 emission limit for the Euro VII scenarios is 100 and 50 mg/kWh, respectively; for Euro VI, it was defined at 500 mg/kWh, but only for HDVs, as CH4 emissions for LFVs were included in the total THC emissions and were not independently measured. However, the impact of CH4 on the climate and the increasing use of natural gas in motor vehicles has resulted in CH4 emissions becoming an important test point and being included in today’s emissions standards. In the case of the tests carried out, however, it is clear that the Euro VI emission limits can only be met at very low exchange rates and only in two of the tests, while in the four other tests (A, C, E, and F) CH4 emissions already rise above the limit value allowed by the standard at the lowest exchange rates. The Euro VII standard could not be met for any of the dual-fuel engine operating points; however, the engine running only on diesel met the Euro VII emission standard predicted in the scenarios. The Euro V standard was also not met in any of the test runs. The only operating points at which the Euro V CH4 emission limit was not exceeded concern engine operation in test runs B and D with a maximum of 40% substitution of diesel by CNG.
Figure 12 shows that the changes in CH4 emissions are roughly directly proportional to the amount of methane entering the combustion chamber systematically, but for some runs, the increase is more intense than for others. Runs B and D have the smoothest increase in CH4 emissions, indicating a more complete combustion of the CNG supplied to the engine than for the other runs. The most intensive increase is seen for runs A, E, and F, but it is difficult to find a definite link between these relationships.
To reduce CH4 emissions in dual-fuel engines, it is necessary to use a suitable combustion chamber and to prepare the mixture in such a way that as much fuel as possible is combusted.
Figure 13 shows that ethane emissions are a harmful component of the exhaust gas resulting from incomplete combustion of the fuel supplied to the engine—in this case, mostly from the heavy hydrocarbons contained in diesel fuel. Although its formation from unburned methane is not the main source of emissions (although CNG fuel may also contain some ethane) its emissions increase systematically for most tests as the degree level of substitution of diesel fuel by gaseous fuel increases. For run F, its emissions rise to the highest values, exceeding 2 g/kWh with a fuel change rate of more than 80%. For runs B and D, the increase in emissions was lowest and did not exceed 0.3 g/kWh. It is worth noting that minimal increases in CH4 were recorded for the same runs. This means that for these engine operating areas, both fuels were burned more completely than for the other runs.
The allowable emission of this component is not precisely defined by the standard, as it is included in the total hydrocarbon emissions (THC), or the total hydrocarbon emissions group excluding CH4–NMHC (Non-Methane Hydro Carbons). When comparing the C2H4 emission results obtained with this group, the emission limit values should be set at 50 and 25 mg/kWh for the Euro VII and 160 mg/kWh for the Euro VI emission standard scenarios, respectively. This engine can only comply with Euro VI with the mono-fuel operation because when a second fuel is added to the combustion chamber, the C2H6 emissions already increase sufficiently with small additions of C2H6 to not exceed the emission limits allowed by the current standards. Even the Euro V standard, for which the engine is homologized, could only be met with two test runs (B and D). In the other runs, only test run F met the Euro V emission standard for most of the operating points tested, exceeding it only at the maximum degree of substitution achieved in this test run.
Figure 14 shows the increases in C2H6 emissions range from several hundred to several thousand percent, which is a strong increase. It is worth noting, however, that for some runs the value of C2H6 emissions, after an initial increase, then decreases, which may be indicative of the inadequacy of both the combustion chamber shape and the matching of the correct ratio of oil used to natural gas supplied, as there may be areas inside the combustion chamber in which the amount of oxygen available for the combustion process is less than necessary for the proper combustion of the injected liquid fuel, leading to the formation of unburned hydrocarbons, such as C2H6.
The waveforms in which decreases in C2H6 emissions are observed as the amount of diesel replaced by natural gas increases are waveforms C and F, which were not correlated with each other under the research assumptions. The lowest increases were observed for run B, but it is difficult to find a noticeable correlation with the individual test samples.
NMOC (Non-Methane Organic Compounds) emissions are a key parameter characterizing the quantity of unburned hydrocarbons in the exhaust gas, excluding methane emissions, which would be overwhelmed by the use of a gaseous fuel, such as CNG. Figure 15 shows the emission of it. From the NMOC values it is possible to read, above all, the number of unburned particles of the base fuel, diesel. The main component of the measured NMOC emission values was propane and the heavier hydrocarbons that are produced by the incomplete combustion of diesel fuel. Propane emissions will not be presented directly, as they are included in NMOC emissions as one of the key components, and the other hydrocarbons included in NMOC emissions are presented in the other graphs of this article. NMOC emissions increase as the replacement rate of diesel to CNG increases. Emissions of this group of compounds are related to unburned compounds contained in diesel fuel. Natural gas may contain traces of propane and other heavy hydrocarbons, but the amount is negligible and depends on the chemical composition of the CNG used. Its emission is mainly related with uncombusted, to all the diesel fuel. The level of emissions varies widely from trial to trial, but in all cases increases with increasing substitution of diesel by CNG. For runs B and D, emissions ranged from 0.1 g/kWh to 0.6 g/kWh. In runs C, E, and F, emissions were less than 2 g/kWh, while in run F, emissions were already noticeably higher than in the previous five runs, with emissions reaching over 3 g/kWh. It is worth noting that NMOC emissions in run F were significantly higher than in the other tests, even when running on mono-fuel with diesel only, at 0.4 g/kWh, which is higher than the NMOC emissions from low levels of diesel substitution with natural gas in runs B and D.
The emission limit for NMOCs is not strictly defined in the emission standards, but they belong to an emission group referred to as non-methane hydrocarbons(NMHC) in which there are no methane emissions included. Their permissible emissions are also not defined for modern emission standards, so in order to compare the emission results achieved, reference can only be made to the NMHC emission limits contained in Euro VI and Euro VII of 160, 50, and 25 mg/kWh, respectively. These limits, corresponding to Euro VI, could only be met with single-fuel diesel for test runs B, C, D, and F. In the case of two runs (B and D), the engine would have met the Euro V emission standard, to which it was factory-adapted, only because tests were not continued for higher degrees of diesel substitution with natural gas. The other runs only met the Euro V standard with the mono-fuel operation. The Euro VII standard predicted by scenarios A and B would not have been met by the engine at any of the test points.
Figure 16 shows the trends in NMOC emission changes for all samples and are high, ranging from a few hundred to tens to over a thousand percent. Three groups of emission increases can be distinguished. The smallest increases can be observed for samples A and B, while the largest is for sample C. Runs A and B are jointly characterized by engine operation at the lowest of the tested speeds. The other runs are no longer correlated with each other, and it is difficult to find a common characteristic causing such increases in emissions.
The increase in NMOC emissions is due, as in the case of C2H6 increases, to unburned hydrocarbons remaining in the combustion chamber after combustion from the high reactive fuel injected into the combustion chamber. However, the increases in NMOCs are even higher than those of C2H6. This may support the thesis that there is too little oxygen available in the combustion chamber where natural gas is located where air should be the primary air in the engine. The combustion of organic hydrocarbon compounds requires more oxygen AND energy than CH4 and C2H6 alone, which therefore may result in the much higher increase in emissions of this group of substances in the exhaust gases. Another reason is that C3H8, which is the main component of measured NMOC emissions, is a more complex hydrocarbon than C2H4, so there is more of it in diesel fuel, whose composition is based primarily on heavy hydrocarbons.
Ethene–C2H4-is an unsaturated hydrocarbon, it is the simplest alkene—an organic chemical compound. Its emissions are related to the chemical transformations taking place in the combustion chamber. Figure 17 shows the emission of it. Ethane emissions increase as the substitution of diesel fuel for CNG increases, and their pattern is similar to that of propane emissions. During the B and D test runs, emissions were lowest—virtually the same as for propane emissions. These emissions did not exceed 0.05 g/kWh. Emissions for runs C and E increased more and reached almost 0.2 g/kWh at extreme operating points. Sample runs A and F grew significantly faster and reached the highest values—in the case of run A, over 0.5 g/kWh.
Emission limit values for ethene are not specified directly in the standards, but for hydrocarbon substances that are not methane or ethane the emission limit value can be compared to the NMNEHC emission limit value. For the standards currently in use, the NMHC emission limit value is known to be 160 mg/kWh for Euro VI, and 50 mg/kWh and 25 mg/kWh, respectively, for both Euro VII scenarios. The emission limit values for Euro VII scenario A and Euro VI are higher than those for B and D runs. The Euro VI emission limit is also higher than the maximum emission values recorded in sample run C. However, the remaining runs exceed the Euro VI and Euro VII emission limits. This indicates that the emissions of this harmful exhaust constituent are too high for the conversion of this engine to be considered sufficient to improve the quality of the harmful exhaust constituent emissions. It should also be remembered that the NMHC emission limit applies to emissions of all hydrocarbons in the exhaust gas except methane, and the ethene described here is only one of many that were emitted by this engine. In the case of run A, for the highest values of diesel substitution by CNG, even the Euro V standard for which the engine was factory prepared was exceeded at the operating points, but it should be remembered that an exhaust gas catalytic converter was not used in the tests.
Figure 18 shows the ethene emission changes. The variations in ethene emissions are highly variable, ranging from tens to many thousands of percent. Such large variations are indicative of widely varying combustion chamber conditions at different points in the engine’s operation. Low oxygen availability in the combustion chamber can result in combustion residues remaining in the form of hydrocarbon bonds from unburned fuels—both diesel and CNG. Alkenes can also appear in exhaust gas as a result of chemical transformations occurring during the combustion of both fuels. The course of these transformations depends on many factors, the occurrence of which is difficult to assess based on the results obtained. However, when analyzing the results for ethene, it should be taken into account that the high variability in emissions is due to the fact that ethene emissions are very low when running on diesel.
However, in some runs (C and E), ethene emissions in the highest fuel changeover ranges start to decrease as the diesel-to-CNG changeover ratio increases, and in the case of run C, to an even level lower than at the previous two operating points. This may indicate not so much an improvement in the conditions for efficient combustion of the fuels used, but the non-existence of conditions for the conversion of more complex hydrocarbons into simpler hydrocarbons, such as ethene, while the systematic increase in the growth of ethene emissions indicates a deterioration in the quality of combustion and the entry into the exhaust gas of increasing amounts of unburned simple hydrocarbons.
Figure 19 shows that ammonia emissions decreased with increasing substitution of diesel by CNG for all test runs. For the four runs (C, D, E, and F), the absolute value of ammonia emissions did not change noticeably, but for emissions in trials A and B, the changes were noticeably higher, reaching 0.3 g/kWh absolute difference. The maximum emission values always occurred when the engine was mono fueled with diesel only, and their reduction through the use of natural gas is an interesting phenomenon that also coincides with the observations presented in the study in [1]. Ammonia emissions usually result from engine operation on stoichiometric or close to stoichiometric parameters of combustion [42]. In the case of our study, the opposite phenomenon occurs here, in which ammonia emissions decrease as the replacement of diesel by CNG increases. It is important to note that ammonia emissions are highest in runs A and B with the lowest engine speed. It is therefore possible to assume a thesis in which an increase in engine load by increasing engine speed induces a decrease in ammonia emissions.
The emission standards used today assume an acceptable limit for ammonia emissions. In the case of scenarios prepared for Euro VII, they assume a maximum permissible emission value of 20 mg/kWh and 10 mg/kWh. For Euro VI, it is around 40 mg/kWh (approximate, calculated value). It is therefore easy to see that, in the case of the engine tests, out of the six tests carried out, only four would meet the potentially acceptable Euro VI emission standards, while Euro VII in the scenario allowing maximum emissions of 10 mg/kWh would only be met by half of the tests (C, D, and E). The Euro V standard did not include a reduction in NH3 emissions.
Figure 20 shows emission changes of ammonia, on which all test trials showed strong decreases in ammonia emissions with increasing substitution of diesel for natural gas. In the case of trials C, E, and F, there are isolated increases in emissions for the operating points preceding the operating point to which we refer. These increases are not high and are rather due to measurement uncertainties and changes associated with changes in emissions of other combustion substances and the average trend for all test runs.
This is because ammonia emissions are largely due to the occurrence of other substances in the combustion process, which in further chemical transformations result in the formation of ammonia and its persistence in the final flue gas composition. Its emission is therefore highly dependent on the emission of other substances, as described in the study [1]. To understand the processes that took place in the engine in this case, it would be important to find out about hydrogen and water emissions, which requires further study.
Figure 21 shows that formaldehyde emissions increase with increasing substitution of diesel by CNG. A correlation can be seen between formaldehyde emissions and those of other substances, the emission curves of which follow a very similar pattern. As in the case of hydrocarbon emissions, runs B and D increase slowly and reach low values of no more than 0.1 g/kWh, runs C and E reach higher values of no more than 0.5 g/kWh, while runs A and F reach the highest increases of up to 1.4 g/kWh. A correlation can be seen here with the emissions of hydrocarbons, such as ethene and butane.
Formaldehyde is formed during the incomplete combustion of substances containing the element carbon. Emissions are favored by elevated temperatures and high humidity. In the reaction of the oxidation process, formaldehyde is formed where the flame temperature has been reduced below 1000 K that could appear at the end of the combustion process or in the combustion chamber wall areas. This is when CH2O as a combustion intermediate does not have sufficient energy to be converted into CO2. In gas engines, several sources can be assumed to be responsible for the formation of formaldehyde [43]. The first is the inhomogeneity of the fuel–air mixture in the engine cylinder. This can result in the formation of zones with a λ-factor causing under-firing of the gaseous fuel and the formation of formaldehyde molecules. The second source is the walls of the combustion chamber, which reduce the combustion temperature in their vicinity by receiving heat. A similar effect is obtained in the case of the volumes between the piston and cylinder walls (crevice effect) where, due to the small distance between these surfaces, the flame is extinguished. Formaldehyde emissions are also significantly affected by the increase in temperature and pressure during the compression stroke, which can reach values that favor CH2O formation.
Modern emission standards for harmful exhaust components do not limit the emission limits for formaldehyde. It can be compared similarly to how butane emissions were compared to the NMHC limit value. Somewhat similar to that case, only two test trials would meet any modern emission standards, and, in this case, they would only meet the Euro VI standard. For two of the six tests (A and F), not even the Euro V standard to which the test engine was adapted would be met; however, the tests did not take into account the catalytic reactor.
Figure 12 shows changes in formaldehyde emissions range from several hundred to several thousand percent. With an increase in the exchange of diesel to CNG, emissions increase in all runs, and they increase for most runs, except for runs C and E in which, for higher exchange values (from 70% diesel to CNG exchange and above), emission increases are already smaller than at previous engine operating points. The smallest changes were found for test runs A and B, i.e., for tests in which the engine speed was lowest. The largest emission changes occurred in runs C and E, and average changes (reaching 6000%) in D and F.
Summary of the Results
All emissions measured in test trials where diesel is substituted to any extent by CNG have changed relative to the single-fuel diesel-only engine. Some of these changes were large and had an impact on the potential failure of the dual-fuel engine to meet modern emission standards, and in some cases, the emissions changed to an extent that did not change the range of permissible emission standards under which the engine operated. A summary of the most significant changes and meeting acceptable emission standards is provided below.
- Summarizing all the above, the following analysis of the obtained results can be carried out: Studies that have been carried out indicate that emissions of certain harmful exhaust components must be reduced. Their emissions have increased too much, and the values must be corrected if the engine is to be used today.
- CO emissions at one run are much higher than the other runs.
- NOX emissions, including both NO and NO2 in some test runs, increase with the degree of diesel replacement with CNG, and decrease in others.
The overall emissions of this substance did not change significantly, affecting the ability of the test engine to meet modern emission standards. From the theoretical assumptions [44,45,46], NOX emissions should be decreasing—however, this is only the advantage of the RCCI engine. At the same time, these emissions have not increased significantly.
In the analysis [1], a table summarizing the results was presented. The same operation but with the lowest emission level was carried out and is shown in Table 3 below:
The results presented in Table 3 clearly show in which areas the engine converted to bi-fuel did not reduce emissions of harmful exhaust components. Evident deficiencies in any emission reductions for certain substances include CO, NO2, CH4, C2H4, and CH2O. Decreases recorded only for post-single runs (a correlation with the high engine speed used is noticeable here) were recorded for C2H6 for a test run E. For two substances and one substance group (NO + NO2), decreases were recorded for all test runs in which the lowest emissions were most often (more than 2/3 of cases) achieved at higher (more than 50%) substitution rates. These substances were NO, NH3, and a group of compounds: NOX. In the Section 4, a discussion is held on the results obtained as seen in Table 3.
4. Discussion
The emission standards that the motor industry is trying to introduce today are very strict. To meet them, engines that have already been manufactured and adapted to meet the older emission standards are trying to use procedures such as the use of alternative fuels, or the addition of a second fuel to an existing fuel system. Such conversions are becoming increasingly popular, but as can be seen from the research carried out for this article, simply replacing part of the high cetane fuel with CNG does not allow the vehicle to meet the newer emission standards.
The appearance of higher unburned hydrocarbon emissions proved to be a major problem. This was to be expected, due to the unpreparedness of the combustion chamber for the stoichiometric gaseous fuel supplied and the lack of a catalytic reactor in the system from which the exhaust gases were drawn. As their emissions increase, they can be dealt with by carrying out ground-truthing changes to the design of the combustion chamber and the way fuel is delivered to the combustion chamber. Hydrocarbon emissions are also efficiently corrected by a catalytic reactor, which can post-combust unburned hydrocarbons. A more significant problem in meeting today’s emission standards is nitrogen oxide emissions. The scenarios envisaged for Euro VII are very restrictive in this respect, as illustrated by the graph below showing the average contemporary NOX emission levels in the RDE test trials as a function of the speed of the vehicle under test and the limits to be imposed in the latest standard (red lines).
As can be seen, Figure 23, based on work from [47] shows that the anticipated limitations of the Euro VII standard are very difficult to meet, even for contemporary engines. Several studies [48,49,50,51] predict the possibility of meeting the new standards through the use of dual-fuel natural gas in engines. In the case of the engine used in this study, no noticeable changes in NOX emissions could be made. This indicates, as in the case of the increase in hydrocarbon emissions, a mismatch between the combustion chamber and the conditions required for the efficient combustion of natural gas.
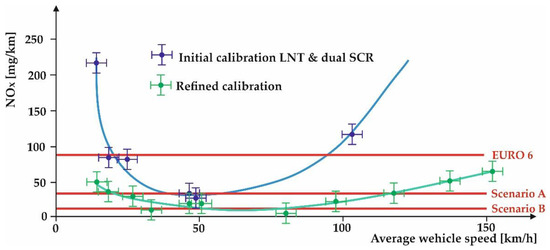
Figure 23.
Predicted reductions in toxic exhaust emissions according to alternative scenarios projected for Euro 7, based on charts from [47].
On the other hand, it may also indicate a real problem with the ability to reduce emissions of this substance, which may negate the possibility of reducing nitrogen oxide emissions with this method. However, this requires, in the authors’ opinion, more tests preferably using a different engine and types of gas installations adapted for the engine under study.
The summary quoted in Table 3 clearly shows the deterioration of engine performance in the area of harmful hydrocarbon emissions, which arise in the case of incomplete combustion of the used fuels. This issue is most easily addressed by the use of a catalytic reactor in the exhaust system to post-combust these substances, of which the largest increases in emissions are related to methane. The remaining hydrocarbon compounds appearing in the exhaust gas are indicative of a deterioration in the quality of combustion processes, which points to the need to modify the shape of the combustion chamber in the future. Adapting the combustion chamber to run on two fuels will be necessary to reduce unburned hydrocarbon emissions without the use of a catalytic reactor and thereby improve the thermal efficiency of this engine. Additional evidence of the deterioration in combustion quality is the increase in CO emissions for all test runs. The appearance of this substance is mainly due to insufficient oxygen in the areas of formation. Reduction of its emissions can be achieved by both methods described for hydrocarbons.
The reduction in NOX emissions is linked to a reduction in NO emissions, which account for a larger proportion of this group of substances than NO2. The decrease in NO emissions is in line with the most common assertions in the scientific literature about NOX emission decreases in dual-fuel engines. Usually, detailed data on independent NO and NO2 emissions are not cited, so the commonly found decreases in NOX emissions in dual-fuel engines may translate mainly into decreases in NO emissions, and the focus should be on the phenomena of the simultaneous increase in NO2 emissions. Ammonia emissions, which were also able to be reduced in all test runs, are due to the appearance in the combustion chamber of other substances whose presence has a significant effect on the formation of ammonia, formed by a series of chemical transformations. The reduction in NOX emissions can also affect ammonia emissions, given that its natural reactants, nitrogen oxides, absorb fewer ammonia molecules, which naturally decompose NOX molecules into water and oxygen.
5. Conclusions
- The tests carried out to make it possible to state unequivocally that the engine modification carried out did not make it possible to limit the emission of all harmful components of exhaust gases whose emission is limited by contemporary EU regulations.
- The emission of hydrocarbons has increased in such a way as to make it impossible to comply with contemporary exhaust emission standards. Their emission is related to the incomplete combustion of fuels supplied to the combustion chamber, and the largest increases relate to methane emissions, which is the main and basic component of CNG fuel.
- Emissions of nitrogen oxides did not change with the increase in the substitution of diesel for CNG in a way that significantly affects the engine’s ability to meet modern emission standards. This is evidenced by the similar rate and temperature of the combustion process for both mono- and bi-fuel fueling, and the change in the amount of CNG used does not significantly affect emissions.
- NOX emissions did not change significantly as the degree of diesel-to-CNG replacement increased. This indicates that there was no significant change in the combustion of fuels in the engine under study where the combustion temperature should have decreased, resulting in lower NOX emissions.
- The failure to adapt the combustion chamber to burn gaseous fuel in a fuel–air mixture close to stoichiometric results in increased hydrocarbon emissions. Emissions of all hydrocarbon compounds in most test runs increased with the degree level of substitution of diesel by CNG, indicating an insufficient availability of oxidant in the combustion process, and therefore insufficient mixing of fuel and air, and the existence of areas in the combustion chamber that are too rich and potentially too poor.
- Simple conversion of an engine to so-called “gas-diesel” does not make it possible to reduce the emission of harmful components by the engine to a level that would allow the engine to meet the higher emission levels envisaged in the production of a bi-fuel converted engine.
The way for a dual-fuel engine fueled with a high reactive fuel, such as diesel, and low reactive fuel, such as CNG, to meet higher exhaust emission standards than those for which the engine was designed is through greater intervention in both the design of the engine combustion chamber and the timing gear main construction and the operation of the engine’s power supply system, which should be carried out as part of further research work. It may also be necessary to change the exhaust after-treatment system used, which was expected to work more effectively with different concentrations of harmful exhaust components than under dual-fuel operation.
The authors’ expertise in this area allows them to set out clear guidelines for the way forward on the topic:
- -
- Carry out tests in which additional flue gas components such as H2, H2O, SO2, N2O, N2O5, and other NOY- and NOZ-forming substances will be measured.
- -
- Check the emissions of the various components of the exhaust gas after being routed through the original catalytic reactor of the engine under test.
- -
- Repeat the tests carried out, as the determination of emission values with a single measurement is an unreliable source of information and, when comparing changes in emission values, it is important to establish a trend based on a number of the same tests in order to identify differences and similarities indicating whether a result has been achieved.
- -
- Compare the results obtained when using a different generation of gas system on the same engine
- -
- Carry out a full modification of the engine, including the rebuilding of the combustion chamber and valve train in order to compare emission test results on the engine thus modified.
Author Contributions
Conceptualization, M.K. and G.S.; methodology, M.K.; software, M.K.; validation, M.K.; formal analysis, M.K.; investigation, M.K.; resources, M.K.; data curation, M.K.; writing—original draft preparation, G.S.; writing—review and editing, G.S.; visualization, M.K.; supervision, M.K.; project administration, M.K.; funding acquisition, M.K. All authors have read and agreed to the published version of the manuscript.
Funding
This work was financed by the Military University of Technology under research project UGB 758/2022.
Data Availability Statement
Data are contained within the article.
Conflicts of Interest
The authors declare no conflict of interest.
References
- Karczewski, M.; Szamrej, G.; Chojnowski, J. Experimental Assessment of the Impact of Replacing Diesel Fuel with CNG on the Concentration of Harmful Substances in Exhaust Gases in a Dual Fuel Diesel Engine. Energies 2022, 15, 4563. [Google Scholar] [CrossRef]
- Reitz, R.D.; Duraisamy, G.D. Review of high efficiency and clean reactivity controlled compression ignition (RCCI) combustion in internal combustion engines. Prog. Energy Combust. Sci. 2015, 46, 12–71. [Google Scholar] [CrossRef]
- Chojnowski, J.; Karczewski, M.; Szamrej, G. The phenomenon of knocking combustion and the impact on the fuel exchange and the output parameters of the diesel engine operating in the dual-fuel mode (Diesel-CNG). NAŠE MORE 2021, 17, 30. [Google Scholar]
- Karim, G.A. Dual-Fuel Diesel Engines; CRC Press: New York, NY, USA, 2015. [Google Scholar]
- Li, Y.; Jia, M.; Xu, L.; Bai, X.-S. Multiple-Objective Optimization of Methanol/Diesel Dual-Fuel Engine at Low Loads: A Comparison of Reactivity Controlled Compression Ignition (RCCI) and Direct Dual Fuel Stratification (DDFS) Strategies. Fuel 2020, 262, 116673. [Google Scholar] [CrossRef]
- Available online: https://www.ac.com.pl/products-autogas/controllers-lpg-cng-diesel/stag-diesel/338/ (accessed on 20 October 2022).
- Available online: https://www.europegas.pl/en/eg-injecto-duo/ (accessed on 21 October 2022).
- Available online: https://polandasia.com/cz%C5%82onkostwo/nasi-partnerzy/dual-fuel-systems/ (accessed on 21 October 2022).
- Available online: https://fuelfusion.pl/firma/ (accessed on 21 October 2022).
- Al-Saadi, A.A.A.; Bin Aris, I. CNG-diesel dual fuel engine: A review on emissions and alternative fuels. In Proceedings of the 2015 10th Asian Control Conference (ASCC), Kota Kinabalu, Malaysia, 31 May–3 June 2015; pp. 1–4. [Google Scholar] [CrossRef]
- Smallwood, J.S. Investigation of the Dual-Fuel Conversion of a Direct Injection Diesel Engine. Master’s Thesis, Department of Mechanical and Aerospace Engineering, Morgantown, WV, USA, 2013; p. 3410. [Google Scholar]
- Andrych-Zalewska, M.; Chlopek, Z.; Merkisz, J.; Pielecha, J. Comparison of Gasoline Engine Exhaust Emissions of a Passenger Car through the WLTC and RDE Type Approval Tests. Energies 2022, 15, 8157. [Google Scholar] [CrossRef]
- Stelmasiak, Z.; Larisch, J.; Pietras, D. Wpływ dodatku gazu ziemnego na wybrane parametry pracy silnika Fiat 1.3 MultiJet zasilanego dwupaliwowo. Combust. Engines 2015, 54, 672–682. [Google Scholar]
- Jamrozik, A.; Tutak, W.; Grab-Rogaliński, K. An Experimental Study on the Performance and Emission of the diesel/CNG Dual-Fuel Combustion Mode in a Stationary CI Engine. Energies 2019, 12, 3857. [Google Scholar] [CrossRef]
- Hanna, R.N.; Mustafa, A.M.; Zefaan, H.; Sameh, M.M. Aftermarket exhaust gas emissions analysis of a direct injection CNG-Diesel dual fuel engine. Int. J. Curr. Res. 2016, 8, 29321–29329. [Google Scholar]
- Singh, R.; Maji, S. Performance and exhaust gas emissions analysis of direct injection cng-diesel dual fuel engine. Int. J. Eng. Sci. Technol. 2012, 4, 833–846. [Google Scholar]
- Reitz, R.D.; Foster, D.; Ghandhi, J.; Rothamer, D.; Rutland, C.; Trujillo, M.; Sanders, S. Optimization of Advanced Diesel Engine Combustion Strategies. DOE Merit Review, ACE020. 2011. Available online: https://www.energy.gov/sites/prod/files/2014/03/f10/ace020_reitz_2012_o.pdf (accessed on 24 October 2022).
- Reitz, R. Fuel Reactivity Controlled Compression Ignition (RCCI)—A Practical Path to High-Efficiency, Ultra-Low Emission. Int. J. Engine Res. 2011, 12, 209–226. [Google Scholar]
- Dziubak, T. Experimental Studies of Dust Suction Irregularity from Multi-Cyclone Dust Collector of Two-Stage Air Filter. Energies 2021, 14, 3577. [Google Scholar] [CrossRef]
- Dziubak, T.; Bąkała, L. Computational and Experimental Analysis of Axial Flow Cyclone Used for Intake Air Filtration in Internal Combustion Engines. Energies 2021, 14, 2285. [Google Scholar] [CrossRef]
- Zheng, J.; Wang, J.; Zhao, Z.; Wang, D.; Huang, Z. Effect of equivalence ratio on combustion and emissions of a dual-fuel natural gas engine ignited with diesel. Appl. Therm. Eng. 2019, 146, 738–751. [Google Scholar] [CrossRef]
- Pham, V.C.; Choi, J.-H.; Rho, B.-S.; Kim, J.-S.; Park, K.; Park, S.-K.; Le, V.V.; Lee, W.-J. A Numerical Study on the Combustion Process and Emission Characteristics of a Natural Gas-Diesel Dual-Fuel Marine Engine at Full Load. Energies 2021, 14, 1342. [Google Scholar] [CrossRef]
- Benajes, J.; García, A.; Monsalve-Serrano, J.; Boronat, V. Dual-Fuel Combustion for Future Clean and Efficient Compression Ignition Engines. Appl. Sci. 2017, 7, 36. [Google Scholar] [CrossRef]
- Regulamin EKG ONZ nr 49 Europejskiej Komisji Gospodarczej Organizacji Narodów Zjednoczonych (EKG/ONZ). Available online: https://eur-lex.europa.eu/LexUriServ/LexUriServ.do?uri=OJ:L:2011:180:0053:0069:PL:PDF (accessed on 15 October 2022).
- Kuiken, K. Book I: Principles. In Gas- and Dual-Fuel Engines for Ship Propulsion, Power Plants, and Cogeneration; Target Global Energy Training: Onnen, The Netherlands, 2016; pp. 1–488. [Google Scholar]
- Karczewski, M.; Chojnowski, J.; Szamrej, G. A Review of Low-CO2 Emission Fuels for a Dual-Fuel RCCI Engine. Energies 2021, 14, 5067. [Google Scholar] [CrossRef]
- DieselNet Emission Standards: EU: Cars and Light Trucks. Available online: https://dieselnet.com/standards/eu/ld.php (accessed on 30 October 2022).
- DieselNet Emission Standards: EU: Heavy-Duty Truck and Bus Engines. Available online: https://dieselnet.com/standards/eu/hd.php (accessed on 30 October 2022).
- Preliminary Findings on Possible Euro 7 Emission Limits for LD and HD Vehicles. Available online: https://circabc.europa.eu/sd/a/fdd70a2d-b50a-4d0b-a92a-e64d41d0e947/CLOVE%20test%20limits%20AGVES%202020-10-27%20final%20vs2.pdf (accessed on 30 October 2021).
- DieselNet Emission Standards: EU World Harmonized Transient Cycle (WHTC). Available online: https://dieselnet.com/standards/cycles/whtc.php (accessed on 30 October 2021).
- Mulholland, E.; Miller, J.; Bernard, Y.; Lee, K.; Rodríguez, F. The role of NOx emission reductions in Euro 7/VII vehicle emission standards to reduce adverse health impacts in the EU27 through 2050. Transp. Eng. 2022, 9, 100133. [Google Scholar] [CrossRef]
- Karczewski, M.; Wieczorek, M. Assessment of the Impact of Applying a Non-Factory Dual-Fuel (Diesel/Natural Gas) Installation on the Traction Properties and Emissions of Selected Exhaust Components of a Road Semi-Trailer Truck Unit. Energies 2021, 14, 8001. [Google Scholar] [CrossRef]
- Wajand, J.A. Silniki o Zapłonie Samoczynnym; WNT: Warsaw, Poland, 1988; pp. 123–130. [Google Scholar]
- Norm PN-ISO 15550:2009; Reciprocating Internal Combustion Engines—Determination and Method of Measuring Engine Power—General Requirements. Polski Komitet Normalizacyjny PKN: Warsaw, Poland, 2009.
- Norma PN-EN ISO 8178-1; Pomiar Emisji Spalin dla Tłokowych Silników Spalinowych. Polski Komitet Normalizacyjny PKN: Warsaw, Poland, 1999.
- Kokjohn, S.L.; Hanson, R.M.; Splitter, D.A.; Reitz, R.D. Fuel reactivity-controlled compression ignition (RCCI): A pathway to controlled high-efficiency clean combustion. Int. J. Engine Res. 2011, 12, 209–226. [Google Scholar] [CrossRef]
- Wiśniewski, S. Pomiary Temperatury w Badaniach Silników i Urządzeń Cieplnych; WNT: Warsaw, Poland, 1983. [Google Scholar]
- Muscala, W. Tworzenie i Destrukcja Tlenków Azotu w Procesach Energetycznego Spalania Paliw. Available online: https://docplayer.pl/5623726-Tworzenie-i-destrukcja-tlenkow-azotu-w-procesach-energetycznego-spalania-paliw.html (accessed on 28 October 2022).
- Heywood, J.B. Internal Combustion Engine Fundamentals, 2nd ed.; McGraw-Hill Education: New York, NY, USA, 2018. [Google Scholar]
- Nova, I.; Tronconi, E. UREA SCR Technology for deNOx after Treatment of Diesel Exhausts; Springer Science+Buisness Media: New York, NY, USA, 2014. [Google Scholar]
- Kowalewicz, A. Podstawy Procesów Spalania; WNT: Warsaw, Poland, 2000; pp. 248–268. [Google Scholar]
- Żółtowski, A.; Gis, W. Ammonia Emissions in SI Engines Fueled with LPG. Energies 2021, 14, 691. [Google Scholar] [CrossRef]
- Mitchell, C.E.; Olsen, D.B. Formaldehyde Formation in Large Bore Natural Gas Engines Part 1: Formation Mechanisms. J. Eng. Gas Turbines Power 2000, 122, 603–610. [Google Scholar] [CrossRef]
- Kuiken, K. Gas- and Dual-Fuel Engines for Ship Propulsion, Power Plants and Cogeneration. Book II: Engine Systems and Environment; Target Global Energy Training: Onnen, The Netherlands, 2016; pp. 1–544. [Google Scholar]
- Wei, L.; Geng, P. A Review on natural gas/diesel dual fuel combustion, emissions, and performance. Fuel Process. Technol. 2016, 142, 264–278. [Google Scholar] [CrossRef]
- Engine Management Systems for CPBC and RCCI Engines. Available online: https://www.arenared.nl/cpbc+~+rcci (accessed on 30 October 2021).
- DieselNet ACEA releases Euro 7/VII Position Paper. Available online: https://dieselnet.com/news/2020/12acea.php (accessed on 30 October 2021).
- Adzuan, M.A.; Yusop, A.F. A review of dual fuel RCCI engine fundamental and effect on the performance, combustion and emission characteristic. AIP Conf. Proc. 2022, 2465, 040001. [Google Scholar] [CrossRef]
- García, A.; Monsalve-Serrano, J.; Villalta, D.; Guzmán-Mendoza, M. Methanol and OMEx as fuel candidates to fulfill the potential EURO VII emissions regulation under dual-mode dual-fuel combustion. Fuel 2020, 287, 119548. [Google Scholar] [CrossRef]
- Garcia, A.; Monsalve-Serrano, J.; Villalta, D.; Guzmán Mendoza, M. “OMEx Fuel and RCCI Combustion to Reach Engine-Out Emissions Beyond the Current EURO VI Legislation,” SAE Technical Paper 2021-24-0043, 2021. Available online: https://doi.org/10.4271/2021-24-0043 (accessed on 21 October 2022).
- Dahodwala, M.; Joshi, S.; Koehler, E.; Franke, M.; Tomazic, D.; Naber, J. Investigation of Diesel-CNG RCCI Combustion at Multiple Engine Operating Conditions; SAE International: Warrendale, PA, USA, 2020. [Google Scholar]


Disclaimer/Publisher’s Note: The statements, opinions and data contained in all publications are solely those of the individual author(s) and contributor(s) and not of MDPI and/or the editor(s). MDPI and/or the editor(s) disclaim responsibility for any injury to people or property resulting from any ideas, methods, instructions or products referred to in the content. |
© 2023 by the authors. Licensee MDPI, Basel, Switzerland. This article is an open access article distributed under the terms and conditions of the Creative Commons Attribution (CC BY) license (https://creativecommons.org/licenses/by/4.0/).