Article

Technical Analysis of a Large-Scale Solar Updraft Tower Power Plant

by
Varun Pratap Singh
1,* and
Gaurav Dwivedi
2,*
1
Department of Mechanical Engineering, School of Engineering, University of Petroleum and Energy Studies, Energy Acres, Bidholi, Dehradun 248007, Uttarakhand, India
2
Energy Centre, Maulana Azad National Institute of Technology, Bhopal 462003, Madhya Pradesh, India
*
Authors to whom correspondence should be addressed.
Energies 2023, 16(1), 494; https://doi.org/10.3390/en16010494
Submission received: 13 November 2022 / Revised: 20 December 2022 / Accepted: 28 December 2022 / Published: 2 January 2023
(This article belongs to the Special Issue Latest Research in Renewable Energy for Sustainable Development)

Abstract

:
This study investigates the possibility of applying a large-scale solar updraft tower power plant in India with local ground conditions as an environmentally friendly and economically viable energy source. A reference model Solar Updraft Tower Power Plant (SUTPP) is constructed to examine the influence of the most prominent plant dimensional parameters, including collector radius (RCollector), tower height (HTower), and tower radius (RTower) with dimensional limits and intervals on the power output of the SUTPP. Udat, Rajasthan, India, is used as a reference location for meteorological conditions to evaluate SUTPP power output equations for a ranging power output, with position coordinates of 27°35′ and 72°43′. Multiple simulations for the objective function are carried out, and the outcomes are compared to the optimized dimensions of each set of plants. The model examines the effect of variation in ambient, plant geometry, and material conditions on power output and analyzes efficiency and power output for optimizing configuration. There exists no definitive approach to determining the proper correlation between the geometrical parameters of a SUTPP with optimized power output. For a fixed power output, the tower radius (RTower) serves as the most influencing dimensional parameter in SUTPP performance. A change in tower height (HTower) has a detrimental impact on SUTPP output and performance. An initial increase in collector radius (RCollector) has a positive influence on SUTPP performance; however, this effect reduces as collector radius (RCollector) increases.

1. Introduction

The utilization of solar energy for thermal applications, including lower, medium, and higher temperature ranges, covers a large segment of solar-energy-based technologies [1]. Solar air heaters, solar water heaters, a solar pond, and a solar chimney or solar updraft tower are examples of low-temperature difference solar technologies [2]. A solar updraft tower power plant (SUTPP) is made up of three major components: a collecting unit, a power converting unit, and a tower that directs the hot air column and, through it, the ambient air at the desired height [3]. Trapped solar radiant energy raises the temperature of collected air in an air-preheating unit due to the greenhouse effect created by the collector canopy. Collected air heating gradually increases from the outer periphery to the centre of the collector. Due to the rise in the mean temperature of the collected air, a change in density takes place between the hot air under the collector and the cold surrounding air. Because of the density difference, a pressure difference exists between these two different temperature air reservoirs, and, due to the sloped shape of the canopy, a flow tends to occur at the collector centre [4].
The Power Conversion Unit (PCU) has a set of Turbine Generators (TG) with their supporting accessories, which are followed by a horizontal-to-vertical transition section (HTVTS) and cone assembly at the tower bottom. In a PCU, the hot air’s kinetic energy drop takes place in terms of losses in pressure drop, which are responsible for turbine blade rotation and, finally, for electric power generation. Hot air loses a large portion of its kinetic energy as it passes through the tower at the desired height [5]. The primary advantages of SUTPP include its capability to work in cloudy conditions, having low operation and maintenance costs, and not requiring any fuel or producing any emissive product, other than CO2 at the time of construction [6]. The ground beneath the collector of SUTPP can be used as a natural energy reservior, and the SUTPP can continue to generate electricity for long hours without sunlight with less output, and can be used for various agricultural uses, including growing crops [7,8,9,10,11,12,13], utilizing solar energy to collect potable water from the air [14,15], or as an air cleaner [16,17].
The SUTPP timeline began in the 1500s, with a drawing by Leonardo da Vinci of the first idea to use rising hot air in a chimney to power a system. In 1903, a Spanish artillery colonel named Isidoro Cabanyes submitted a proposal called “Proyecto de motor solar” (solar engine project), in which the author described a system with an air heating system attached to a building having a chimney for air [18], as shown in Figure 1.
Schlaich et al. [3,19] conducted detailed theoretical preliminary investigations and research work using a broad range of wind tunnel tests that resulted in the development of a pilot plant, with a maximum energy output of 50 kilowatts on a facility established by a strategic alliance involving German structural engineering companies and the State of Spain in Manzanares, Spain, in the years from 1981 to 1982. The results from Manzanares, which served the Spanish grids in a completely atomized mode for a period of 8612.0 h between July 1986 and February 1989, demonstrated that this technology was a suitable substitute for traditional power plants and encouraged further study.
An initial operational theoretical model of SUTPP development for overall efficiency and relevant performance data was suggested by Ming [20], Petela [21], and Muhammed [22]. The authors suggested that the overall efficiency of SUTPP is proportional to the tower height and concluded that the solar tower is an essential part of a large-scale SUTPP.
Research within the context of using an SUTPP has considered tower modification, the collecting unit having thermal storage [23], the effect of wind [24], variations in glazing [25,26] and its slop [27] for extended operational hours, the modification of the PCU to increase power output [28,29], and cost modeling; other fields of research have focused on interaction with the atmosphere, ecology, agriculture, socio-economics, alterations to the basic concept, and technological development. Many studies in these areas have been conducted by various researchers and scholars [30,31,32,33].
Many different SUTPP dimensions and configurations have been suggested by several researchers [34,35]. Schlaich et al. [36] advised employing a reinforced steel and cement (RCC) structure for large plants after discussing various chimney construction methods. In Manzanares, a galvanized steel pipe was employed for the pilot-scale plant. Multiple wind loading situations were examined by Goldack [37], as well as the effects of various reinforcements and wall thickness variations on the structural response of a large solar chimney measuring 1000 m tall.
Bernardes [38] and Hedderwick et al. [39] developed relevant equations for a SUTPP, which were further studied by Pretorius et al. [40] in their study, detailed solutions for a basic control region inside the system were provided. Because the variations in air dynamics seem to be relatively slower across the collector radius, transitory provisions in the conservation equation are statistically insignificant. Further modifications in the equations were developed by Pretorius et al. [41], Bernardes et al. [42], and Das et al. [43].
The objective of this work is to define a range of different variables and influencing parameters for optimum power generation, and then to develop the trends to determine the values of selected plant configurations for different sets of SUTPPs, which indicate the effect of variation in dimensional variables on the output power of SUTPPs. An objective function is derived for a reference plant configuration with detailed parametric assumptions.
A set of the most prominent plant-dimensional parameters that require maximization is identified. Multiple simulations for the objective function are carried out, and the outcomes are compared to the optimized dimensions of each set of plants. With the help of simulation programs, the trends of different dimensional sets of plant installations are proposed with respect to the power output of plants, and graphs are developed to show the optimal values of dimensions for various power outputs. These graphs are very helpful for plant designers and operators because they provide a basic idea for selecting dimensions, configurations, and power outputs for a SUTPP.

2. Analysis of SUTPP

As previously mentioned, a SUTPP is made up of three major components: the collection unit, a power transfer unit, and a tower that directs the hot air column, and, through it, the ambient air at the desired height. In an air-preheating unit, trapped solar energy increases the temperature of air under the collector, which is generated by the greenhouse effect created by the collector canopy. Collected air heating gradually increases from the outer periphery to the center of the collector. As the mean temperature of the air starts to rise, a difference in density takes place between the heated air under the collector and the cold surrounding air. Because of the density difference, there is a pressure difference between these two different temperature air reservoirs, and flow tends to occur at the collector center due to the sloped shape of the collector canopy [44].
The PCU has a set of TGs with their supporting accessories, which are followed by a HTVTS and cone assembly at the tower bottom. In a PCU, the hot air’s kinetic energy drop takes place in terms of losses in pressure drop, which are responsible for turbine blade rotation and, finally, for electric power generation. After losing a major portion of kinetic energy, hot air passes away to the ambient through the tower at the desired height [41].

2.1. Governing Conservation Equation

The heat transfers under the collector, air flow, and momentum transfer can be simulated by solving the relevant conservation equations for a SUTPP suggested by Gannon and Backstrom [45]. Kröger [46] and Hedderwick [39] developed relevant equations for a SUTPP, which were further studied by Pretorius [41] to present exhaustive equations for a basic control region in the systems. Transient effects in the conservation equation are minimal because variations in air movements are generally slow across a collector’s diameter. Further modifications of the equations were suggested by Pretorius et al. [40] and Bernardes et al. [42,47]. The equations presented here are in their final form.

2.1.1. Collecting Unit Equations

Continuity equation
1 r r ( ρ v r H c o l l e c t o r ) = 0
Momentum equation
( H c o l l e c t o r p r + τ r + τ g + F s u p p o r t r Δ θ ) = ρ v H c o l l e c t o r v r
Roof energy equation
α e b   I h b + α e d I h d + q g r = q r a + q r s + q r h  
Ground energy equation
At z = 0.0 (Ground/earth surface)
( τ e α g ) b I h b + ( τ e α g ) b I h d = q g r k g T g z | z = 0 + q g h
At z > 0
k g 2 T g z 2 + ρ g c p g T g t = 0
At z =
T g z = 0
Collector Air energy equation
q r h + q g h = 0.4 c v T r ρ H c o l l e c t o r [ r ( v r ) + v r ( c p T ) ]

2.1.2. Tower-Equations

Continuity equation
z ( ρ t v t ) = 0
Momentum equation
p t z ( τ t     π d t + F b w A t ) = ρ t ( g + v t v t z )
Tower Air energy equation
R T c   z ( ρ t v t ) + ρ t v t z ( c p t T t ) + z ( ρ t v t g z ) = 0

2.2. Power Output

Tower height has a linear influence on SUTPP power output and a square influence on collector radius [45,48]. The air starts flowing due to a change in density that becomes the essential cause of the turbine motions at the base of SUT, which create energy by driving the generator, which transforms rotational (mechanical) energy into electrical energy.
The total power generated by the turbine can be determined by [36]:
P = η t g Δ p t u r b i n e V a v g
where η t g ,   Δ p t u r b i n e , and V a v g are the turbogenerator efficiency, pressure-gradent throughout the turbine, and mean volumetric flow rate of air through the propeller, respectively.
The average volume of air flow through the turbine:
V a v g = m ˙ ρ a v g
where
  • ρavg = Average density of air through the turbine
  • m ˙ = Average mass flow rate through turbine
Air is presumed as an ideal gas and the mean density is calculated by:
ρ a v g = p a v g R T a v g = 1 2 ( p 4 + p 5 ) 1 2 R ( T 4 + T 5 )
where
  • pavg = Average pressure through the turbine
  • T a v g = Average temperature through the turbine
  • R = Universal gas constant
The pressure drop across the turbine
Δ p t u r b i n e = Δ p T P D ( Δ p c o l l ,   i n + Δ p c o l l + Δ p t u r b i n e ,     i n + Δ p t o w e r + Δ p t o w e r ,   o u t + Δ p d y n )
where
  • ΔpTPD = Total driving potential or total pressure difference in the plant
  • Δ p c o l l ,   i n = Collector inlet pressure-drop
  • Δ p c o l l = Total pressure-drop throughout the collector
  • Δ p t u r b i n e ,   i n = Pressure drop at the turbine inlet
  • Δ p t o w e r = Total pressure drop through the tower
  • Δ p t o w e r ,   o u t = Tower outlet pressure difference with ambient at tower outlet
  • Δ p d y n = Tower dynamic outlet loss at height H
Total pressure difference across the SUTPP
Δ p T P D = ( ρ 4 ρ 1 ) g H t o w e r
Or
Δ p T P D = g H t o w e r ρ 1 Δ T T 1 = g H t o w e r ρ 4 Δ T T 4
In the case of maximum fluid power, the optimum value of Δ p t u r b i n e is the order of 2/3 of the total pressure-difference ( Δ p T P D ) in the plant [49,50]; i.e., the sum of magnitudes of all the losses will reach 1/3 value of the total pressure-difference ( Δ p T P D ).
Then, the maximum drop in pressure across the turbine
Δ p t u r b i n e ,   m a x = 2 3 Δ p T P D
By putting the value of Equations (16) and (17) in Equation (11) and considering a drop in power output due to losses in friction through the collector and turbine inlet, the friction factor ( η f , l o s s ) is considered.
The net power outcome through the SUTPP will be:
P = η t g η f , l o s s 2 3 Δ p T P D V a v g
By putting the value of Δ p T P D and Δ T in Equation (18), net power:
P = 2 3 η t g η f , l o s s g H t o w e r ρ 1 Δ T T 1 V a v g
The total difference in temperature between the inside and outside air of the SUTPP can be calculated by the energy balance at the turbine inlet. For which, in ideal conditions:
Total heat gain by collector = heat available at turbine inlet
So:
η c o l l e c t o r π R c o l l e c t o r 2 I = m ˙ c p Δ T
Δ T = η c o l l e c t o r π R c o l l e c t o r 2 I m ˙ c p
where I is the solar irradiation falling upon the collector canopy in the reference location.
So, the net power outcome through the SUTPP will become
P = 2 3   η f , l o s s η t g η c o l l e c t o r   g H t o w e r ρ 1 π R c o l l e c t o r 2 I V a v g m ˙ c p T 1
As
V a v g = m ρ 1 ˙
So
P = 2 3   η f , l o s s η t g η c o l l e c t o r   g H t o w e r π R c o l l e c t o r 2 I c p T 1
For a specific value of   η f , l o s s   ,   η t g , η c o l l e c t o r ,   H t o w e r , R c o l l e c t o r , c p , T 4 , and I, the SUTPP power output can be determined through the tower height and collector radius. So
P = C   H t o w e r R c o l l e c t o r 2
where
C = 2 3   η f , l o s s   η t g η c o l l e c t o r   g π I c p T 1
The effects of various factors on SUTPP power output can be summarized using the above relationship, as follows:
  • Increases in tower height directly regulate power output in a linear proportion, but, due to the effect of the friction factor, this relation is not truly linear. This relationship cannot determine the maximum tower height that can be achieved.
  • Increases in SUTPP collector radius directly regulate power output in square proportions.
  • The effect of collector efficiency also regulates power output, which can be increased by using good quality glass with glazing, a smooth ground surface, and low drag forces developed by the roof support structure.
  • When the surrounding air temperature drops while the inside air temperature remains constant, the power output increases.
  • Factors such as chimney shade, cloudy days, 24-h operation, and glazing affect the power output of the SUTPP, which is not considered in this study.

Calculation for Plant Output and Dimensions
The output power of the SUTPP can be determine through Equation (24) as follows:
P = 2 3   η f , l o s s η t g η c o l l e c t o r   g H t o w e r π R c o l l e c t o r 2 I C p T 1
By assuming
  η f , l o s s = 0.90 ,   η t g = 0.85 ,   η c o l l e c t o r = 0.50 ,   I = 1000 W / m 2 , C p = 1005.98721   J / kgK , T 1 = 303.15   K
P = 0.02579     H t o w e r R c o l l e c t o r 2
Tower height can be calculated using the above relationship between desired power output and the fixed value of collector radius. In this study, reference site coordinates, reference site data and the range of the power output and tower height of the SUTPP are given in Table 1, Table 2 and Table 3, respectively. The tower height can be calculated by:
H t o w e r = 3 2 P C p T 1   η f , l o s s η t g η c o l l e c t o r   g π R c o l l e c t o r 2 I
Or
H t o w e r = P 0.02579   R c o l l e c t o r 2
The average volume flow rate of air through the tower:
V a v g = π R t o w e r 2 v a i r  
So
R t o w e r = V a v g π v a i r
Since the 2/3 part of the total pressure difference ( Δ p T P D ) is used for turbine work output, the pressure head used for the flow of air through the tower is 1/3 part of the total pressure difference.
v a i r = 1 3   Δ p T P D ρ 1
By putting the value of   Δ p T P D   into the equation
v a i r = 1 3 g H t o w e r Δ T T 1
The volume of air flow through the SUTPP is given by
V a v g = m ρ 1 ˙ = η c o l l e c t o r π R c o l l e c t o r 2 I Δ T C p ρ 1
Substituting the value of v a i r and V a v g in Equation (30) to develop the relation for radius of the tower   ( R t o w e r ) , which can be obtained as:
R t o w e r = η c o l l e c t o r R c o l l e c t o r 2 I Δ T C p ρ 1 1 3 g H t o w e r Δ T T 1
R t o w e r = η c o l l e c t o r R c o l l e c t o r 2 I T 4 C p 1 3 g H t o w e r Δ T T 1
The tower efficiency is defined by the expression [29,48]:
η t o w e r = g H t o w e r   C p T 1
Here, g is the “gravity (m/s2)”, H t o w e r   is the “tower height (m)”, C p is the “heat-capacity of air (J/kgK)”, and T 1   is the “ambient-temperature (K)”.
As for the 100 MW SUTPP, the efficiency of the tower is considered to be 3.2199%. For illustration, the tower effectiveness reaches its maximum value of 3.00% at a tower height of 1000 m under typical pressure and temperature circumstances. According to the equation, with a collector performance ( η c o l l e c t o r ) of 60.0% and a turbine generator productivity ( η t g ) of 85%, the system’s overall efficiency ( η t o t a l ) is 1.53%.
η t o t a l = η c o l l e c t o r   η t g η t o w e r
η t o t a l = 0.6 × 0.85 × 0.03 = 0.0153
η t o t a l = 1.53 %
The height of the collector can be determined by:
V a v g = ( 2 π R c o l l e c t o r H c o l l e c t o r ) v a i r
Or
H c o l l e c t o r = V a v g 2 π R c o l l e c t o r v a i r
The collector roof height at a fixed radius may be discovered by employing the following relation [36,41]:
H c o l l e c t o r = H 2 [ r 2 r ] b
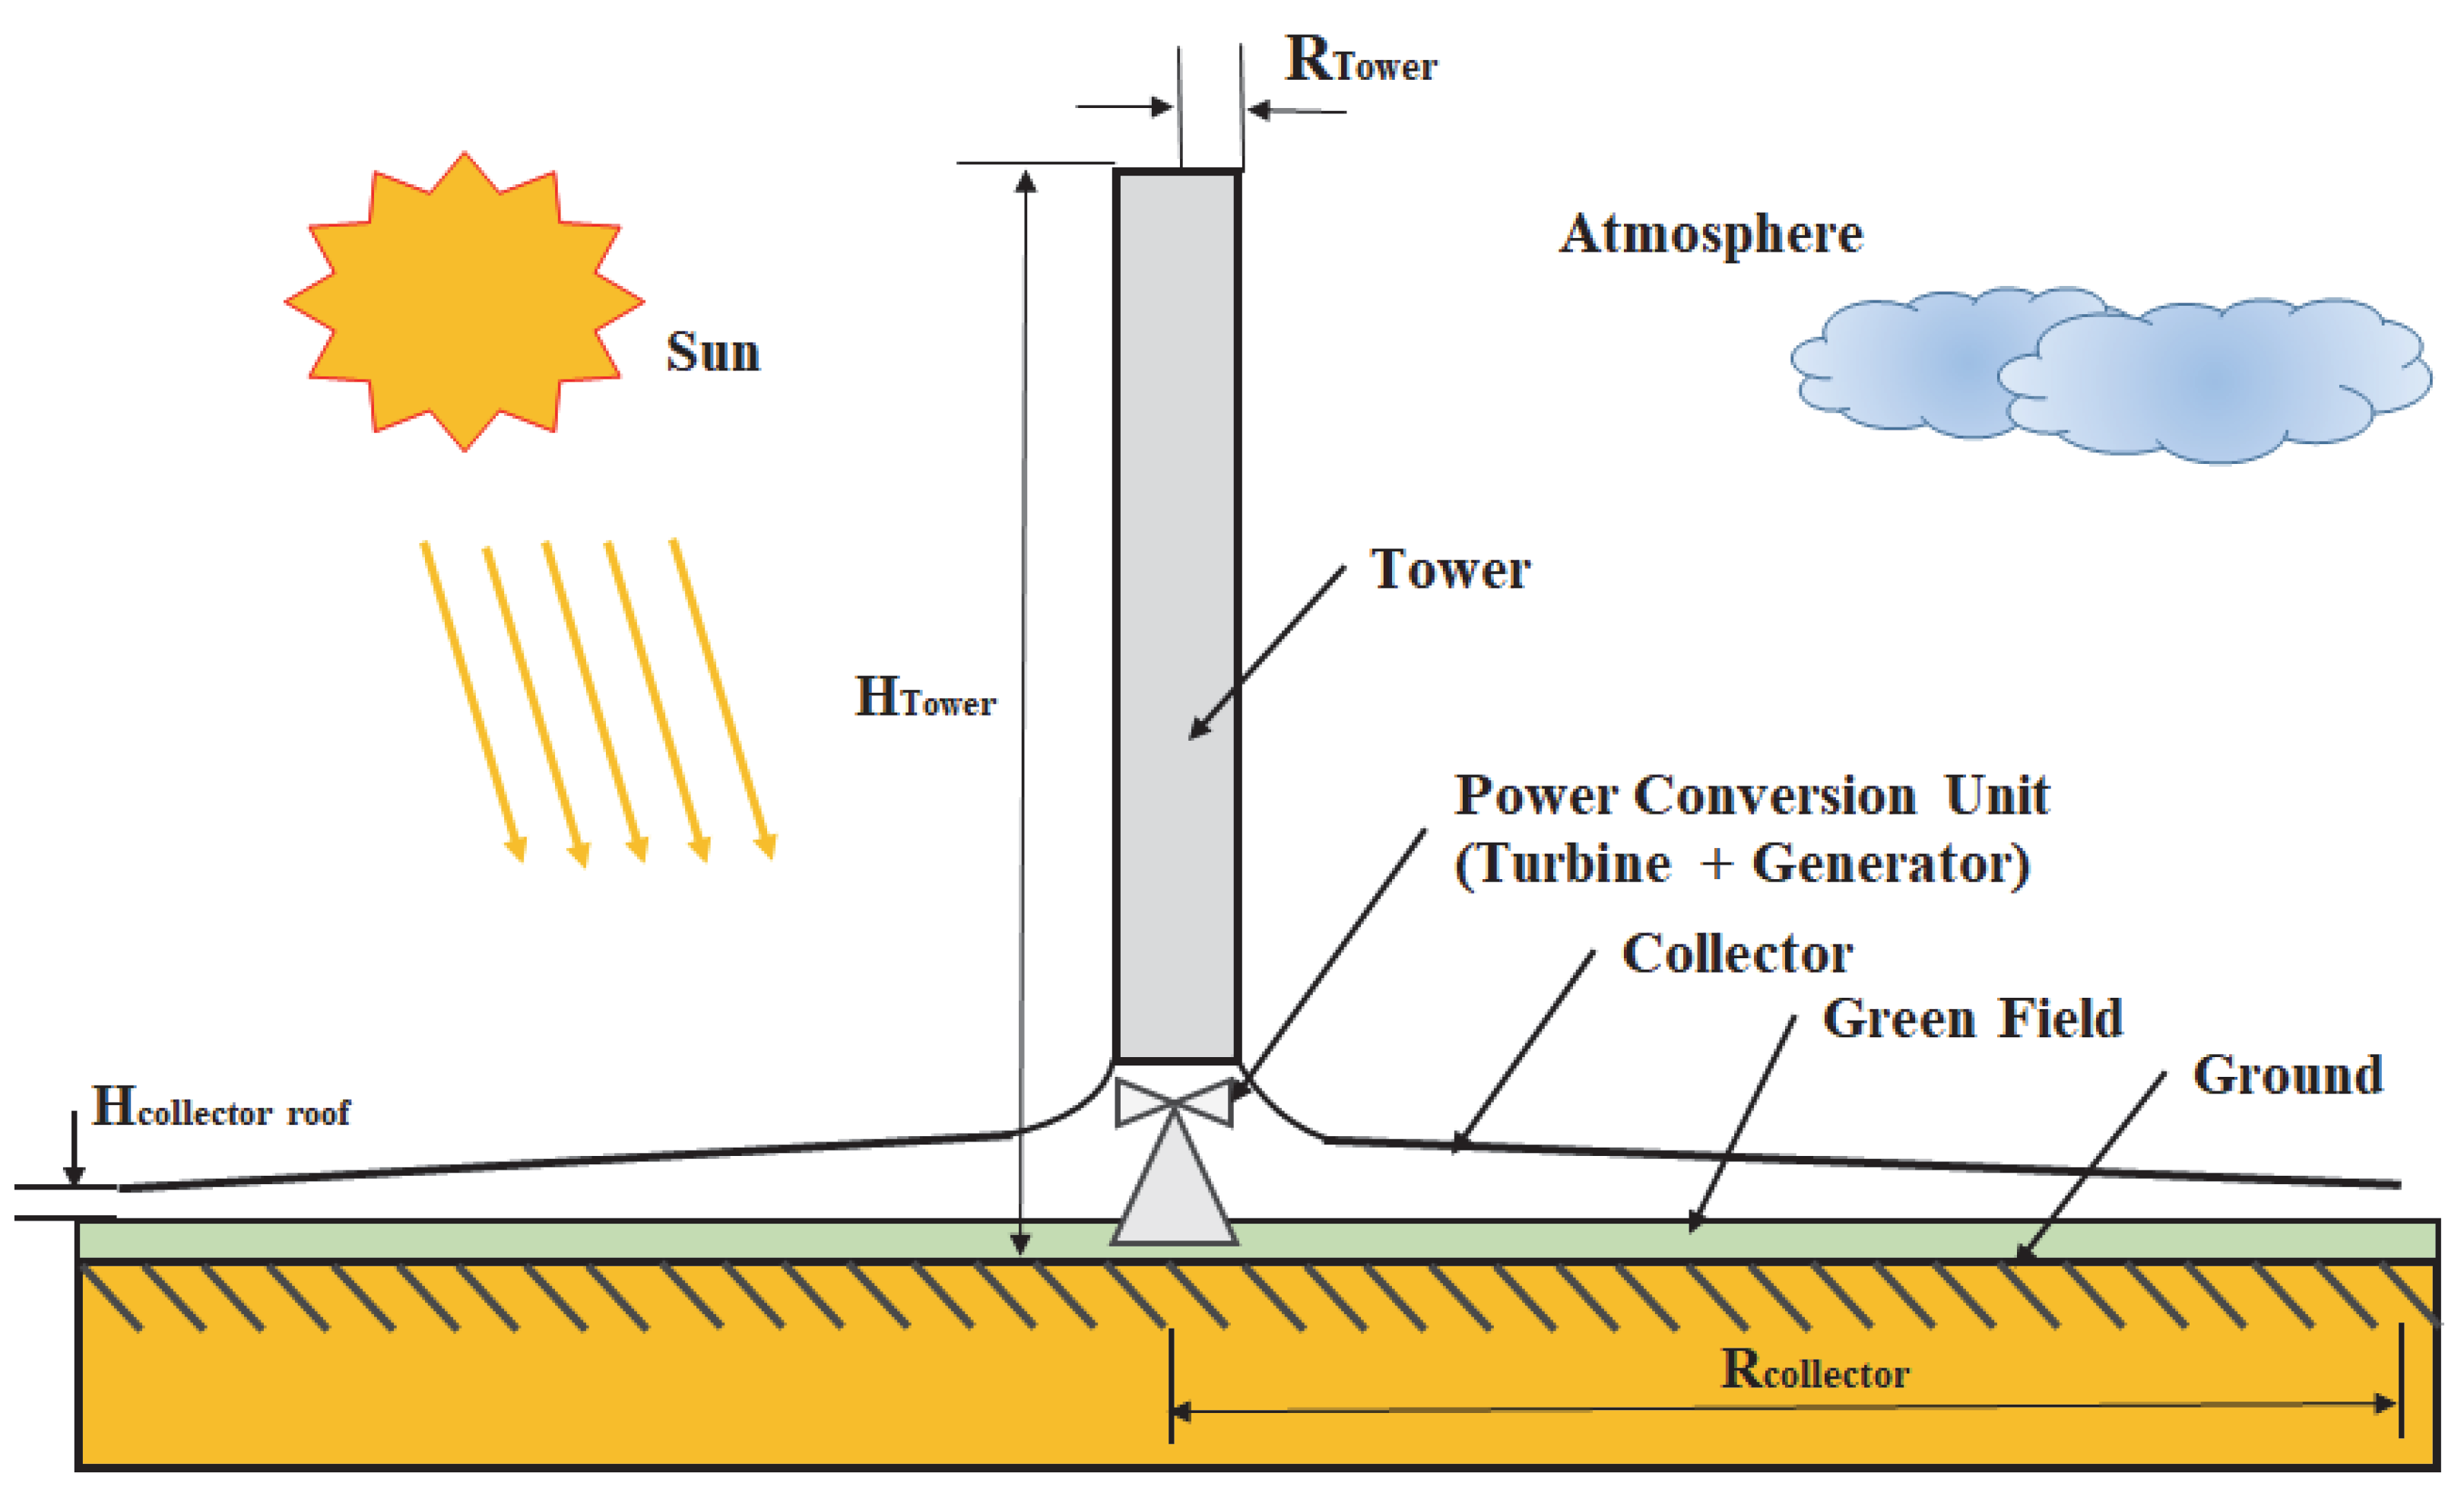
where H 2 is the “height of the roof collector” at end of the collector roof inside (see Figure 2) the collector perimeter radius r 2 , while b is a coefficient of the exponent.
By Equation (25);
P = 2 3   η f , l o s s η t g η c o l l e c t o r   g H t o w e r π R c o l l e c t o r 2 I C p T 1
Or
P = C   H t o w e r R c o l l e c t o r 2
R c o l l e c t o r = P C   H t o w e r
where
C = 2 3   η f , l o s s   η t g η c o l l e c t o r   g π I c p T 1
For reference plant configuration, the value of C = 0.02579 .
In this study, it is assumed that the SUTPP has a output power of 100 MW and that collector radius regulate within a range of 1000 m to 3500 m with a 500-m interval.
The velocity of air entering the tower can be calculated as:
v a i r , t o w e r =   2 Δ p T P D 3           ρ 1 = 2 g H t o w e r Δ T 3             T 1
The rate of the mass flow of air through the turbine
  m ˙ = η c o l l e c t o r π R c o l l e c t o r 2 I c p Δ T
By the above calculation, main dimensions of the plant can be calculated.
Figure 2. Schematic illustration of a SUTPP.
Energies 16 00494 g002

3. Reference Purposed SUTP Plant Specification

India is gifted with a high amount of solar radiation since it is located near the Equator. The mean daily solar energy incident throughout India ranges between 4.0 and 7.0 kWh/m2, with around 2250 to 3250 sunshine hours per year, depending on the location [51]. In India, annual global radiation ranges from 1600 to 2200 kWh/m2 [52]. On an annual basis, the regions of Rajasthan, Northern Gujarat, parts of Ladakh, and Tamilnadu receive the most solar irradiance. Other regions of the world, primarily Japan, the United States, and Europe, where solar technological advancement and actual implications are at their highest, also obtain a respectable amount of solar radiation [53,54,55,56].
States like Rajasthan, Gujarat, and Madhya Pradesh are most suitable for the construction of SUTPPs because of their high values of solar radiation and very large flat areas with very low land costs [57]. In India, the most desirable building projects for sizable SUPPs are situated in Rajasthan desert areas, where solar radiation is very high and land may be free or at very low cost [52] (Figure 3).
For this work, Udat, Rajasthan, India, is considered the reference location for a SUTPP, with position coordinates of 27°35′ and 72°43′ for the meteorological condition, and other specifications for performance evaluation have been selected with real ground conditions described by the use of power output equations. The selection of a real ground site with more specific data yields better results for power output calculations and other considerations, such as this site having almost flat ground with a slope inclination of 0.8° for the entire area and a very low population density of 26 in. h./km2, indicating that low site preparation costs are required and fewer people are required to relocate from the power plant site [58]. The reference site for this work is also the one with the highest solar radiation count in the country (India) and the highest average monthly averaged daylight hours (12.15 h) [59]. The reference site coordinates and detailed specifications of the power plant site are given in Table 1 and Table 2, respectively.
Figure 3. Solar global horizontal irradiation graph of India © 2023 The World Bank, Source: “Global Solar Atlas 2.0, Solar resource data: Solargis”.
Energies 16 00494 g003

3.1. Meteorological Data of Reference Location

As per earlier studies [29,39,41,50,60,61], environmental conditions have a large effect on SUTPP output power. As a result, the reference plant’s solar irradiance, air temperature, atmospheric wind velocity, and atmospheric humidity are given.
The reference location selected is near Bikaner, Rajasthan, India. The selected reference site is hot and dry, and the sky is clear day and night. The reference site has a large flat area trajectory, a low population density, and low land cost [57]. This region of India (generally deserts) has a high quantity of solar irradiation on an annual basis, designed primarily for solar and renewable energy system design requirements [62,63]. These and other elements make Udat, Rajasthan, India, a perfect site for the development of a sizable SUTPP. Table 1 displays the precise coordinates.
Table 1. Reference site coordinates and Standard-Time-Zone.
Latitude27°35′ North
Longitude72°43′ East
Standard-time-zone (GMT)+5:30 h

Interpretation of Input Data

The input data for solar irradiance, atmospheric air velocity, atmospheric temperature, and atmospheric humidity are evaluated in the following manner in order to obtain smoother features of the input data for simulation analysis (Table 2). At the midpoint of the particular season, it is considered that the values being observed are the precise values that occur at the specified solar time hours. The dataset is then extrapolated across months to determine values for specific days and hours to provide precise, minutely input numbers. Therefore, for the simulation analysis, approximate values that occur at a certain minute on a certain day of the year are used as input data.
Table 2. Reference Site Data for SUTPP.
Reference Site Data
SITE: Udat, Bikaner, Rajasthan, India
Site position (latitude/longitude): 27°35′, 72°43′
Solar radiation (yearly average)
Monthly average Insolation interact on a horizontal-surface (kWh/m2/day): 05.081
Monthly average Diffuse-Radiation incident on a horizontal surface (kWh/m2/day): 1.71
Monthly average Direct-Normal Radiation (kWh/m2/day): 5.60
Monthly average Daylight Hours (hours): 12.15 h
Length of day: 10 h (December) to 13 h (July)
Wind:
Monthly average wind-speed at 10 m above the earth surface for terrain cover with shrub (m/s): 03
Wind Direction: In winter: North-Eastern
In summer: South-Western
Monthly averaged relative humidity (%): 42.1
Monthly averaged atmospheric pressure (kPa): 98.3
Atmospheric-pressure that has been adjusted for a site elevation of 209 m (kPa): 98.3
Air temperature:
Monthly averaged earth skin temperature (°C): 27.8
Monthly average air temperature at 10 m above the earth’s surface (°C): 24.9
Air-temperature at 10 m above the surface, adjusted for a site-elevation of 209 m (°C): 24.6
Average daily temperature range (°C): 10.15
Terrain (SRTM3)
Elevation: 209 m
Slope inclination: 0.8°
Slope azimuth: 228° (SW)
Landscape (GLC/CLC)
Type: Deciduous shrub cover
GLC: Shrub cover, closed-open, deciduous
Elevation: 209 m
Population (GPW)
Density: 26 in h. /km2

3.2. Analysis for SUTPP Model

According to Schlaich et al. [31,64], Kröger and Buys [65], Bernard et al. [38], Pretorius et al. [40], and Krumar et al. [66], plant output power has a direct relationship with collector area (radius) and tower height; if the power output is fixed, then the optimized collector area and tower height for a plant can be calculated in terms of the minimum plant installation costs for per annual power output [67].

3.2.1. Selecting Dimensions, Limits, and Intervals for Optimization

The most prominent SUTPP dimensions are collector radius (RCollector), tower height (HTower), and tower radius (RTower), which are presented in Table 3, with dimensional limits and intervals. The primary objective in choosing selected parameters was to decrease the number of parameters to be used in computational methods by keeping them as low as feasible. Additionally, in order to reduce the number of computer simulations while maintaining a decent level of accuracy, limits and intervals were chosen to be as large as feasible. It was decided to optimize the tower for a height of the order of 500 m in a range between 500 m to 2000 m, when the other dimensions are not fixed.
Table 3. Selected dimensions, limits, and intervals for model simulation.
DimensionDimensional Limits (m)Interval (m)
Tower-Height (HTower)500–2500500
Tower-Radius (RTower)05–2505
Collector -Radius (RCollector)1000–3000500
Power-Output 100 MW–200 MW25 MW

Collector

In this model, the following are the design, material, and building assumptions for the collector:
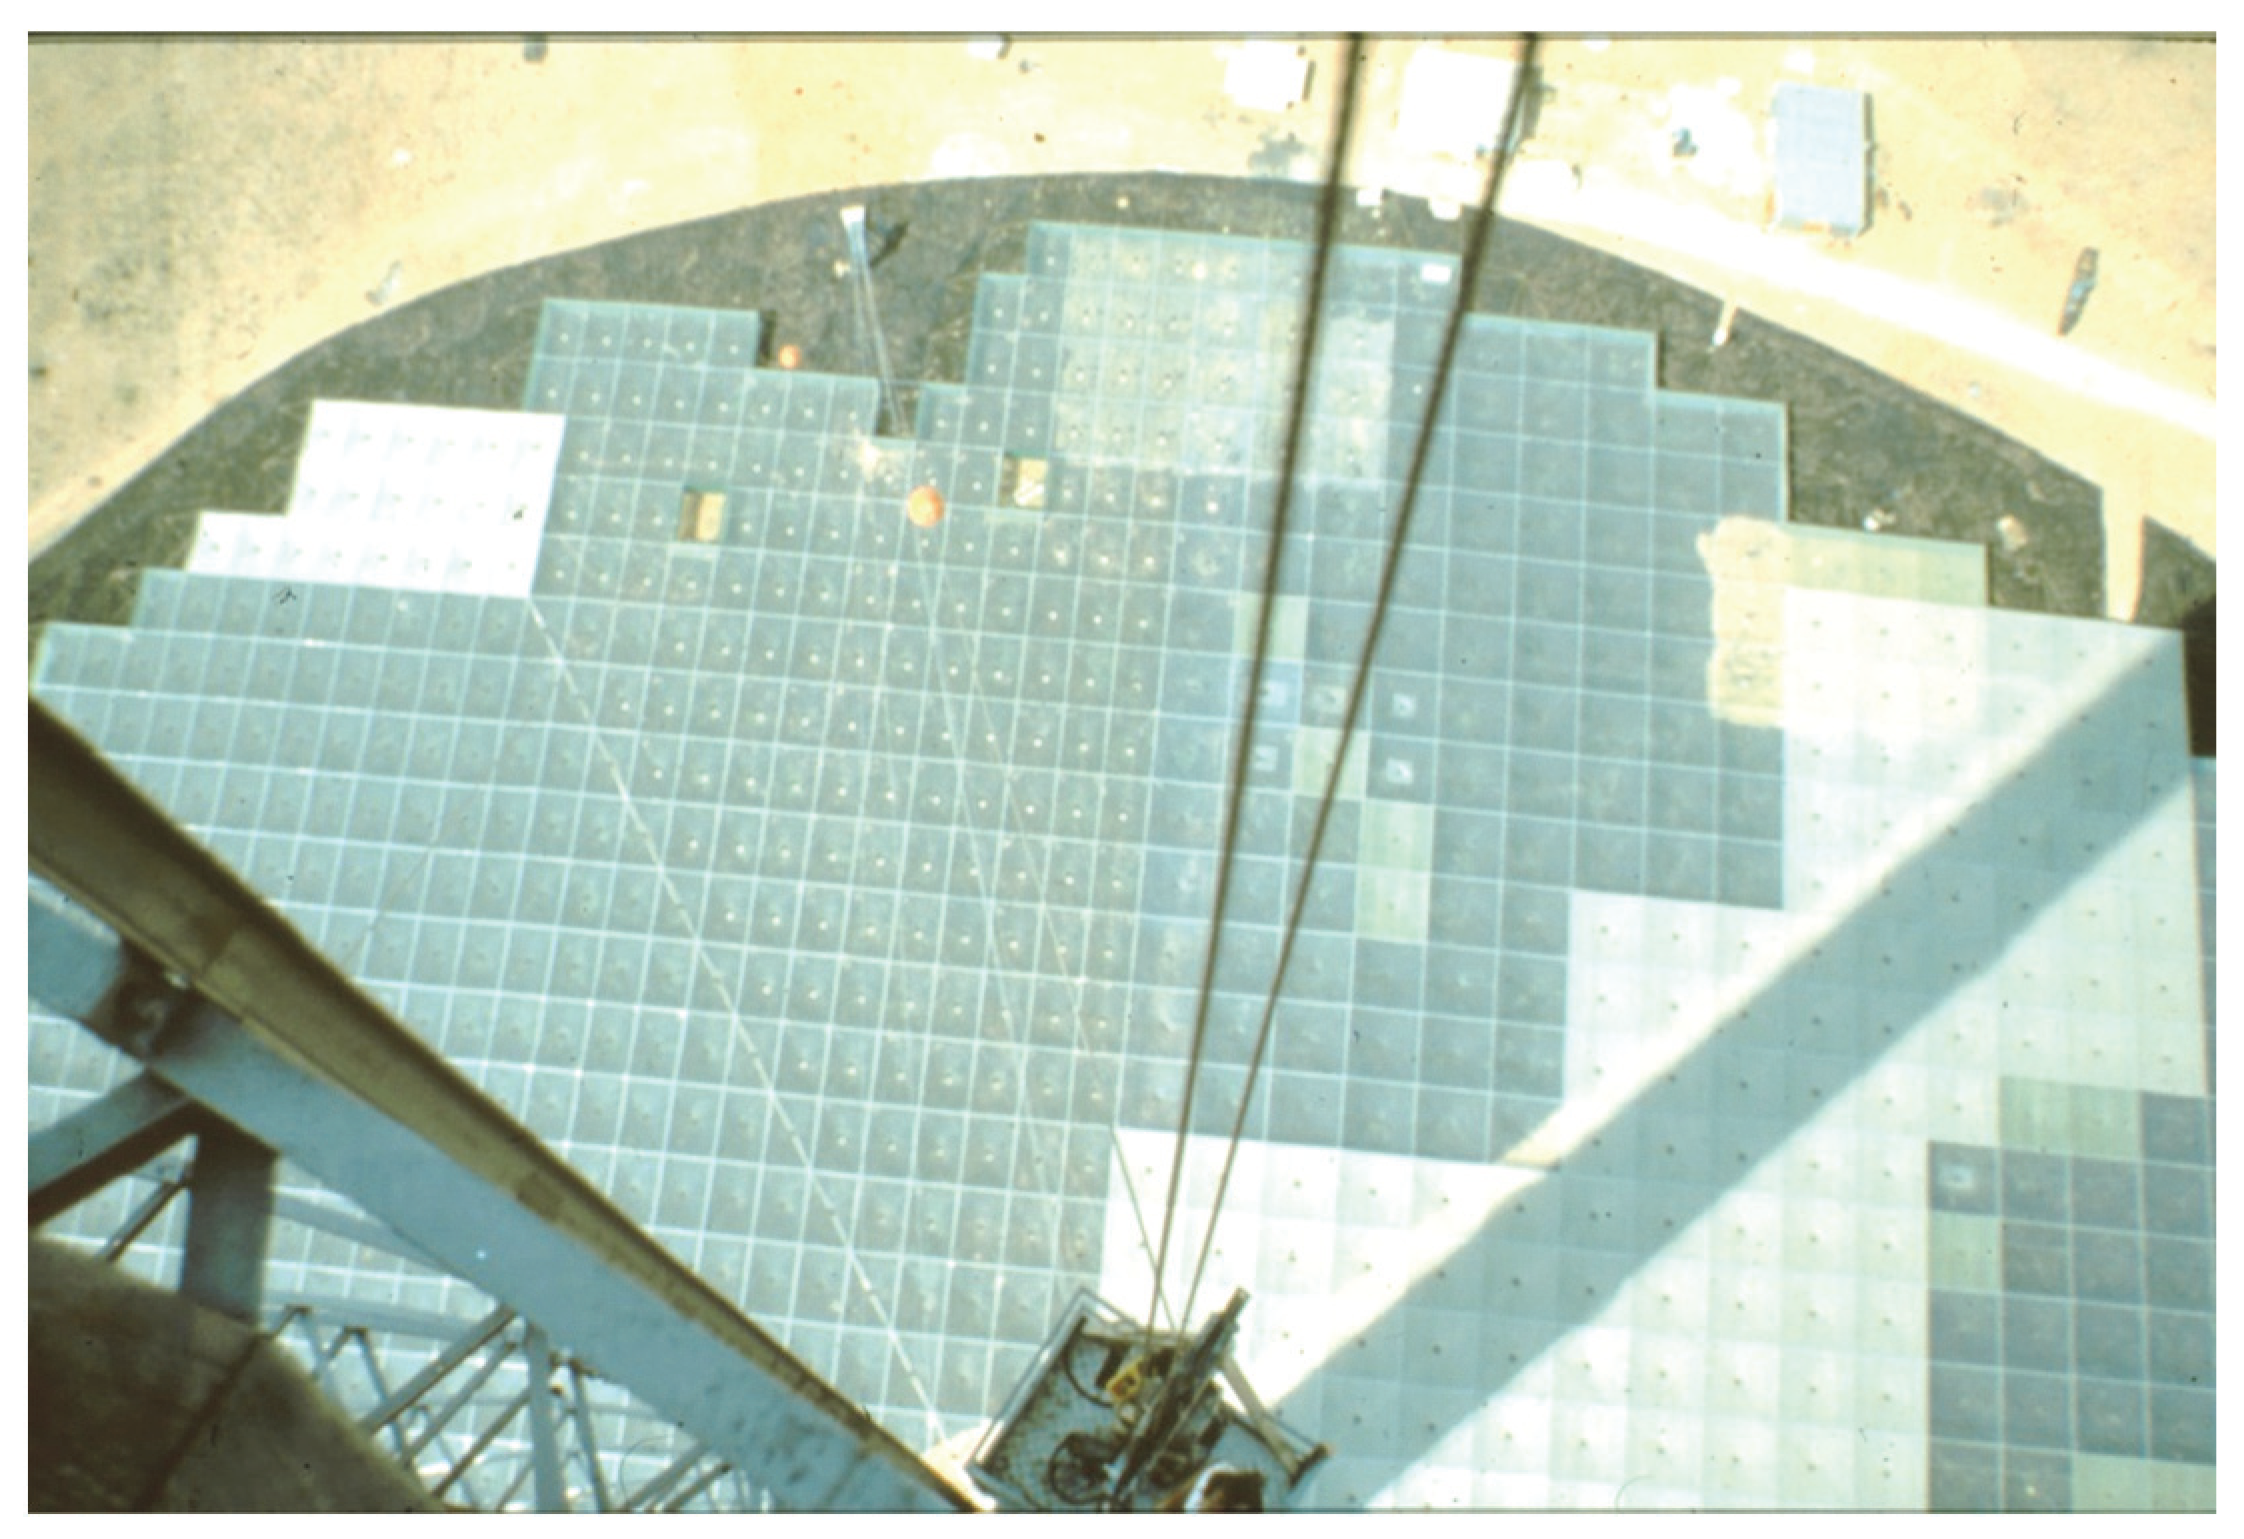
  • The collector is made out of a support framework and a clear glass canopy (Figure 4).
  • From the collector’s outside boundary to the tower’s exterior wall, the glass roof extends.
  • The support structure for glass consists of a truss matrix supported by steel columns.
  • For simulation purposes, the collector radius has an interval of 500 m, with a limiting range of 1000–3500 m.
  • According to the connection, the real roof height rises toward the collector’s center. H i n = H o u t [ r o u t r ] b [41], where b is the roofing shape factor, H2 is the elevation of the collector roof, and rout is the outer radius of the collector. The collector elevation is considered in this model computation as being constant and equivalent to b = 1.

Solar Updraft Tower (Chimney)

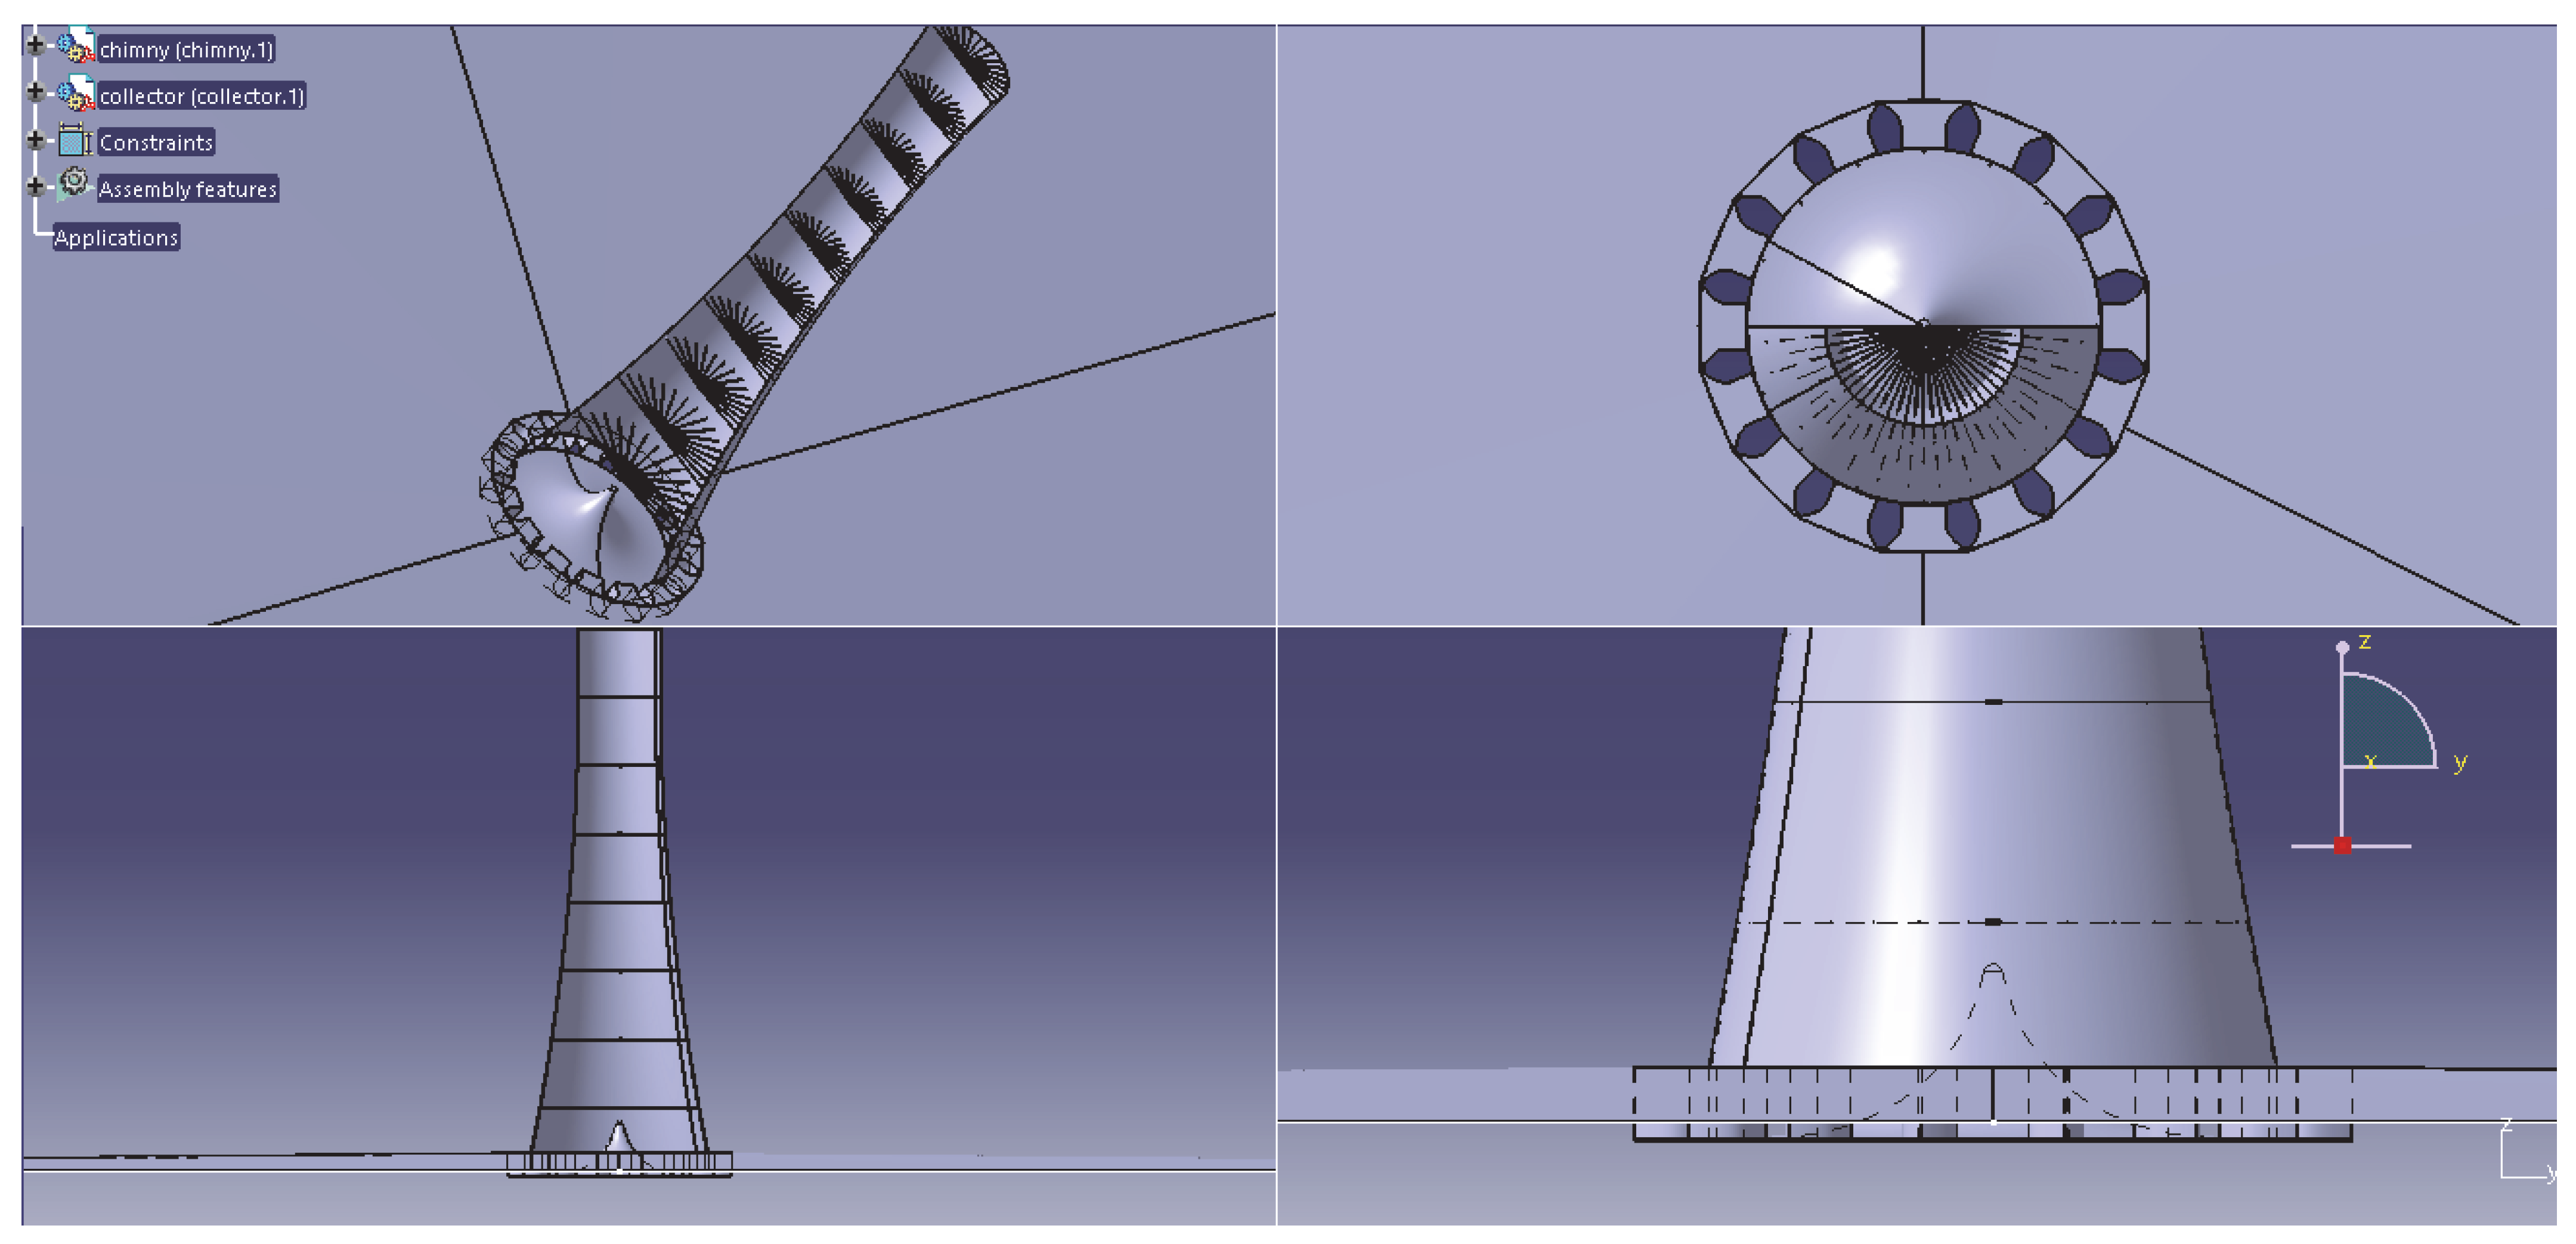
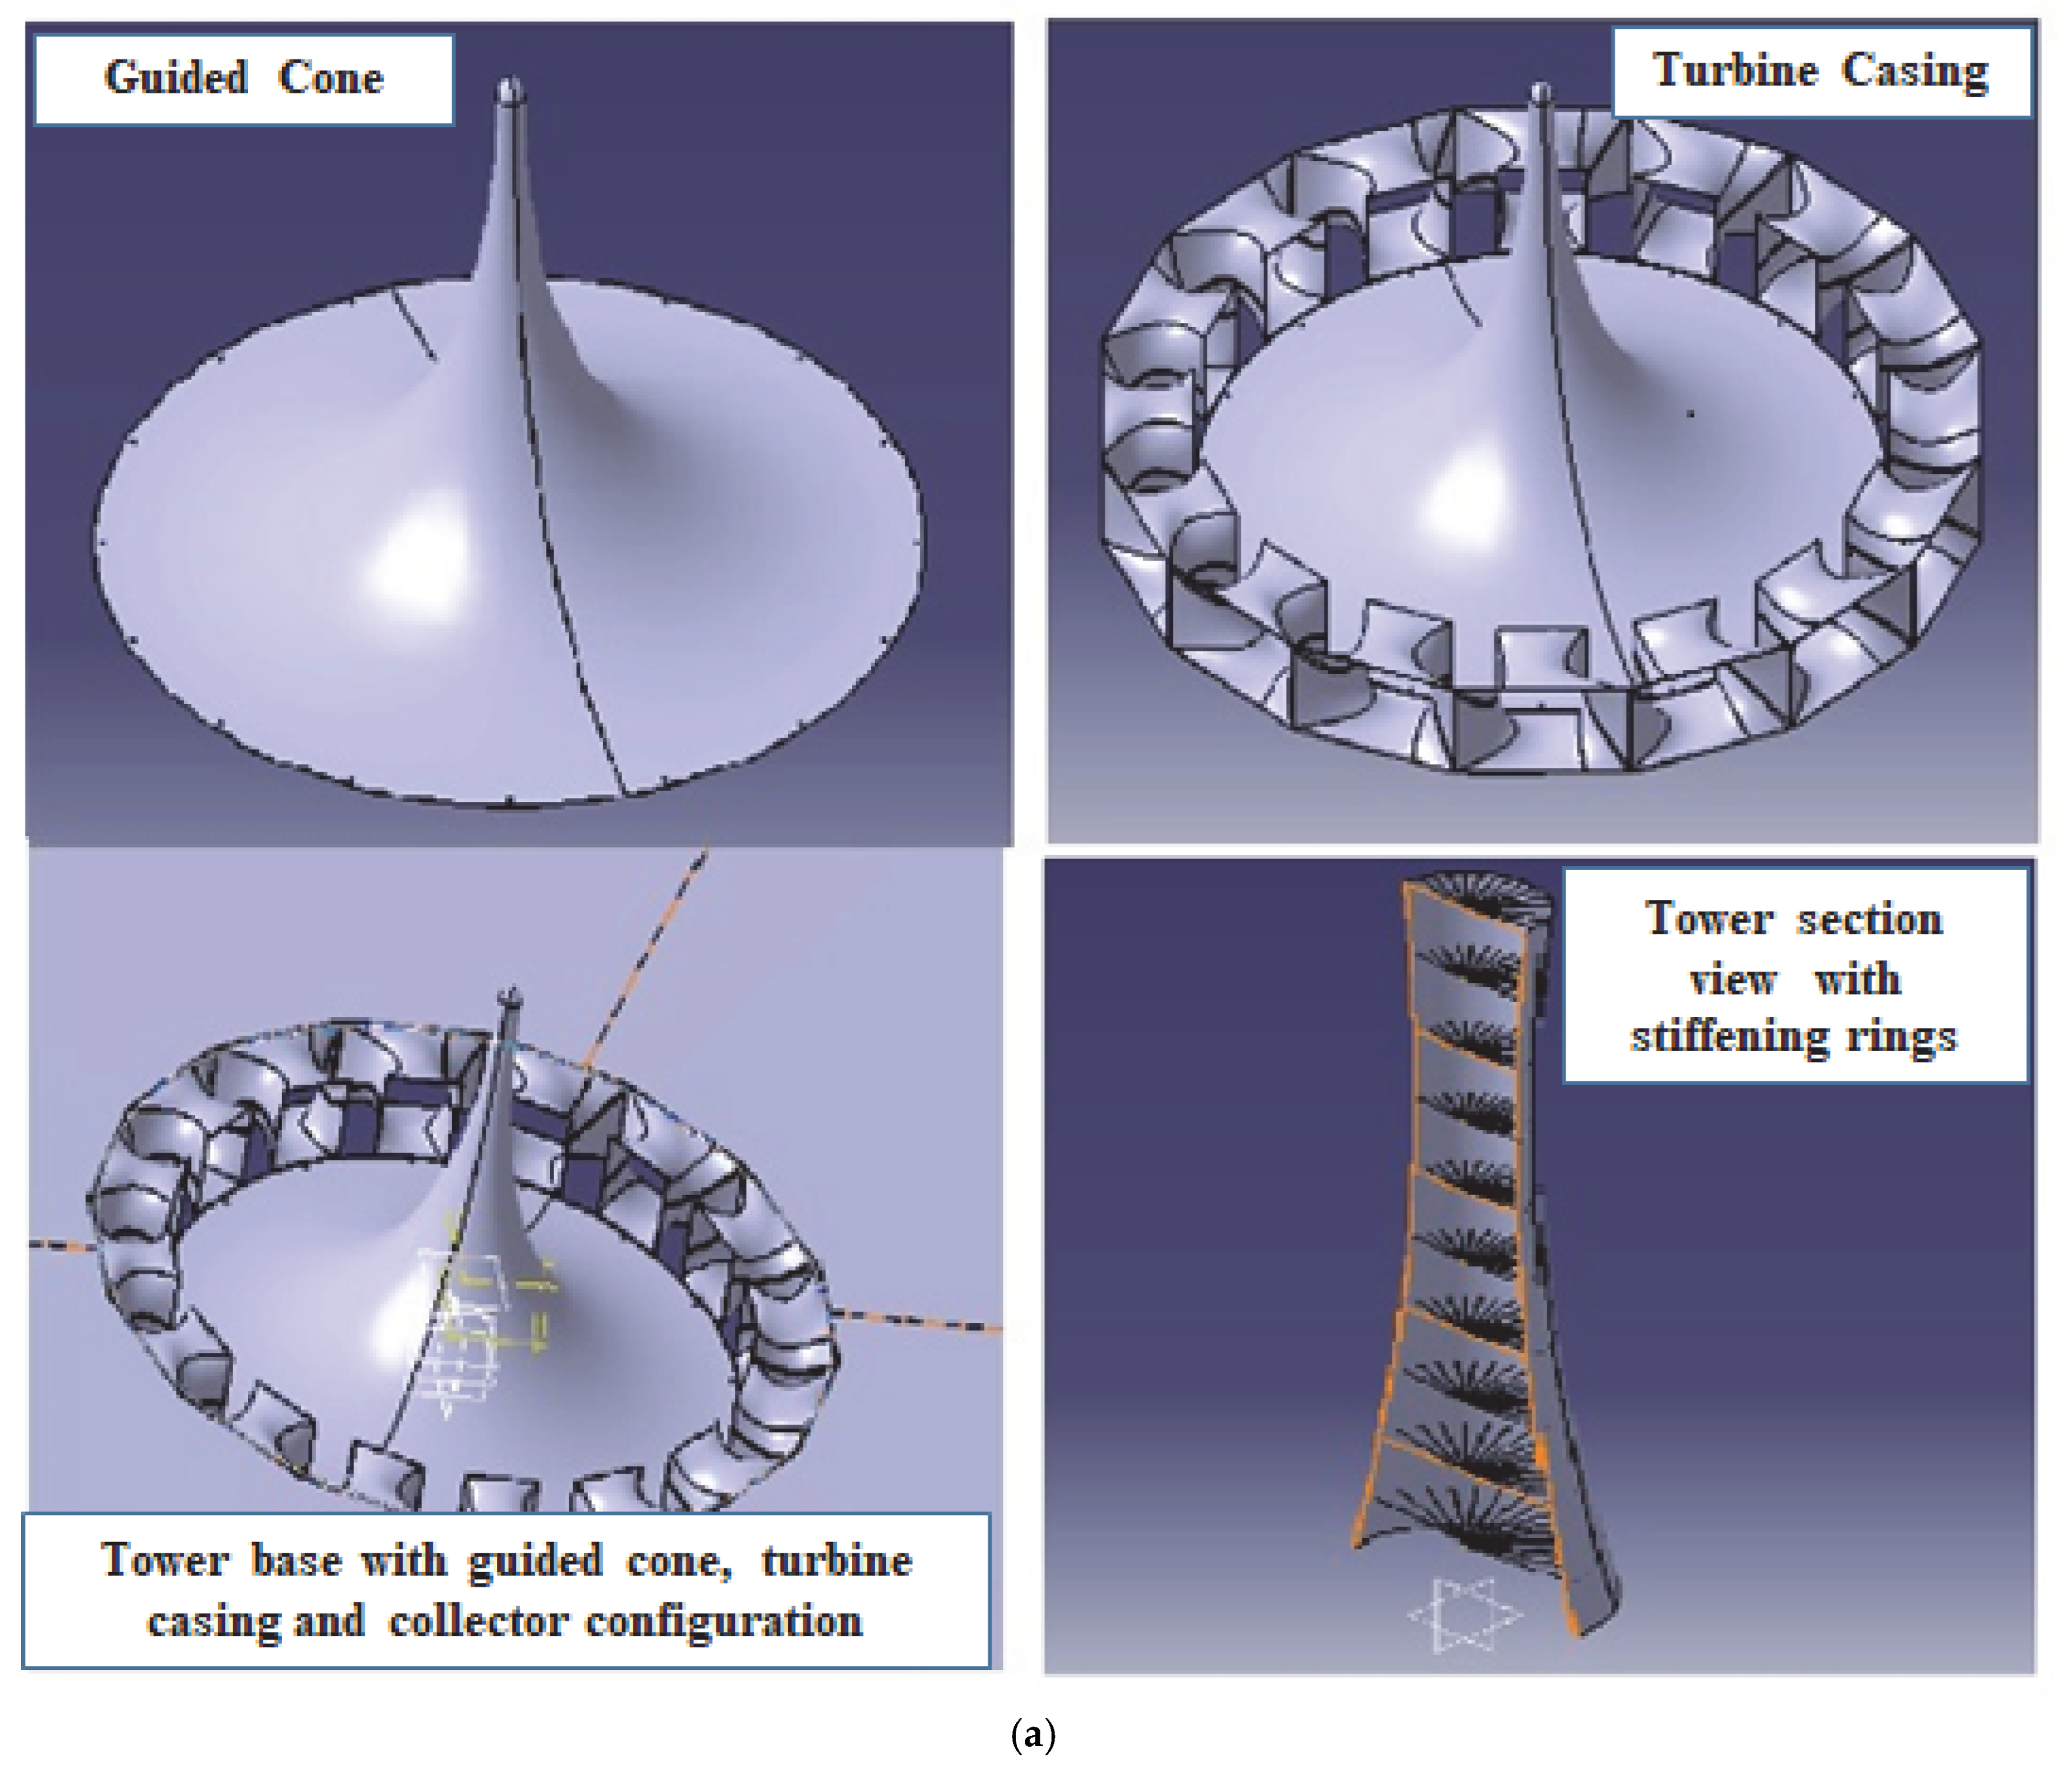
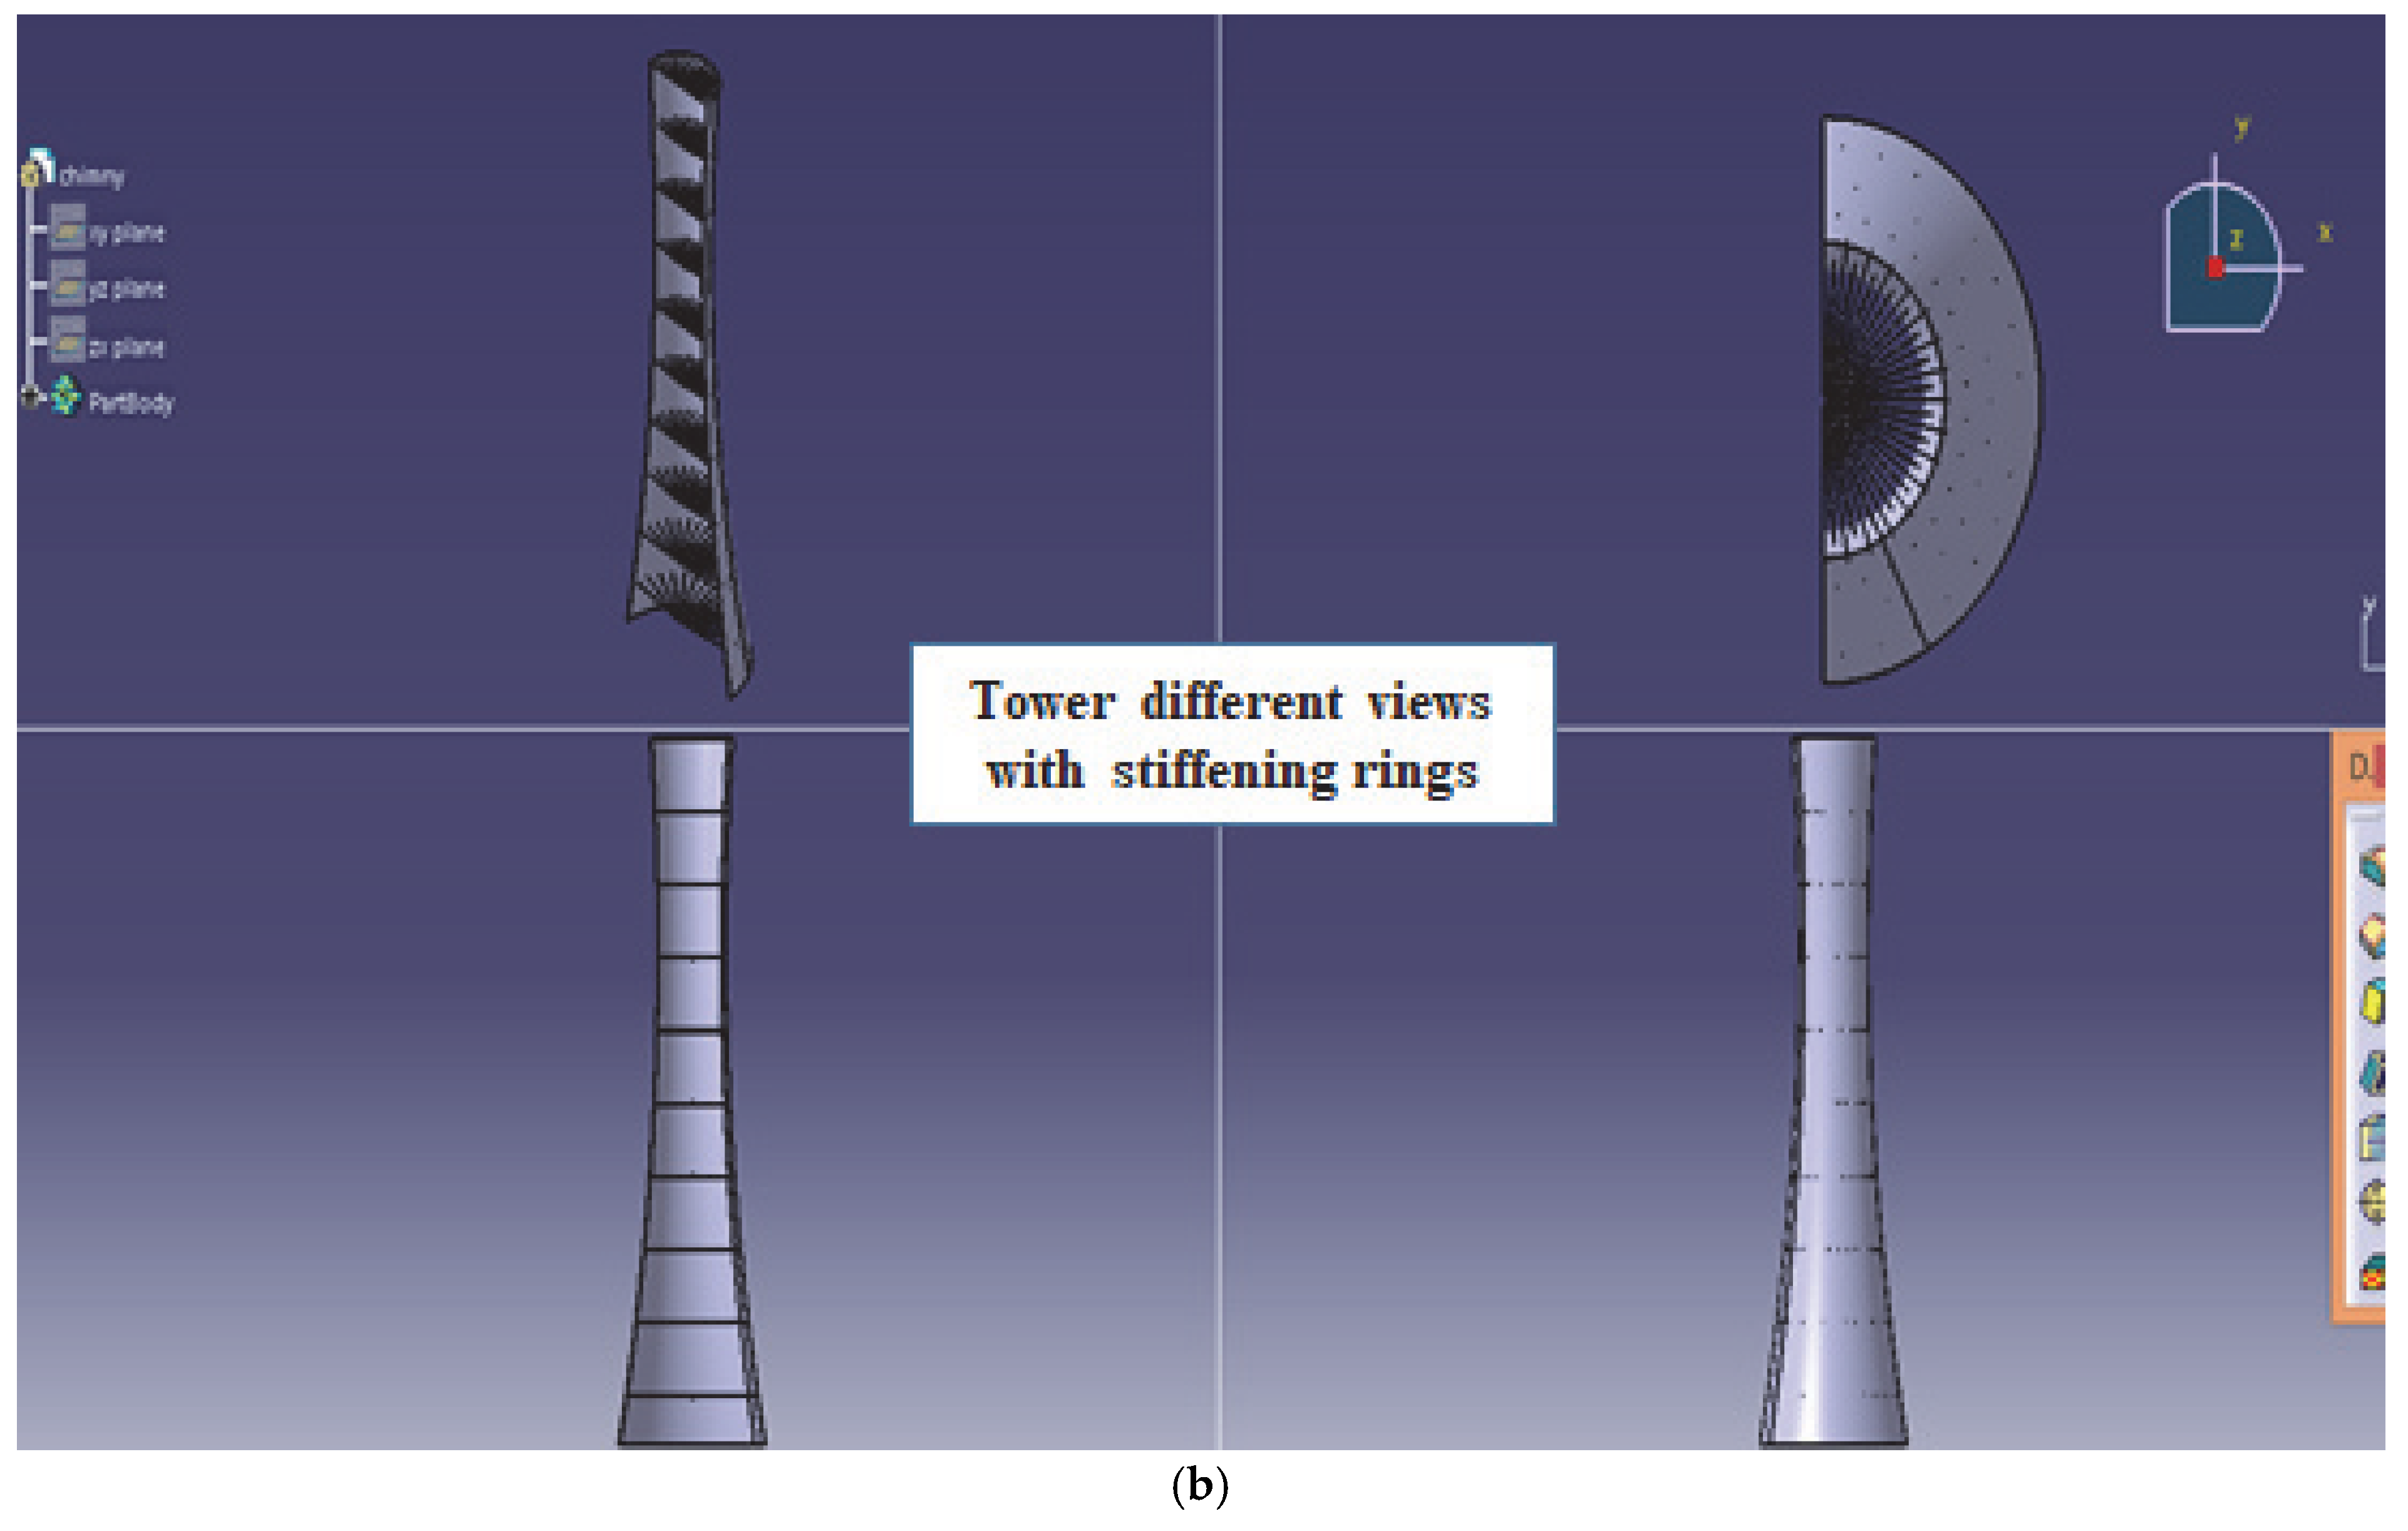
Following Schlaich et al. [31], Goldack [37] and Fluri [69], the main design, construction, and material assumptions for the tower include the wall thickness distributions for a tower. It is assumed that the mean tower thickness will grow by one millimetre for every additional metre of elevation. The tower is composed of a thin shell reinforced with high-performance concrete [65]. A constant “Z” is considered to calculate the effect of changes in the thickness of the tower with respect to tower height on cost calculation. The recommended wall thickness variations for a tower presume that the average tower thickness will increase by one millimetre for every additional metre of elevation. High-performance concrete with a thin shell of reinforcing steel forms the tower’s structure [48]. For a tower of large size, the stiffening ring configuration can also be used [31], while for towers of different heights, variable concrete composition (high-performance concrete at the bottom, reinforced concrete at the top) can be used. The tower shadow effect, wall thickness effect, drag due to stiffener rings, and effect of tower geometry are not considered, while a guiding cone at the bottom of the tower is considered, which has a conical geometry with a hemispherical head shape and negligible roughness (Figure 5).

Power Conversion Unit (PCU)

The PCU consists of sets of multiple horizontal axis turbines configured with generators situated at ground level, used for power generation [70]. Schlaich et al. [31,64], Bernardes [38], Von Backström [48,69], Pretorius [40,41], Zhou et al. [71,72], and Kalash [73] conducted detailed work. Studies on turbines was conducted by Gannon [45] and Fluri et al. [69] and Guo et al. [61] (Figure 6).
The main assumptions for the design and materials of the reference power plant included that the rated power output of the SUTPP is 100 MW, while the turbine and generator assemblies are placed at ground level where the flow of wind through the turbine is axial and the effect of turbine inlet guided vanes, diffusers, turbine casing, diffusers, and ducts is not considered, and the HTVTS is connected by a curved junction with the addition of a conical guiding cone.
The power output for the SUTPP for a given value of tower height and collector radius can be calculated by the following Equations (24) and (27):
P = 2 3   η f , l o s s η t g η c o l l e c t o r   g H t o w e r π R c o l l e c t o r 2 I C p T 1
For reference plant
P = 0.02579   H t o w e r R c o l l e c t o r 2
Figure 6. Assemble and section view of different components of the SUTPP, including PCU.
Energies 16 00494 g006
This relationship shows that the power output is proportionate to the height of the tower, while output power is square proportional to the collector radius and has a relation with efficiency of the collector, efficiency of the tower, and efficiency of the PCU in linear proportion.
The detailed study on average power output of a SUTPP was conducted by Schlaich [19], Gannon et al. [45], and Pretorius [41]. Pretorius [41] used two or more glazings, Schlaich [19] used a solar pond, and Gannon et al. [45] used black coated tubes, which were filled with brine solution. Plants can be operated during the night by using the heat stored in the ground, pond water, or brine solution. The average power output of the SUTPP is the value of power generated by the plant throughout the year without interruptions.
If the plant operates under average load conditions for a full day and night period, the power output comes to around 36% of the peak power output of the SUTPP, as noted by Pretorius [40]. For the 100 MW capacity of the SUTPP, the annual average power output will be in the range of 36 MW.

4. Thermo-Dimensional Optimization of a SUTPP

Several researchers have conducted experimental and simulation studies in this area [74], but more detailed research on the dimensions that must be optimized in order to find the optimized results for a SUTPP is required. According to Schlaich [31], Kröger and Buys [38], Bernard and Pretorius [41], and Zuo [72], plant power output has a direct relationship with collector area (radius) and tower height. If the plant’s power output is fixed, the optimized collector radius and tower height can be calculated (Equation (25)). The most prominent SUTPP dimensions selected are collector radius (RCollector), tower height (HTower), and tower radius (RTower), which are presented in Table 3, with dimensional limits and intervals.
For a net power output, Equation (22) can be used to draw a direct relation between tower height (HTower) and collector radius (RCollector) for a SUTPP:
P = 2 3   η f , l o s s η t g η c o l l e c t o r   g H t o w e r π R c o l l e c t o r 2 I C p T 1
A plant with detailed specifications is considered a reference plant, with specifications given in Table 2 and Table 3 for the given range of the above parameters. For a fixed power output, by fixing the range of parameters and varying the above-mentioned parameters, different sets can be calculated for tower height (HTower), tower radius (RTower), and collector radius (RCollector) for a reference plant to develop various sets for a fixed power output.

5. Experimental Methodology

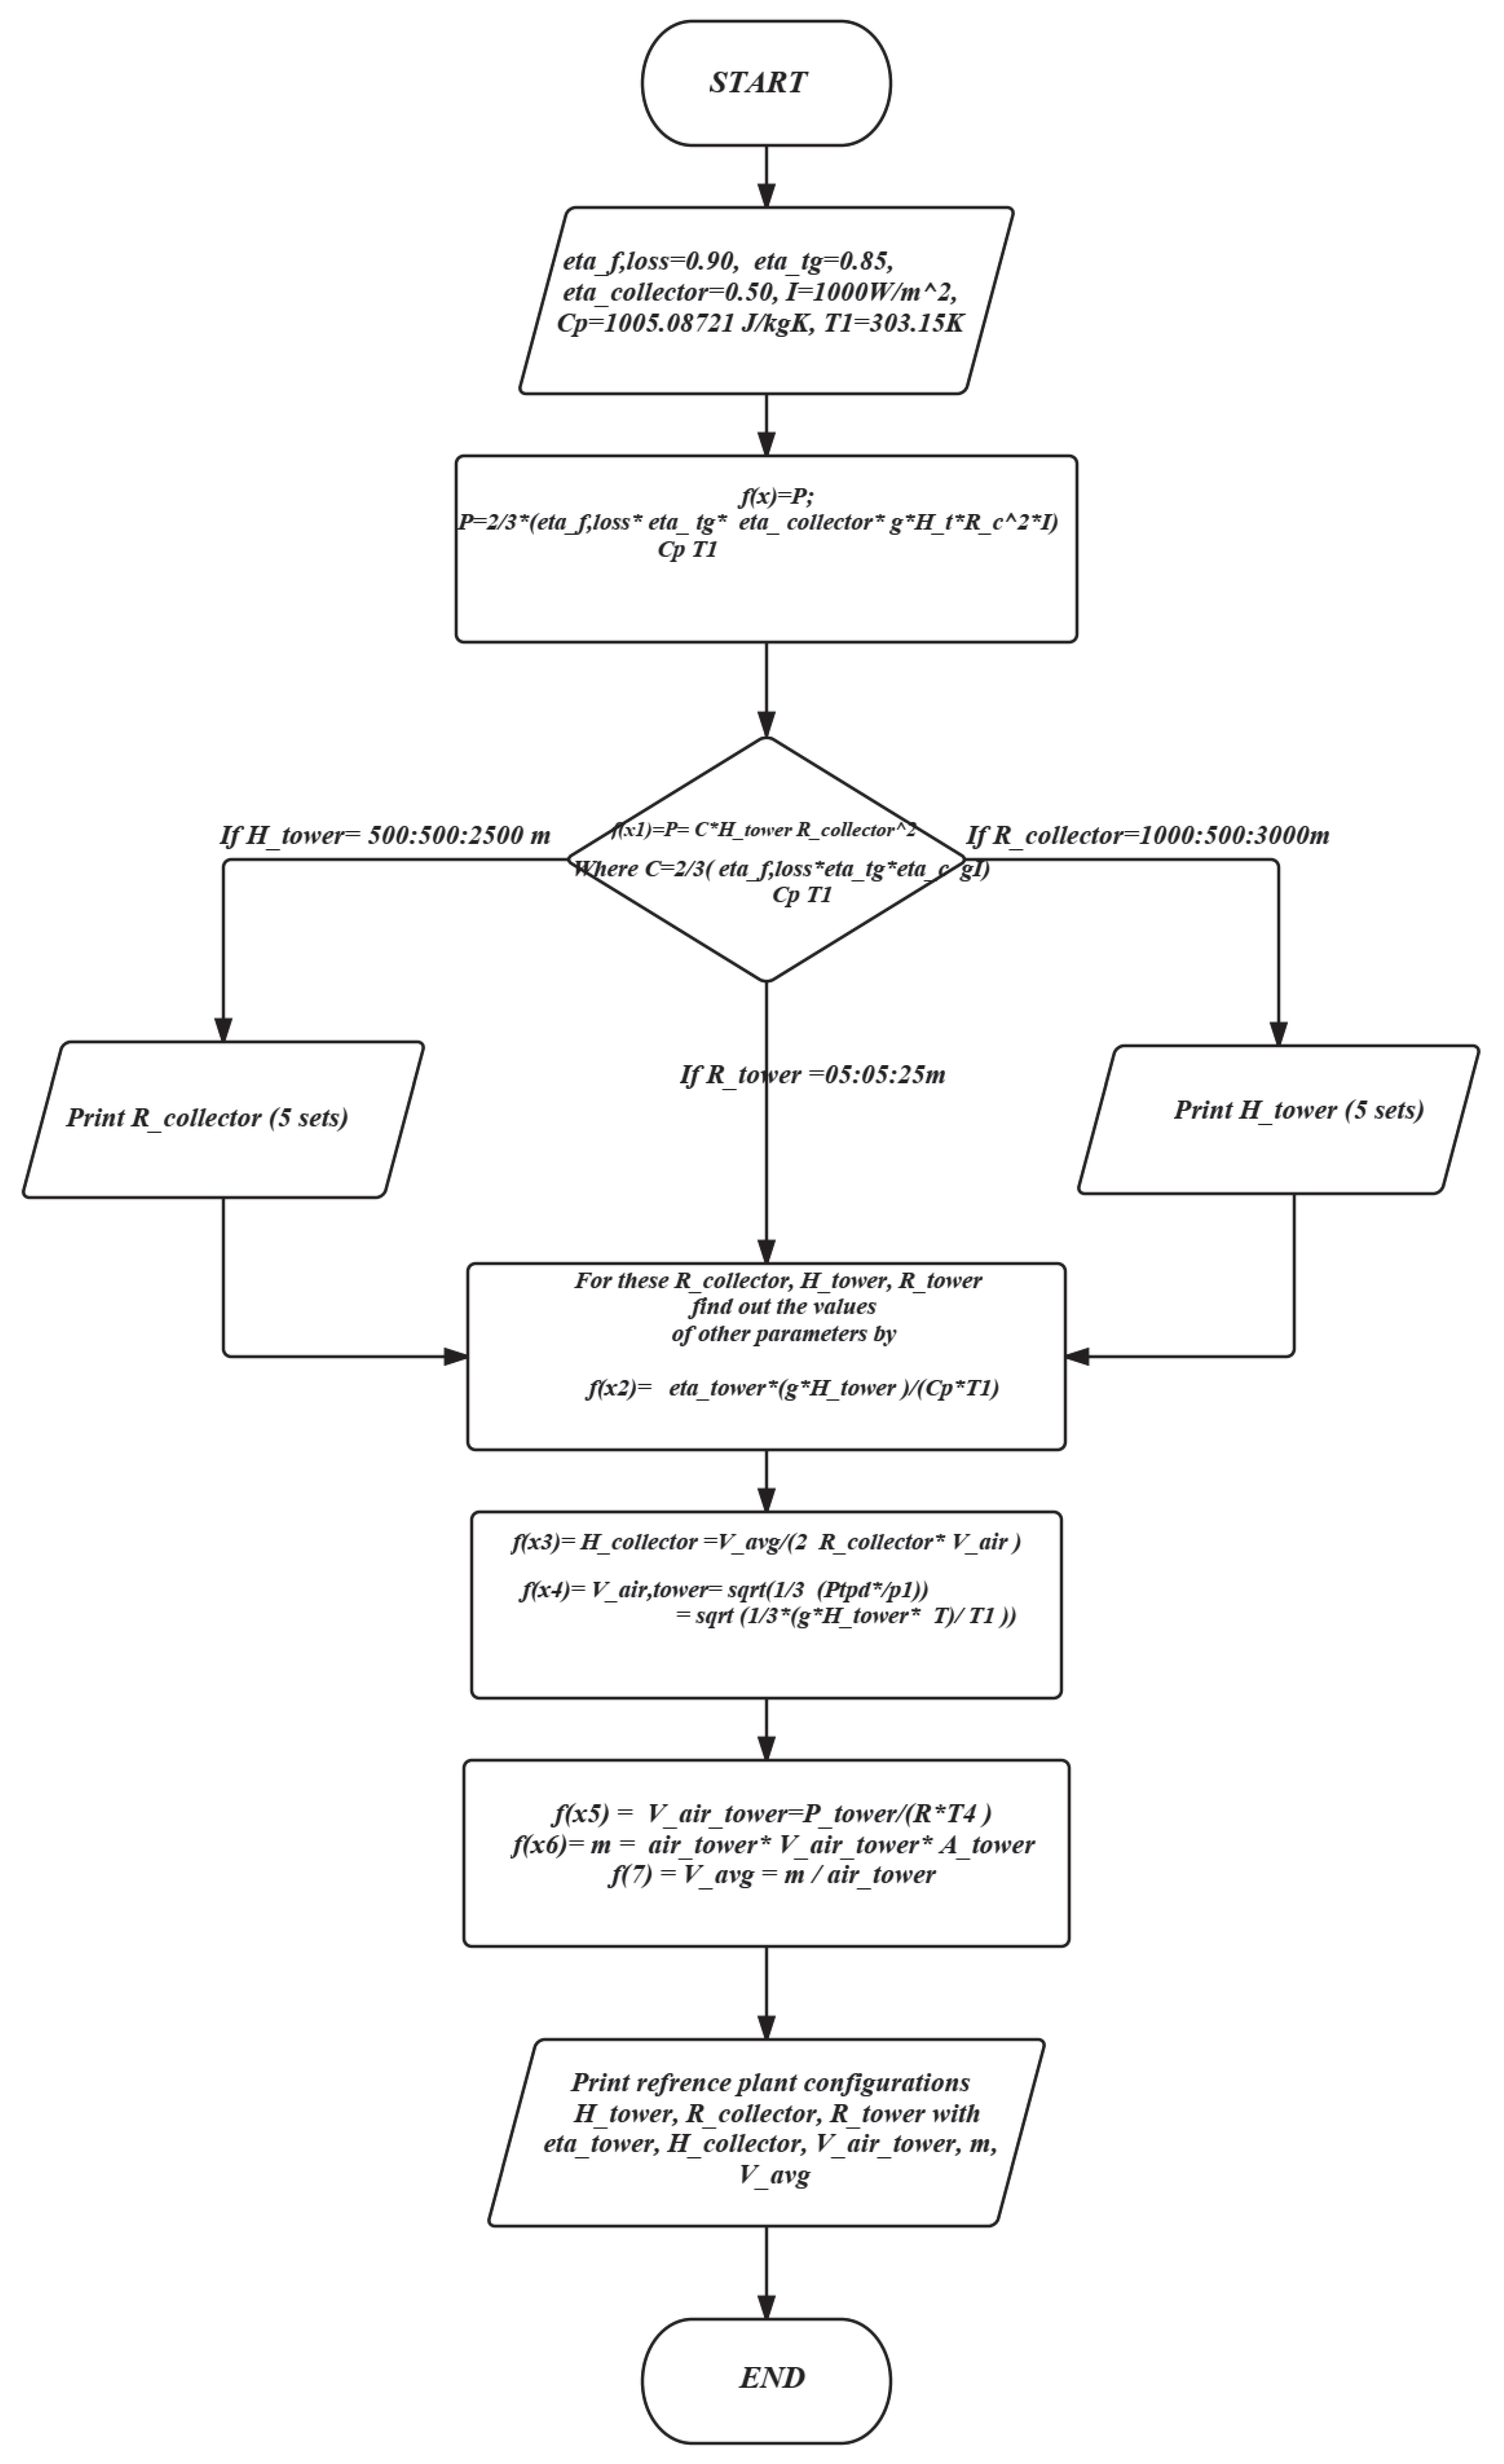
As a real experiment of this size is quite time consuming and expensive, during this preliminary phase, it ought to be capable of completing the numerical simulations to find out the optimum values of tower height (HTower), tower radius (RTower), and collector radius (RCollector) parameters by simulation and the mathematical software MATLAB. In this work, a program for an objective function is developed in MATLAB to solve the power output equations for different sets of tower height (HTower), tower radius (RTower), and collector radius (RCollector) to individually find out the optimal values of tower height (HTower), tower radius (RTower), and collector radius (RCollector) for varying power outputs, ranging from 100 MW to 200 MW by fixing other parameters. The following step is used to create a series of graphs and tables that show the relationship and trends between power output vs. tower height (HTower), power output vs. tower radius (RTower), and power output vs. collector radius (RCollector). The flow charts for the programs are shown in Figure 7 and Figure 8.

6. Results and Discussion

The thermo-dimensional optimization of the SUTPP was conducted, utilizing the findings of mathematical simulation studies and estimations for the 100–200 MW power plant model. For various sets of plant characteristics, multiple computer simulations were executed, and the outcomes were compared with the output of each individual simulated plant. The optimization technique only considered the most important plant features, while the optimization technique just considered the most essential plant parameters; mainly, the collector radius (RCollector), tower height (HTower), and tower radius (RTower). Such optimum combinations were obtained for numerous optimal plant configurations, which represent those configurations that give optimized power output for different sets of power plants. For each layout and configuration of the SUTPP, the best solutions are shown in the form of graphs and tables.

6.1. Effect of Variation in Dimensional Parameters on Power Output of SUTPP
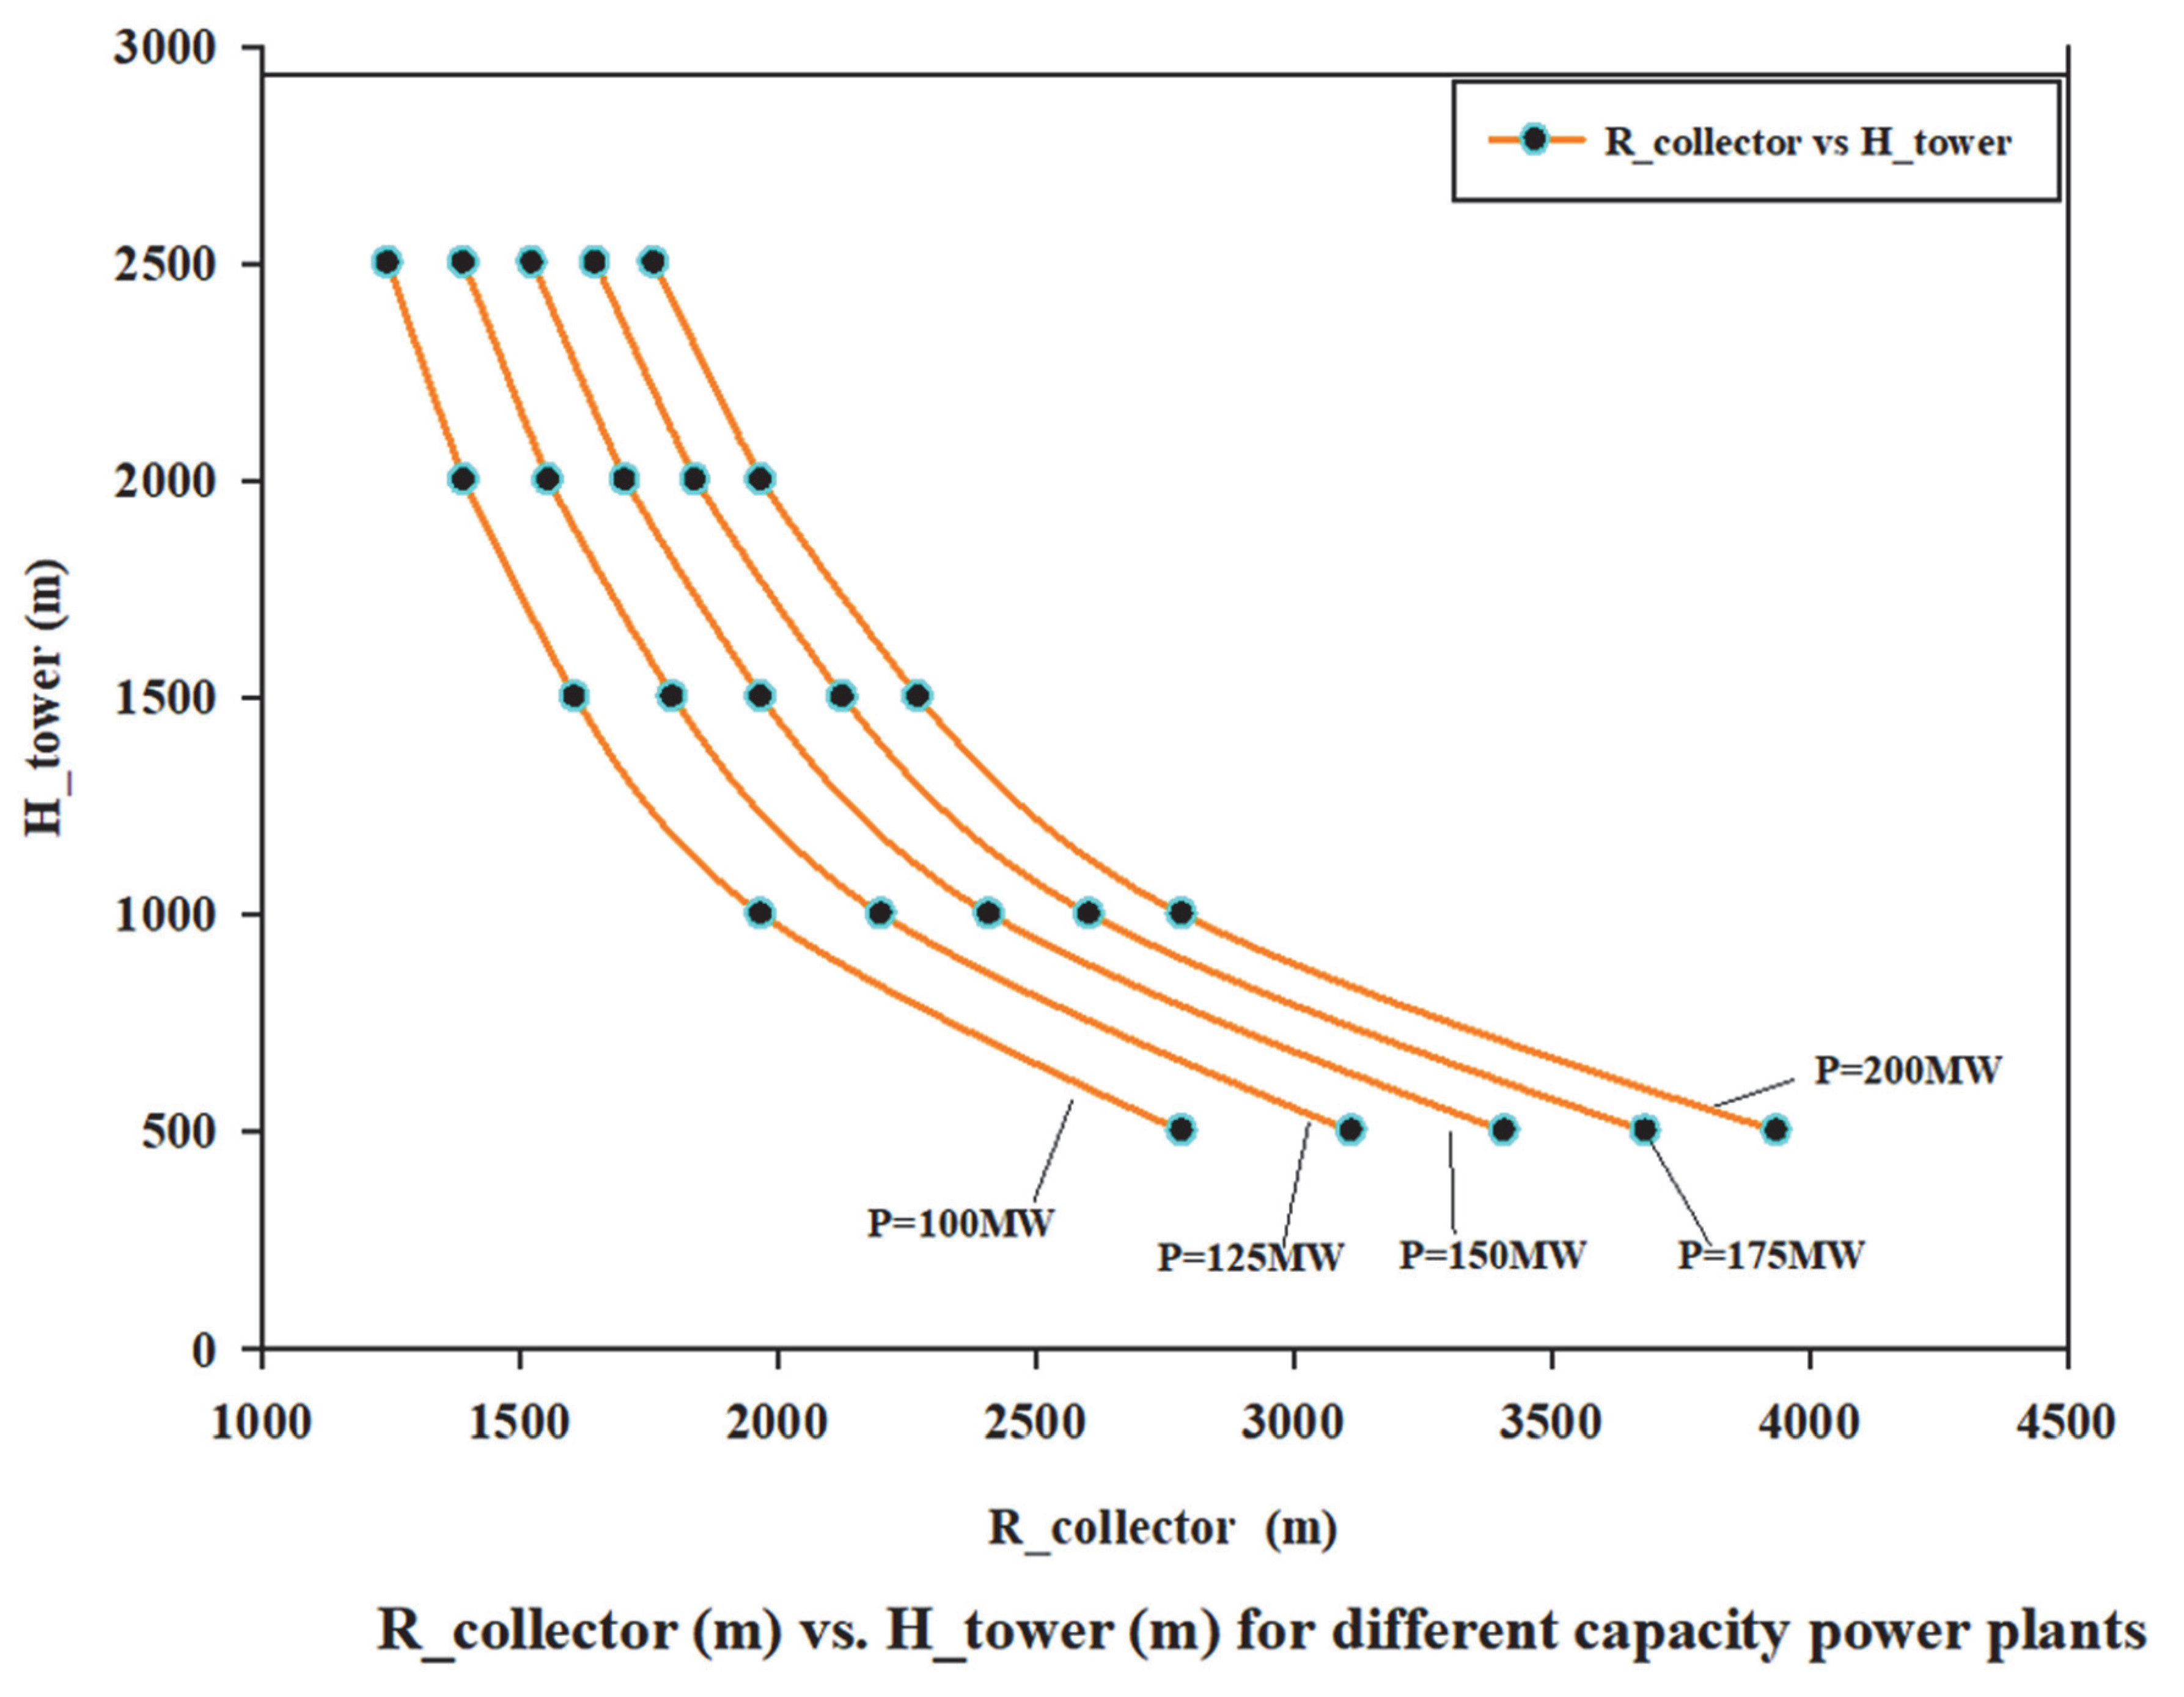
The effect of variation in SUTPP geometrical parameters, namely the collector radius (RCollector), tower height (HTower), and tower radius (RTower) on power output, are discussed in this section.
Figure 9, Figure 10, Figure 11, Figure 12 and Figure 13 show the trends for variation in SUTPP dimensional parameters, including collector radius (RCollector), tower height (HTower), and tower radius (RTower) on various power outputs. These trends are developed for the optimized dimension configurations at different power outputs; by examining these graphs, it is easy to find the best suitable configuration of the SUTPP for any desired power output.
For a fixed power output, the tower height (HTower) initially significantly decreases as the collector radius (RCollector) increases, and, after a certain point, does not have as much of an effect as the collector radius (RCollector) (Figure 9).
Figure 9. Effect of variation in collector radius (RCollector) and tower height (HTower) on power output of the SUTPP.
Energies 16 00494 g009
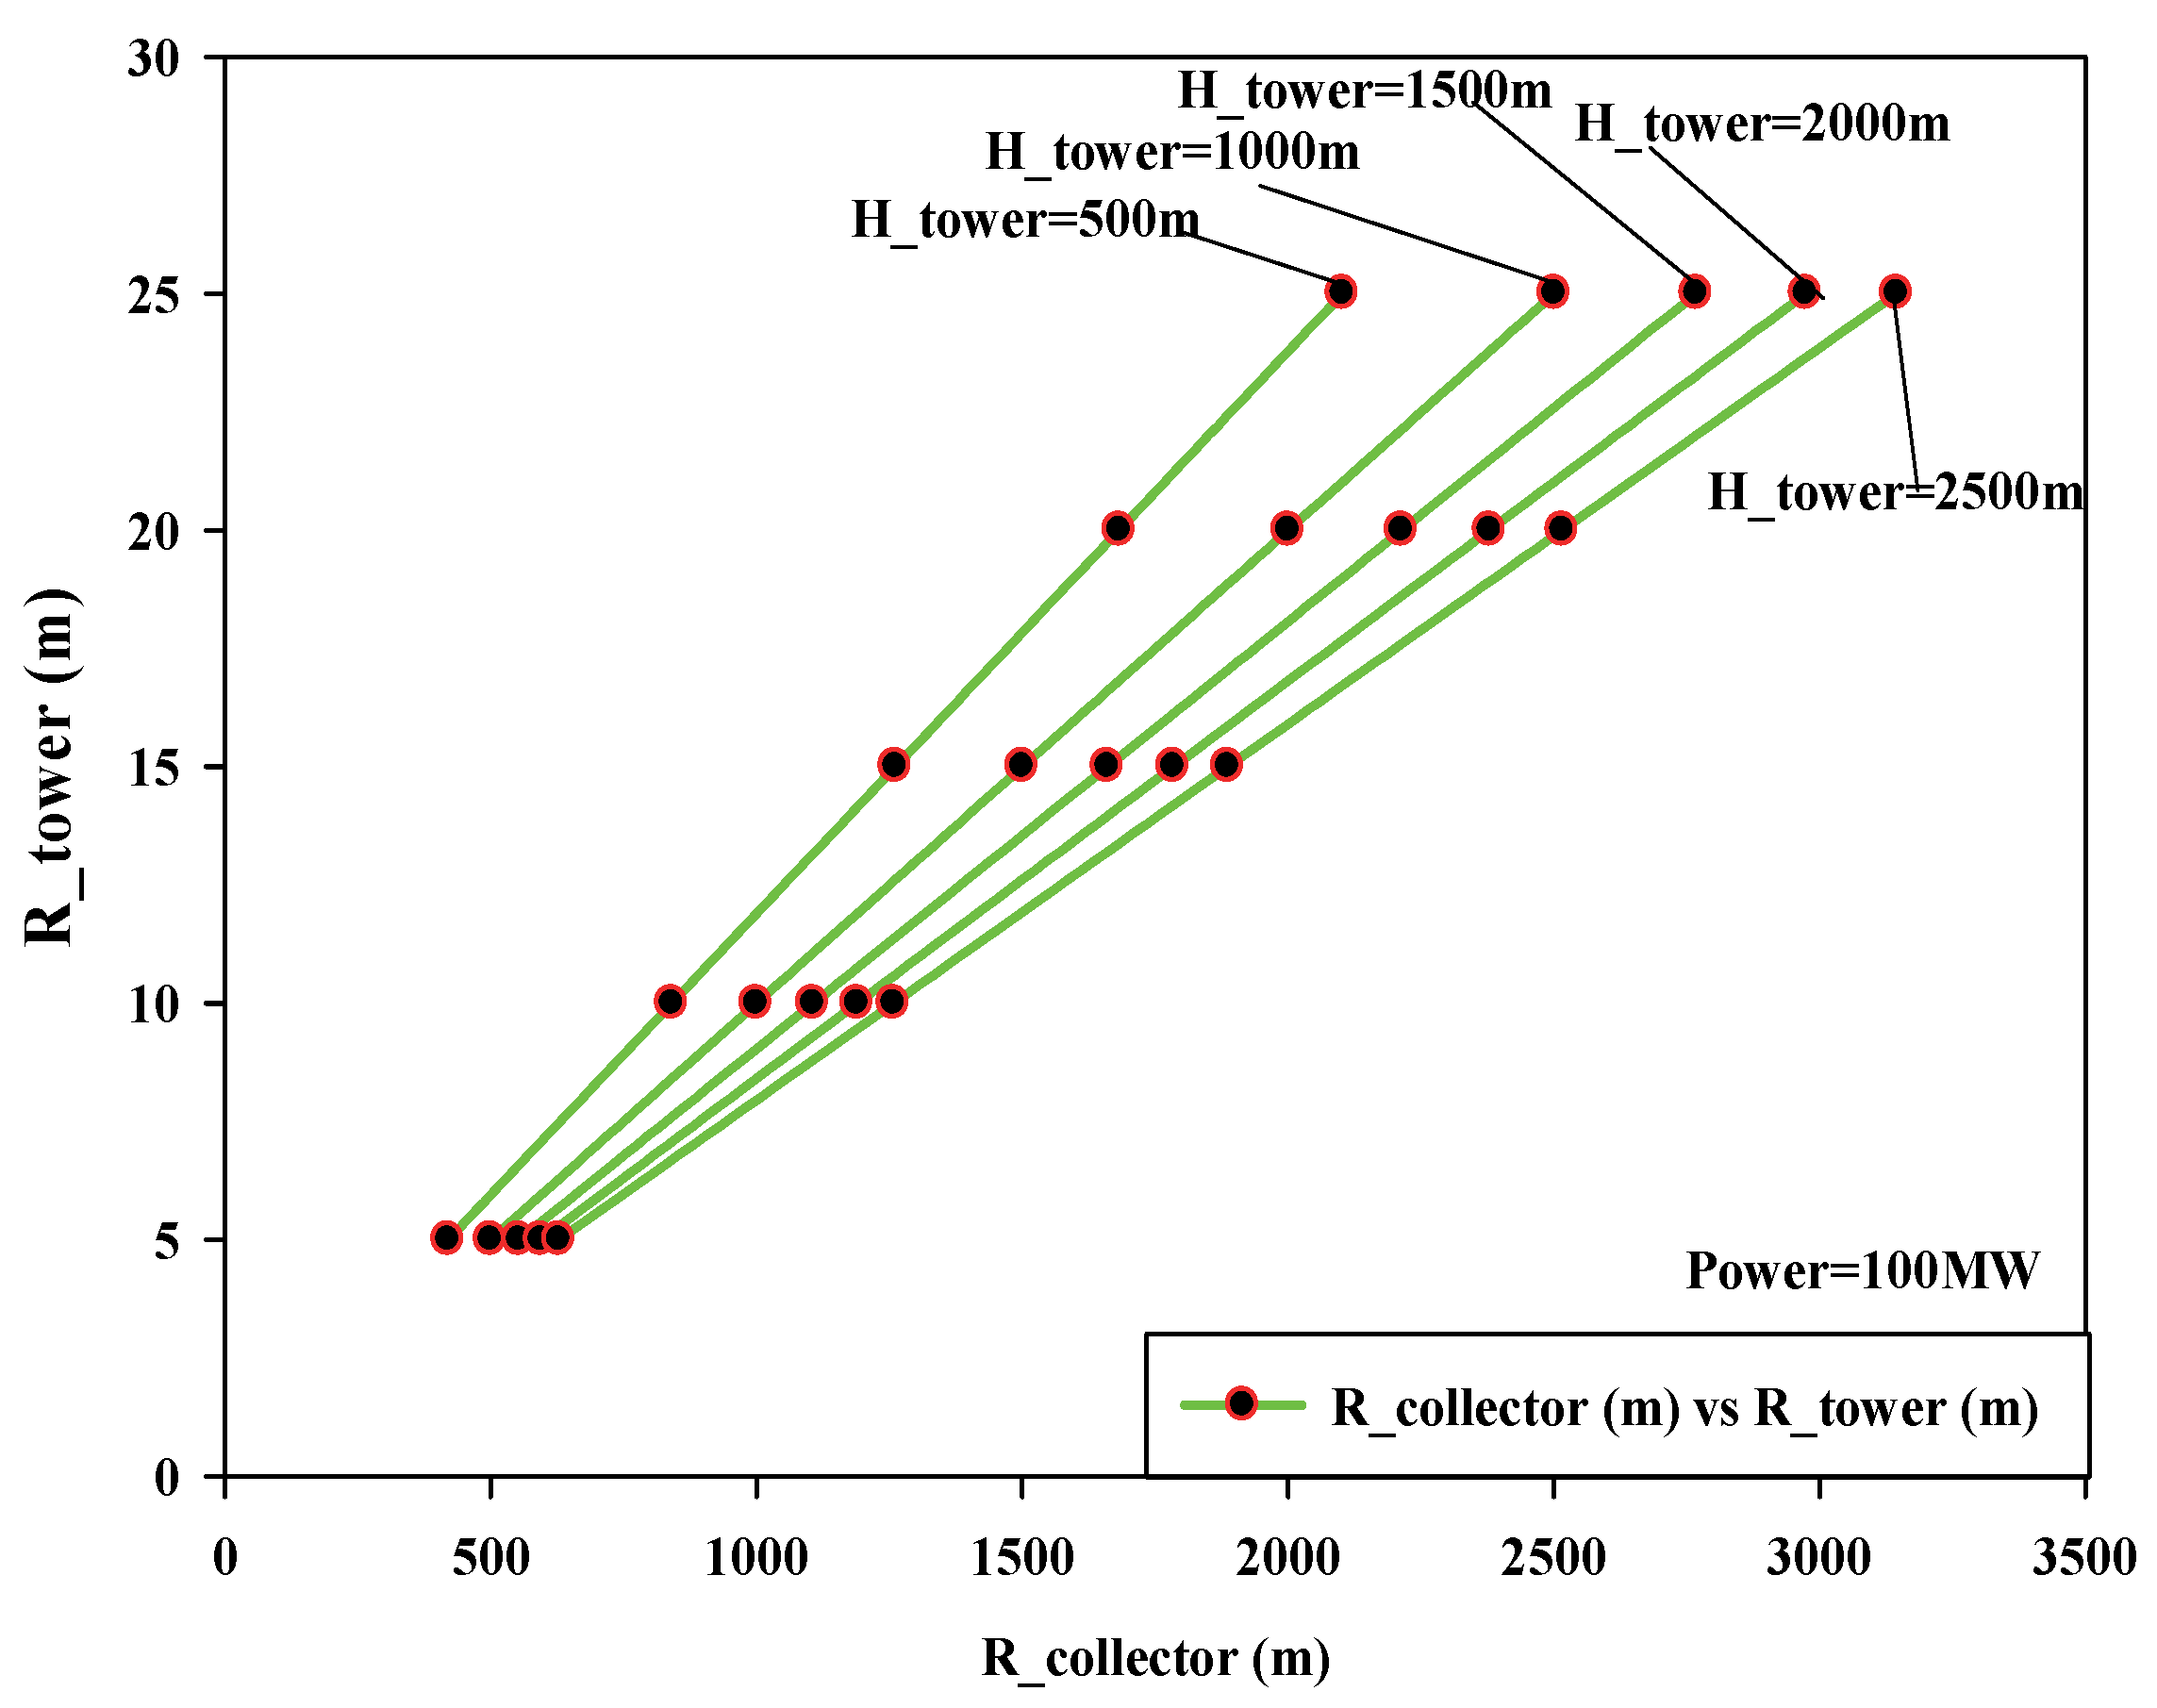
While Figure 10 shows the variation in collector radius (RCollector) and tower radius (RTower) at 100 MW SUTPP power output for different tower heights (HTower) at any fixed value of tower radius and power output, as the tower height increases, the collector radius also tends to increase in a more rapid way.
Figure 10. Effect of variation in collector radius (RCollector) and tower radius (RTower) at different tower heights (HTower) at 100 MW SUTPP power output.
Energies 16 00494 g010
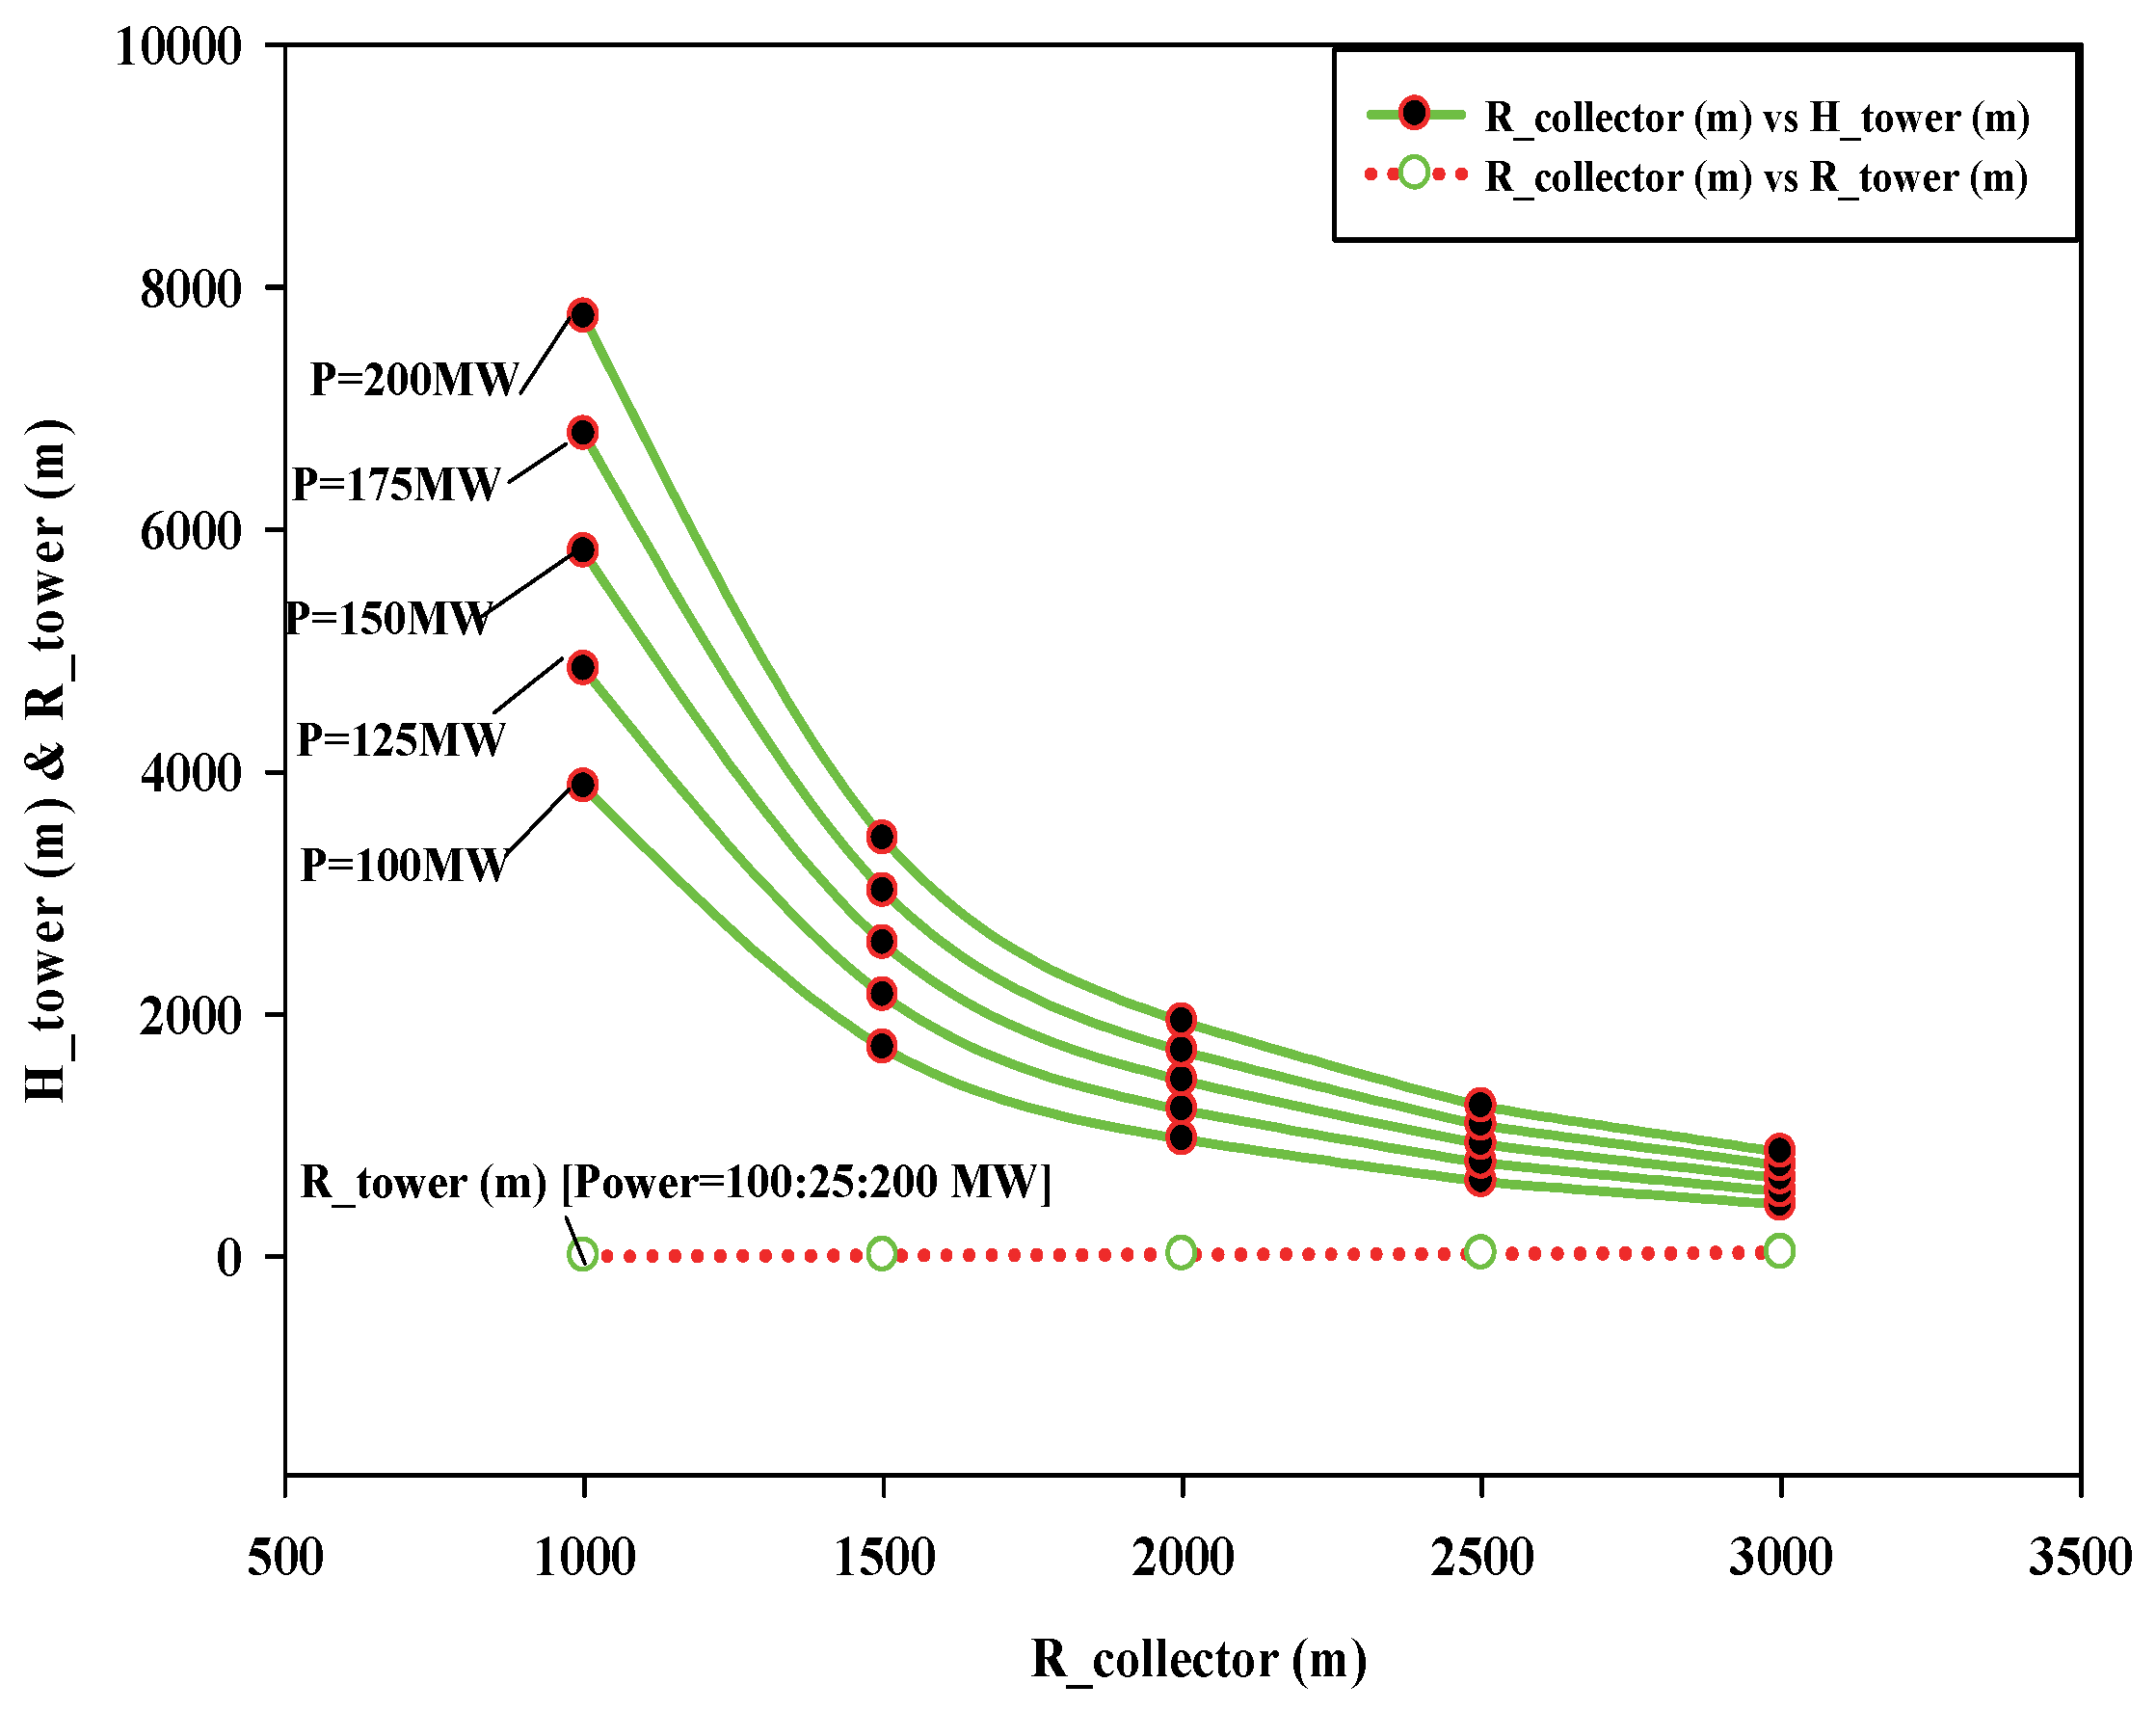
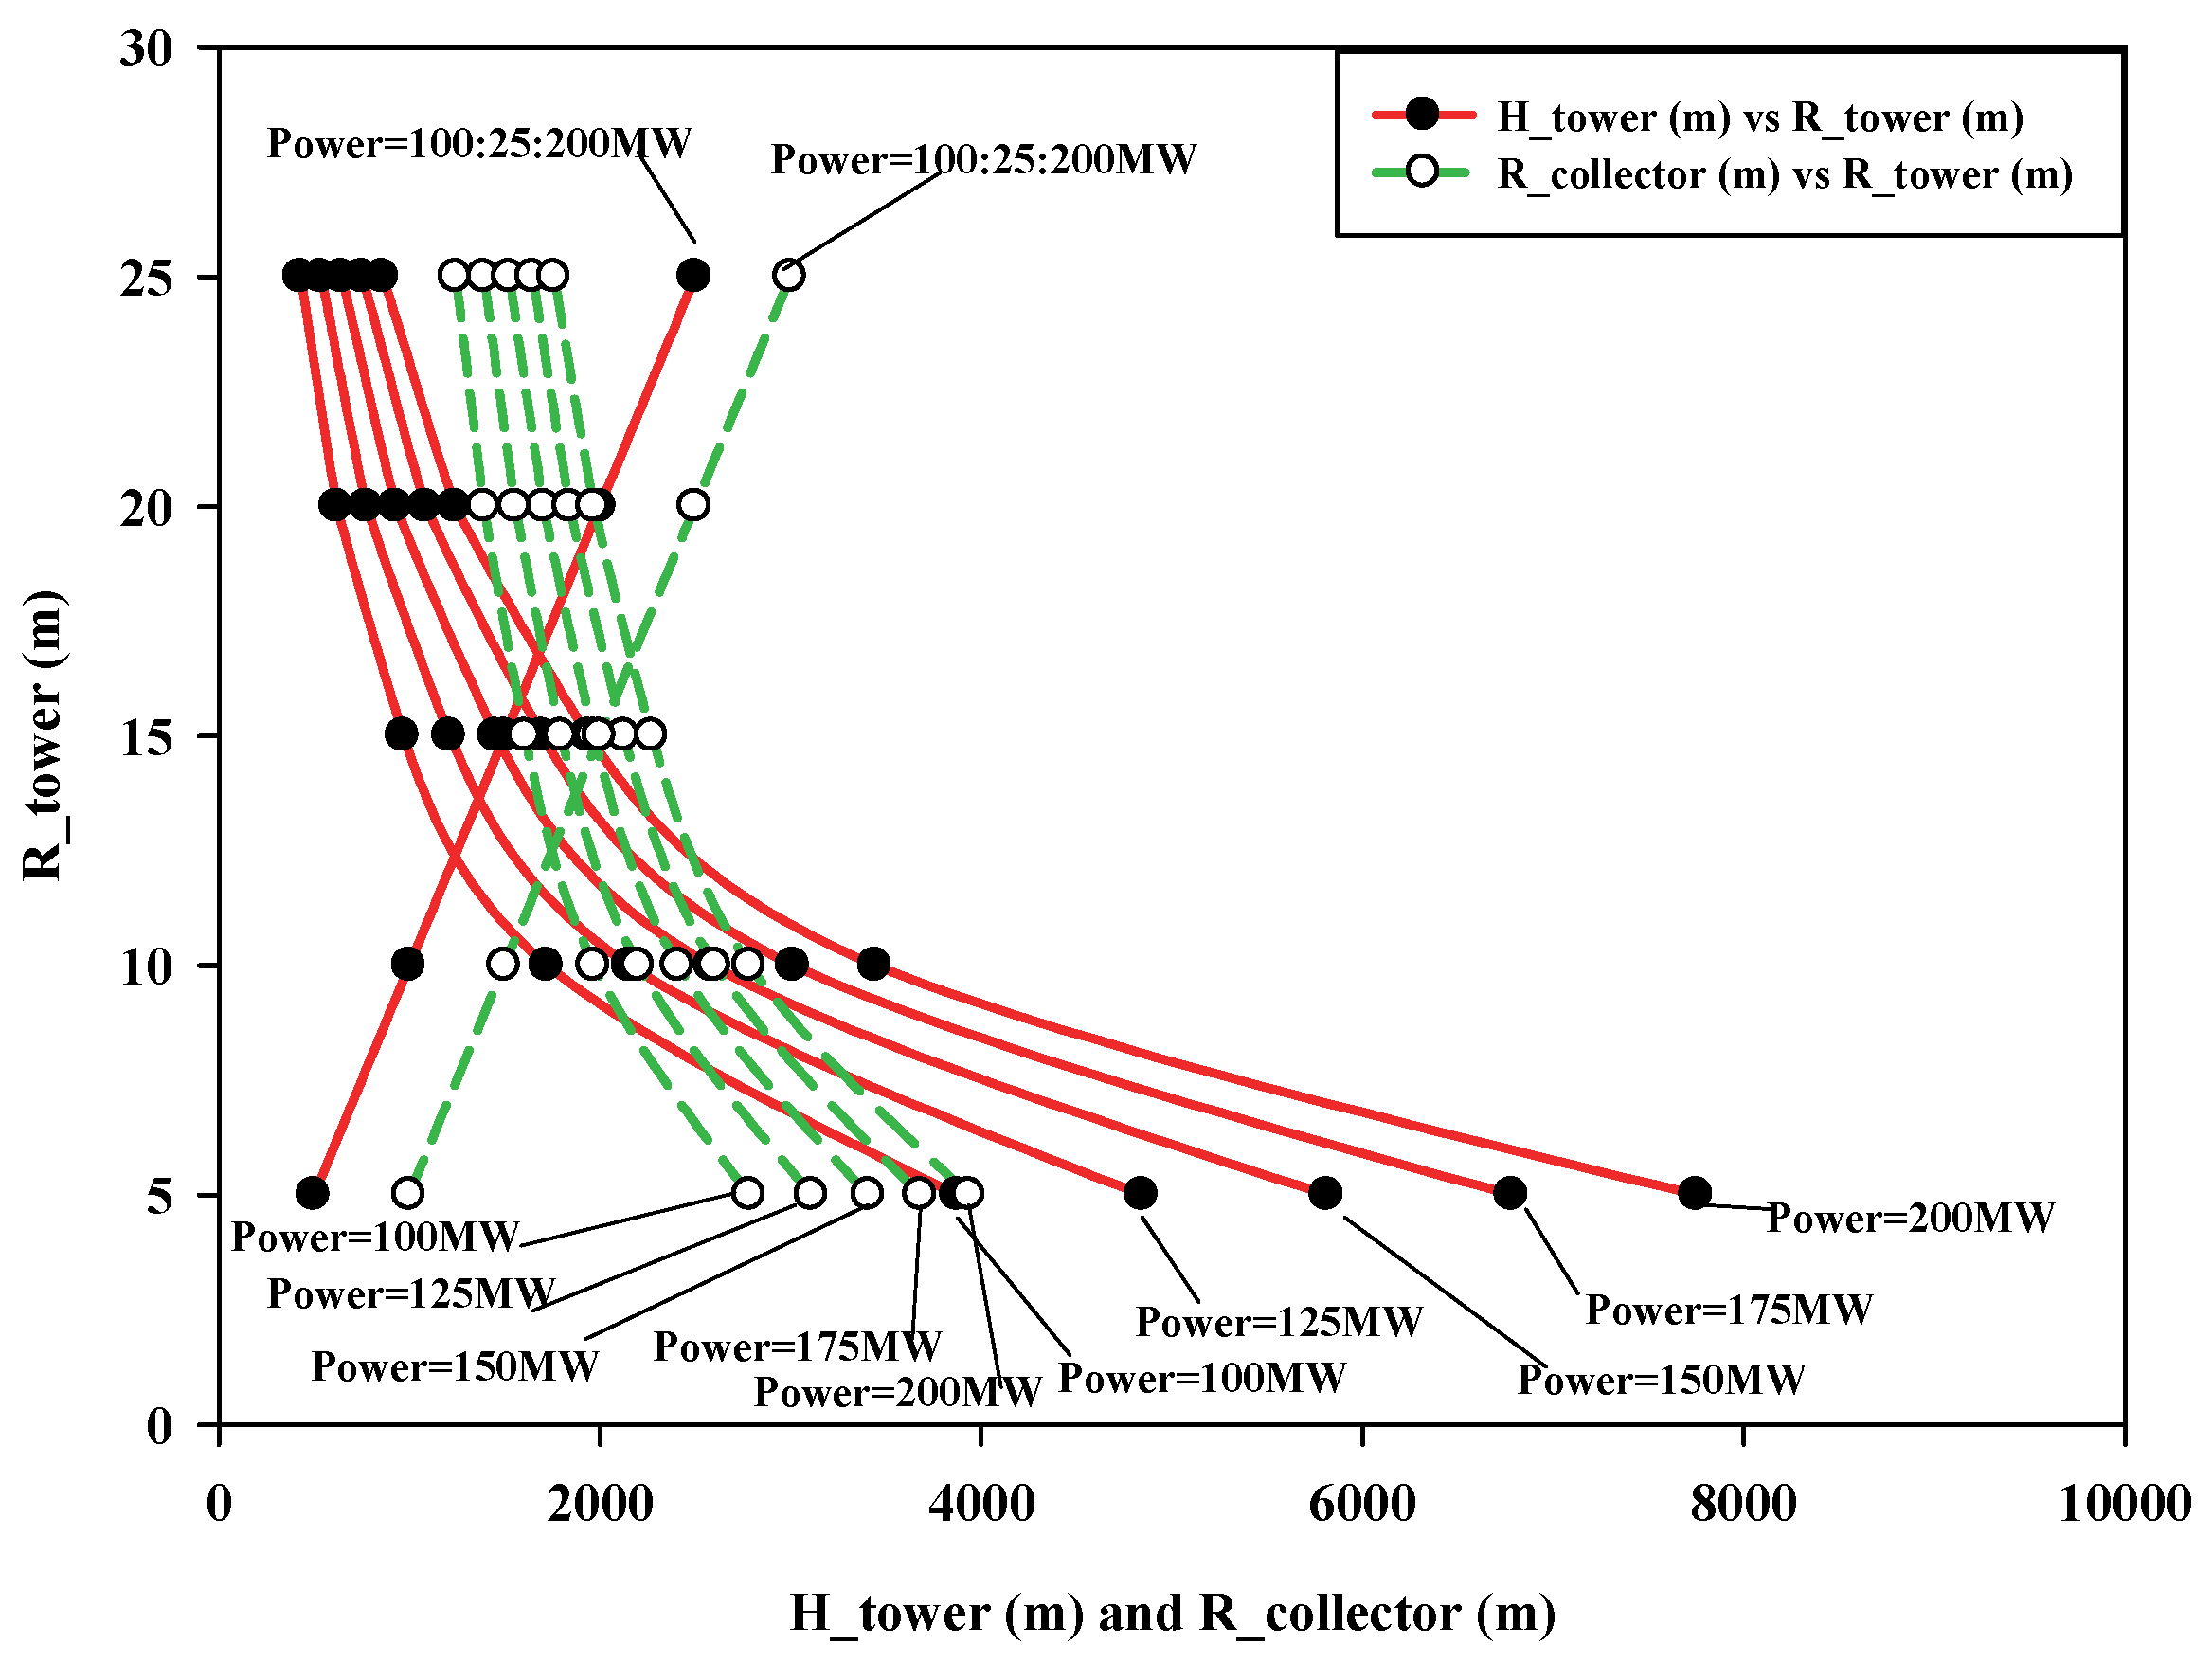
The effect of variation in collector radius (RCollector) on tower height (HTower) and tower radius (RTower) for fixed power output of the SUTPP is shown in Figure 11. Trends suggest that as the collector radius (RCollector) starts increasing, the values of tower height (HTower) and tower radius (RTower) significantly decrease, giving influence to the initial increase in the collector radius (RCollector) at a fixed value of power output. Figure 12 also suggests a similar trend for the variation in tower height (HTower) on the collector radius (RCollector) and tower radius (RTower) for the fixed power output of the SUTPP, but with less of a slope.
Figure 11. Effect of variation in collector radius (RCollector) on tower height (HTower) and tower radius (RTower) for fixed power output of SUTPP.
Energies 16 00494 g011
Figure 12. Effect of variation in tower height (HTower) on collector radius (RCollector) and tower radius (RTower) for fixed power output of SUTPP.
Energies 16 00494 g012
While Figure 13 shows the effect of tower height (HTower) and collector radius (RCollector) on tower radius (RTower) for the fixed power output of the SUTPP, trends suggest that as the tower height (HTower) increases, the dimensional values of the collector radius (RCollector) on the tower radius (RTower) significantly decrease for a fixed power output.
Figure 13. Effect of variation in tower height (HTower) and collector radius (RCollector) on tower radius (RTower) for fixed power output of SUTPP.
Energies 16 00494 g013

6.2. Effect of Variation in Power Output on SUTPP Dimensional Parameters

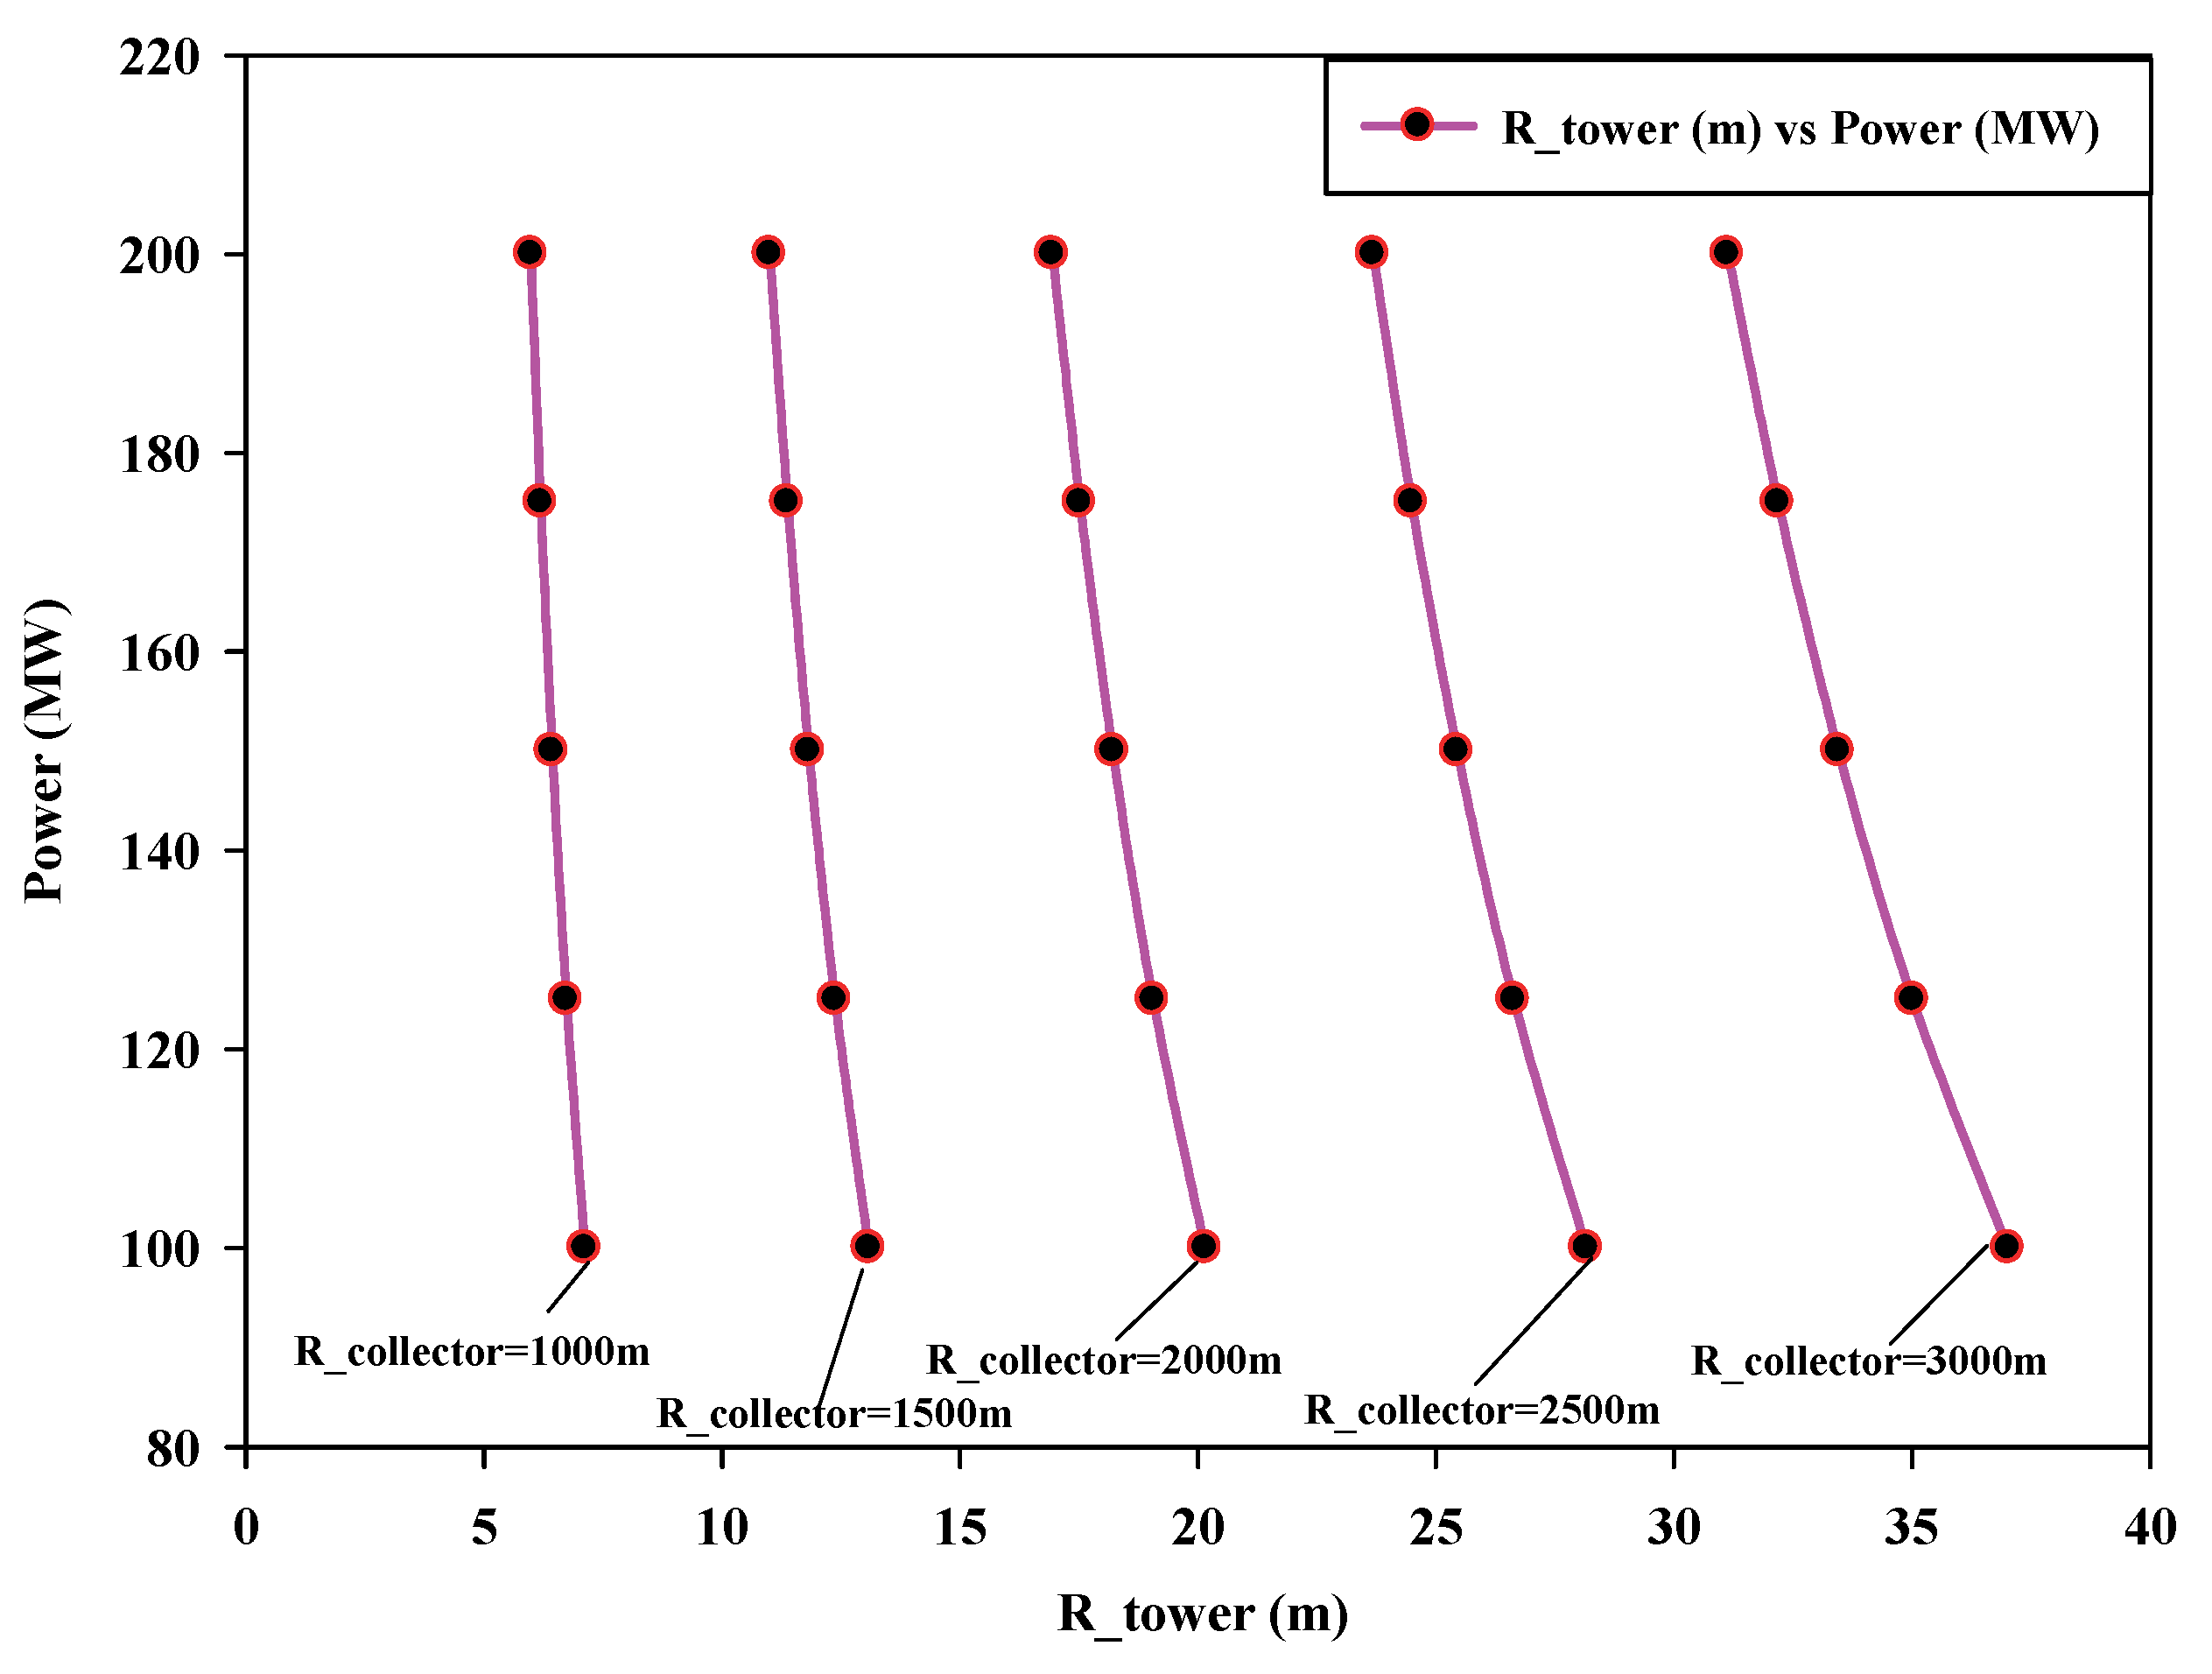
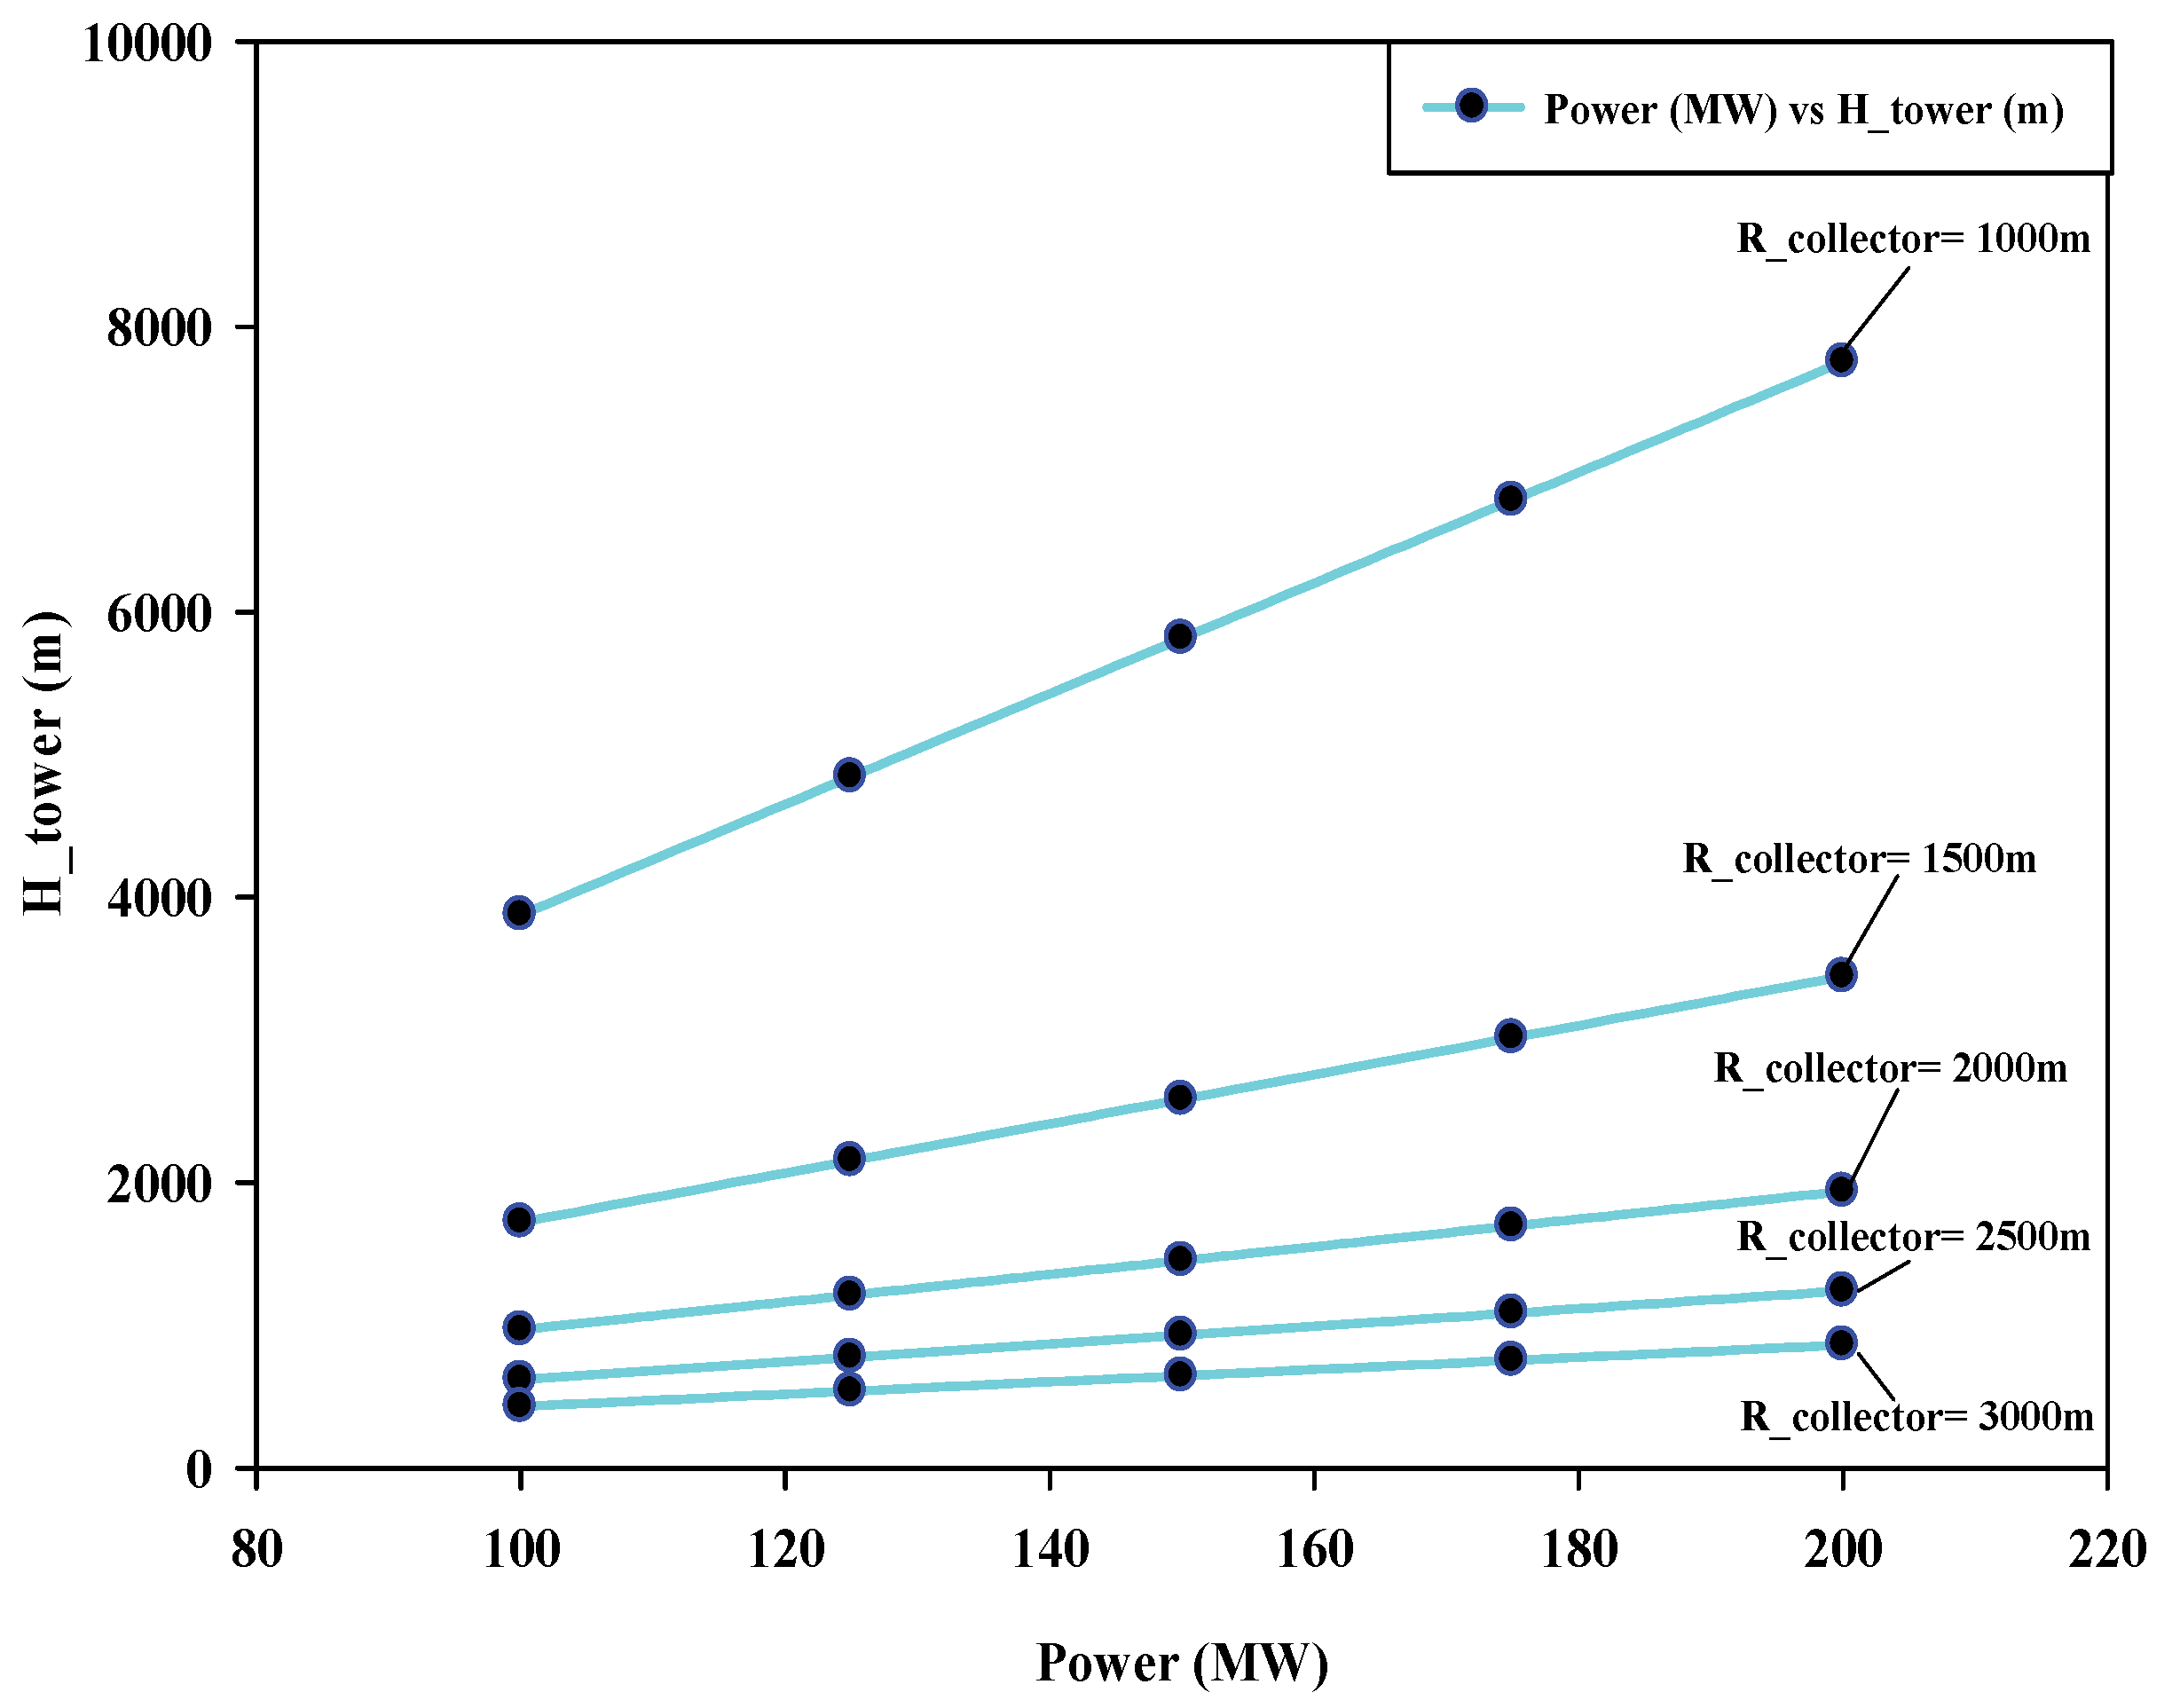
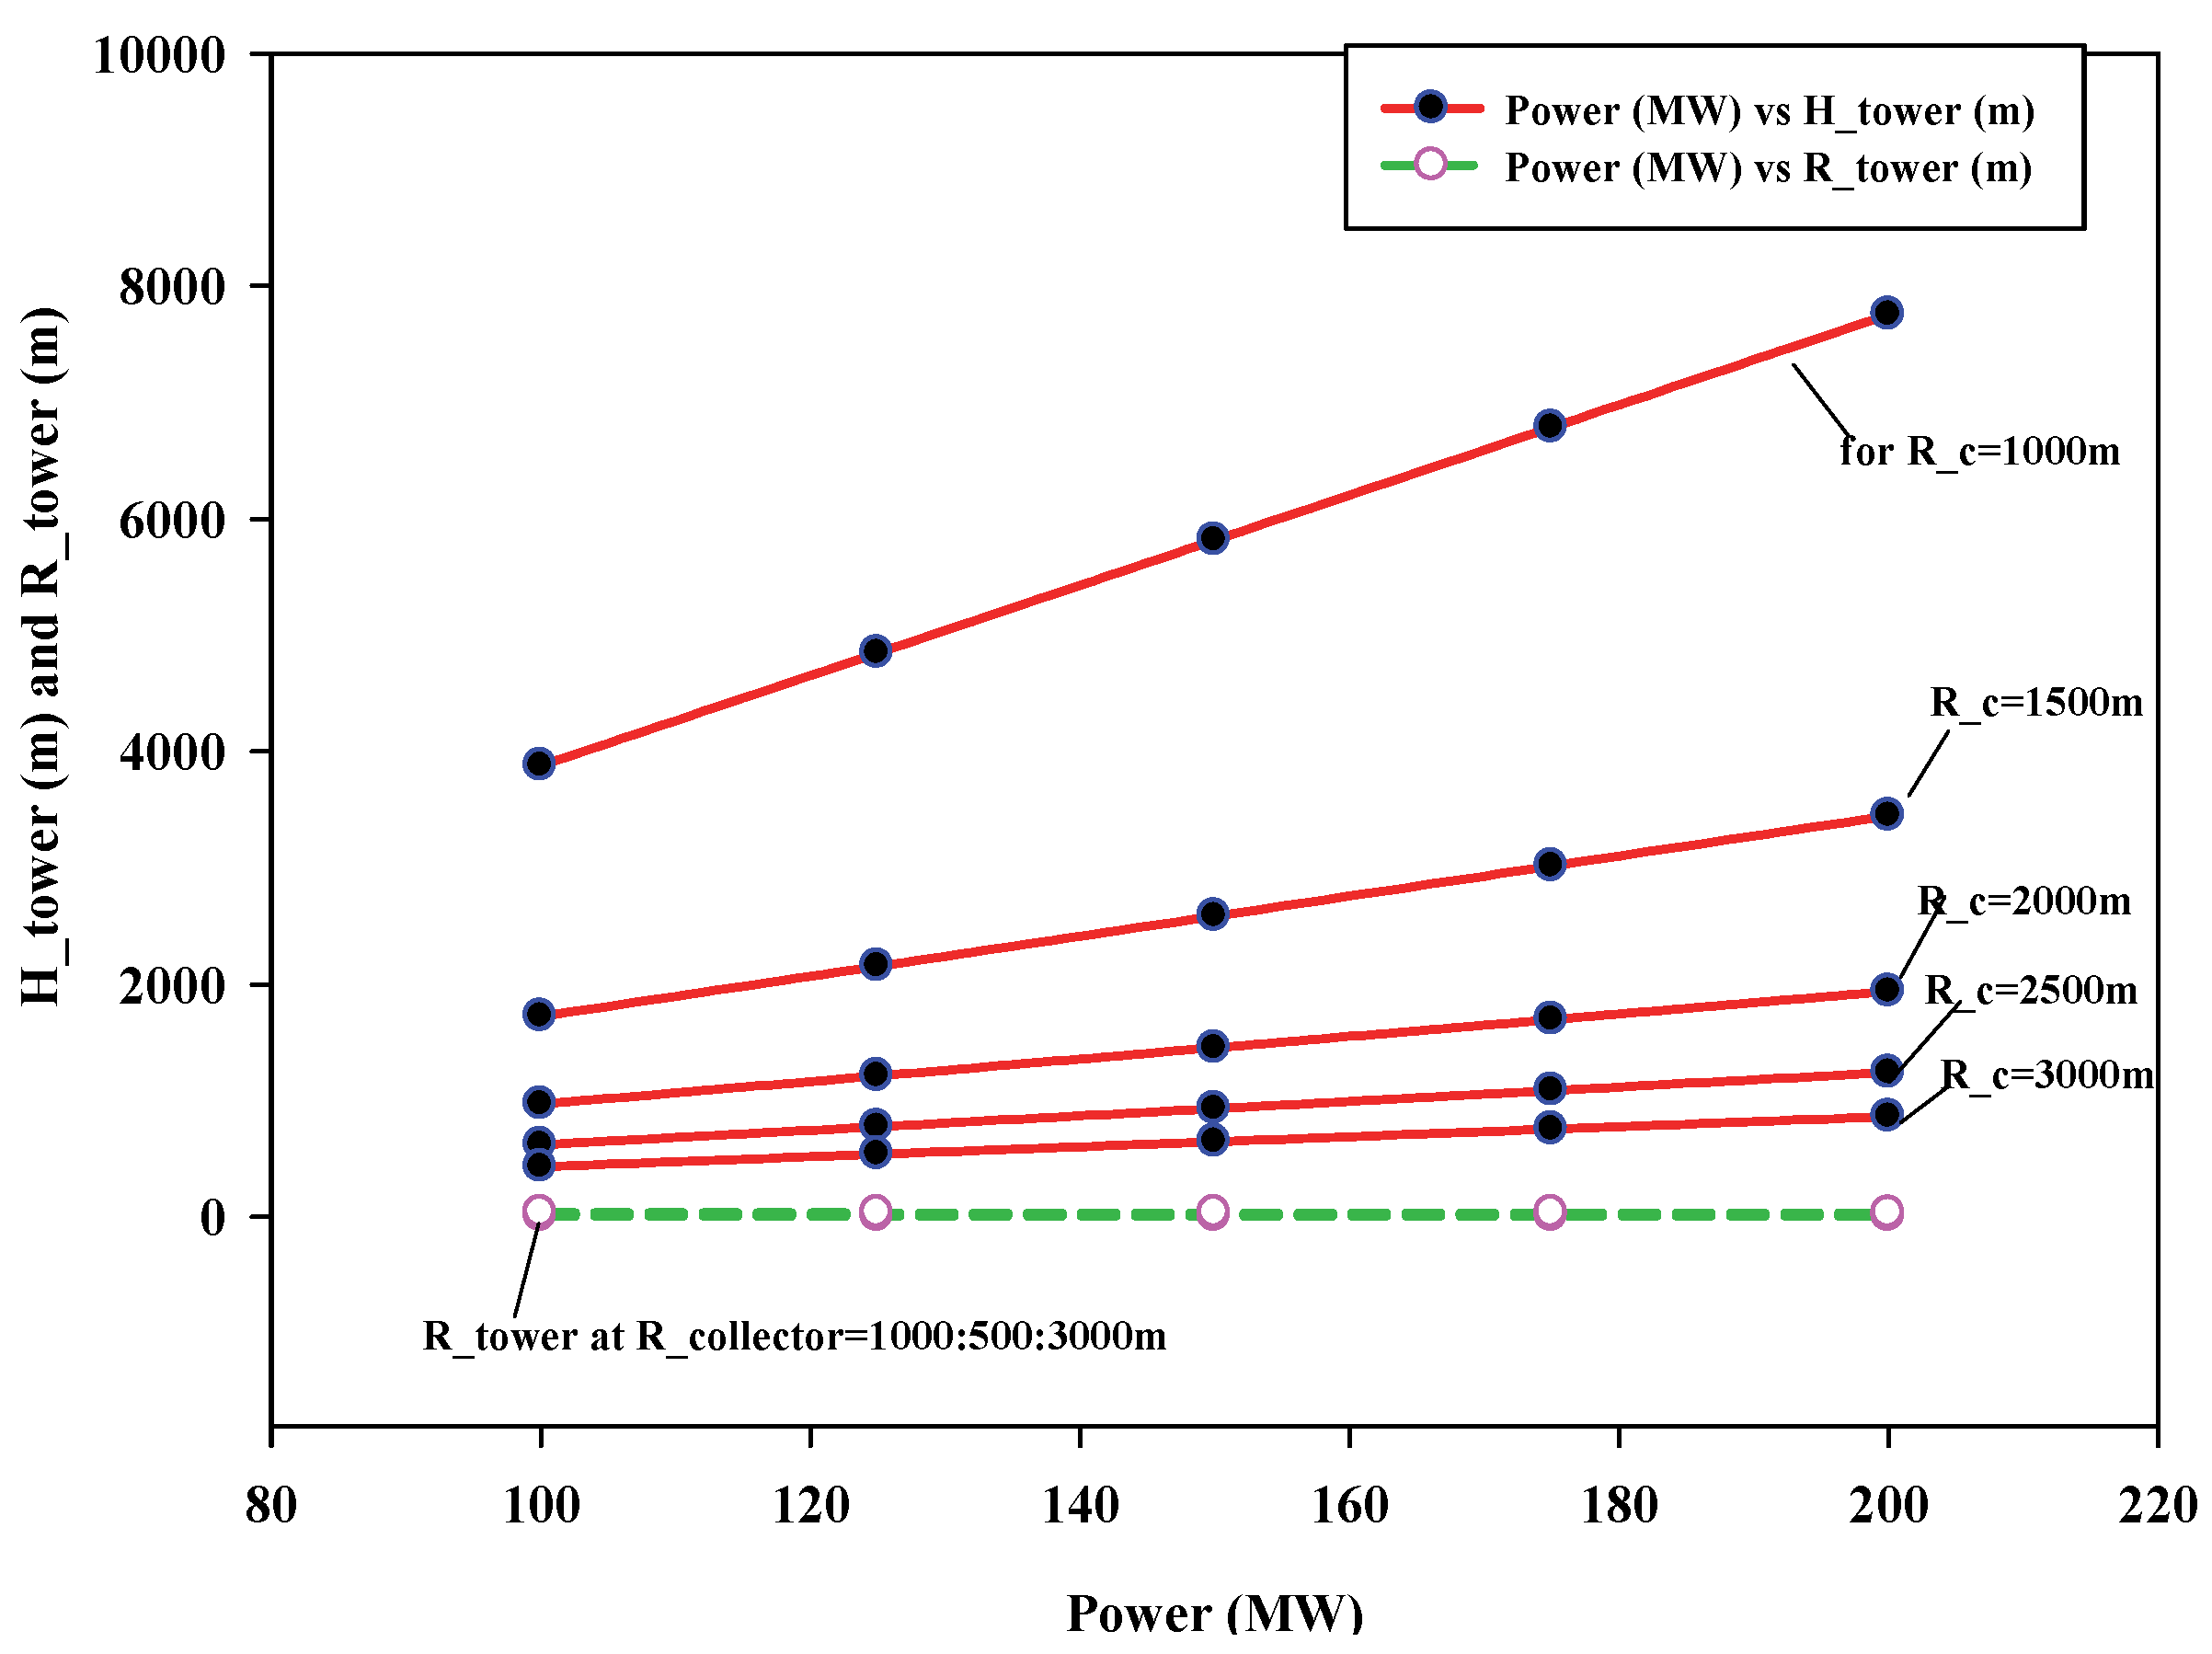
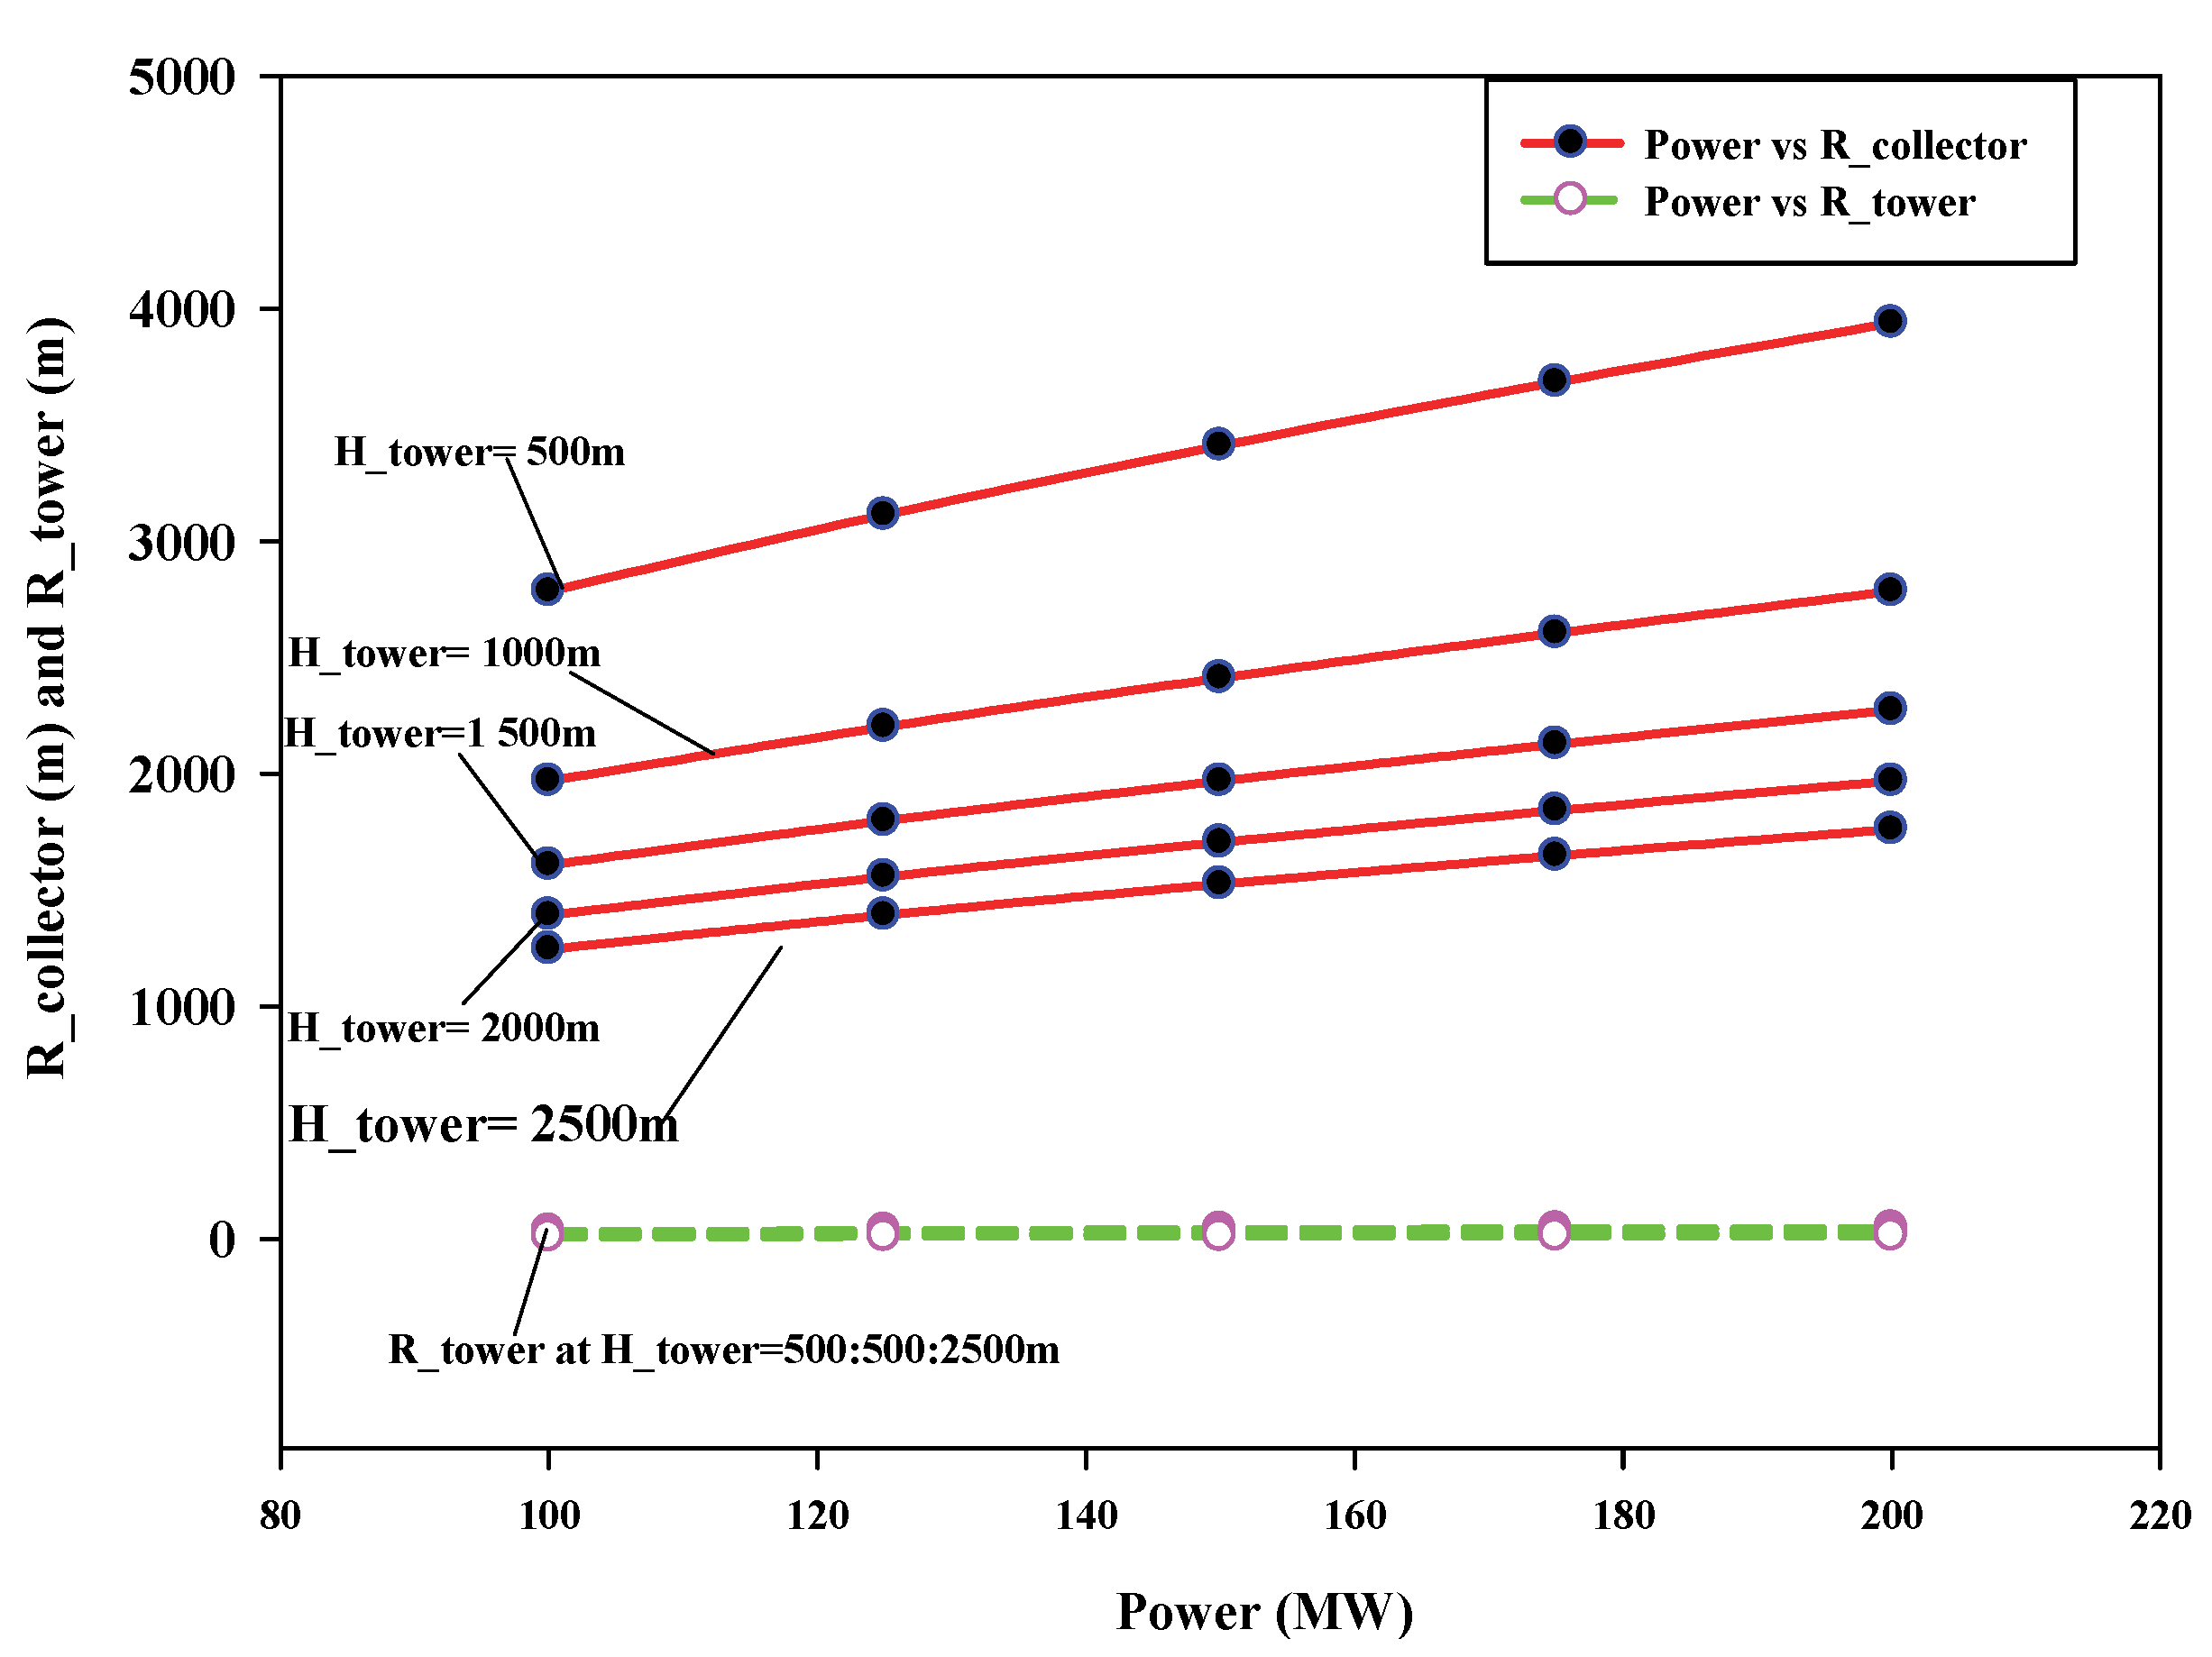
The graphs were redrawn to analyze the effect of variation in power output on the dimensional parameters of the SUTPP in order to better understand and improve the readability of the article. Figure 14, Figure 15, Figure 16, Figure 17, Figure 18 and Figure 19 show trends between variations in the SUTPP power output and dimensional parameters, such as tower height (HTower), collector radius (RCollector), and tower radius (RTower), both separately and combined. These graphs show the optimized values of dimensions for different plant configurations and provide help to the designer in selecting optimized values.

7. Conclusions

The major findings of this study include detailed modeling of a reference Solar Updraft Tower Power Plant to examine the influence of the most prominent plant dimensional parameters, including: collector radius (RCollector), tower height (HTower), and tower radius (RTower) with dimensional limits and intervals on the power output of the SUTPP. The modeling includes thermodynamic relations for estimating the power output of the SUTPP and the effect of variation in dimensional parameters. The major findings include:
  • In a SUTPP for a fixed power output of 100 MW and with a variation in collector radius (RCollector) range from 1000 m to 3000 m, the tower height (HTower) varies from 3876.7 m to 430.7 m with a variation of 88.89%, while the change in the tower radius (RTower) takes place between 7.1 m and 37.0 m with a variation of 80.81%, respectively.
  • Similarly, for a fixed power output of 100 MW and with a variation in tower height (HTower) ranging from 500 m to 2500 m, the collector radius (RCollector) varies from 2784.5 m to 1245.3 m with a variation of 55.27%, and the change in the tower radius (RTower) takes place between 33.1 m to 9.9 m with a variation of 70.09%, respectively.
  • The results of the assessment show that the suggested geometrical parameters have a significant impact on the overall performance of the SUTPP. The amount of solar radiation and the suggested geometric parameters can also affect the SUTPP’s efficiency and power output.
  • Large flat lands like Udat, Rajasthan, India, with position coordinates of 27°35′ and 72°43′, can be used for the installation of the SUTPP with a power output of 100 MW or an equal amount in a physically possible dimensional configuration and can be constructed through current available technologies.
This work will provide designers with guidelines and assistance in selecting optimized plant configurations for desired power output, as well as assist them in investigating the feasibility of implementing a large-scale solar updraft tower power plant in India with local ground conditions.

8. Limitation and Future Scope

In the SUPTPP modeling, the influences of cold inflow in the tower, the effects of wind velocity, ambient temperature lapse rates, the effect of ground thermal conductivity, and night-time temperature inversions on plant performance were not considered in this study. During the selection of parameter combinations, this may result in the SUTPP ceasing to operate. Findings suggest that the dominating ambient winds and occurrence of night temperature changes at the reference location have a significant impact, which can reduce annual power output by around 10% in comparison to a similar plant operating year-round in a windless environment. For improvement in plant performance, a study of partially or fully double-glazed collector roofing could be included in the modeling for full-day power output. To solve this problem, the goal function of the ideal plant layout had to be changed to account for these differences.
In future work, the calculation for SUTPP power output could be fixed by using different performance parameters. Larger plants always produce more electricity, according to thermo-dimensional modeling. Any power optimization method that does not consider economic aspects will produce optimal plant sizes near the top of the range. Therefore, for that, no optimal size of SUTPP exists. Adding economic aspects allows for optimal plant layouts. In this study, the three major plant performance parameters were collector radius (RCollector), tower height (HTower), and tower radius (RTower) for various power outputs, while other factors also have a major impact on power output and performance of a SUTPP. A new study on these parameters can be conducted in a similar area to identify their impact on the power output and performance of a SUTPP. Factors affecting the cost of a SUTPP can be examined for the Optimized Cost of Electricity Generation (OCEG) calculation as per a specific location, while considering the effect of the minimum attractive rate of return (MARR) on SUTPP electricity selling prices.

Author Contributions

The main contributions of the authors are as follows: conceptualization: V.P.S. and G.D.; methodology: V.P.S. and G.D.; structuring of paper: V.P.S. and G.D.; investigation and data collection: V.P.S. and G.D.; resources: V.P.S. and G.D.; data curation: V.P.S. and G.D.; writing—original draft: V.P.S.; writing—review and editing: V.P.S. and G.D.; visualization: V.P.S. and G.D.; supervision: V.P.S. and G.D.; project administration: V.P.S. and G.D. All authors have read and agreed to the published version of the manuscript.

Funding

This research received no external funding.

Data Availability Statement

Not applicable.

Conflicts of Interest

The authors declare no conflict of interest.

Nomenclature

Symbols:Subscripts:
A: Area, (m2)a: Ambient
Cp: Specific heat capacity, J/(kg K)avg: Mean/average
g: gravitational acceleration, (m/s2)collector: Collector
h: Convective coefficient of heat transfer, (W/m2K)g: Ground
H: Tower height, (m) f: Friction factor
I: Average Insolation, (W/m2)h: Hydraulic
L: Duct length, (m)s: Smooth
m ˙ : Mass flow rate, (kg/s)Support: Fram support
P: Pressure, (Pa); Power, (W)turbine: Turbine
q: Heat transfer, (m)tg: Turbine-Generator
r: radious, (m)th: Thermal
R: Universal gas constant, (J/mol-K); Radious, (m)max.: Maximum
T: Temperature, (K)t: Tower
V: Volume flow rate, (m3/sec)v: Volume
W: Duct width, (m) z: Elivation
Greek symbols:Abbreviations:
Δ: Drop, gradientSUTPP: Solar updraft tower power plant
η: EfficiencyHTVTS: Horizontal to vertical transition section
v : air velocity (m/s)DALR: Dry Adiabatic Lapse Rate
τ : Dynamic viscosity (Pa·s)PCU: Power Conversion Unit
θ: collector slop (o)TG: Turbine Generators
ρ : density of air (kg/ m3)

References

  1. Trieb, F.; Langniß, O.; Klaiß, H. Solar electricity generation—A comparative view of technologies, costs and environmental impact. Sol. Energy 1997, 59, 89–99. [Google Scholar] [CrossRef]
  2. Saini, M.; Sharma, A.; Singh, V.P.; Jain, S.; Dwivedi, G. Solar Thermal Receivers—A Review. Lect. Notes Mech. Eng. 2022, 2, 1_25. [Google Scholar] [CrossRef]
  3. Das, P.; Chandramohan, V.P. A review on solar updraft tower plant technology: Thermodynamic analysis, worldwide status, recent advances, major challenges and opportunities. Sustain. Energy Technol. Assessments 2022, 52, 102091. [Google Scholar] [CrossRef]
  4. Guo, P.; Li, T.; Xu, B.; Xu, X.; Li, J. Questions and current understanding about solar chimney power plant: A review. Energy Convers. Manag. 2019, 182, 21–33. [Google Scholar] [CrossRef]
  5. Balijepalli, R.; Chandramohan, V.P.; Kirankumar, K. Performance parameter evaluation, materials selection, solar radiation with energy losses, energy storage and turbine design procedure for a pilot scale solar updraft tower. Energy Convers. Manag. 2017, 150, 451–462. [Google Scholar] [CrossRef]
  6. Thirugnanasambandam, M.; Iniyan, S.; Goic, R. A review of solar thermal technologies. Renew. Sustain. Energy Rev. 2010, 14, 312–322. [Google Scholar] [CrossRef]
  7. Jain, S.; Sharma, M.P. Oxidation, Thermal, and Storage Stability Studies of Jatropha curcas Biodiesel. Int. Sch. Res. Netw. Renew. Energy 2012, 2012, 1–15. [Google Scholar] [CrossRef] [Green Version]
  8. Khan, M.; Bhattacharya, S.; Garg, A.; Jain, S. Process parameter optimization of low temperature transesterification of algae-jatropha oil blend. Energy 2018, 119, 983–988. [Google Scholar] [CrossRef]
  9. Goyal, P.; Sharma, M.P.; Jain, S. Optimization of transesterification of Jatropha curcas Oil to Biodiesel using Response Surface Methodology and its Adulteration with Kerosene. J. Mater. Environ. Sci. 2013, 4, 277–284. [Google Scholar]
  10. Jain, S.; Sharma, M.P. Oxidation and thermal behavior of Jatropha curcas biodiesel influenced by antioxidants and metal contaminants. Int. J. Eng. Sci. Technol. 2011, 3, 65–75. [Google Scholar] [CrossRef]
  11. Kumar, S.; Jain, S.; Kumar, H. Environmental Effects Prediction of jatropha-algae biodiesel blend oil yield with the application of artificial neural networks technique. Energy Sources Part A Recover. Util. Environ. Eff. 2018, 41, 1285–1295. [Google Scholar] [CrossRef]
  12. Kumar, S.; Jain, S.; Kumar, H. Experimental Study on Biodiesel Production Parameter Optimization of Jatropha-Algae Oil Mixtures and Performance and Emission Analysis of a Diesel Engine Coupled with a Generator Fueled with Diesel/Biodiesel Blends. ACS Omega 2020, 5, 17033–17041. [Google Scholar] [CrossRef] [PubMed]
  13. Jain, S. 17-The production of biodiesel using Karanja (Pongamia pinnata) and Jatropha (Jatropha curcas) Oil. In Biomass, Biopolymer-Based Materials, and Bioenergy; Verma, D., Fortunati, E., Jain, S., Zhang, X., Eds.; Woodhead Publishing: Sawston, UK, 2019; pp. 397–408. ISBN 978-0-08-102426-3. [Google Scholar]
  14. Lord, J.; Thomas, A.; Treat, N.; Forkin, M.; Bain, R.; Dulac, P.; Behroozi, C.H.; Mamutov, T.; Fongheiser, J.; Kobilansky, N.; et al. Global potential for harvesting drinking water from air using solar energy. Nature 2021, 598, 611–617. [Google Scholar] [CrossRef]
  15. Singh, V.P.; Karn, A.; Dwivedi, G.; Alam, T.; Kumar, A. Experimental Assessment of Variation in Open Area Ratio on Thermohydraulic Performance of Parallel Flow Solar Air Heater. Arab. J. Sci. Eng. 2022, 12, 1–17. [Google Scholar] [CrossRef]
  16. Cyranoski, D. China tests giant air cleaner to combat smog. Nature 2018, 555, 152–153. [Google Scholar] [CrossRef] [PubMed] [Green Version]
  17. Lewis, N.S. Research opportunities to advance solar energy utilization. Science 2016, 351, 353–364. [Google Scholar] [CrossRef] [Green Version]
  18. Günther, H. Hundert Jahren: Die künftige Energieversorgung der Welt; KosmosFranckh’sche Verlagsbuchhandlung: Stuttgart, Germany, 1931; p. 125. [Google Scholar]
  19. Schlaich, J.; Bergermann, R.; Schiel, W.; Weinrebe, G. Sustainable electricity generation with solar updraft towers. Struct. Eng. Int. J. Int. Assoc. Bridg. Struct. Eng. 2004, 14, 225–229. [Google Scholar] [CrossRef]
  20. Ming, T.; Liu, W.; Pan, Y.; Xu, G. Numerical analysis of flow and heat transfer characteristics in solar chimney power plants with energy storage layer. Energy Convers. Manag. 2008, 49, 2872–2879. [Google Scholar] [CrossRef]
  21. Petela, R. Thermodynamic study of a simplified model of the solar chimney power plant. Sol. Energy 2009, 83, 94–107. [Google Scholar] [CrossRef]
  22. Muhammed, H.A.; Atrooshi, S.A. Modeling solar chimney for geometry optimization. Renew. Energy 2019, 138, 212–223. [Google Scholar] [CrossRef]
  23. Choi, Y.J.; Kam, D.H.; Park, Y.W.; Jeong, Y.H. Development of analytical model for solar chimney power plant with and without water storage system. Energy 2016, 112, 200–207. [Google Scholar] [CrossRef]
  24. Esmail, M.F.C.; Khodary, A.; Mekhail, T.; Hares, E. Effect of wind speed over the chimney on the updraft velocity of a solar chimney power plant: An experimental study. Case Stud. Therm. Eng. 2022, 37, 102265. [Google Scholar] [CrossRef]
  25. Huang, M.; Liu, G.; He, Y.; Li, A.; Tao, W. Structural Optimization of Solar Chimney Power Plant by a Genetic Algorithm. Hsi-An Chiao Tung Ta Hsueh/Journal Xi’an Jiaotong Univ. 2021, 55, 1–10. [Google Scholar] [CrossRef]
  26. Singh, V.P.; Jain, S.; Gupta, J.M.L. Performance assessment of double-pass parallel flow solar air heater with perforated multi-V ribs roughness—Part B. Exp. Heat Transf. 2022, 35, 1059–1076. [Google Scholar] [CrossRef]
  27. Kalash, S.; Naimeh, W.; Ajib, S. A review of sloped solar updraft power technology. Energy Procedia 2014, 50, 222–228. [Google Scholar] [CrossRef] [Green Version]
  28. Milani Shirvan, K.; Mirzakhanlari, S.; Mamourian, M.; Kalogirou, S.A. Optimization of effective parameters on solar updraft tower to achieve potential maximum power output: A sensitivity analysis and numerical simulation. Appl. Energy 2017, 195, 725–737. [Google Scholar] [CrossRef]
  29. Zhou, X.; Xu, Y. Solar updraft tower power generation. Sol. Energy 2016, 128, 95–125. [Google Scholar] [CrossRef]
  30. Singh, V.P.; Jain, S.; Karn, A.; Kumar, A.; Dwivedi, G.; Meena, C.S.; Dutt, N.; Ghosh, A. Recent Developments and Advancements in Solar Air Heaters: A Detailed Review. Sustainability 2022, 14, 12149. [Google Scholar] [CrossRef]
  31. Schlaich, J.; Bergermann, R.; Schiel, W.; Weinrebe, G. Design of commercial solar updraft tower systems—Utilization of solar induced convective flows for power generation. J. Sol. Energy Eng. Trans. ASME 2005, 127, 117–124. [Google Scholar] [CrossRef]
  32. Al-Kayiem, H.H.; Aja, O.C. Historic and recent progress in solar chimney power plant enhancing technologies. Renew. Sustain. Energy Rev. 2016, 58, 1269–1292. [Google Scholar] [CrossRef]
  33. Singh, V.P.; Jain, S.; Karn, A.; Dwivedi, G.; Kumar, A.; Mishra, S.; Sharma, N.K.; Bajaj, M.; Zawbaa, H.M.; Kamel, S. Heat transfer and friction factor correlations development for double pass solar air heater artificially roughened with perforated multi-V ribs. Case Stud. Therm. Eng. 2022, 39, 102461. [Google Scholar] [CrossRef]
  34. Amudam, Y.; Chandramohan, V.P. Influence of thermal energy storage system on flow and performance parameters of solar updraft tower power plant: A three dimensional numerical analysis. J. Clean. Prod. 2019, 207, 136–152. [Google Scholar] [CrossRef]
  35. Singh, V.P.; Jain, S.; Karn, A.; Kumar, A.; Dwivedi, G. Mathematical Modeling of Efficiency Evaluation of Double Pass Parallel Flow Solar Air Heater. Sustainability 2022, 14, 10535. [Google Scholar] [CrossRef]
  36. Schlaich, J.; Bergermann, R.; Schiel, W.; Weinrebe, G. Design of commercial solar tower systems—Utilization of solar induced convective flows for power generation. In Proceedings of the International Solar Energy Conference, Kohala Coast, HI, USA, 15–18 March 2003; pp. 573–581. [Google Scholar]
  37. Goldack, A. Natural frequencies and mode shapes of towers for solar updraft power plants. In Proceedings of the Proceedings of the 8th International Conference on Structural Dynamics, EURODYN 2011, Leuven, Belgium, 4–6 July 2011; pp. 3575–3581. [Google Scholar]
  38. Bernardes, M.D.S.; Voß, A.; Weinrebe, G. Thermal and technical analyses of solar chimneys. Sol. Energy 2003, 75, 511–524. [Google Scholar] [CrossRef]
  39. Hedderwick, R.A. Performance Evaluation of a Solar Chimney Power Plant. 2000. Available online: https://core.ac.uk/download/pdf/37320706.pdf (accessed on 27 December 2022).
  40. Pretorius, J.P.; Kroger, D.G. Solar chimney power plant performance. J. Sol. Energy Eng. Trans. ASME 2006, 128, 302–311. [Google Scholar] [CrossRef]
  41. Pretorius, J.P.; Kröger, D.G. Critical evaluation of solar chimney power plant performance. Sol. Energy 2006, 80, 535–544. [Google Scholar] [CrossRef]
  42. Zhou, X.; Yuan, S.; Bernardes, M.A.d.S. Sloped-collector solar updraft tower power plant performance. Int. J. Heat Mass Transf. 2013, 66, 798–807. [Google Scholar] [CrossRef]
  43. Das, P.; Chandramohan, V.P. CFD analysis on flow and performance parameters estimation of solar updraft tower (SUT) plant varying its geometrical configurations. Energy Sources Part A Recover. Util. Environ. Eff. 2018, 40, 1532–1546. [Google Scholar] [CrossRef]
  44. Singh, V.P.; Jain, S.; Gupta, J.M.L. Analysis of the effect of perforation in multi-v rib artificial roughened single pass solar air heater: Part A. Exp. Heat Transf. 2021, 36, 163–182. [Google Scholar] [CrossRef]
  45. Gannon, A.J.; Backstro, T.W. Von Solar Chimney Cycle Analysis With System Loss and Solar Collector Performance. J. Sol. Energy Eng. 2000, 122, 133–137. [Google Scholar] [CrossRef]
  46. Westdyk, D.; Kröger, D.G. Modeling evapotranspiration effects on air flowing in a small glass roofed Tunnel. J. Irrig. Drain. Eng. 2010, 136, 326–332. [Google Scholar] [CrossRef]
  47. Bernardes, M.D.S.; von Backström, T.W. Evaluation of operational control strategies applicable to solar chimney power plants. Sol. Energy 2010, 84, 277–288. [Google Scholar] [CrossRef]
  48. von Backström, T.W.; Gannon, A.J. Solar chimney turbine characteristics. Sol. Energy 2004, 76, 235–241. [Google Scholar] [CrossRef]
  49. Pasumarthi, N.; Sherif, S.A. Experimental and theoretical performance of a demonstration solar chimney model—Part I: Mathematical model development. Int. J. Energy Res. 1998, 22, 277–288. [Google Scholar] [CrossRef]
  50. Pasumarthi, N.; Sherif, S.A. Experimental and theoretical performance of a demonstration solar chimney model—Part II: Experimental and theoretical results and economic analysis. Int. J. Energy Res. 1998, 22, 443–461. [Google Scholar] [CrossRef]
  51. Bakshi, R. India’s emergence as a global leader in renewable energy technologies. Renew. energy 1998, 15, 107–113. [Google Scholar] [CrossRef]
  52. Sukhatme, S.P.; Nayak, J.K. Solar energy in western Rajasthan. Curr. Sci. 1997, 72, 62–68. [Google Scholar]
  53. Ramachandra, T.V.; Jain, R.; Krishnadas, G. Hotspots of solar potential in India. Renew. Sustain. Energy Rev. 2011, 15, 3178–3186. [Google Scholar] [CrossRef]
  54. Bakshi, P.R. An overview of renewable energy commercialization in India. Renew. Energy 1997, 10, 347–353. [Google Scholar] [CrossRef]
  55. Kumar, A.; Kumar, K.; Kaushik, N.; Sharma, S.; Mishra, S. Renewable energy in India: Current status and future potentials. Renew. Sustain. Energy Rev. 2010, 14, 2434–2442. [Google Scholar] [CrossRef]
  56. Singh, V.P.; Jain, S.; Kumar, A. Establishment of correlations for the Thermo-Hydraulic parameters due to perforation in a multi-V rib roughened single pass solar air heater. Exp. Heat Transf. 2022, 35, 1–20. [Google Scholar] [CrossRef]
  57. Meena, C.S.; Kumar, A.; Jain, S.; Rehman, A.U.; Mishra, S.; Sharma, N.K.; Bajaj, M.; Shafiq, M.; Eldin, E.T. Innovation in Green Building Sector for Sustainable Future. Energies 2022, 15, 6631. [Google Scholar] [CrossRef]
  58. Kurian, R.; Kulkarni, K.S.; Ramani, P.V.; Meena, C.S.; Kumar, A.; Cozzolino, R. Estimation of carbon footprint of residential building in warm humid climate of india through BIM. Energies 2021, 14, 4237. [Google Scholar] [CrossRef]
  59. Saini, L.; Meena, C.S.; Raj, B.P.; Agarwal, N.; Kumar, A. Net Zero Energy Consumption building in India: An overview and initiative toward sustainable future. Int. J. Green Energy 2022, 19, 544–561. [Google Scholar] [CrossRef]
  60. Hurtado, F.J.; Kaiser, A.S.; Zamora, B. Evaluation of the influence of soil thermal inertia on the performance of a solar chimney power plant. Energy 2012, 47, 213–224. [Google Scholar] [CrossRef]
  61. Guo, P.; Li, J.; Wang, Y.; Wang, Y. Evaluation of the optimal turbine pressure drop ratio for a solar chimney power plant. Energy Convers. Manag. 2016, 108, 14–22. [Google Scholar] [CrossRef]
  62. Bhattacharya, S.C.; Jana, C. Renewable energy in India: Historical developments and prospects. Energy 2009, 34, 981–991. [Google Scholar] [CrossRef]
  63. Kumar, A.; Singh, P.; Kapoor, N.R.; Meena, C.S.; Jain, K.; Kulkarni, K.S.; Cozzolino, R. Ecological footprint of residential buildings in composite climate of India—A case study. Sustain. 2021, 13, 11949. [Google Scholar] [CrossRef]
  64. Haaf, W.; Friedrich, K.; Mayr, G.; Schlaich, J. Part I: Principle and Construction of the Pilot Plant in Manzanares. Int. J. Sol. Energy 1983, 2, 3–20. [Google Scholar] [CrossRef]
  65. Trieb, F.; Langniß, O.; Klaiß, H.; Zhou, X.; Yuan, S.; Bernardes, M.A.D.S.; Ming, T.; Wang, X.; de Richter, R.K.; Liu, W.W.; et al. A cost-benefit analysis of power generation from commercial reinforced concrete solar chimney power plant. Renew. Sustain. Energy Rev. 2013, 15, 104–113. [Google Scholar] [CrossRef]
  66. Krumar Mandal, D.; Pradhan, S.; Chakraborty, R.; Barman, A.; Biswas, N. Experimental investigation of a solar chimney power plant and its numerical verification of thermo-physical flow parameters for performance enhancement. Sustain. Energy Technol. Assessments 2022, 50, 101786. [Google Scholar] [CrossRef]
  67. Kumar, B.; Patil, A.K.; Jain, S.; Kumar, M. Effects of Double V Cuts in Perforated Twisted Tape Insert: An Experimental Study. Heat Transf. Eng. 2020, 41, 1473–1484. [Google Scholar] [CrossRef]
  68. Ming, T.; Liu, W.; Wu, Y.; Gui, J.; Peng, K.; Pan, T. Chapter 1—Introduction. In Solar Chimney Power Plant Generating Technology; Ming, T., Ed.; Academic Press: Cambridge, MA, USA, 2016; pp. 1–46. ISBN 978-0-12-805370-6. [Google Scholar]
  69. Fluri, T.P.; Von Backström, T.W. Performance analysis of the power conversion unit of a solar chimney power plant. Sol. Energy 2008, 82, 999–1008. [Google Scholar] [CrossRef]
  70. Singh, V.P.; Jain, S.; Gupta, J.M.L. Analysis of the effect of variation in open area ratio in perforated multi-V rib roughened single pass solar air heater—Part A. Energy Sources Part A Recover. Util. Environ. Eff. 2022, 44, 1–21. [Google Scholar] [CrossRef]
  71. Zuo, L.; Yan, Z.; Qu, N.; Dai, P.; Zhou, T.; Zheng, Y.; Ge, Y. Solar chimney power plant combined with membrane distillation (SCPPMD), part I: Principle and operation characteristics. Energy Convers. Manag. 2022, 258, 115501. [Google Scholar] [CrossRef]
  72. Zuo, L.; Dai, P.; Yan, Z.; Li, C.; Zheng, Y.; Ge, Y. Design and optimization of turbine for solar chimney power plant based on lifting design method of axial-flow hydraulic turbine impeller. Renew. Energy 2021, 171, 799–811. [Google Scholar] [CrossRef]
  73. Kalash, S.; Naimeh, W.; Ajib, S. Experimental investigation of a pilot sloped solar updraft power plant prototype performance throughout a year. Energy Procedia 2014, 50, 627–633. [Google Scholar] [CrossRef] [Green Version]
  74. Pradhan, S.; Chakraborty, R.; Mandal, D.K.; Barman, A.; Bose, P. Design and performance analysis of solar chimney power plant (SCPP): A review. Sustain. Energy Technol. Assessments 2021, 47, 101411. [Google Scholar] [CrossRef]
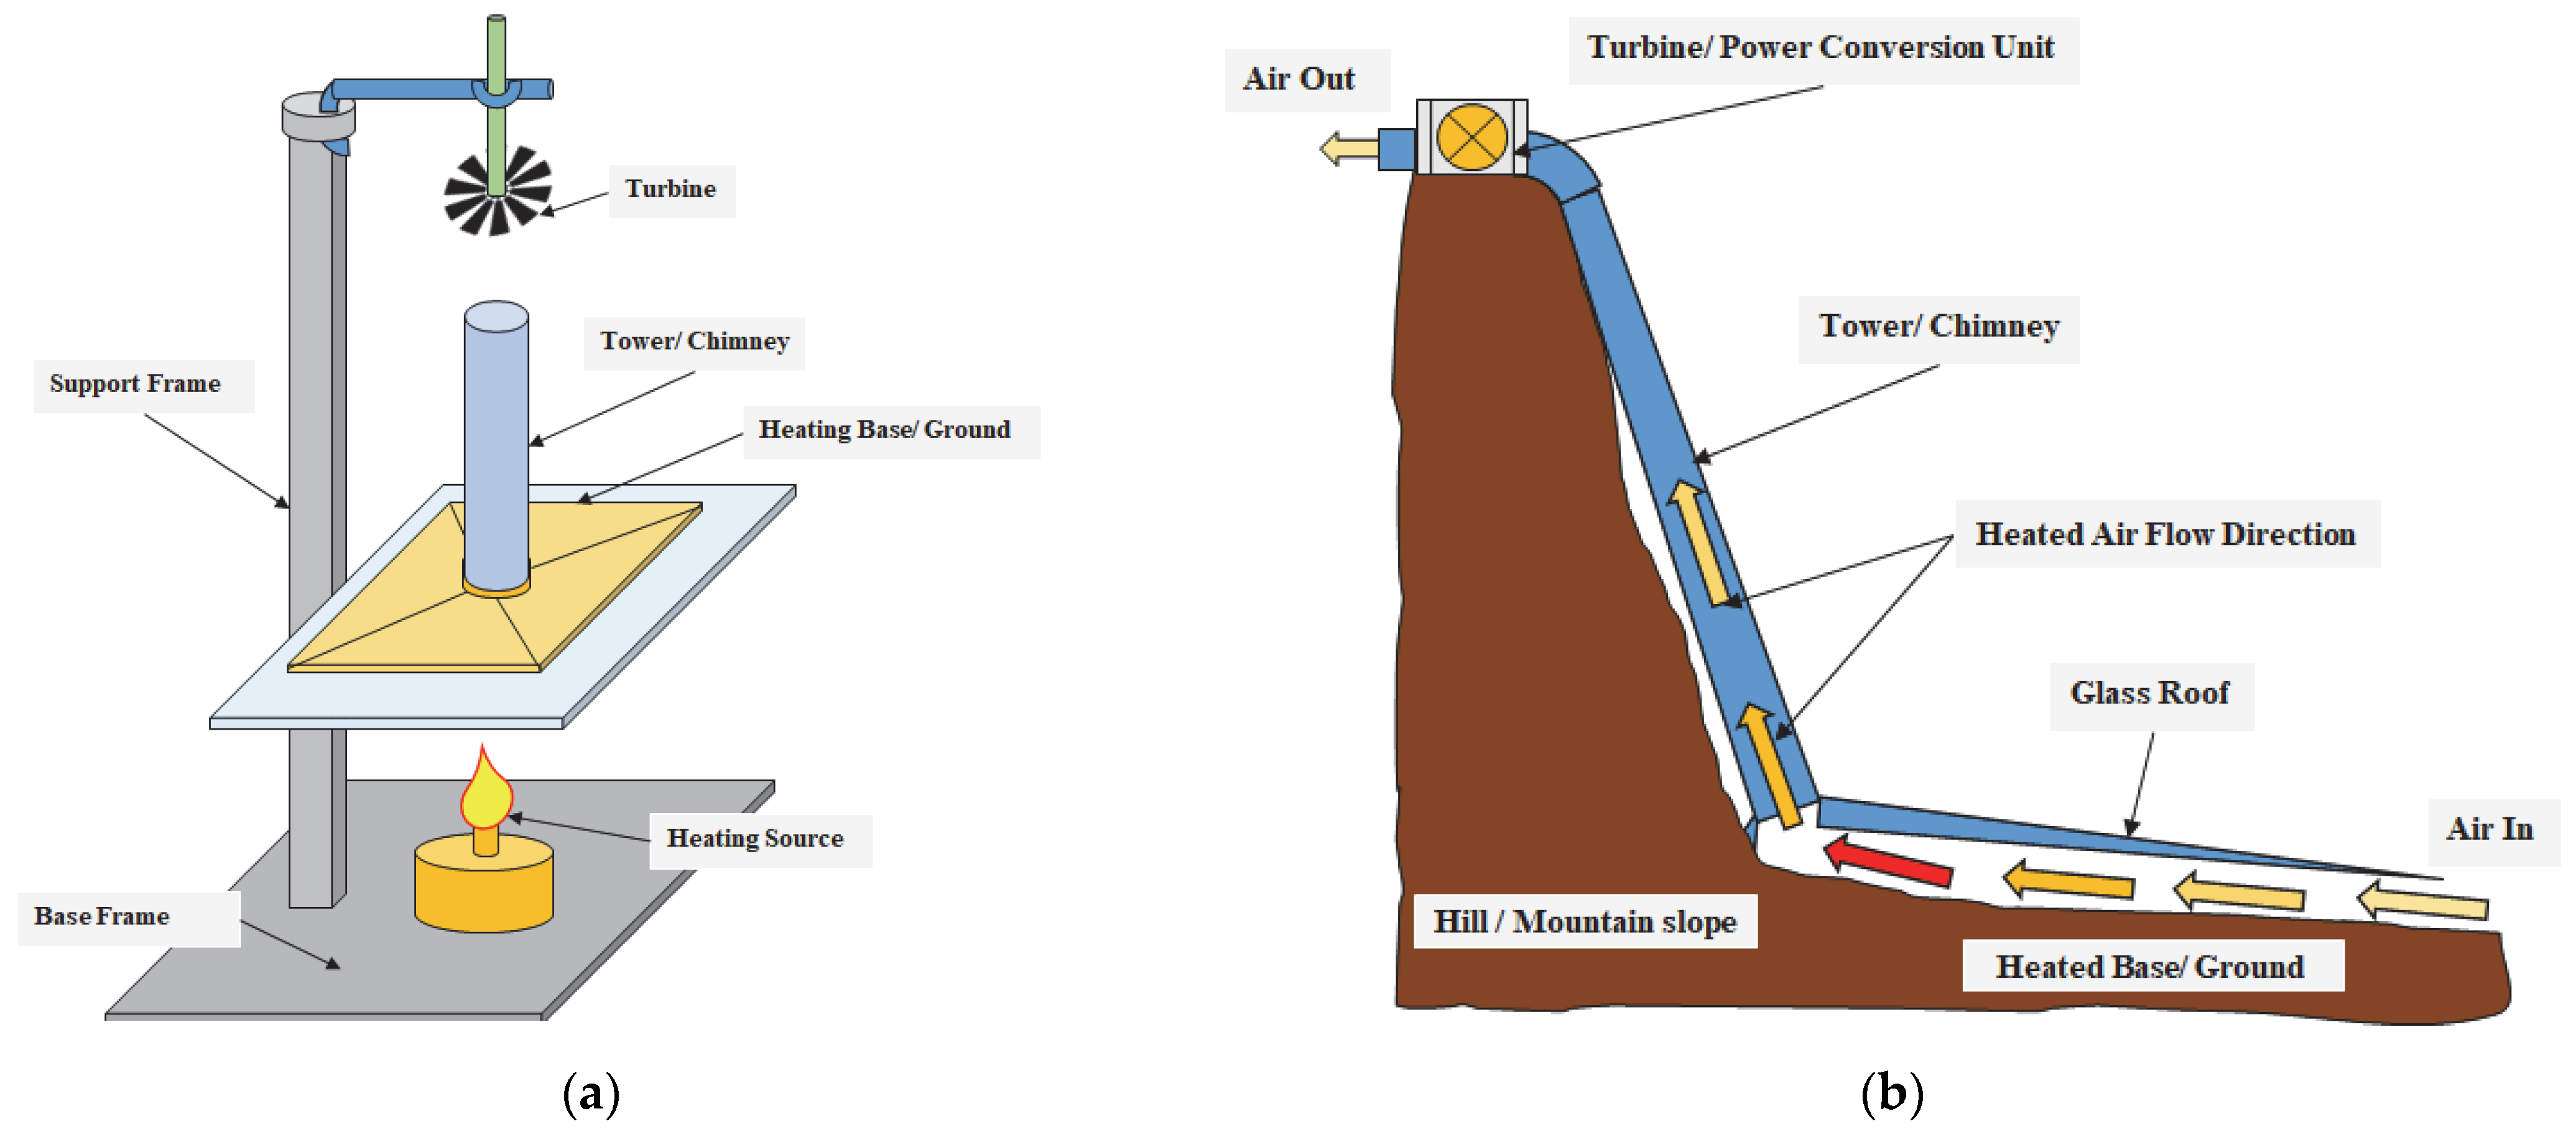
Figure 1. (a): Schematic of an experimental setup of a solar chimney, (b) schematic of a sloped chimney power plant proposed by Günter, 1931.
Energies 16 00494 g001
Figure 4. Top view of canopy of 50 kW SUTPP prototype at Manzanares, Germany, reproduced with permission from [68], Elsvier, 2022.
Energies 16 00494 g004
Figure 5. CAD view of SUTPP tower. (a) Tower base with guided cone and turbine casing configuration. (b) Section view of tower with stiffening rings.
Energies 16 00494 g005aEnergies 16 00494 g005b
Figure 7. Flow chart of program developed for calculating the specification of SUTPP.
Energies 16 00494 g007
Figure 8. Flow chart of program for generating 100 sets of SUTPP configuration.
Energies 16 00494 g008
Figure 14. Effect of variation in power output on collector radius (RCollector) for different tower heights (HTower) in SUTPP.
Energies 16 00494 g014
Figure 15. Effect of variation in power output on tower radius (RTower) for different collector radii (Rcollector) in SUTPP.
Energies 16 00494 g015
Figure 16. Effect of variation in power output on tower radius (RTower) for different tower heights (HTower) in SUTPP.
Energies 16 00494 g016
Figure 17. Effect of variation in power output on tower height (HTower) for different collector radii (RCollector) in SUTPP.
Energies 16 00494 g017
Figure 18. Effect of variation in power output on tower height (HTower) and tower radius (RTower) for different collector radii (RCollector) in SUTPP.
Energies 16 00494 g018
Figure 19. Effect of variation in power output on tower radius (RTower) and collector radius (RCollector) for different tower height (HTower) in SUTPP.
Energies 16 00494 g019
Disclaimer/Publisher’s Note: The statements, opinions and data contained in all publications are solely those of the individual author(s) and contributor(s) and not of MDPI and/or the editor(s). MDPI and/or the editor(s) disclaim responsibility for any injury to people or property resulting from any ideas, methods, instructions or products referred to in the content.