
Petrology, Mineralogy, and Geochemical Characterization of Paleogene Oil Shales of the Youganwo Formation in the Maoming Basin, Southern China: Implication for Source Rock Evaluation, Provenance, Paleoweathering and Maturity

Abstract
:1. Introduction
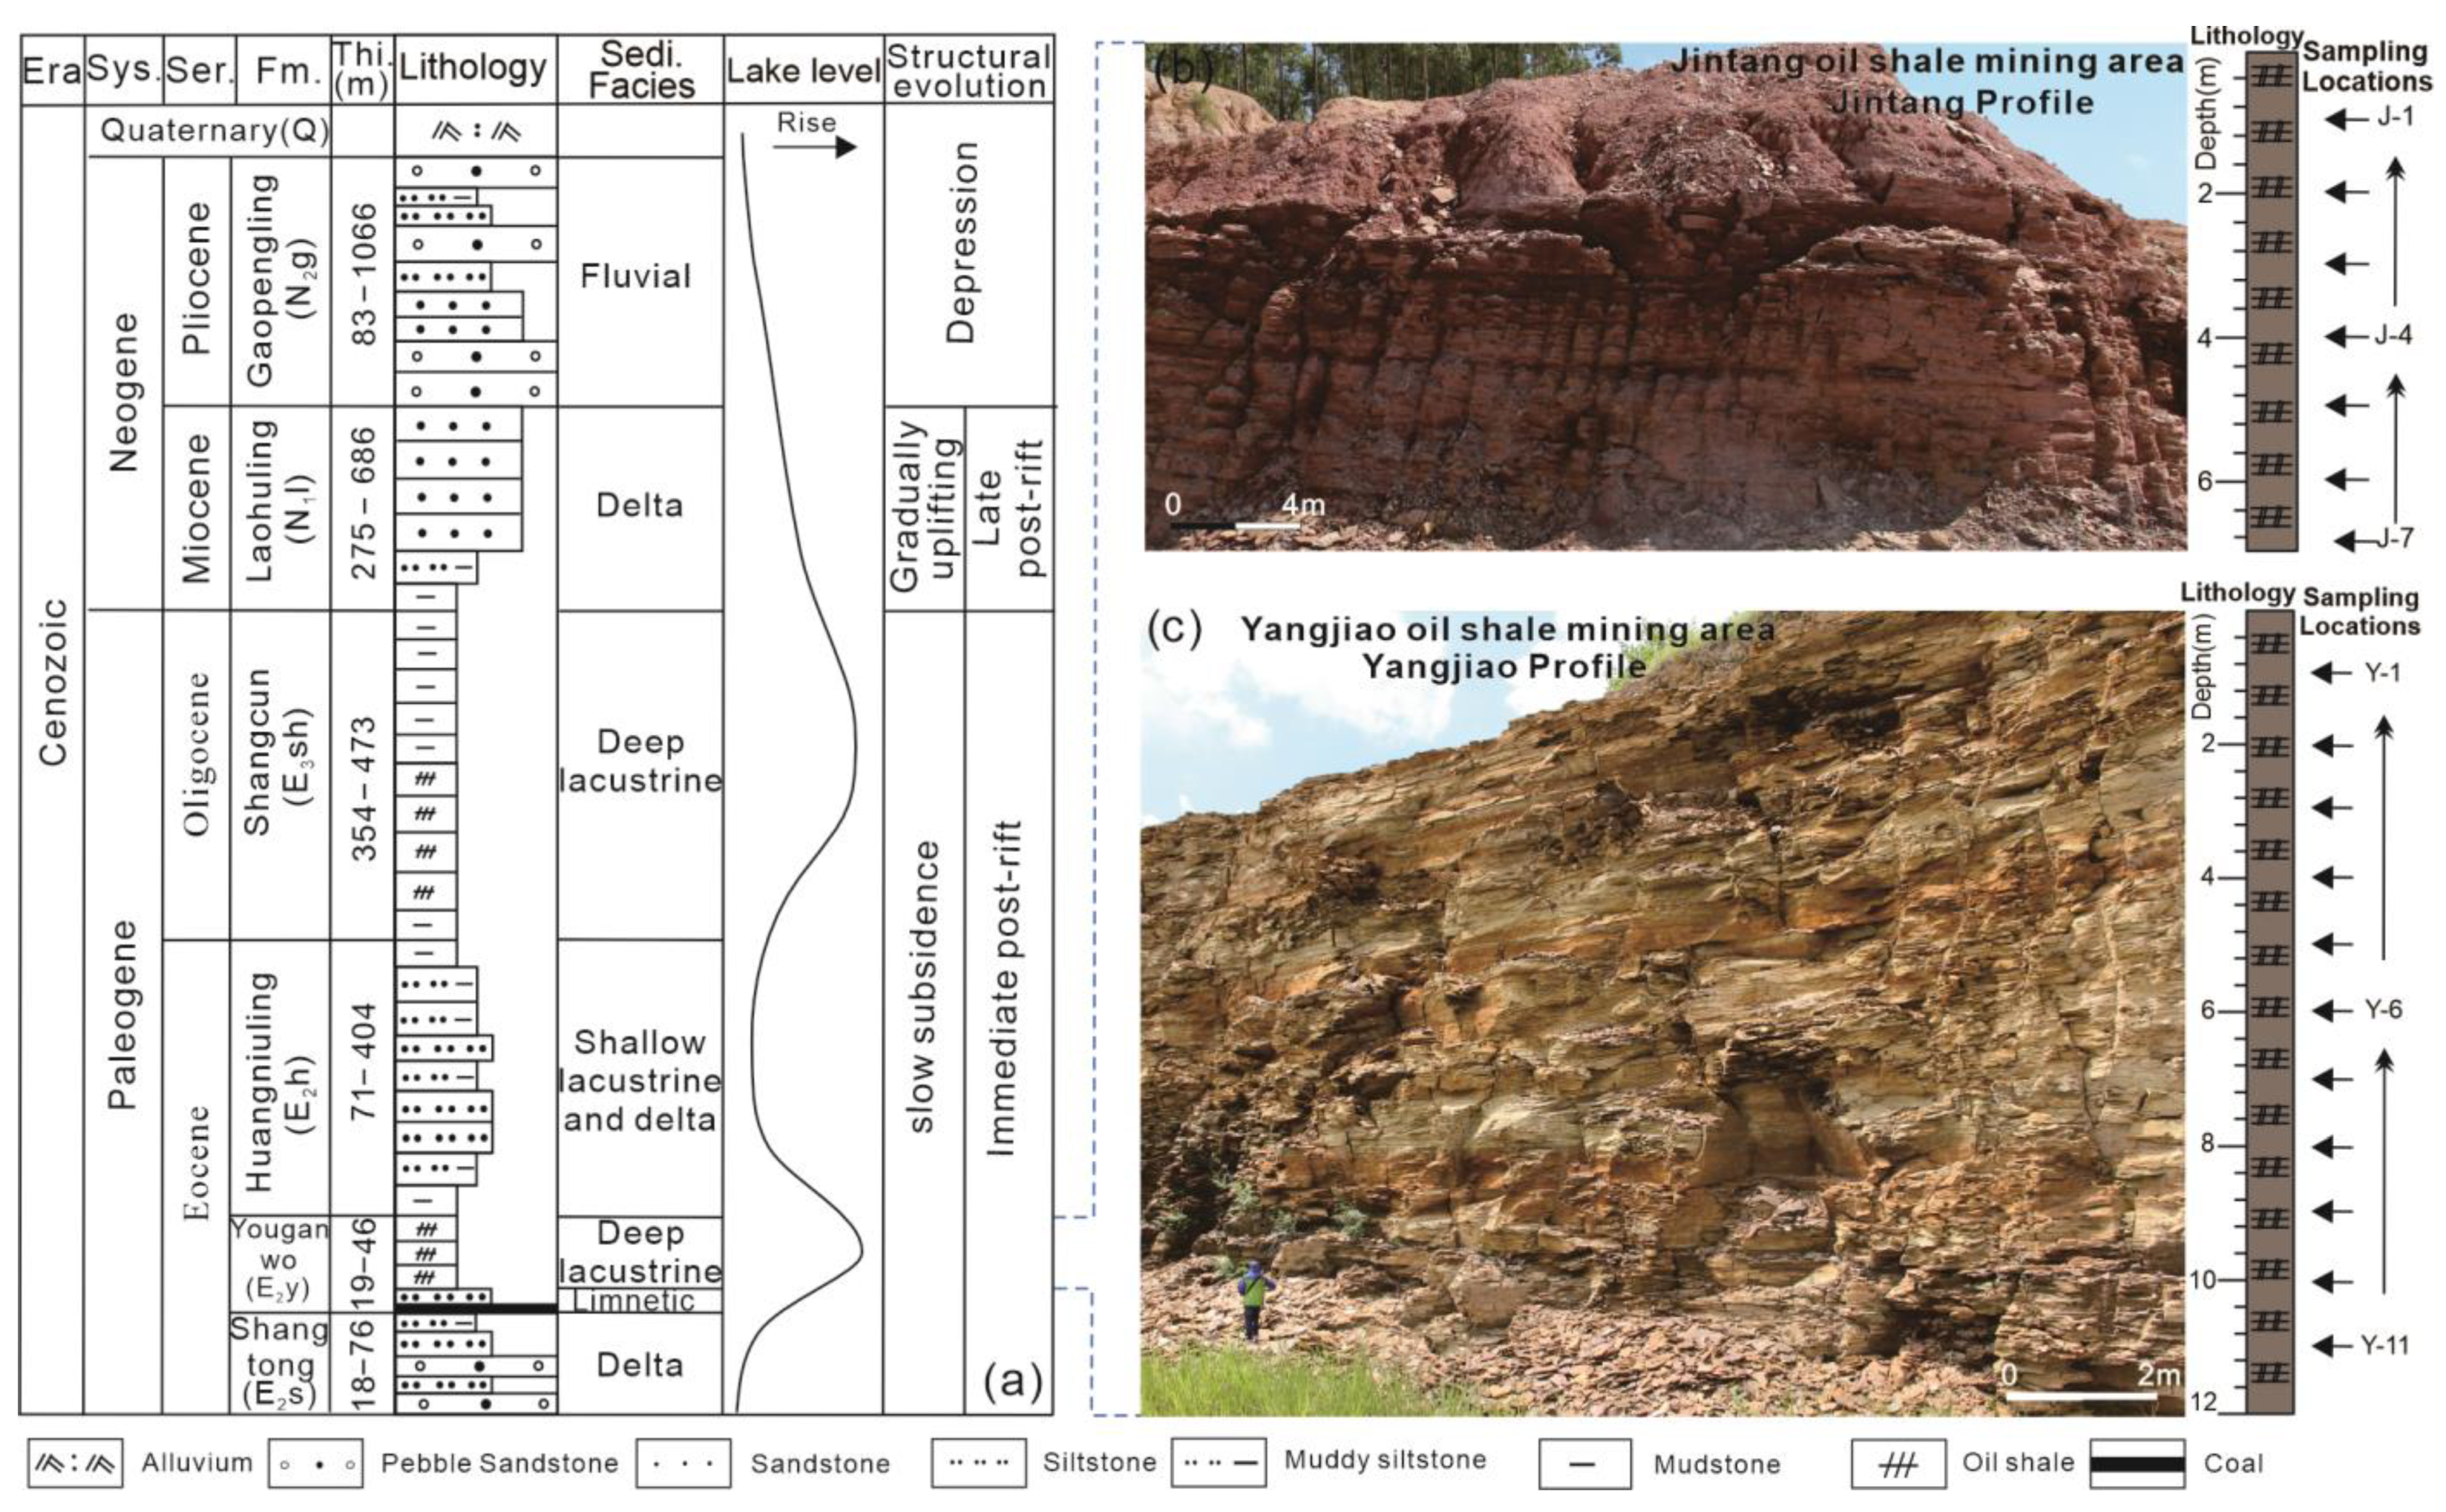
2. Geological Setting
3. Materials and Methods
3.1. Oil Yield, Calorific Value, Ash Content, and Volatile Content
3.2. C, S and Rock-Eval Pyrolysis
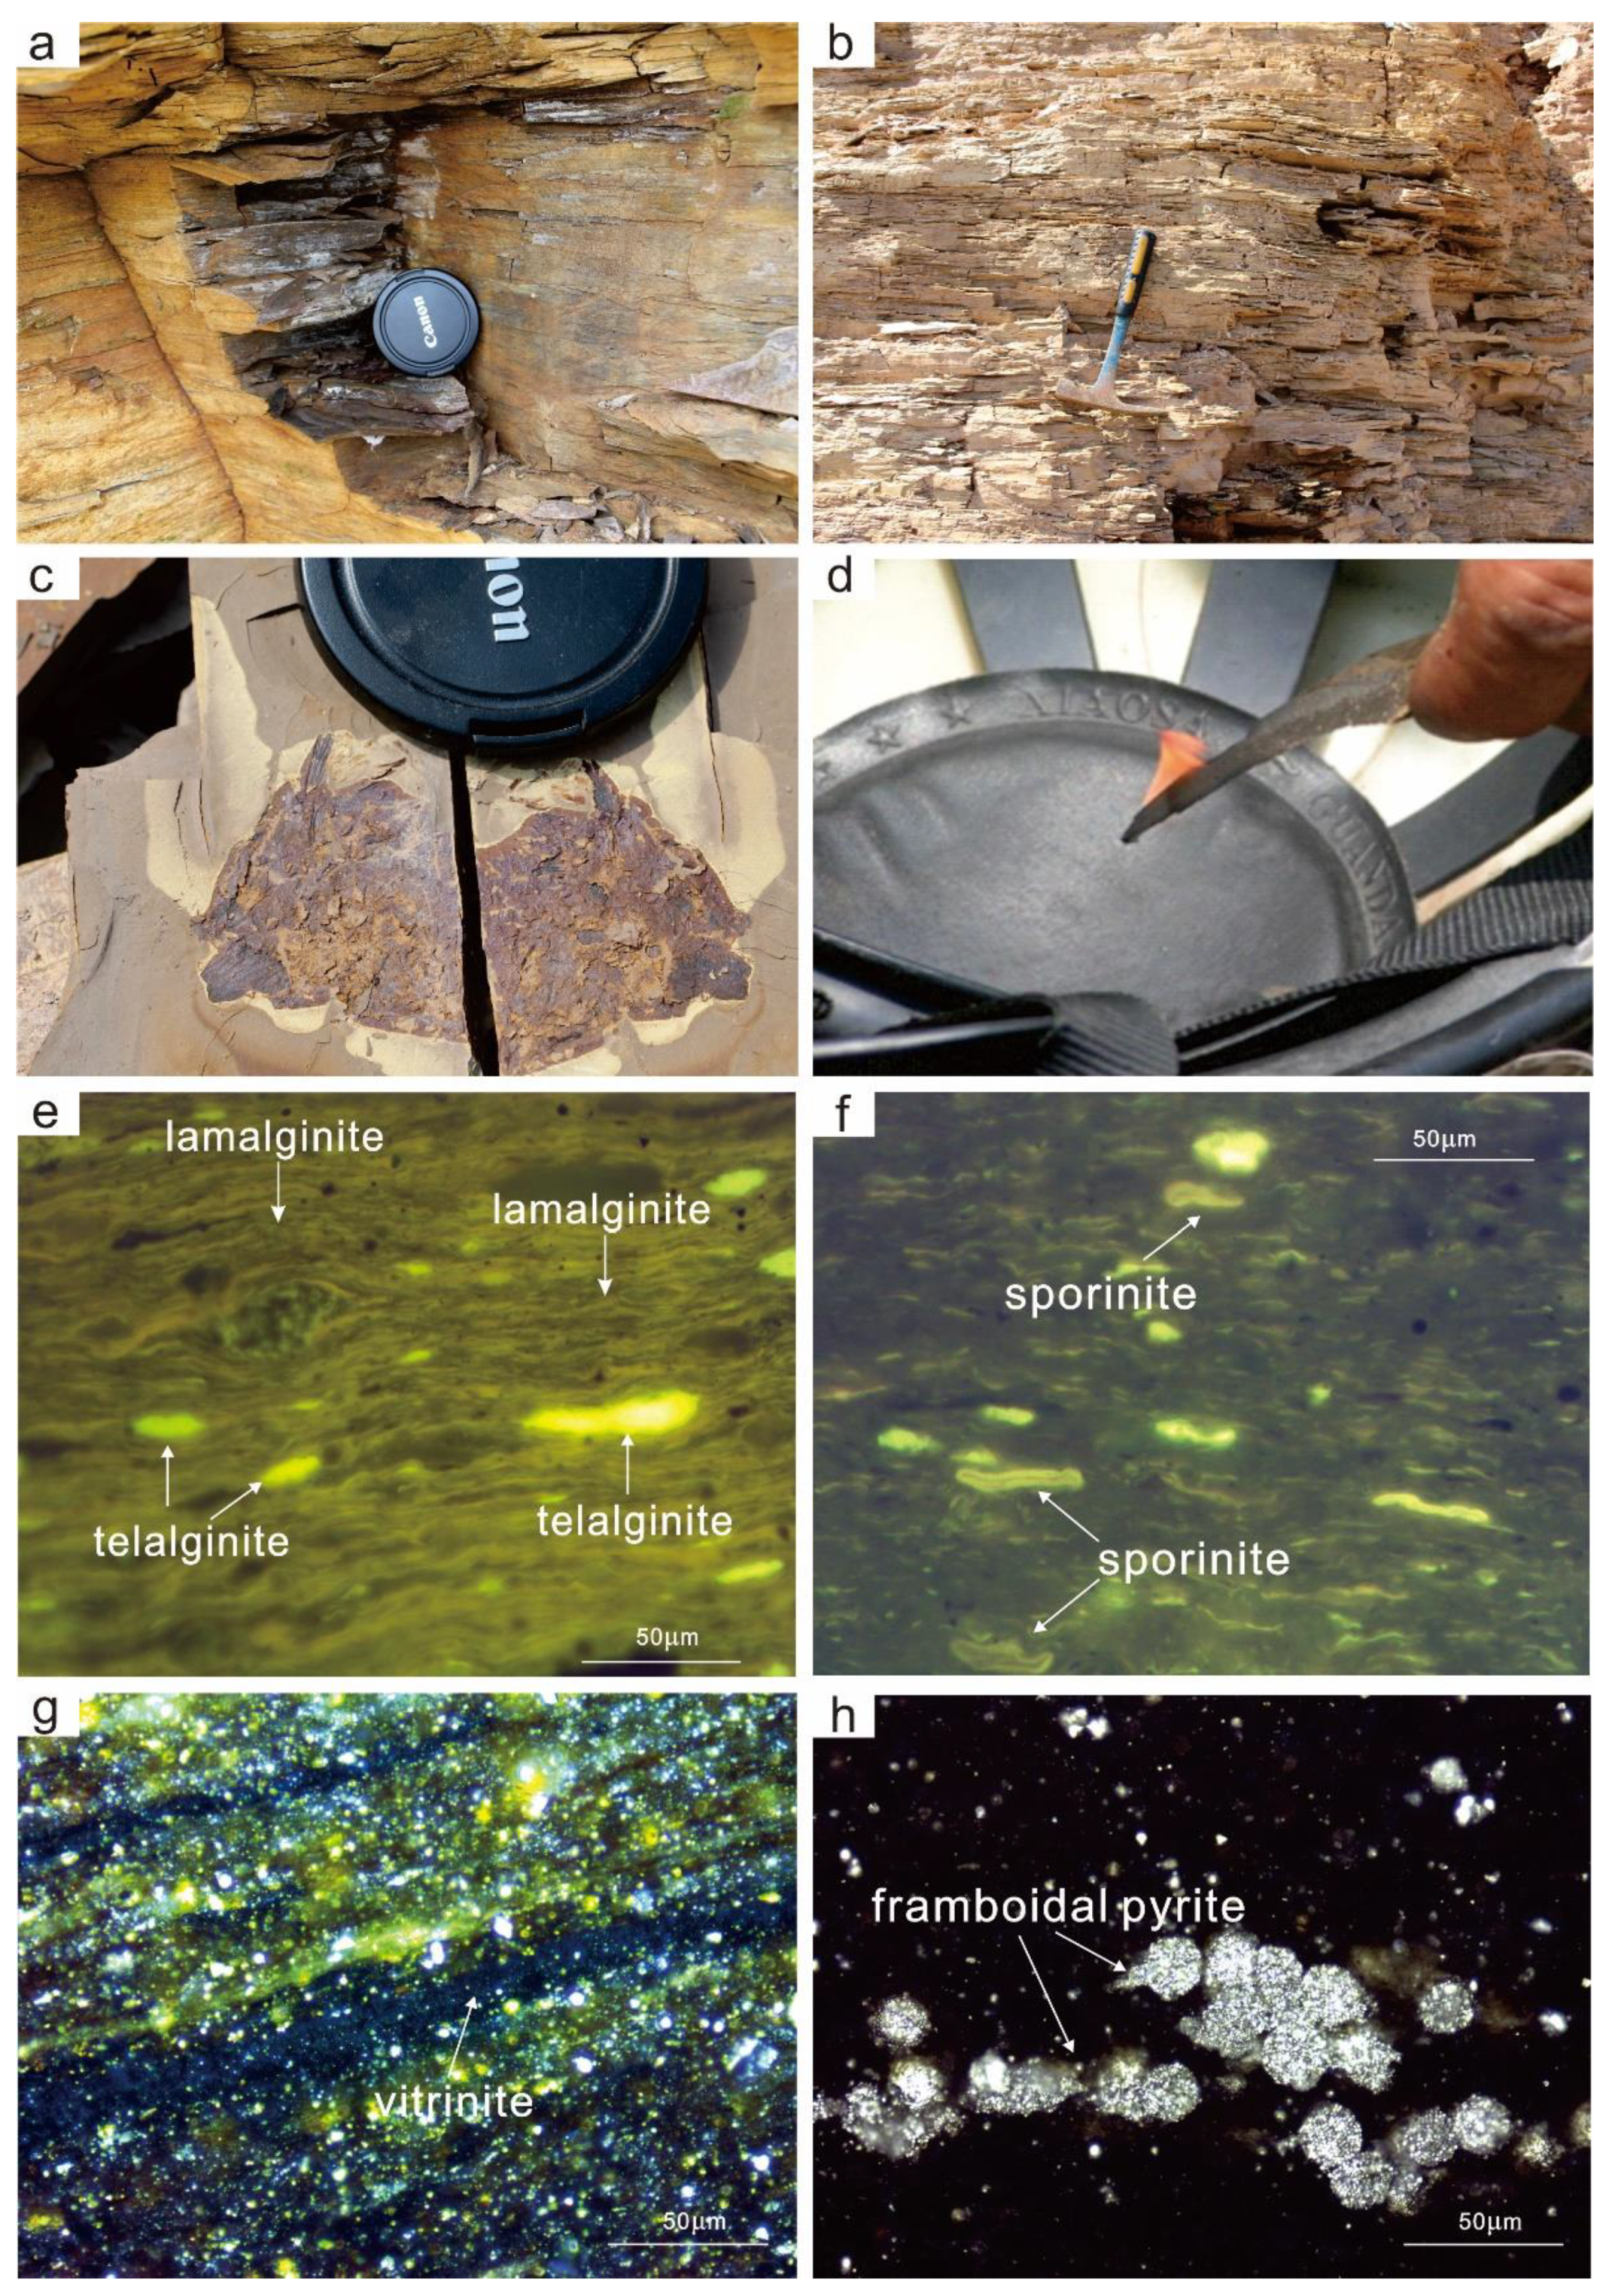
3.3. Organic Petrography
3.4. XRD and Element Analysis
4. Results
4.1. Petrology
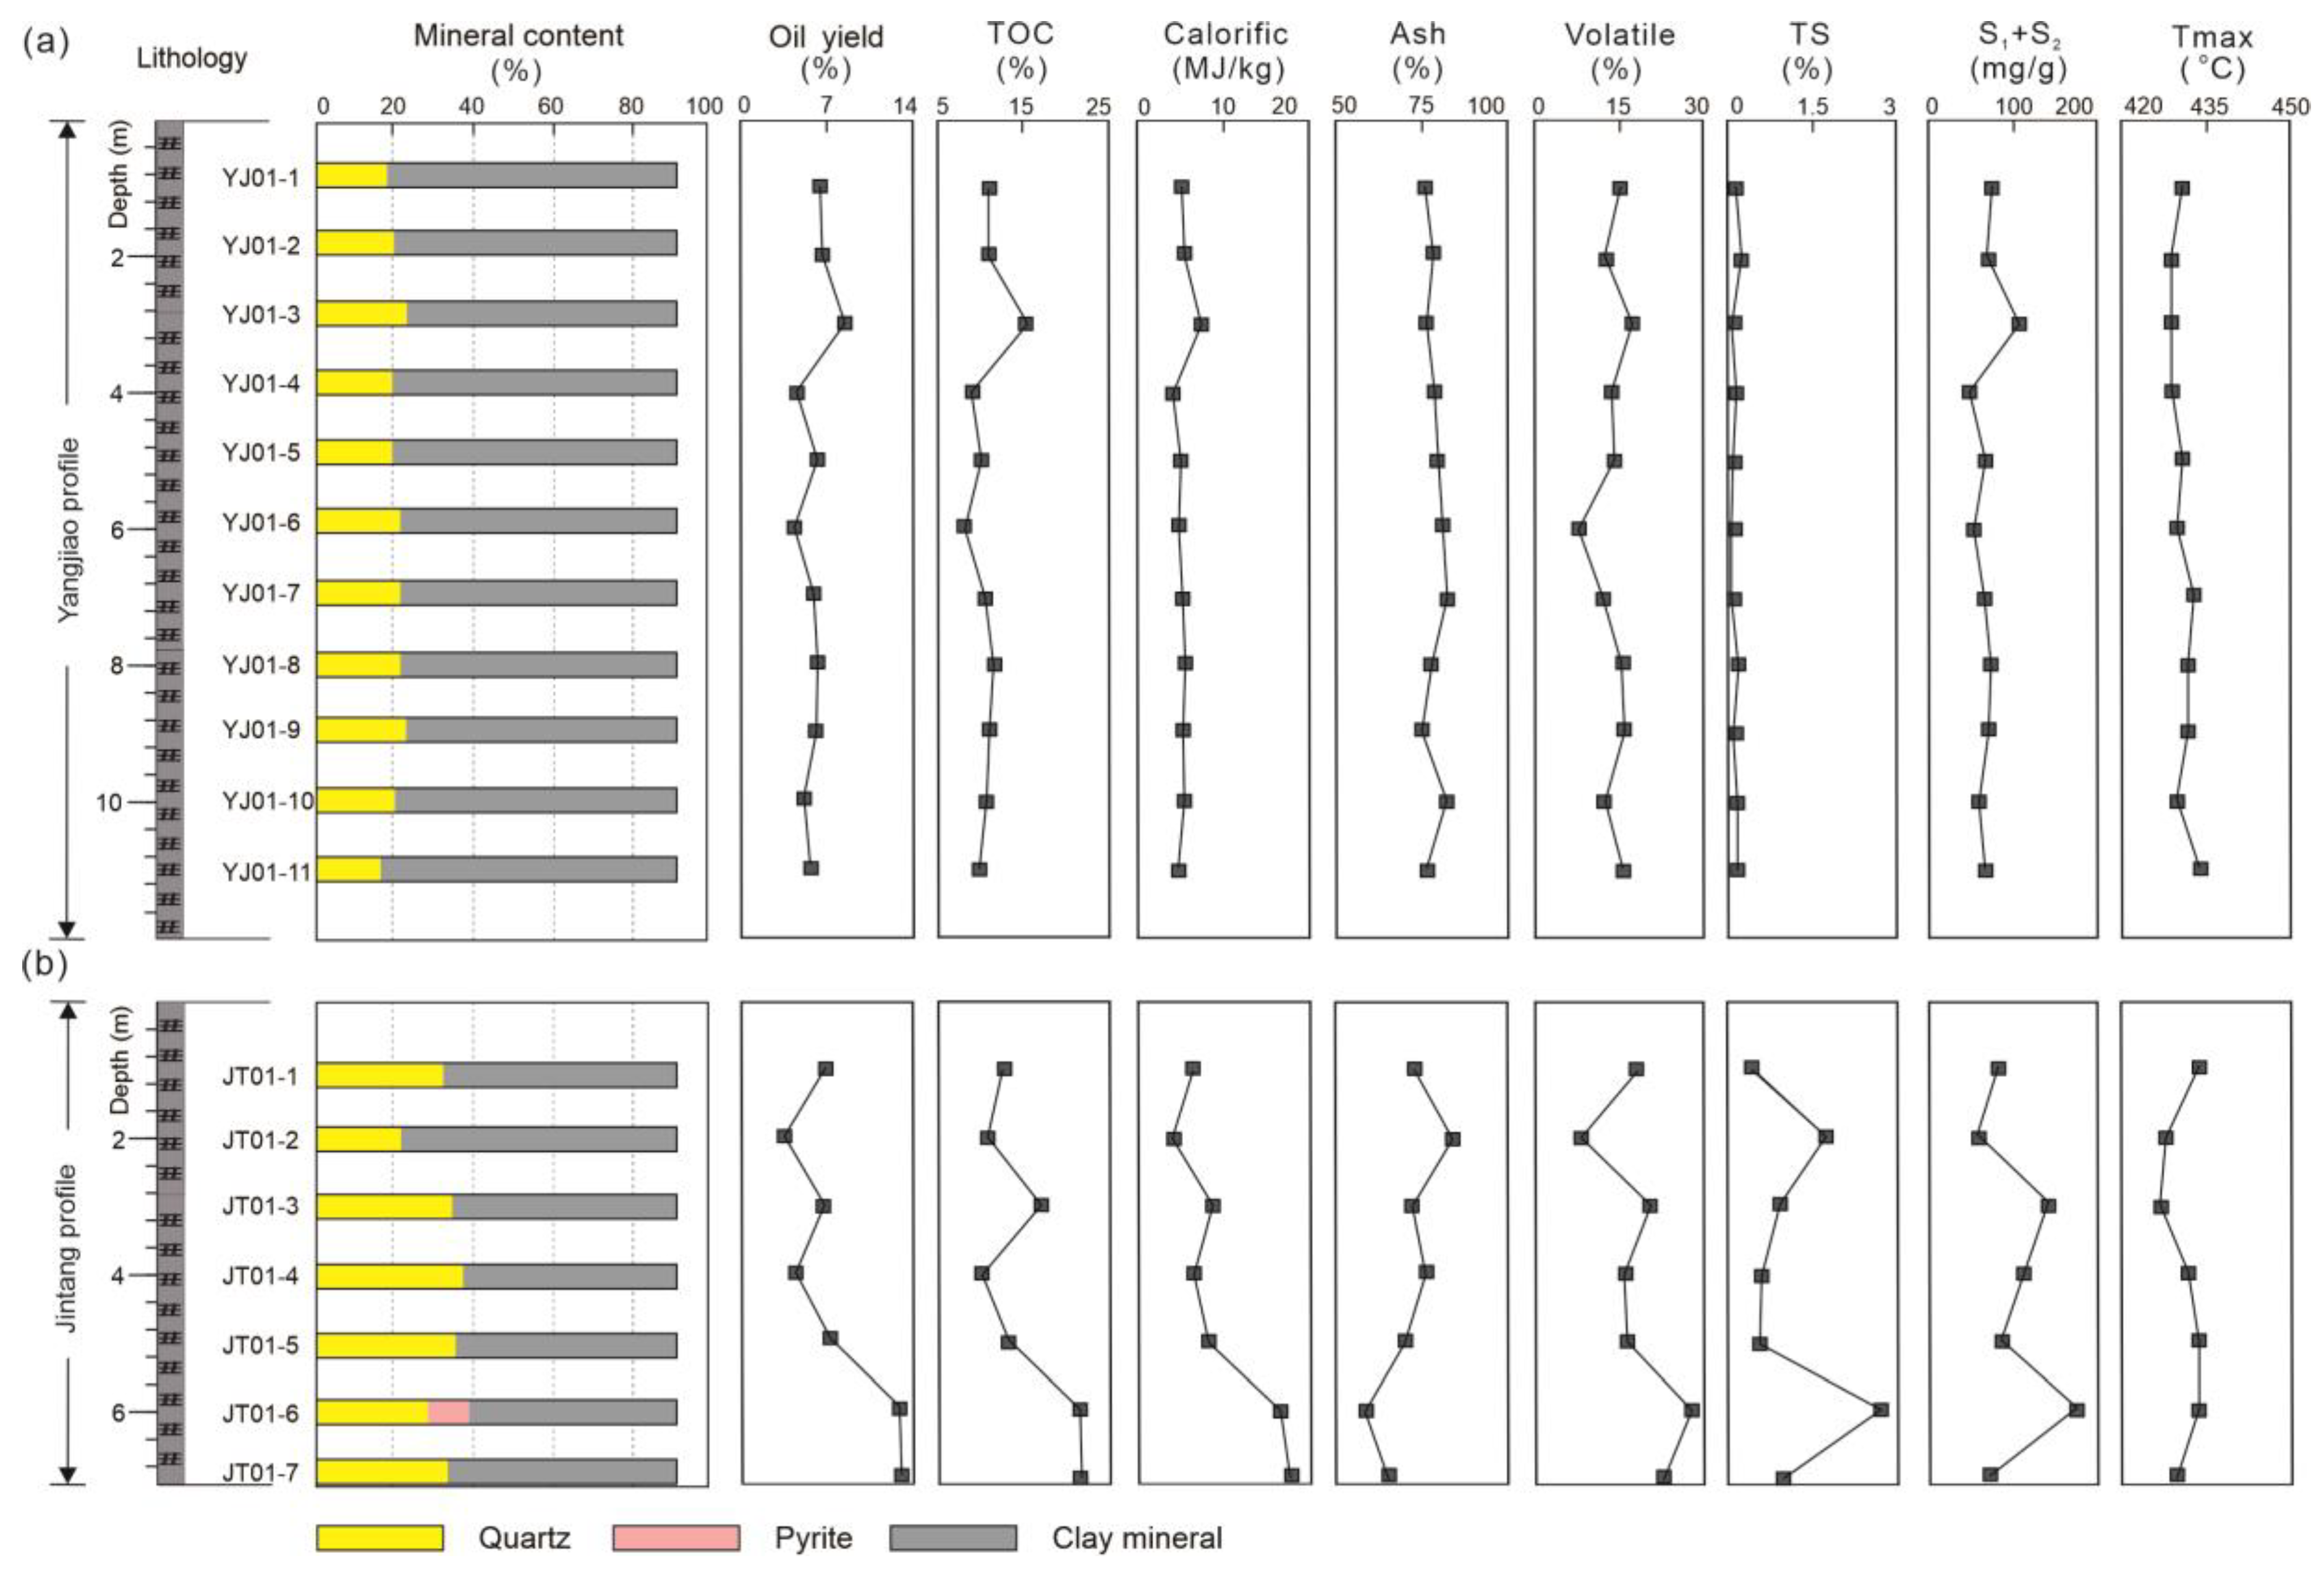
4.2. Mineralogy
4.3. Bulk of Industrial Analysis Data
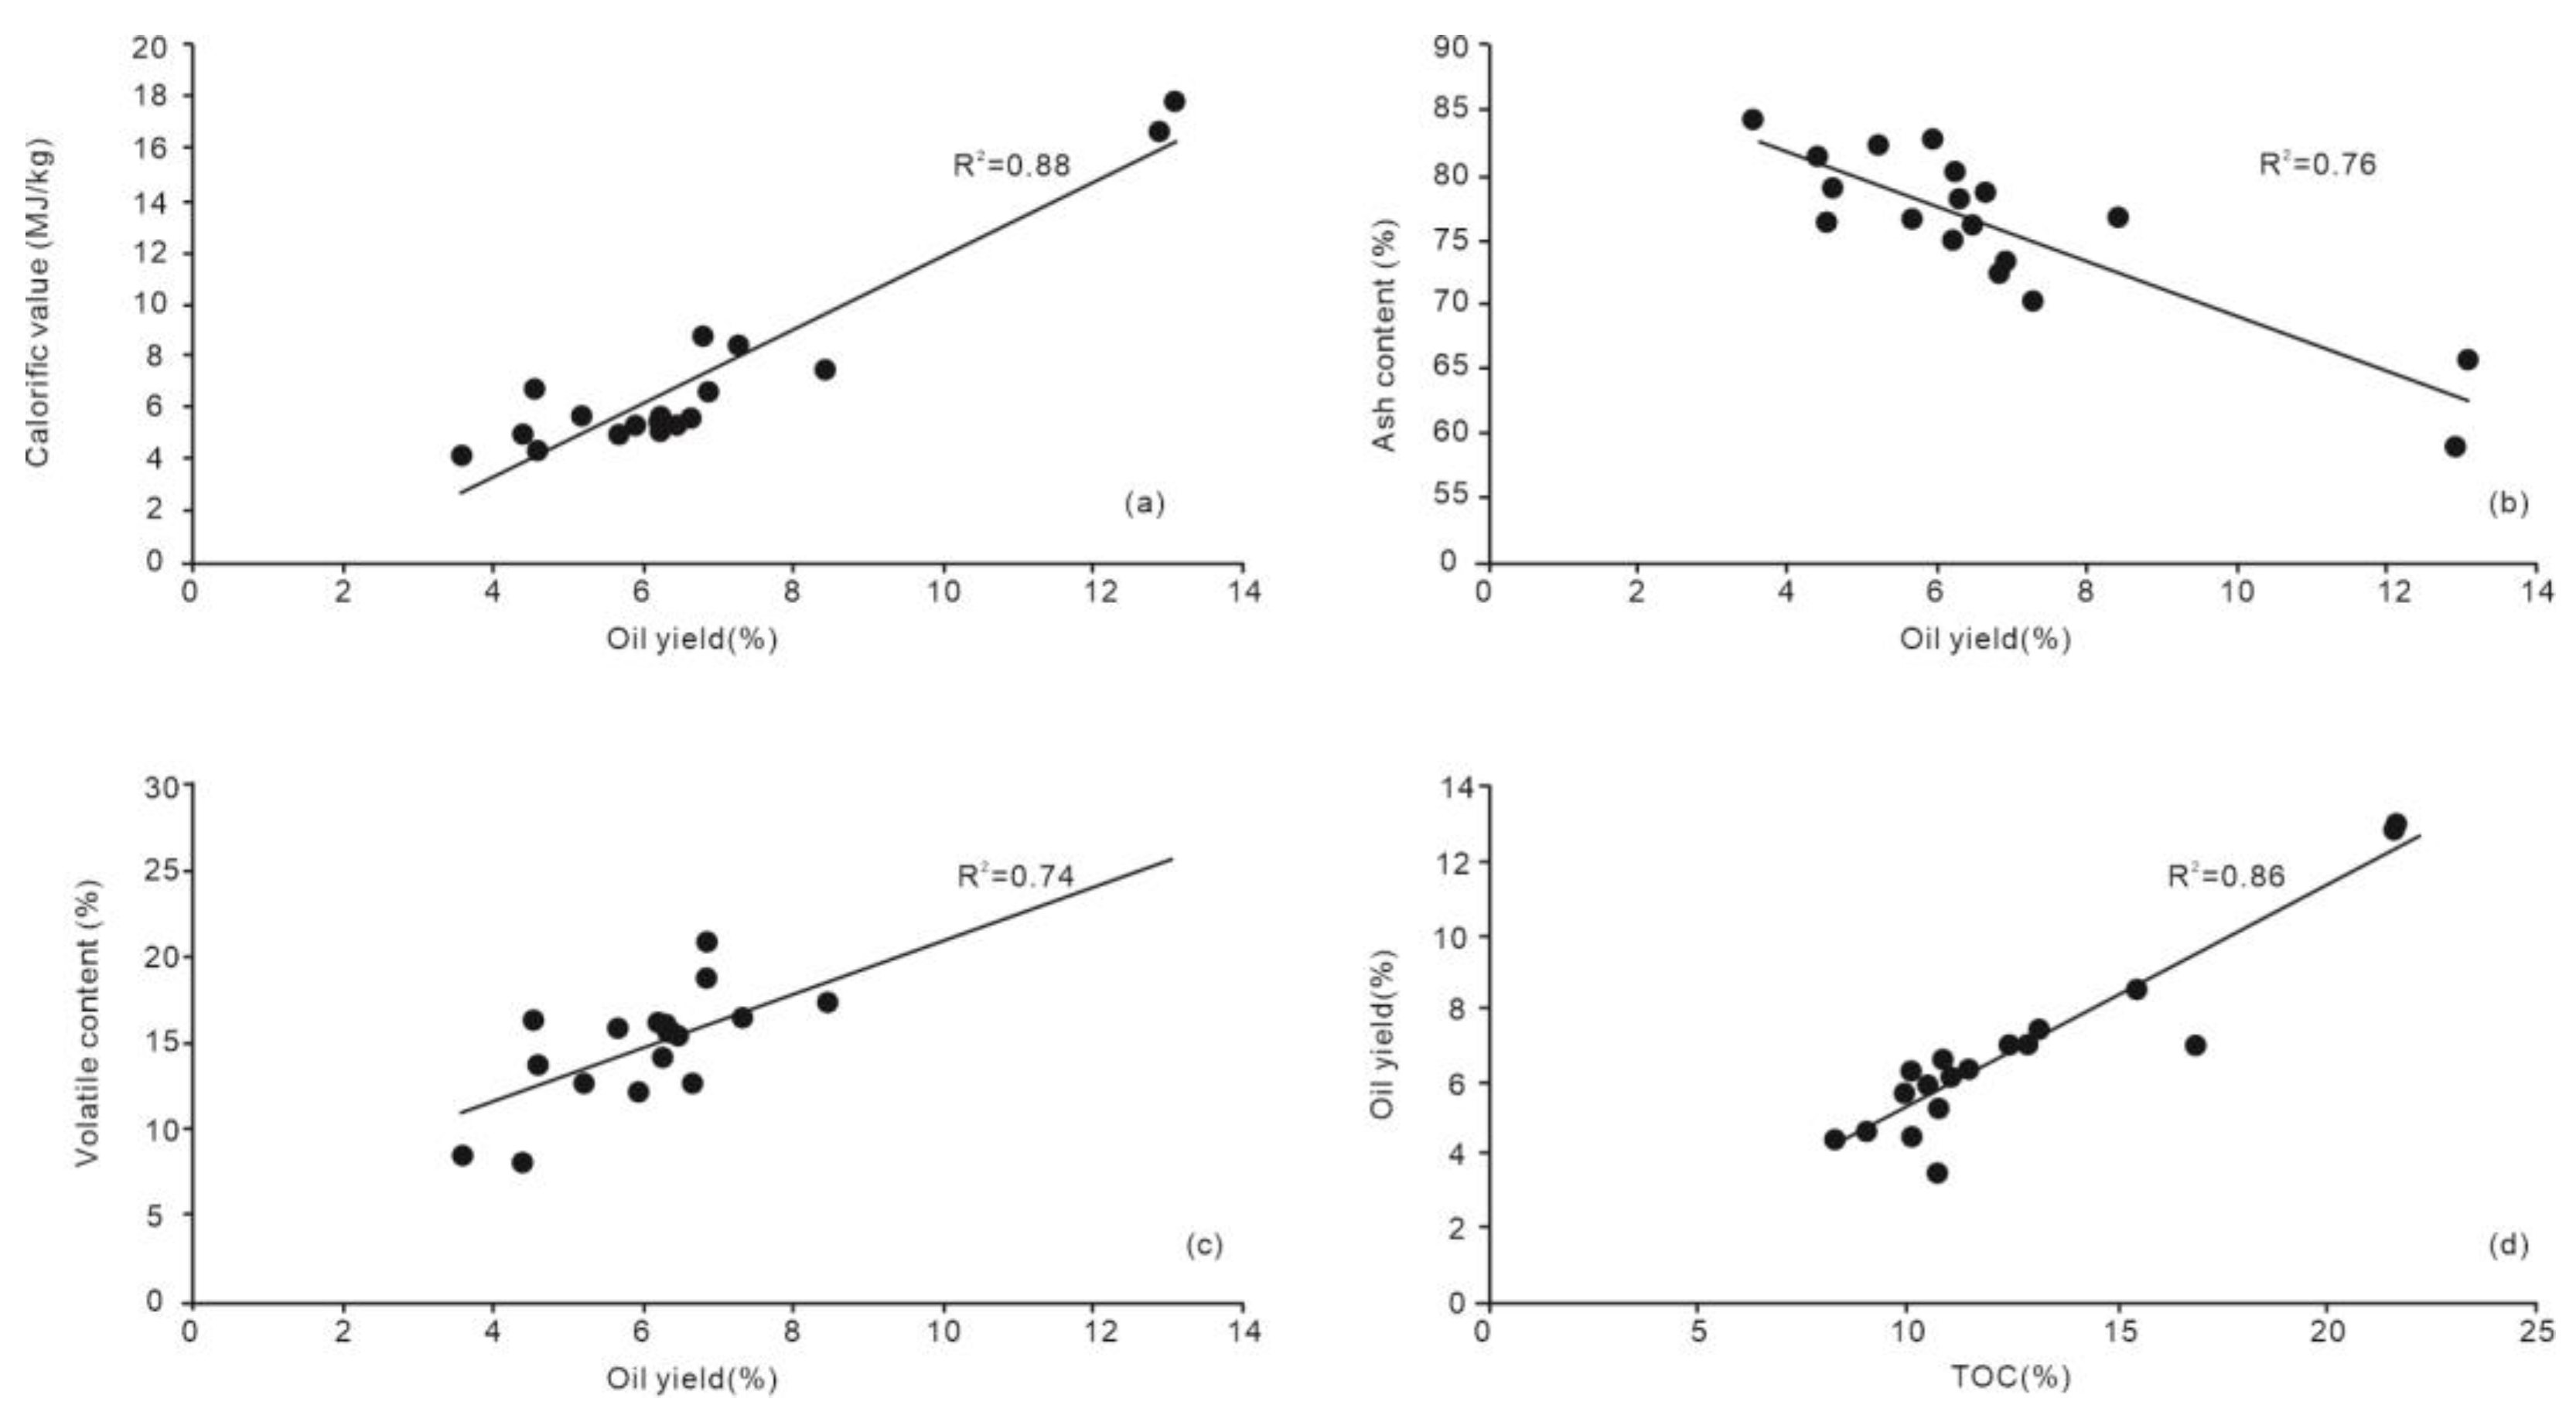
4.3.1. Oil Yield and Calorific Value
4.3.2. Ash Content, Volatile Content, and Total Sulfur
4.4. Evaluation Parameters of Hydrocarbon Source Rock
4.5. Inorganic Elements
4.5.1. Major Elements
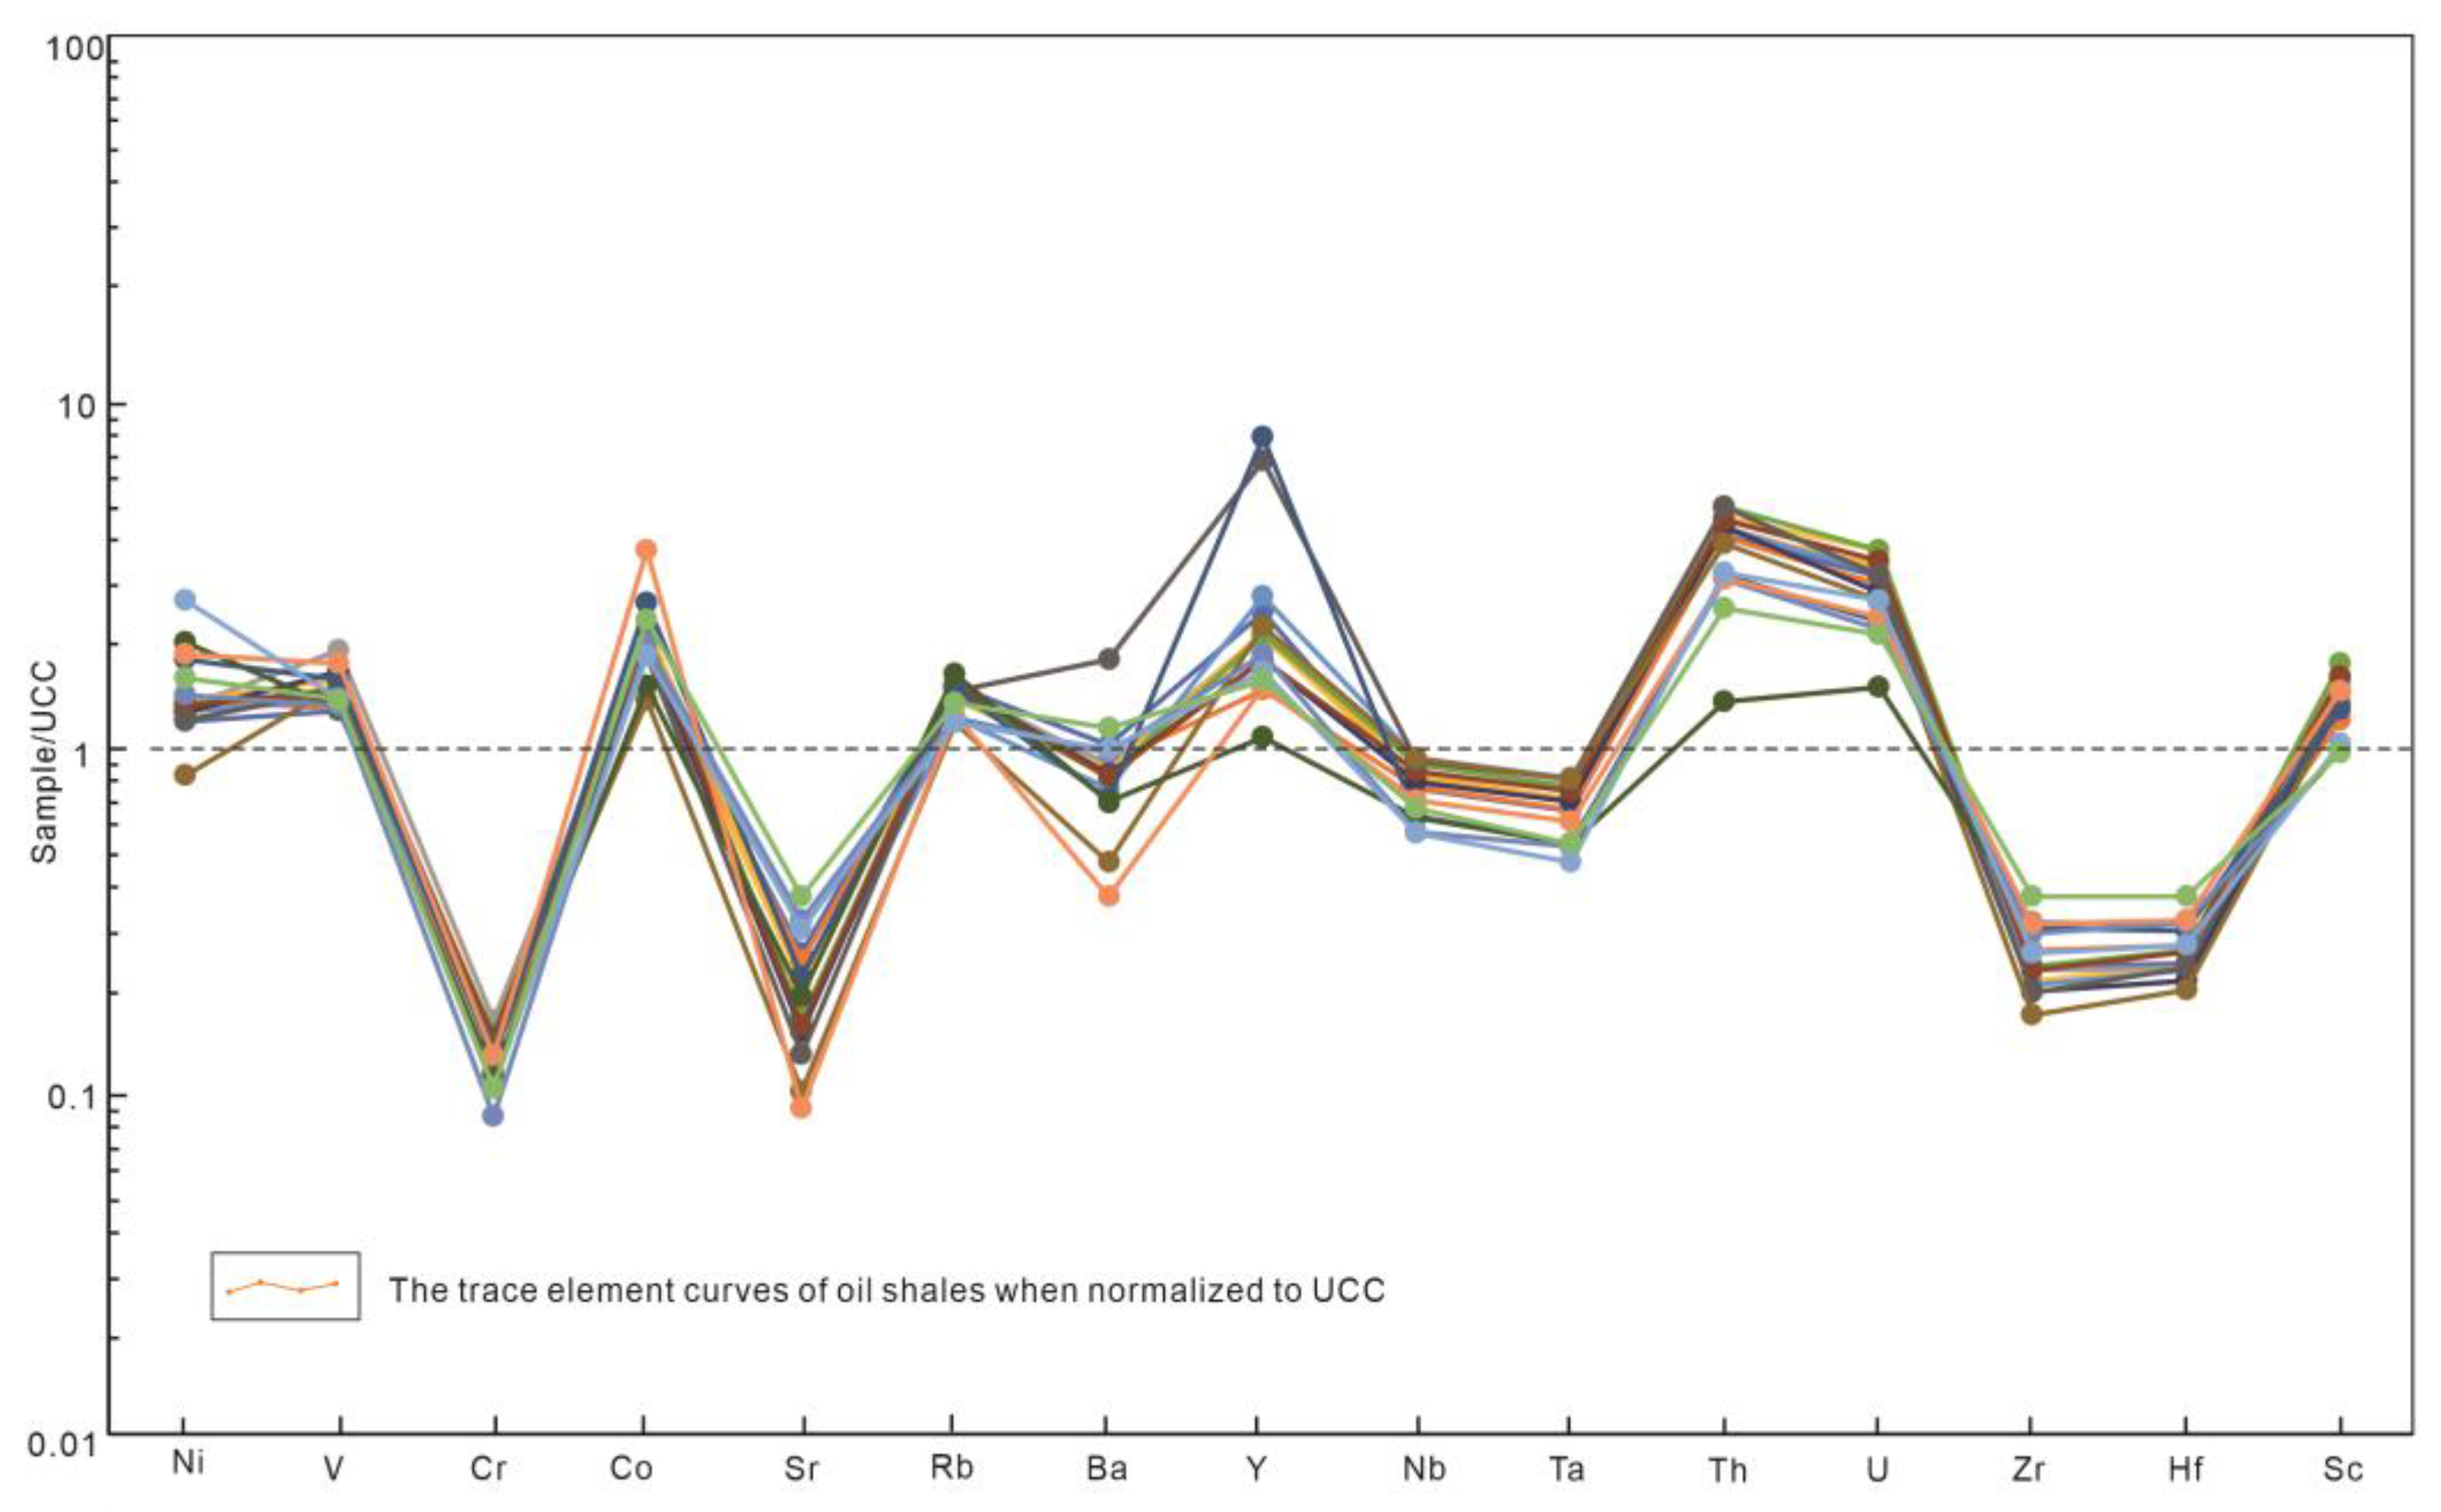
4.5.2. Trace Elements
4.5.3. Rare Earth Elements
5. Discussion
5.1. Comprehensive Oil Shale Quality
5.2. Hydrocarbon Generation Potential

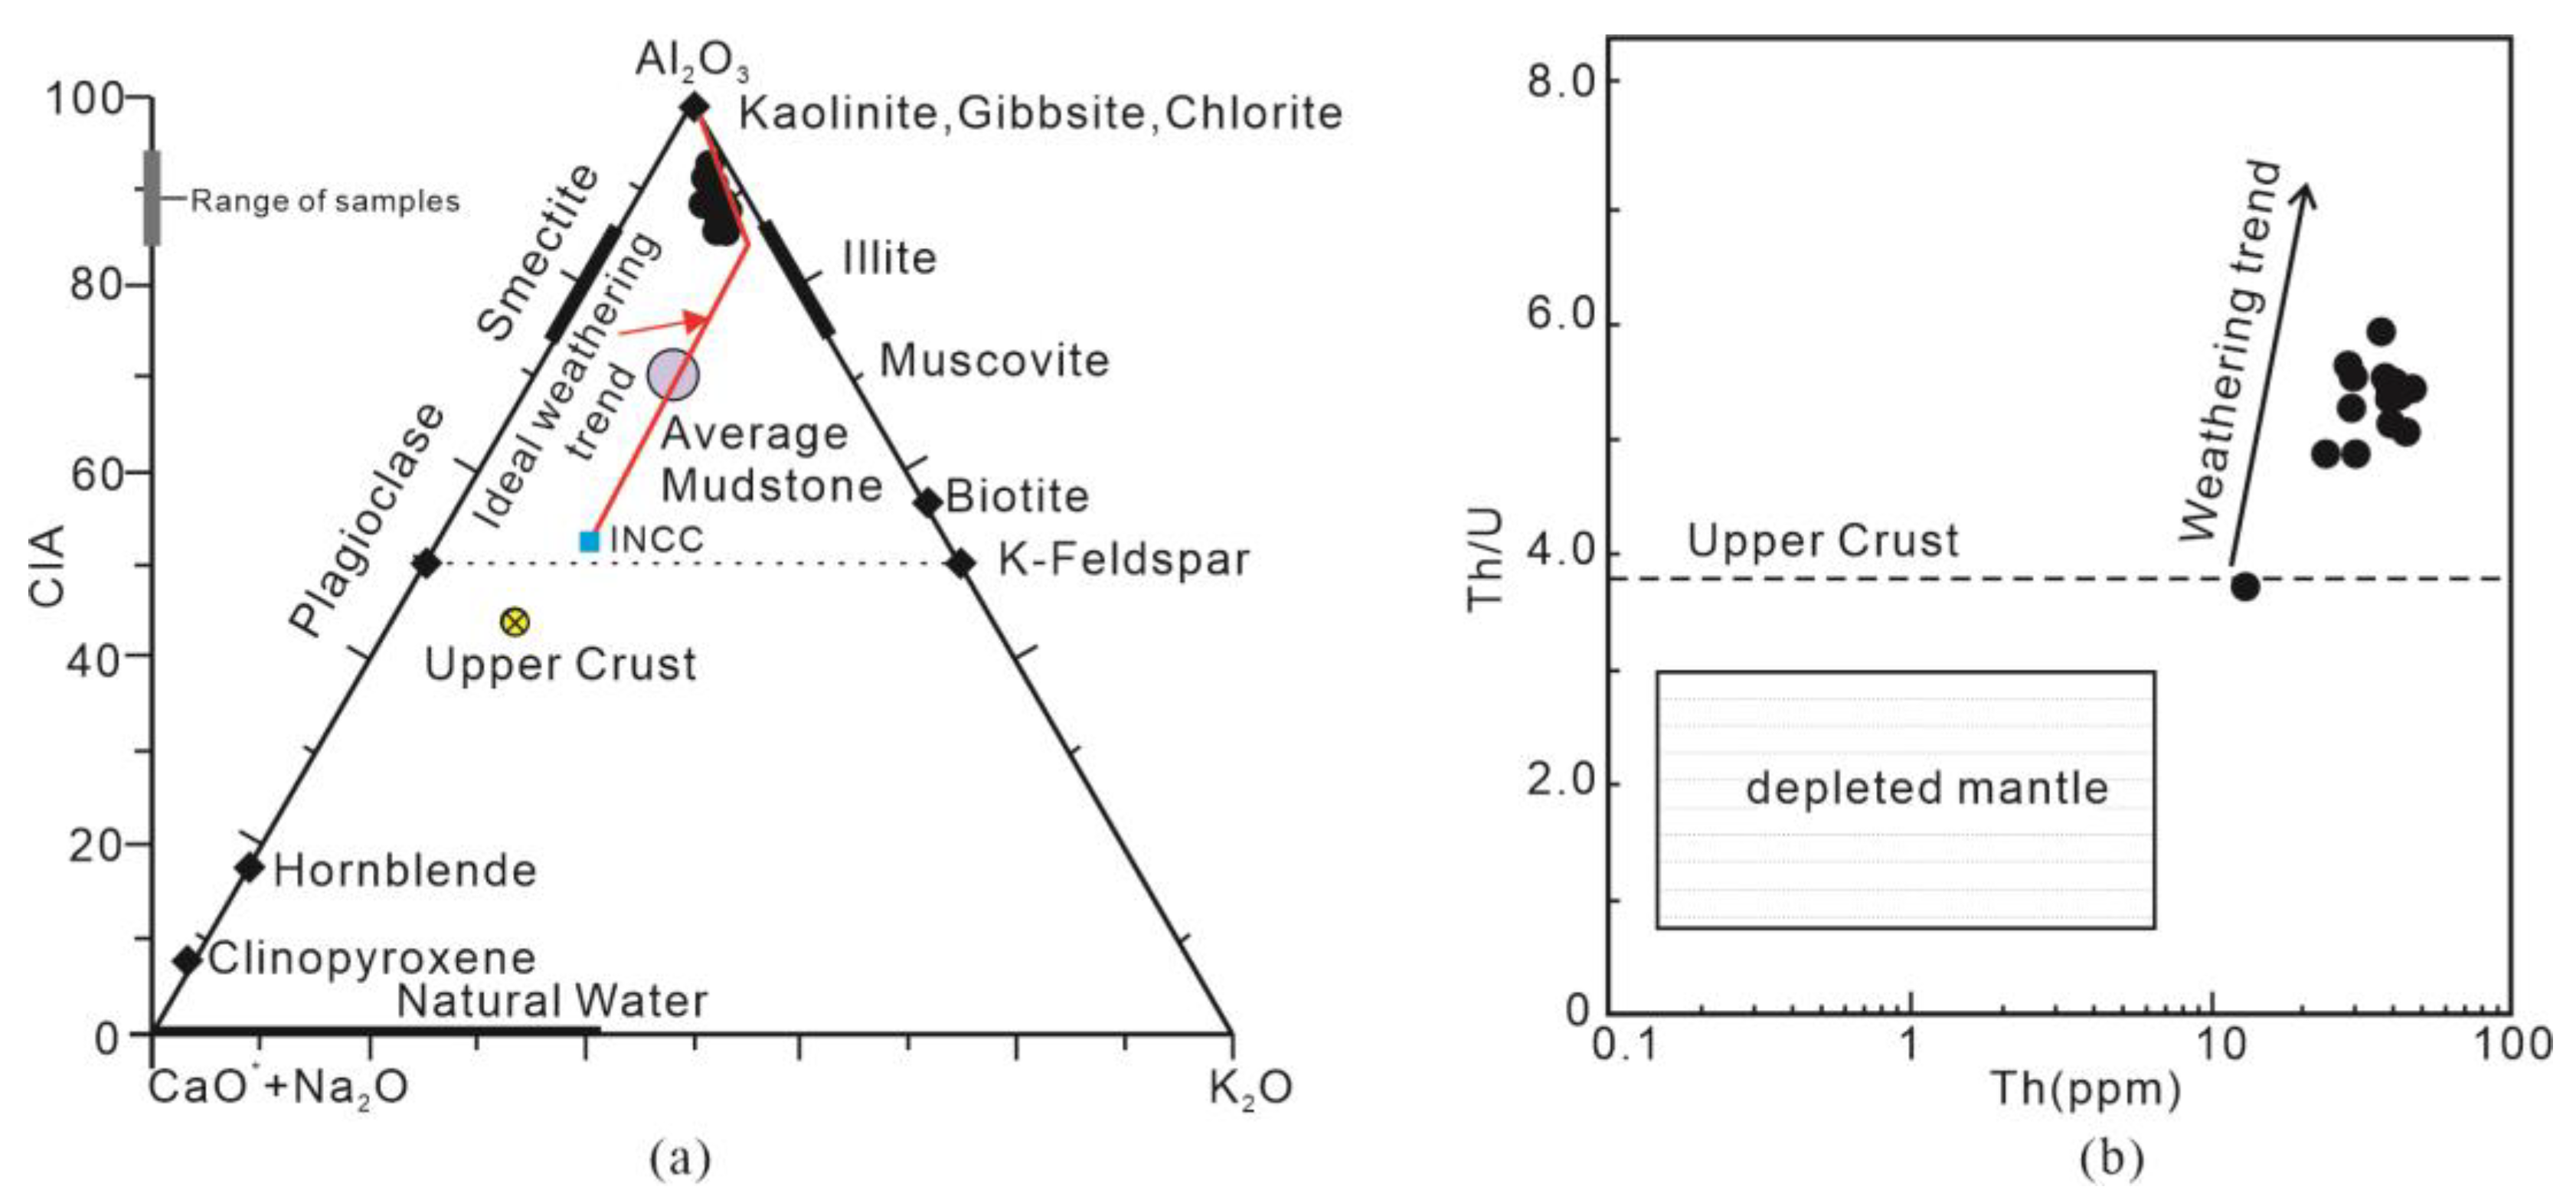
5.3. Weathering of Source Area
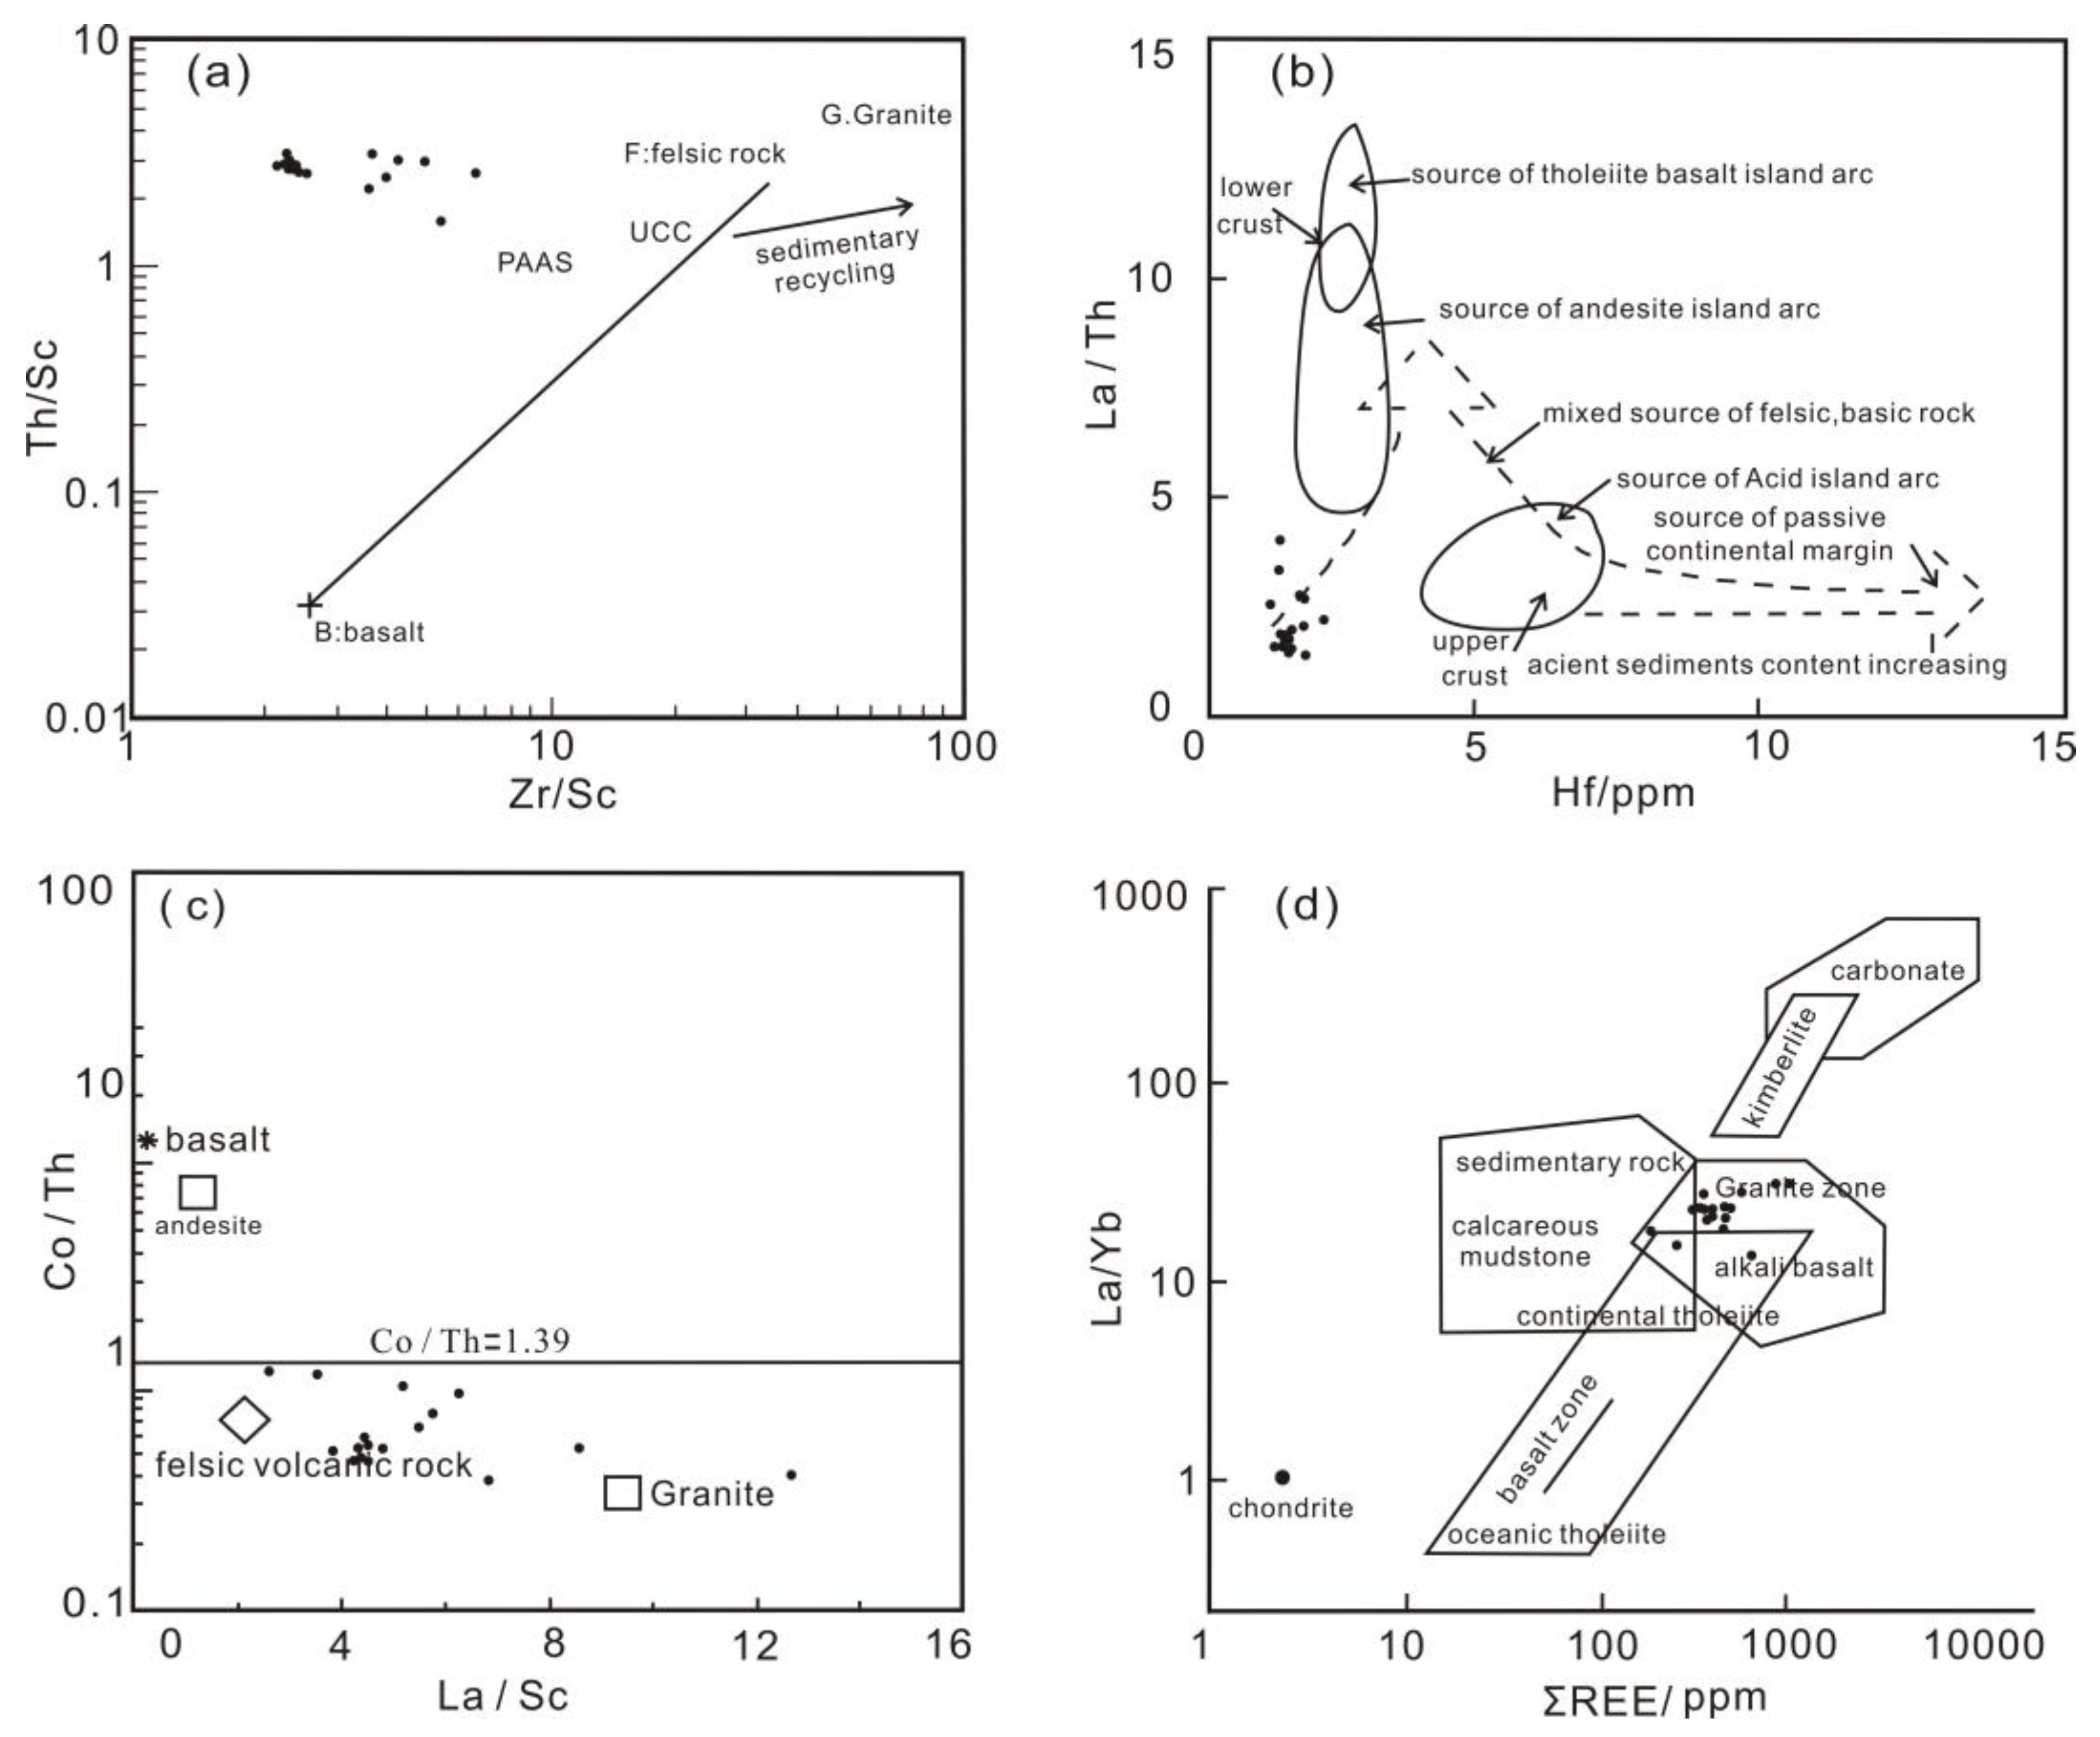
5.4. Parent Rock Types
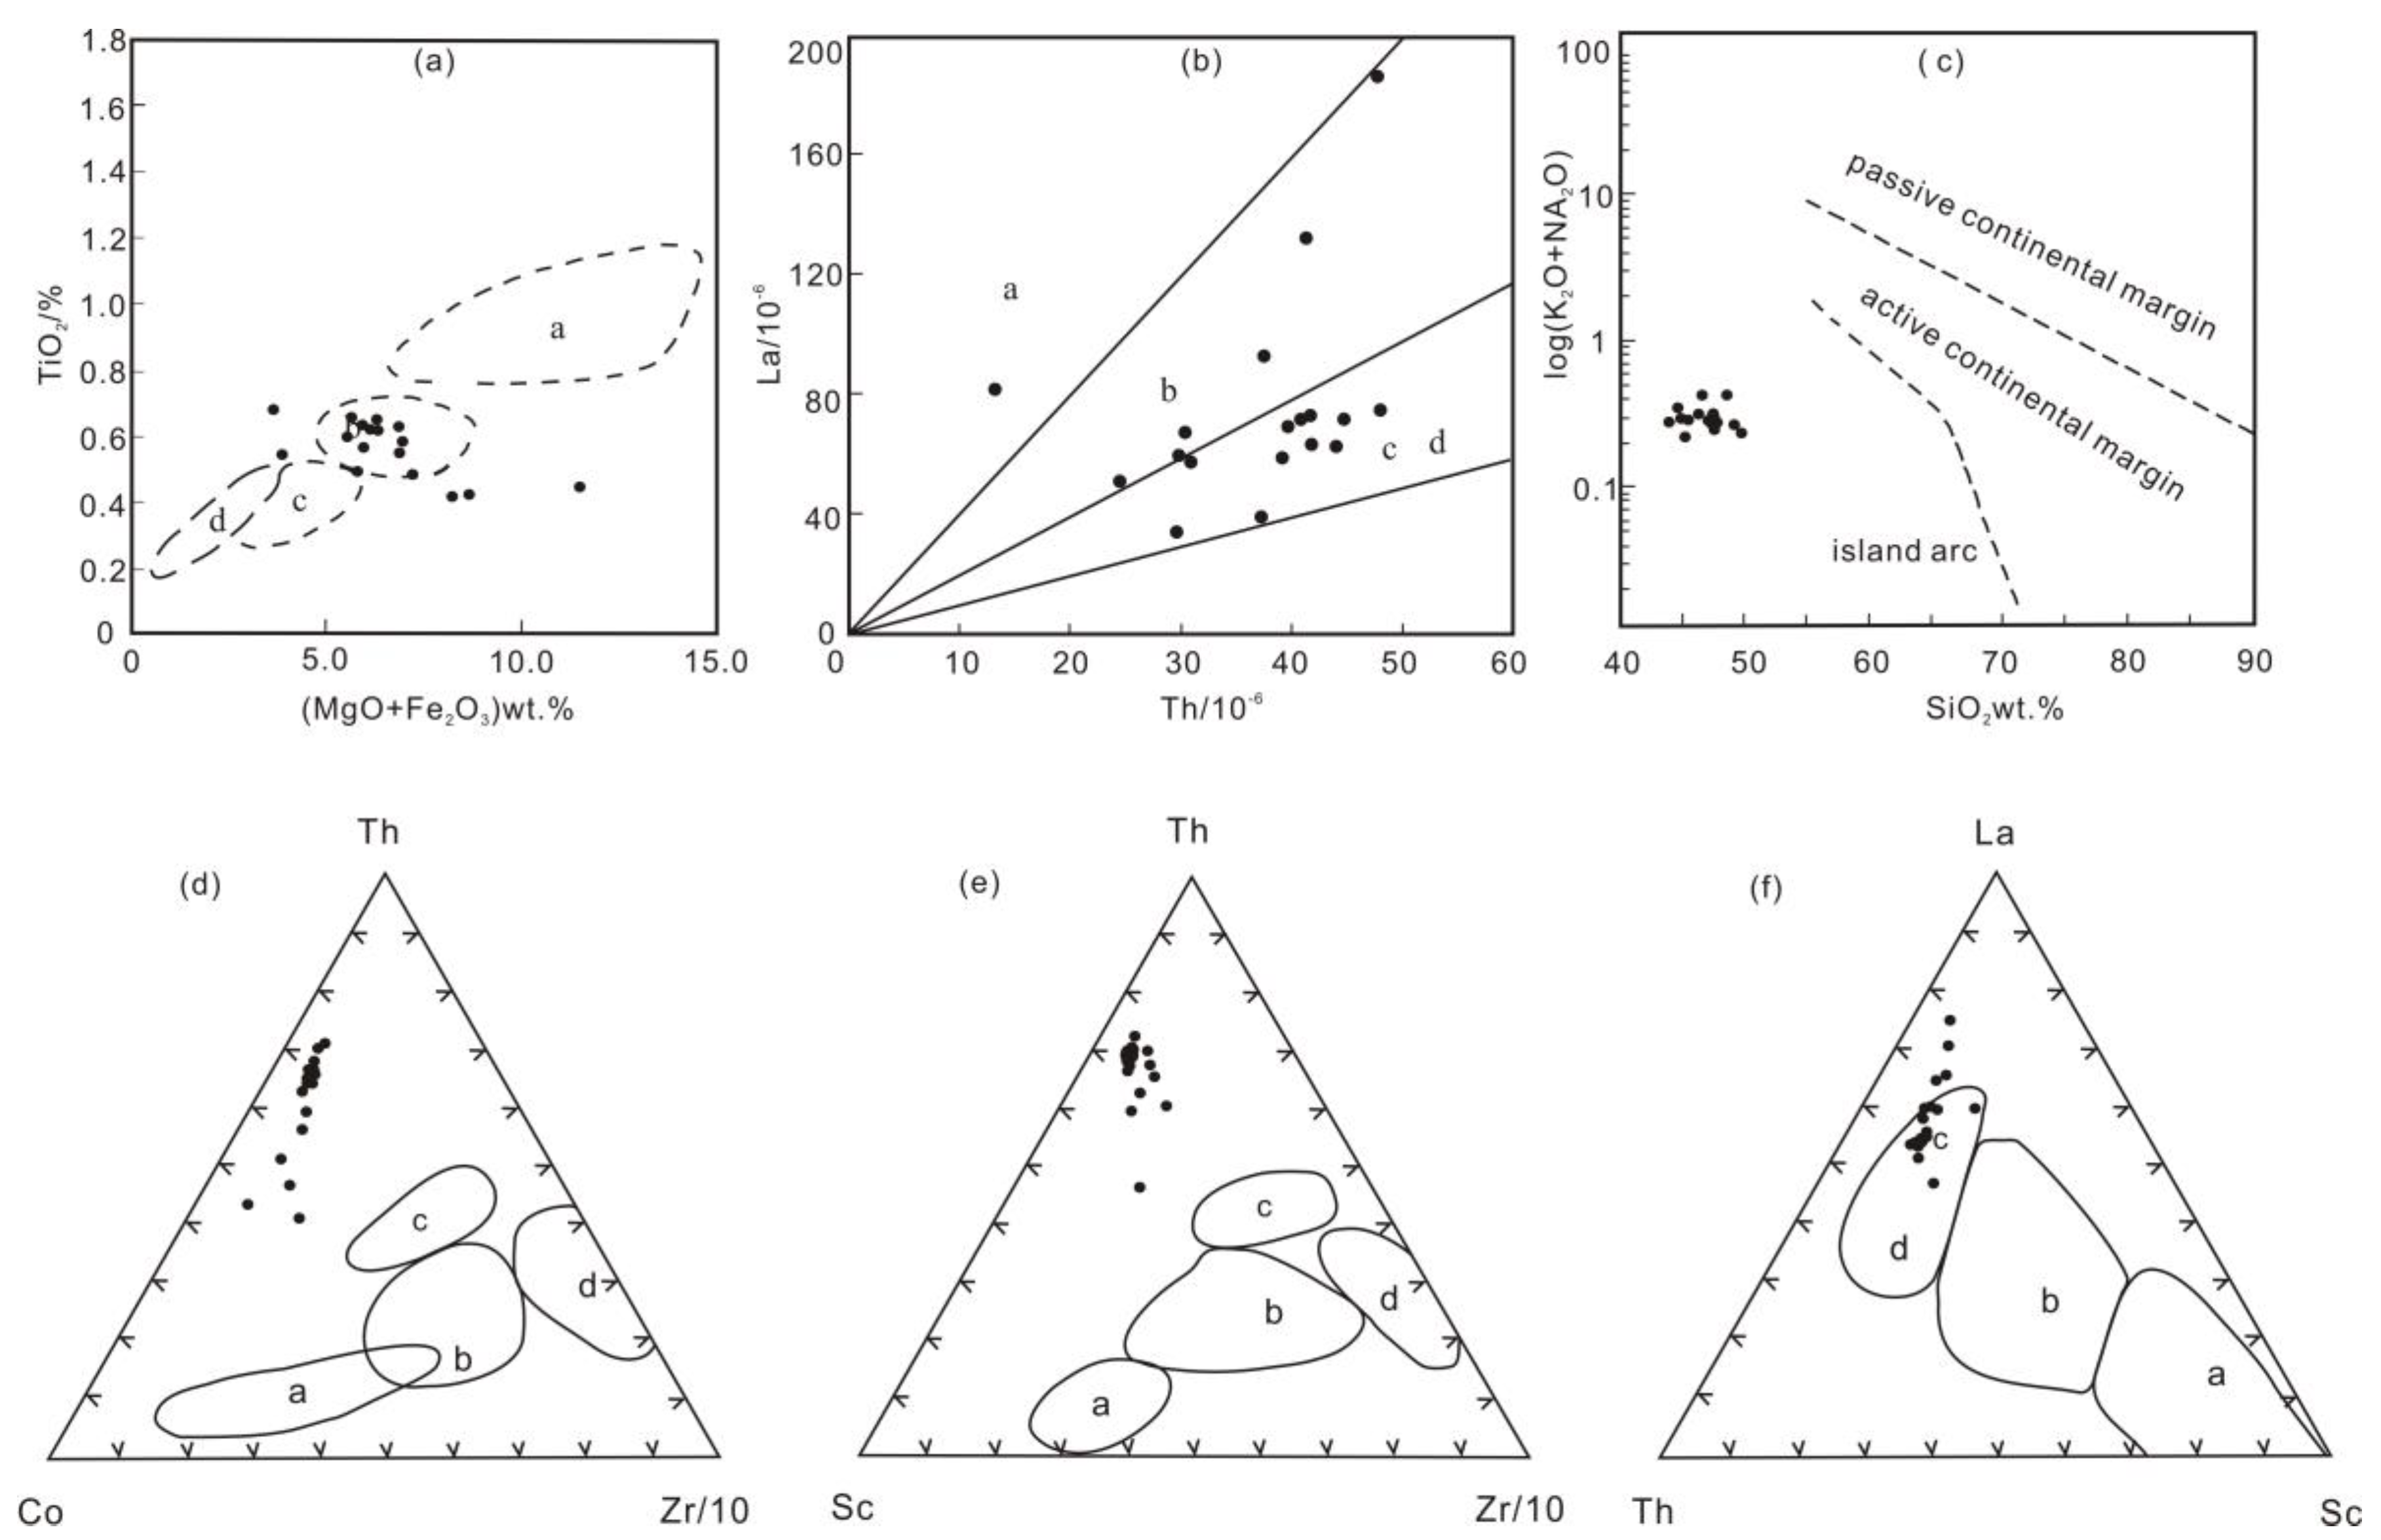
5.5. Tectonic Setting of Parent Rock Area
6. Conclusions
Author Contributions
Funding
Data Availability Statement
Acknowledgments
Conflicts of Interest
References
- Liu, Z.J.; Dong, Q.S.; Ye, S.Q.; Zhu, J.W.; Guo, W.; Li, D.C.; Liu, R.; Zhang, H.L.; Du, J.F. The situation of oil shale resources in China. J. Jilin Univ. (Earth Sci. Ed.) 2006, 36, 869–876. [Google Scholar]
- Liu, Z.J.; Yang, H.L.; Dong, Q.S.; Zhu, J.W.; Guo, W.; Ye, S.Q.; Liu, R.; Meng, Q.T.; Zhang, H.L.; Gan, S.C. Oil Shale in China; Petroleum Industry Press: Beijing, China, 2009; pp. 38–116. [Google Scholar]
- Mõtlep, R.; Kirsimäe, K.; Talviste, P.; Puura, E.; Jürgenson, J. Mineral composition of Estonian oil shale semi-coke sediments. Oil Shale 2007, 24, 405–422. [Google Scholar] [CrossRef]
- Bityukova, L.; Mõtlep, R.; Kirsimäe, K. Composition of oil shale ashes from pulverized firing and circulating fluidized-bed boiler in Narva Thermal Power Plants, Estonia. Oil Shale 2010, 27, 339–353. [Google Scholar] [CrossRef] [Green Version]
- Gan, S.C.; Yang, C.M.; Xu, J.J.; Lai, Y.W.; Li, G.H.; Xiao, G.S. Preparation and property analysis of artificial marble from oil shale ash. J. Jilin Univ. (Earth Sci. Ed.) 2011, 41, 879–884. [Google Scholar]
- Vallner, L.; Gavrilova, O.; Vilu, R. Environmental risks and problems of the optimal management of an oil shale semi-coke and ash landfill in Kohtla-Järve, Estonia. Sci. Total Environ. 2015, 524–525, 400–415. [Google Scholar] [CrossRef]
- Hu, F.; Liu, Z.J.; Meng, Q.T.; Song, Q.L.; Xie, W.Q. Characteristics and comprehensive utilization of oil shale of the Upper Cretaceous Qingshankou Formation in the southern Songliao Basin, NE China. Oil Shale 2017, 34, 312–335. [Google Scholar] [CrossRef]
- Xu, S.C.; Liu, Z.J.; Zhang, P.; Jeremy, M.B.; Liu, R.; Meng, Q.T. Characterization of depositional conditions for lacustrine oil shales in the Eocene Jijuntun Formation, Fushun Basin, NE China. Int. J. Coal Geol. 2016, 167, 10–30. [Google Scholar] [CrossRef] [Green Version]
- Song, Y.; Liu, Z.J.; Bechtel, A.; Sachsenhofer, R.F.; Groß, D.; Meng, Q.T. Paleoenvironmental reconstruction of the coal- and oil shale-bearing interval in the lower Cretaceous Muling Formation, Laoheishan Basin, northeast China. Int. J. Coal Geol. 2017, 172, 1–18. [Google Scholar] [CrossRef]
- Hu, F.; Liu, Z.J.; Meng, Q.T.; Wang, J.P.; Song, Q.L.; Xie, W.Q. Biomarker characterization of various oil shale grades in the Upper Cretaceous Qingshankou Formation, southern Songliao Basin, NE China. Oil Shale 2018, 35, 304–326. [Google Scholar] [CrossRef]
- Xue, M. Characteristics and Resource Potential of Oil Shale in the Lower Cretaceous Jiufotang Formation in Beipiao Basin. Master’s Thesis, Jilin University, Changchun, China, 2019. [Google Scholar]
- Goodarzi, F. A climate change event, detected in Viséan oil shales from Devon Island, Arctic Canada. Int. J. Coal Geol. 2020, 226, 103503. [Google Scholar] [CrossRef]
- Fathy, D.; Wagreich, M.; Sami, M. Geochemical evidence for photic zone euxinia during greenhouse climate in the Tethys Sea, Egypt. In Advances in Geophysics, Tectonics and Petroleum Geosciences; Springer: Cham, Switzerland, 2022; pp. 373–374. [Google Scholar]
- Hu, F.; Meng, Q.T.; Liu, Z.J. Petrological and geochemical characteristics of coal and oil shale of Paleogene Lijiaya Formation in Huangxian Basin, Eastern China: Implication for evolution of symbiotic formation mechanism. Geomech. Geophys. Geo-Energ. Geo-Resour. 2022, 8, 123. [Google Scholar] [CrossRef]
- Hepbasli, A. Oil shale as an alternative energy source. Energy Sources 2004, 26, 107e18. [Google Scholar] [CrossRef]
- Palayangoda, S.S.; Nguyen, Q.P. Thermal behavior of raw oil shale and its components. Oil Shale 2015, 32, 160–171. [Google Scholar] [CrossRef] [Green Version]
- Petkovic. Shale Oils. In The Science and Technology of Unconventional Oils, Finding Refining Opportunities; Ramirez-Corredores, M.M., Ed.; Academic Press: Cambridge, MA, USA, 2017; pp. 677–693. [Google Scholar]
- Guo, M. Characteristics and Mineralization Controlling Factors Oil Shale in Maoming Basin. Master’s Thesis, Jilin University, Changchun, China, 2007. [Google Scholar]
- Li, D.C.; Zhu, J.W.; Yan, H.R.; Guo, M.; Zheng, Z.W. Sedimentary characteristics and distribution rule of Oil Shale in Maoming Basin in Guangdong province. J. Jilin Univ. (Earth Sci. Ed.) 2006, 36, 938–943. [Google Scholar]
- Yan, H.R.; Zhu, J.W.; Li, D.C.; Guo, M. Jintang oil shale resources in Maoming Basin and its forming conditions. Glob. Geol. 2006, 25, 407–410. [Google Scholar]
- Zhou, Y.Y.; Qiu, N.S.; Ten, G.E.; Wang, J.; Cao, T.T.; Luo, H.Y. Geochemical characteristics and the geological significance of oil shales from the Youganwo Formation, Maoming Basin, China. Bull. Mineral. Petrol. Geochem. 2016, 35, 1270–1279. [Google Scholar]
- Chen, H.J.; Liu, Z.J.; Zhu, J.W.; Fu, Z.R.; Du, J.Y. The application of the acreage bearing likelihood ratio method to assessing oil shale resources: A case study of Maoming basin. Geol. China 2012, 39, 1427–1435. [Google Scholar]
- Jiang, D.H. Study on combustion characteristic of oil shale in Maoming. Clean Coal Technol. 2006, 12, 86–88. [Google Scholar]
- Xi, H.F.; Mu, J.C.; Wang, Z.G.; Wu, Y.H.; Li, S.Q.; Yu, C.L. Investigation on the present situation and new ways of application of oil shale waste in Maoming. New Build. Mater. 2012, 4, 58–60. [Google Scholar]
- Li, Y.; Cui, L.M.; Lin, Z.P.; Lei, Y.Z. Experimental research on preparation of white carbon black from oil shale ash in Maoming. Bull. Chin. Ceram. Soc. 2014, 33, 617–619. [Google Scholar]
- Fu, J.M.; Xu, F.F.; Chen, D.Y.; Liu, D.H.; Hu, C.Y.; Jia, R.F.; Xu, S.P. Biomarker compounds of biological inputs in Maoming oil shale. Geochimica 1985, 2, 99–114. [Google Scholar]
- Yu, Z.Q.; Peng, P.A.; Shen, G.Y.; Fu, J.M. Carbon isotope study of biomarkers in Maoming and Jianghan Tertiary oil shale. Sci. Bull. 2000, 45, 2783–2789. [Google Scholar] [CrossRef]
- Cao, X.X.; Song, Z.G.; Li, Y.; Wang, L. The characteristics of organic matter in Maoming oil shales and their paleoclimate significance. Earth Sci. Front. 2016, 23, 243–252. [Google Scholar]
- Xu, C.; Hu, F.; Meng, Q.T.; Liu, Z.J.; Shan, X.L.; Zeng, W.R.; Zhang, K.; He, W.T. Organic matter accumulation in the Youganwo Formation (Middle Eocene), Maoming Basin, south China: Constraints from multiple geochemical proxies and organic petrology. ACS Earth Space Chem. 2022, 6, 714–732. [Google Scholar] [CrossRef]
- Yang, J.T. Thermogravimetric investigation of Maoming oil shale pyrolysis kinetics. J. East China Petro. Inst. 1982, 3, 85–93. [Google Scholar]
- Hou, D.J.; Wang, P.R.; Lin, R.Z.; Li, S.J. Light hydrocarbons in pyrolysis gas of Maoming oil shale and its thermal evolution significance. J. Jianghan Petro. Inst. 1989, 11, 7–11. [Google Scholar]
- Liu, C.; Su, L.; Guan, B.W.; Zheng, Y.W.; Chang, J.; Zheng, J.J. Thermolytic dynamics and hydrocarbon generation characteristics of Maoming Oil Shale: Taking the geological model of Qiongdongnan Basin as an example. Litho. Reserve. 2014, 26, 89–97. [Google Scholar] [CrossRef]
- Dickinson, W.R. Interpreting provenance relations from detrital modes of sandstones. Proven. Arenite 1985, 148, 333–361. [Google Scholar]
- Odoma, A.N.; Obaje, N.G.; Omada, J.I.; Idakwo, S.O.; Erbacher, J. Mineralogical, chemical composition and distribution of rare earth elements in clayrich sediments from Southeastern Nigeria. J. Afr. Earth Sci. 2015, 102, 50–60. [Google Scholar] [CrossRef]
- Li, Y.J.; Sun, P.C.; Liu, Z.J.; Yao, S.Q.; Xu, Y.B.; Liu, R.; Li, Y. Geochemistry of the Permian oil shale in the Northern Bogda Mountain, Junggar Basin, Northwest China: Implications for weathering, provenance, and tectonic Setting. ACS Earth Space Chem. 2020, 4, 1332–1348. [Google Scholar] [CrossRef]
- Hu, F.; Meng, Q.T.; Liu, Z.J. Mineralogy and element geochemistry of oil shales in the Lower Cretaceous Qingshankou Formation of the southern Songliao Basin, northeast China: Implications of provenance, tectonic setting, and paleoenvironment. ACS Earth Space Chem. 2021, 5, 365–380. [Google Scholar] [CrossRef]
- Liu, B.; Song, Y.; Zhu, K.; Su, P.; Ye, X.; Zhao, W.C. Mineralogy and element geochemistry of salinized lacustrine organic-rich shale in the Middle Permian Santanghu Basin: Implications for paleoenvironment, provenance, tectonic setting and shale oil potential. Mar. Pet. Geol. 2020, 120, 104569. [Google Scholar] [CrossRef]
- Hu, F.; Liu, Z.J.; Wang, J.P. Provenance and tectonic setting of the Middle Permian Zhesi Formation in eastern Inner Mongolia, China: Implications from petrology, mineralogy, and element Geochemistry. ACS Earth Space Chem. 2022, 6, 1823–1835. [Google Scholar] [CrossRef]
- Guo, S.H.; Ruan, Z. The composition of Fushun and Maoming shale oils. Fuel 1995, 74, 1719–1721. [Google Scholar] [CrossRef]
- Nan, Y.; Zhou, G.Q. Stratigraphy (Lithostratic) of Guangdong Province. Multiple Classification and Correlation of the Stratigraphy of China; China University of Geosciences Press: Wuhan, China, 1996; p. 264. [Google Scholar]
- Jia, L. Cretaceous Tectono-Sedimentary Characteristics of Sanshui and Maoming Basins and Their Response to the Subduction of the Proto-South China Sea. Master’s Thesis, China University of Geosciences, Beijing, China, 2016. [Google Scholar]
- Dyni, J.R. Geology and resources of some world oil-shale deposits. Oil Shale 2003, 20, 193–252. [Google Scholar] [CrossRef]
- Qian, J.L.; Wang, J.Q.; Li, S.Y. World oil shale. Eng. China 2006, 28, 16–19. [Google Scholar]
- Hazra, B.; Singh, D.P.; Chakraborty, P.; Singh, P.K.; Sahu, S.G.; Adak, A.K. Using rock-eval S4Tpeak as thermal maturity proxy for shales. Mar. Pet. Geol. 2021, 127, 104977. [Google Scholar] [CrossRef]
- Hazra, B.; Katz, B.J.; Singh, D.P.; Singh, P.K. Impact of siderite on Rock-Eval S3 and oxygen index. Mar. Pet. Geol. 2022, 143, 105804. [Google Scholar] [CrossRef]
- Karayigit, A.I.; Oskay, R.G.; Gelik, Y. Mineralogy, petrography, and Rock-Eval pyrolysis of late Oligocene coal seams in the Malkara coal field from the Thrace Basin (NW Turkey). Int. J. Coal Geol. 2021, 244, 103841. [Google Scholar] [CrossRef]
- Zhang, N.; Lin, C.M.; Zhang, X. Petrographic and geochemical characteristics of the Paleogene sedimentary rocks from the North Jiangsu Basin, Eastern China: Implication for provenance and tectonic setting. Miner. Petrol. 2014, 108, 571–588. [Google Scholar] [CrossRef]
- Caplan, M.L.; Bustin, R.M. Palaeoceanographic controls on geochemical characteristics of organic-rich Exshaw mudrocks: Role of enhanced primary production. Org. Geochem. 1998, 30, 161–188. [Google Scholar] [CrossRef]
- Schindler, D.W.; Hecky, R.E.; Findlay, D.L.; Stainton, M.P.; Parker, B.R.; Paterson, M.J.; Beaty, K.G.; Lyng, M.; Kasian, S.E.M. Eutrophication of lake cannot be controlled by reducing nitrogen input: Results of a 37-year whole-ecosystem experiment. Proc. Natl. Acad. Sci. USA 2008, 105, 11254–11258. [Google Scholar] [CrossRef] [PubMed] [Green Version]
- Ross, D.J.K.; Bustin, R.M. Investigating the use of sedimentary geochemical proxies for paleoenvironment interpretation of thermally mature organic-rich strata: Examples from the Devonian-Mississippian shales, Western Canadian Sedimentary Basin. Chem. Geol. 2009, 260, 1–19. [Google Scholar] [CrossRef]
- Liu, G.; Zhou, D.S. Application of microelements analysis in identifying sedimentary environment- taking Qianjiang Formation in the Jianghan Basin as an example. Pet. Geol. Exp. 2007, 29, 307–310. [Google Scholar]
- Wu, X.S.; Guo, J.J.; Huang, Y.J.; Fu, J.W. Well logging proxy of the Late Cretaceous palaeoclimate change in Songliao Basin. J. Palaeogeogr. 2011, 13, 103–110. [Google Scholar]
- Meng, Q.T.; Liu, Z.J.; Bruch, A.A.; Liu, R.; Hu, F. Palaeoclimatic evolution during Eocene and its influence on oil shale mineralisation, Fushun basin, China. J. Asian Earth Sci. 2012, 45, 95–105. [Google Scholar] [CrossRef]
- Gould, K.M.; Piper, D.J.; Pe-Piper, G.; MacRae, R.A. Facies, provenance and palaeoclimate interpretation using spectral gamma logs, application to the Lower Cretaceous of the Scotian Basin. Mar. Pet. Geol. 2014, 57, 445–454. [Google Scholar] [CrossRef]
- Moldowan, J.M.; Dahl, J.; Jacobson, S.R.; Huizinga, B.J.; Fago, F.J.; Shetty, R.; Peters, K.E. Chemostratigraphic reconstruction of biofacies, molecular evidence linking cyst-forming dinoflagellates with pre-Triassic ancestors. Geology 1996, 24, 159–162. [Google Scholar] [CrossRef]
- Steiner, M.; Wallis, E.; Erdtmann, B.D.; Zhao, Y.; Yang, R. Submarine-hydrothermal exhalative ore layers in black shales from South China and associated fossils-insights into a Lower Cambrian facies and bio-evolution. Palaeogeogr. Palaeoclimatol. Palaeoecol. 2001, 169, 165–191. [Google Scholar] [CrossRef]
- Scheffler, K.; Buehmann, D.; Schwark, L. Analysis of late Palaeozoic glacial to postglacial sedimentary successions in South Africa by geochemical proxies−response to climate evolution and sedimentary environment. Palaeogeogr. Palaeoclimatol. Palaeoecol. 2006, 240, 184–203. [Google Scholar] [CrossRef]
- McLennan, S.M.; Hemming, S.; McDaniel, D.K.; Hanson, G.N. Geochemical approaches to sedimentation, provenance, and tectonics. Geol. Soc. Am. Spe. Pap. 1993, 284, 21–40. [Google Scholar]
- Johnsson, M.J. The System Controlling the Composition of Clastic Sediments. GSA Sp. Publ. 1993, 284, 1–19. [Google Scholar]
- McLennan, S.M. Rare earth elements in sedimentary rocks: Influence of provenance and sedimentary processes. Rev. Mineral. Geochem. 1989, 21, 169–200. [Google Scholar]
- Taylor, S.R.; McLennan, S.M. The Continental Crust: Its Composition and Evolution: An Examination of the Geochemical Record Preserved in Sedimentary Rocks; Science Press: Beijing, China, 1985. [Google Scholar]
- Zhao, L.Y.; Chen, J.N.; Wang, T.S. Grade dividing and composition of oil shale in China. Geoscience 1991, 5, 423–429. [Google Scholar]
- Liu, J.H.; Wu, Z.X.; Yu, S.; Jia, D.H. Paleocene trace element geochemistry and its geological significance in Lishui sag. China Offshore Oil Gas 2005, 17, 8–11. [Google Scholar]
- Chen, J.P.; Huang, D.F.; Chen, J.J.; Zhang, D.J.; Cheng, K.M.; Wang, T.G. Hydrocarbon Generation and Migration in Jiudong Basin; Petroleum Industry Press: Beijing, China, 1996. [Google Scholar]
- He, S.; Ye, J.R.; Xu, S.H.; Wang, F.R. Petroleum and Natural Gas Geology; China University of Geosciences Press: Wuhan, China, 2010; p. 185. [Google Scholar]
- Fedo, C.M.; Wayne Nesbitt, H.; Young, G.M. Unravelling the effects of potassium metasomatism in sedimentary rocks and paleosols, with implications for paleoweathering conditions and provenance. Geology 1995, 23, 921–924. [Google Scholar] [CrossRef]
- Peters, K.E. Guidelines for evaluating petroleum source rock using programmed pyrolysis. AAPG Bull. 1986, 70, 318–329. [Google Scholar]
- Langford, F.F.; Blanc-Valleron, M.M. Interpreting Rock-Eval pyrolysis data using graphs of pyrolizable hydrocarbons vs. total organic carbon. AAPG Bull. 1990, 74, 799–804. [Google Scholar]
- Zhang, B.; Cheng, W.; Zhang, Q.; Li, Y.; Sun, P.; Fathy, D. Occurrence Patterns and Enrichment Influencing Factors of Trace Elements in Paleogene Coal in the Fushun Basin, China. ACS Earth Space Chem. 2022, 6, 3031–3042. [Google Scholar] [CrossRef]
- Condie, K.C.; Noll, P.D.; Conway, C.M. Geochemical and detrital mode evidence for two sources of Early Proterozoic sedimentary rocks from Tonto Basin Supergroup, Central Arizona. Sediment. Geol. 1992, 77, 51–76. [Google Scholar] [CrossRef]
- Song, Y.; Li, S.; Hu, S. Warm-humid paleoclimate control of salinized lacustrine organic-rich shale deposition in the Oligocene Hetaoyuan Formation of the Biyang Depression, East China. Int. J. Coal Geol. 2019, 202, 69–84. [Google Scholar] [CrossRef]
- Nesbitt, H.W.; Young, G.M. Early proterozoic climate and plate motion inferred from major element chemistry of lutites. Nature 1982, 299, 715–717. [Google Scholar] [CrossRef]
- Nesbitt, H.W.; Young, G.M. Formation and diagenesis of weathering profiles. J. Geol. 1989, 97, 129–147. [Google Scholar] [CrossRef]
- Gao, S.; Luo, T.C.; Zhang, B.R.; Zhang, H.F.; Han, Y.W.; Zhao, Z.D.; Hu, Y.K. Chemical composition of the continental crust as revealed by studies in East China. Geochim. Cosmochim. Acta 1998, 62, 1959–1975. [Google Scholar] [CrossRef]
- Fathy, D.; Wagreich, M.; Ntaflos, T.; Sami, M. Provenance Characterization of Campanian Lacustrine Organic-Rich Mudstones on the Southern Tethyan Margin, Egypt. ACS Earth Space Chem. 2021, 5, 197–209. [Google Scholar] [CrossRef]
- Sun, S.; Chen, A.Q.; Chen, H.C.; Hou, M.C.; Yang, S.; Xu, S.L.; Wang, F.; Huang, Z.F.; Ogg, J.G. Early Permian chemical weathering indices and paleoclimate transition linked to the end of the coal-forming episode, Ordos Basin, North China Craton. Palaeogeogr. Palaeoclimatol. Palaeoecol. 2022, 585, 110743. [Google Scholar] [CrossRef]
- Herman, A.B.; Spicer, R.A.; Aleksandrova, G.N.; Yang, J.; Kodrul, T.M.; Maslova, N.P.; Spicer, T.E.V.; Chen, G.; Jin, J.H. Eocene−early Oligocene climate and vegetation change in southern China: Evidence from the Maoming Basin. Palaeogeogr. Palaeoclimatol. Palaeoecol. 2017, 479, 126–137. [Google Scholar] [CrossRef] [Green Version]
- Armstrong-Altrin, J.S.; Nagarajan, R.; Balaram, V.; Natalhy-Pineda, O. Petrography and geochemistry of sands from the Chachalacas and Veracruz Beach Areas, Western Gulf of Mexico, Mexico: Constraints on provenance and tectonic Setting. J. S. Am. Earth Sci. 2015, 64, 199–216. [Google Scholar] [CrossRef]
- Cox, R.; Lowe, D.R.; Cullers, R.L. The influence of sediment recycling and basement composition on evolution of mudrock chemistry in the Southwestern United States. Geochim. Cosmochim. Acta 1995, 59, 2919–2940. [Google Scholar] [CrossRef]
- Cullers, R.; Podkovyrov, V.N. Geochemistry of the mesoproterozoic lakhandashales in southeastern Yakutia. Russia: Implications for mineralogical and provenance control, and recycling. Precambrian Res. 2000, 104, 77–93. [Google Scholar] [CrossRef]
- Li, S.L.; Wang, X.L.; Xu, X.Y.; Zhang, H.J.; Liu, X.D.; Li, J.W. Characteristics of the Maokou’an Reef in the Zhesiaobao, Inner Mongolia. Acta Sedimentol. Sin. 2004, 22, 434–442. [Google Scholar]
- Song, T.S.; Zhu, Z.P.; Qu, X.Y. Organic geochemistry characteristics of marine dark mudstone in the Middle Permian Zhesi Formation in Suolun Area of Inner Mongolia. Geol. Bull. China 2011, 30, 301–307. [Google Scholar]
- Charles, K.; Makenya, A.H.M.; Shukrani, M. Geochemistry of fine-grained clastic sedimentary rocks of the Neoproterozoic Ikorongo Group, NE Tanzania: Implications for provenance and source rock weathering. Precambrian Res. 2008, 164, 201–213. [Google Scholar]
- Roddaz, M.; Viers, J.; Brusset, S.; Baby, P.; Boucayrand, C.; Herail, G. Controls on weathering and provenance in the Amazonian foreland basin: Insights from major and trace element geochemistry of Neogene Amazonian sediments. Chem. Geol. 2006, 226, 31–65. [Google Scholar] [CrossRef]
- Floyd, P.A.; Leveridge, B.E. Tectonic environment of the Devonian Gramscatho Basin, South Cornwall: Framework mode and geochemical evidence from turbiditic sandstone. J. Geol. Soc. 1987, 144, 531–542. [Google Scholar] [CrossRef]
- Wronkiewicz, D.J.; Condie, K.C. Geochemistry of Archean shales from the Witwatersrand Supergroup, South Africa: Source-area weathering and provenance. Geochim. Cosmochim. Acta 1987, 51, 2401–2416. [Google Scholar] [CrossRef]
- Allegre, C.J.; Minster, J.F. Quantitative models of trace element behavior in magmatic processes. Earth Planet. Sci. Lett. 1978, 38, 1–25. [Google Scholar] [CrossRef]
- Bhatia, M.R. Plate tectonics and geochemical composition of sandstone. J. Geol. 1983, 91, 611–627. [Google Scholar] [CrossRef]
- Bhatia, M.R.; Crook, K.A.W. Trace element characteristics of graywackes and tectonic setting discrimination of sedimentary basins. Contrib. Mineral. Petrol. 1986, 92, 181–193. [Google Scholar] [CrossRef]
- Akarish, A.I.M.; El-Gohary, A.M. Petrography and geochemistry of Lower Paleozoic sandstones, East Sinai, Egypt: Implications for provenance and tectonic setting. J. Afr. Earth. Sci. 2008, 52, 43–54. [Google Scholar] [CrossRef]
- Roser, B.P.; Korsch, R.J. Provenance signatures of sandstone mudstone suites determined using discriminant function analysis of major-element data. Chem. Geol. 1988, 67, 119–139. [Google Scholar] [CrossRef]
- McLennan, S.M. Relationships between the trace element composition of sedimentary rocks and upper continental crust. Geochem. Geophys. Geosyst. 2001, 2, 1021. [Google Scholar] [CrossRef]
- Hu, F.; Liu, Z.J.; Meng, Q.T.; Xu, J.J. Petrography and geochemistry of Cenozoic sandstones in the Dunhua Basin, northeast China: Implications for provenance, source weathering, and tectonic setting. Russ. J. Pac. Geol. 2020, 14, 48–65. [Google Scholar] [CrossRef]
- Wen, X.F. Tectonic Features of the Basins at the North Margin of the South China Sea from Cretaceous to Oldest Eogene. Master’s Thesis, China University of Geosciences, Beijing, China, 2014. [Google Scholar]
- Liang, X. Late Mesozoic Sedimentary Records of Maoming Basin and Its Relationship with the Evolution of Proto-South China Sea. Master’s Thesis, China University of Geosciences, Beijing, China, 2015. [Google Scholar]


| Samples | Quartz (%) | Pyrite (%) | Clay (%) | Clay Mineral | Oil Yield (%) | Calorific (MJ/kg) | Industrial Analysis | TOC (%) | Pyrolysis Parameter | ||||||||
|---|---|---|---|---|---|---|---|---|---|---|---|---|---|---|---|---|---|
| Smectite Mixed Layer (%) | Illite (%) | Kaolinite (%) | Chlorite (%) | Ash (%) | Volatile (%) | Total Sulfur (%) | S1 (mg/g) | S2 (mg/g) | S1 + S2 (mg/g) | Tmax (°C) | |||||||
| YJ01-1 | 18.8 | / | 81.2 | 47 | 5 | 48 | / | 6.44 | 5.31 | 76.2 | 15.41 | 0.16 | 10.9 | 0.96 | 74.41 | 75.37 | 431 |
| YJ01-2 | 20.8 | / | 79.2 | 59 | 4 | 37 | / | 6.63 | 5.59 | 78.6 | 12.66 | 0.26 | 10.9 | 0.80 | 68.76 | 69.56 | 429 |
| YJ01-3 | 24.4 | / | 75.6 | 55 | 5 | 28 | 12 | 8.40 | 7.42 | 76.8 | 17.38 | 0.09 | 15.4 | 1.32 | 106.37 | 107.69 | 429 |
| YJ01-4 | 20.3 | / | 79.7 | 49 | 6 | 34 | 11 | 4.57 | 4.27 | 79 | 13.79 | 0.17 | 8.9 | 0.61 | 49.01 | 49.62 | 429 |
| YJ01-5 | 20.4 | / | 79.6 | 43 | 5 | 42 | 10 | 6.23 | 5.12 | 80.1 | 14.25 | 0.11 | 10.1 | 0.65 | 67.21 | 67.86 | 431 |
| YJ01-6 | 22.7 | / | 77.3 | 47 | 6 | 43 | 4 | 4.36 | 4.98 | 81.4 | 8.04 | 0.08 | 8.2 | 0.65 | 53.76 | 54.41 | 430 |
| YJ01-7 | 22.4 | / | 77.6 | 40 | 5 | 43 | 12 | 5.90 | 5.35 | 82.6 | 12.2 | 0.10 | 10.5 | 0.83 | 65.84 | 66.67 | 433 |
| YJ01-8 | 22.5 | / | 77.5 | 50 | 6 | 44 | / | 6.27 | 5.69 | 78.2 | 15.49 | 0.20 | 11.5 | 0.90 | 73.62 | 74.52 | 432 |
| YJ01-9 | 24.1 | / | 75.9 | 55 | 4 | 30 | 11 | 6.18 | 5.43 | 75.4 | 16.05 | 0.12 | 11.0 | 1.10 | 70.46 | 71.56 | 432 |
| YJ01-10 | 21.3 | / | 78.7 | 49 | 4 | 32 | 15 | 5.19 | 5.57 | 82.3 | 12.68 | 0.19 | 10.7 | 1.14 | 59.27 | 60.41 | 430 |
| YJ01-11 | 17.0 | / | 83 | 46 | 5 | 37 | 12 | 5.65 | 4.89 | 76.6 | 15.68 | 0.18 | 9.9 | 1.30 | 66.14 | 67.44 | 434 |
| JT01-1 | 34.1 | / | 65.9 | 61 | 5 | 27 | 7 | 6.88 | 6.57 | 73.1 | 18.42 | 0.44 | 12.4 | 1.20 | 82.09 | 83.29 | 434 |
| JT01-2 | 21.8 | / | 78.2 | 54 | 5 | 33 | 8 | 3.56 | 4.19 | 84.2 | 8.51 | 1.75 | 10.7 | 0.90 | 57.91 | 58.81 | 428 |
| JT01-3 | 36.5 | / | 63.5 | 55 | 6 | 39 | / | 6.82 | 8.84 | 72.6 | 20.67 | 0.94 | 16.8 | 1.07 | 140.78 | 141.85 | 427 |
| JT01-4 | 39.9 | / | 60.1 | 45 | 6 | 40 | 9 | 4.52 | 6.72 | 76.4 | 15.99 | 0.61 | 10.1 | 2.05 | 111.87 | 113.92 | 432 |
| JT01-5 | 37.4 | / | 62.6 | 39 | 3 | 49 | 9 | 7.28 | 8.43 | 70.4 | 16.58 | 0.59 | 13.1 | 1.49 | 85.62 | 87.11 | 434 |
| JT01-6 | 32.2 | 14.2 | 53.6 | 54 | 7 | 32 | 7 | 12.89 | 16.66 | 59 | 27.85 | 2.73 | 21.4 | 2.60 | 172.28 | 174.88 | 434 |
| JT01-7 | 35.1 | / | 64.9 | 49 | 8 | 35 | 8 | 13.07 | 17.79 | 66 | 22.92 | 1.00 | 21.6 | 1.01 | 71.84 | 72.85 | 430 |
| Average | 26.2 | 0.8 | 73.0 | 49.8 | 5.3 | 37.4 | 9.6 | 6.71 | 7.16 | 76.1 | 15.81 | 0.54 | 12.5 | 1.14 | 82.07 | 83.21 | 431 |
| Samples | SiO2 | Al2O3 | Fe2O3 | MgO | CaO | Na2O | K2O | MnO | Ti2O | P2O5 | LOI | CIA | ICV |
|---|---|---|---|---|---|---|---|---|---|---|---|---|---|
| YJ01-1 | 46.93 | 19.94 | 4.66 | 0.88 | 0.25 | 0.06 | 1.67 | 0.02 | 0.59 | 0.06 | 24.79 | 90.97 | 0.41 |
| YJ01-2 | 47.37 | 18.58 | 5.12 | 0.84 | 0.47 | 0.18 | 1.63 | 0.03 | 0.55 | 0.16 | 24.96 | 89.07 | 0.47 |
| YJ01-3 | 43.84 | 17.23 | 6.03 | 0.88 | 0.47 | 0.13 | 1.56 | 0.04 | 0.55 | 0.09 | 28.73 | 88.86 | 0.56 |
| YJ01-4 | 47.61 | 21.01 | 5.50 | 0.80 | 0.17 | 0.10 | 1.60 | 0.02 | 0.64 | 0.07 | 22.31 | 91.83 | 0.42 |
| YJ01-5 | 47.47 | 20.21 | 5.33 | 0.79 | 0.26 | 0.09 | 1.52 | 0.02 | 0.61 | 0.10 | 23.53 | 91.53 | 0.43 |
| YJ01-6 | 49.03 | 21.48 | 4.89 | 0.75 | 0.23 | 0.08 | 1.58 | 0.02 | 0.65 | 0.08 | 21.01 | 91.91 | 0.38 |
| YJ01-7 | 47.05 | 20.78 | 5.17 | 0.76 | 0.14 | 0.07 | 1.62 | 0.01 | 0.62 | 0.07 | 23.49 | 91.91 | 0.40 |
| YJ01-8 | 45.38 | 19.75 | 6.18 | 0.77 | 0.20 | 0.07 | 1.66 | 0.02 | 0.57 | 0.11 | 25.00 | 91.10 | 0.48 |
| YJ01-9 | 46.17 | 19.81 | 5.51 | 0.82 | 0.14 | 0.07 | 1.74 | 0.02 | 0.61 | 0.06 | 24.83 | 91.04 | 0.45 |
| YJ01-10 | 44.80 | 20.70 | 6.17 | 0.69 | 0.12 | 0.07 | 1.67 | 0.01 | 0.62 | 0.09 | 24.69 | 91.76 | 0.45 |
| YJ01-11 | 49.54 | 21.24 | 3.14 | 0.50 | 0.07 | 0.07 | 1.50 | 0.01 | 0.67 | 0.06 | 23.13 | 92.83 | 0.28 |
| JT01-1 | 44.48 | 15.81 | 10.79 | 0.71 | 0.12 | 0.08 | 1.84 | 0.02 | 0.44 | 0.12 | 25.26 | 88.57 | 0.89 |
| JT01-2 | 48.37 | 16.52 | 4.99 | 0.80 | 0.21 | 0.10 | 2.14 | 0.01 | 0.49 | 0.04 | 25.74 | 87.08 | 0.53 |
| JT01-3 | 39.33 | 14.07 | 8.00 | 0.67 | 0.43 | 0.11 | 1.76 | 0.08 | 0.42 | 0.13 | 34.86 | 85.95 | 0.82 |
| JT01-4 | 45.12 | 16.35 | 3.30 | 0.57 | 0.12 | 0.03 | 1.48 | 0.02 | 0.54 | 0.03 | 32.10 | 90.93 | 0.37 |
| JT01-5 | 46.18 | 18.80 | 3.73 | 0.61 | 0.14 | 0.14 | 1.74 | 0.02 | 0.48 | 0.19 | 27.49 | 90.30 | 0.36 |
| JT01-6 | 36.22 | 14.27 | 7.64 | 0.62 | 0.37 | 0.10 | 1.71 | 0.03 | 0.41 | 0.10 | 37.94 | 86.75 | 0.76 |
| JT01-7 | 46.48 | 15.46 | 6.48 | 0.75 | 0.28 | 0.13 | 2.10 | 0.04 | 0.48 | 0.08 | 27.13 | 86.03 | 0.66 |
| Average | 45.63 | 18.45 | 5.70 | 0.73 | 0.23 | 0.09 | 1.70 | 0.02 | 0.55 | 0.09 | 26.50 | 89.91 | 0.51 |
| Samples | Li | Be | Sc | V | Cr | Co | Ni | Cu | Zn | Rb | Sr | Th | Zr | U | Sb | Cs | Ba |
|---|---|---|---|---|---|---|---|---|---|---|---|---|---|---|---|---|---|
| YJ01-1 | 81.8 | 4.39 | 15.6 | 82.4 | 46.9 | 18.2 | 23 | 35 | 94.8 | 156 | 68 | 44.7 | 37.5 | 9.4 | 0.48 | 23.6 | 407 |
| YJ01-2 | 71.2 | 4.72 | 15.6 | 69.9 | 45 | 16.9 | 21.8 | 34.1 | 84.6 | 154 | 82.8 | 39.6 | 41.1 | 7.89 | 0.52 | 24.9 | 510 |
| YJ01-3 | 70.9 | 4.51 | 12.1 | 71.1 | 42.6 | 17.4 | 25 | 33 | 91.7 | 145 | 78.5 | 39.1 | 45.9 | 7.52 | 0.54 | 23.3 | 452 |
| YJ01-4 | 90 | 4.78 | 16 | 104 | 53.9 | 19 | 24 | 36.2 | 115 | 152 | 53.9 | 41.6 | 40.2 | 8.26 | 0.57 | 27.4 | 450 |
| YJ01-5 | 89.5 | 5.12 | 15.8 | 86 | 48.9 | 20.1 | 25 | 35.7 | 104 | 141 | 70.9 | 40.8 | 40.3 | 8.5 | 0.61 | 25.3 | 433 |
| YJ01-6 | 80.7 | 5.13 | 15.3 | 74.8 | 44.2 | 18.6 | 23.3 | 30.4 | 109 | 125 | 54.2 | 41.3 | 36.5 | 8.1 | 0.51 | 22.1 | 385 |
| YJ01-7 | 86 | 4.57 | 17.5 | 77.1 | 49.7 | 19.2 | 24.6 | 36.7 | 104 | 145 | 54.2 | 48 | 41.1 | 9.39 | 0.25 | 22.6 | 417 |
| YJ01-8 | 74.7 | 4.66 | 14.5 | 90.5 | 46.3 | 18.3 | 23.1 | 29.4 | 98.8 | 154 | 49.2 | 41.8 | 34.9 | 7.1 | 0.57 | 25.5 | 422 |
| YJ01-9 | 79.9 | 4.63 | 16.1 | 80.6 | 48.2 | 19.3 | 24.2 | 35.9 | 111 | 153 | 51.6 | 44 | 40.3 | 8.74 | 0.27 | 28.3 | 415 |
| YJ01-10 | 72.2 | 6.03 | 14.6 | 80.4 | 45.9 | 16.8 | 22 | 28.5 | 109 | 149 | 42.4 | 47.7 | 34.6 | 7.99 | 0.38 | 25.6 | 902 |
| YJ01-11 | 56.8 | 3.48 | 13.4 | 83.2 | 43.1 | 12.5 | 15.3 | 27.2 | 71.6 | 121 | 33.3 | 37.5 | 30 | 6.73 | 0.51 | 22.4 | 236 |
| JT01-1 | 56.4 | 10.7 | 12.9 | 85.9 | 41.5 | 23.8 | 32.7 | 28.4 | 156 | 151 | 71.1 | 30.4 | 53 | 5.86 | 0.96 | 29.6 | 360 |
| JT01-2 | 50 | 4.52 | 9.88 | 71.1 | 37.8 | 13.8 | 36.5 | 30.1 | 60.6 | 166 | 62.5 | 13.3 | 54.7 | 3.82 | 1.15 | 34.9 | 351 |
| JT01-3 | 66.8 | 5.88 | 10.1 | 72.6 | 28.6 | 18.2 | 25.9 | 23.6 | 86.8 | 125 | 103 | 29.6 | 51.2 | 5.6 | 0.74 | 19.1 | 484 |
| JT01-4 | 30.6 | 4.7 | 14.6 | 95.4 | 42.6 | 33.7 | 33.8 | 38.1 | 60.8 | 127 | 29.8 | 29.8 | 54.3 | 6.05 | 1.06 | 24.8 | 189 |
| JT01-5 | 33.7 | 5.7 | 9.81 | 62.8 | 29.6 | 18 | 22.1 | 29.7 | 183 | 92.6 | 303 | 37.2 | 73.4 | 5.37 | 1.59 | 18.6 | 949 |
| JT01-6 | 66.2 | 4.9 | 10.3 | 75.7 | 34.8 | 16.8 | 48.2 | 44.1 | 87.6 | 121 | 96.6 | 30.9 | 45 | 6.77 | 1.40 | 18.4 | 499 |
| JT01-7 | 48.5 | 7.46 | 9.69 | 75.3 | 34.5 | 21.2 | 28.9 | 35.7 | 74.8 | 137 | 120 | 24.5 | 65.1 | 5.38 | 0.89 | 23.6 | 572 |
| Average | 66.99 | 5.33 | 13.54 | 79.93 | 42.45 | 18.99 | 26.63 | 32.88 | 100.17 | 139.7 | 79.17 | 36.77 | 46.51 | 7.14 | 0.72 | 24.44 | 468.5 |
| UCC | 20 | 3 | 11 | 60 | 35 | 10 | 20 | 25 | 71 | 112 | 350 | 10.7 | 190 | 2.8 | 0.2 | 3.7 | 550 |
| Samples | La | Ce | Pr | Nd | Sm | Eu | Gd | Tb | Dy | Ho | Er | Tm | Yb | Lu | LREE | HREE | REE |
|---|---|---|---|---|---|---|---|---|---|---|---|---|---|---|---|---|---|
| YJ01-1 | 71.4 | 133 | 16.3 | 57.6 | 10.3 | 1.97 | 9.07 | 1.54 | 7.65 | 1.44 | 3.97 | 0.69 | 4.16 | 0.6 | 290.57 | 29.12 | 319.69 |
| YJ01-2 | 69.2 | 128 | 15.4 | 57.4 | 10.1 | 1.98 | 9.19 | 1.61 | 8.42 | 1.75 | 4.82 | 0.85 | 5.31 | 0.77 | 282.08 | 32.72 | 314.8 |
| YJ01-3 | 58.5 | 110 | 11.9 | 45.2 | 7.73 | 1.38 | 6.48 | 1.11 | 5.44 | 1.02 | 2.88 | 0.49 | 2.91 | 0.42 | 234.71 | 20.75 | 255.46 |
| YJ01-4 | 72.7 | 136 | 15.9 | 60.9 | 10.4 | 2.02 | 9.09 | 1.63 | 7.75 | 1.52 | 4.17 | 0.72 | 4.39 | 0.62 | 297.92 | 29.89 | 327.81 |
| YJ01-5 | 70.7 | 133 | 14.9 | 59 | 10.1 | 2.05 | 8.92 | 1.59 | 8.13 | 1.56 | 4.39 | 0.73 | 4.63 | 0.63 | 289.75 | 30.58 | 320.33 |
| YJ01-6 | 132 | 247 | 26.7 | 101 | 16.9 | 3.02 | 14.6 | 2.42 | 11.5 | 2.12 | 5.66 | 0.91 | 5.74 | 0.76 | 526.62 | 43.71 | 570.33 |
| YJ01-7 | 75.1 | 141 | 16.7 | 64.5 | 10.8 | 2.15 | 9.46 | 1.66 | 7.97 | 1.5 | 4.2 | 0.72 | 4.47 | 0.63 | 310.25 | 30.61 | 340.86 |
| YJ01-8 | 63.1 | 114 | 14.1 | 50 | 8.37 | 1.57 | 7.54 | 1.3 | 6.48 | 1.25 | 3.51 | 0.61 | 3.81 | 0.53 | 251.14 | 25.03 | 276.17 |
| YJ01-9 | 62.7 | 116 | 13.6 | 48.9 | 9.19 | 1.68 | 7.71 | 1.35 | 6.76 | 1.28 | 3.71 | 0.64 | 4.01 | 0.57 | 252.07 | 26.03 | 278.1 |
| YJ01-10 | 186 | 255 | 27.4 | 108 | 16.9 | 3.2 | 17.7 | 3.07 | 15.7 | 3.42 | 9.48 | 1.51 | 8.1 | 1.15 | 596.5 | 60.13 | 656.63 |
| YJ01-11 | 92.4 | 162 | 18 | 69 | 11.1 | 2.01 | 9.78 | 1.68 | 8.11 | 1.6 | 4.34 | 0.71 | 4.45 | 0.61 | 354.51 | 31.28 | 385.79 |
| JT01-1 | 67.1 | 124 | 14.4 | 52.2 | 9.05 | 1.8 | 7.95 | 1.4 | 7.5 | 1.48 | 4.05 | 0.72 | 4.43 | 0.62 | 268.55 | 28.15 | 296.7 |
| JT01-2 | 81.6 | 163 | 19.6 | 83.7 | 14.8 | 3.28 | 16.9 | 3.18 | 16.8 | 3.83 | 10.3 | 1.61 | 8.75 | 1.24 | 365.98 | 62.61 | 428.59 |
| JT01-3 | 34.3 | 56.6 | 6.45 | 23.7 | 3.94 | 0.77 | 3.58 | 0.67 | 3.58 | 0.78 | 2.28 | 0.42 | 2.67 | 0.42 | 125.76 | 14.4 | 140.16 |
| JT01-4 | 58.9 | 111 | 12.7 | 47.5 | 8.03 | 1.54 | 7.29 | 1.25 | 6.42 | 1.3 | 3.65 | 0.62 | 3.85 | 0.55 | 239.67 | 24.93 | 264.6 |
| JT01-5 | 39.1 | 73 | 8.93 | 34.9 | 6.98 | 1.3 | 5.65 | 1.05 | 5.61 | 1.12 | 3.29 | 0.58 | 3.68 | 0.53 | 164.21 | 21.51 | 185.72 |
| JT01-6 | 57.2 | 98.6 | 11.4 | 44 | 7.48 | 1.34 | 6.55 | 1.07 | 5.73 | 1.11 | 3.15 | 0.53 | 3.3 | 0.46 | 220.02 | 21.9 | 241.92 |
| JT01-7 | 50.7 | 92.8 | 10.5 | 43 | 7.04 | 1.28 | 6.42 | 1.07 | 5.32 | 1.06 | 3.06 | 0.49 | 2.96 | 0.42 | 205.32 | 20.8 | 226.12 |
| Average | 74.59 | 133 | 15.27 | 58.36 | 9.96 | 1.91 | 9.1 | 1.59 | 8.05 | 1.62 | 4.5 | 0.75 | 4.53 | 0.64 | 293.09 | 30.79 | 323.88 |
| chondrite | 0.31 | 0.81 | 0.12 | 0.6 | 0.2 | 0.07 | 0.26 | 0.05 | 0.32 | 0.07 | 0.21 | 0.32 | 0.21 | 0.03 | 2.11 | 1.47 | 3.58 |
Disclaimer/Publisher’s Note: The statements, opinions and data contained in all publications are solely those of the individual author(s) and contributor(s) and not of MDPI and/or the editor(s). MDPI and/or the editor(s) disclaim responsibility for any injury to people or property resulting from any ideas, methods, instructions or products referred to in the content. |
© 2023 by the authors. Licensee MDPI, Basel, Switzerland. This article is an open access article distributed under the terms and conditions of the Creative Commons Attribution (CC BY) license (https://creativecommons.org/licenses/by/4.0/).
Share and Cite
Hu, F.; Meng, Q.; Liu, Z.; Xu, C.; Zhang, X. Petrology, Mineralogy, and Geochemical Characterization of Paleogene Oil Shales of the Youganwo Formation in the Maoming Basin, Southern China: Implication for Source Rock Evaluation, Provenance, Paleoweathering and Maturity. Energies 2023, 16, 514. https://doi.org/10.3390/en16010514
Hu F, Meng Q, Liu Z, Xu C, Zhang X. Petrology, Mineralogy, and Geochemical Characterization of Paleogene Oil Shales of the Youganwo Formation in the Maoming Basin, Southern China: Implication for Source Rock Evaluation, Provenance, Paleoweathering and Maturity. Energies. 2023; 16(1):514. https://doi.org/10.3390/en16010514
Chicago/Turabian StyleHu, Fei, Qingtao Meng, Zhaojun Liu, Chuan Xu, and Xun Zhang. 2023. "Petrology, Mineralogy, and Geochemical Characterization of Paleogene Oil Shales of the Youganwo Formation in the Maoming Basin, Southern China: Implication for Source Rock Evaluation, Provenance, Paleoweathering and Maturity" Energies 16, no. 1: 514. https://doi.org/10.3390/en16010514