Article

Constructing a Database of Reference Hydrothermal Sources for a Zero-Energy Building Certification Rating in South Korea and Analyzing the Renewable Energy Self-Sufficiency Rate Achieved by Water-Source Heat Pumps

Building Energy Research Department, Korea Institute of Civil Engineering and Building Technology, Ilsan 10223, Republic of Korea
*
Author to whom correspondence should be addressed.
Energies 2023, 16(1), 543; https://doi.org/10.3390/en16010543
Submission received: 28 November 2022 / Revised: 22 December 2022 / Accepted: 23 December 2022 / Published: 3 January 2023
(This article belongs to the Section A: Sustainable Energy)

Abstract

:
This study aims to institutionalize an evaluation methodology to assess water-source heat pumps (WSHPs) when designing a zero-energy building. Thus, regions where zero-energy buildings were designed were subdivided into 66 sub-regions, thereby standardizing the temperatures on the source side of WSHPs using river water and pipeline water. Based on these data, ground-source and water-source heat pump system-based simulation (new and renewable energy self-sufficiency rate compared to building energy consumption) values were derived for cases whose condition (region or heat source) was different among the buildings certified as zero-energy buildings. The application of the standard meteorological data and reference hydrothermal data to the ECO2 program and outcome evaluation led to the following findings: in all cases (reference: Seoul), ground-source heat pumps (GSHPs) showed a higher self-sufficiency rate than WSHPs (ground source > pipeline water > river water). The self-sufficiency rate of GSHPs was 11–33% higher than that of WSHPs. In a regional comparison among the cold (Jeongseon), central (Seoul), and southern (Jeju Island) regions, WSHPs exhibited higher energy self-sufficiency rates than GSHPs under the conditions of higher water temperatures in winter and lower water temperatures in summer, as in the southern region.

1. Introduction

While the total final energy consumption of the global building sector in 2019 was the same as that in the previous year, CO2 emissions due to building operations have increased to their highest level yet, to approximately 10 GtCO2 or 28% of the total global energy-related CO2 emissions [1]. Consequently, the issue of reducing greenhouse gas emissions in the building sector has been brought to the fore, with major countries worldwide implementing a wide range of policies and systems intending to improve energy efficiency in the building energy sector. South Korea has implemented a zero-energy building (ZEB) system at the forefront of global efforts since the adoption of the mandatory ZEB policy in 2017 [2].
The South Korean Ministry of Environment is exploring ways to utilize the hydrothermal sources abundantly distributed throughout the country (rivers, lakes, and raw water) and promoting hydrothermal energy development pilot projects by using the raw water type in five dams (Hapcheon, Gunwi, Chungju, Soyanggang, and Imha) as a strategy to expand renewable energy distribution, as an action plan for the 2050 carbon neutrality roadmap. When hydrothermal sources are used for heating and cooling, their application to ZEBs seems reasonable given the advantages of clean renewable energy production, relatively constant water temperature production, and high-density water, which improve the heat exchanger performance.
Driven by the growing interest in water-source heat pump (WSHP) systems, many researchers have researched the potential of hydrothermal sources by measuring the temperature and available flow rate of water sources under different environmental conditions [3]. Kindaichi et al. [4] evaluated the potential of reservoirs as heat sources for heat pump systems in Japan and found that winter weather conditions had a stronger influence on heat pump performance than summer weather conditions. Lund and Persson [5] mapped and quantified the potential heat sources for heat pumps used for district heating in Denmark. Similarly, many research teams have studied the direct impact of hydrothermal sources on device performance. Schibuola and Scarpa [6] experimentally analyzed the performance of a surface-water heat pump system applied to an old building in Venice, Italy, and compared its performance with that of traditional systems (air source heat pump and chiller/boiler). They found that the lagoon water heat pump system saved more than 20% energy compared with traditional plants, leading to reduced greenhouse gas emissions. Liu et al. [7] analyzed the heating and cooling performance of a river WSHP system through data monitoring and found that the average coefficient of performance (COP) of the heat pump units was 6.5 (cooling) and 7.4 (heating) and that of the river WSHP systems dropped to 2.6 (cooling) and 5.4 (heating) owing to the higher power consumption of water circulating pumps. Wang et al. [8] proposed that, in an open-loop surface WSHP system, the system efficiency can be enhanced depending on the water intake design. Lv et al. [9] analyzed the cooling performance of a surface WSHP system using a thermodynamic cycle model and found that the system COP increased by 2.3% when the surface-water temperature decreased by 1 °C.
According to the American Society of Heating, Refrigerating, and Air Conditioning Engineers (ASHRAE) [10], ground-source heat pump (GSHP) systems are grouped into three categories—groundwater, surface water, and ground-coupled heat pump systems, depending on the heat source or sink for a heat exchanger [7]. All three types generally have excellent performance because surface-water heat pump systems are restricted by various factors such as public regulations and water quality [11,12], and groundwater and ground-coupled heat pumps can be an effective alternative for buildings located near important surface-water sources such as rivers, lakes, and seas [13,14].
In South Korea, the Korea Water Resources Corporation (K-water) evaluates the available hydrothermal energy resources in rivers across the country by applying the calculation formula specified in the manual for using unutilized energy released by the Japanese New Energy and Industrial Technology Development Organization (NEDO) [15]. Consequently, cooling and heating systems using raw water pipelines and reservoirs have been installed and operated at 11 sites across the county since 2016, starting with the Juam hydroelectric power plant building. Since 2014, there has been ongoing research, development, and distribution of hydrothermal energy from river water, such as supplying water from Paldang Dam as a heat source for heating and cooling the 2nd Lotte World via raw water pipelines of the Seoul Capital Area water supply pipeline network [16].
To date, research evaluating the non-renewable energy of buildings through WSHP systems has mostly focused on evaluating the per unit or system performance of individual buildings. However, the research results cannot be reflected in the current ZEB certification because of the lack of a building energy evaluation framework necessary for popularizing the systems. Therefore, to actively use WSHPs for ZEBs through formal institutional channels, efforts should be made to standardize certification standards for WSHPs.
To address this research gap, this study derives a reference meteorological database of temperature data on river and pipeline water heat sources regionally to enable the evaluation of river and pipeline WSHPs regionally with the aim of applying it to ECO2, Korea’s ZEB certification rating program. A case study was also conducted to derive the overall system performance simulation (renewable energy self-sufficiency rate) of WSHPs depending on the seasonal river water temperature.

2. Materials and Methods

2.1. Seasonal Temperature Analysis of Hydrothermal Sources

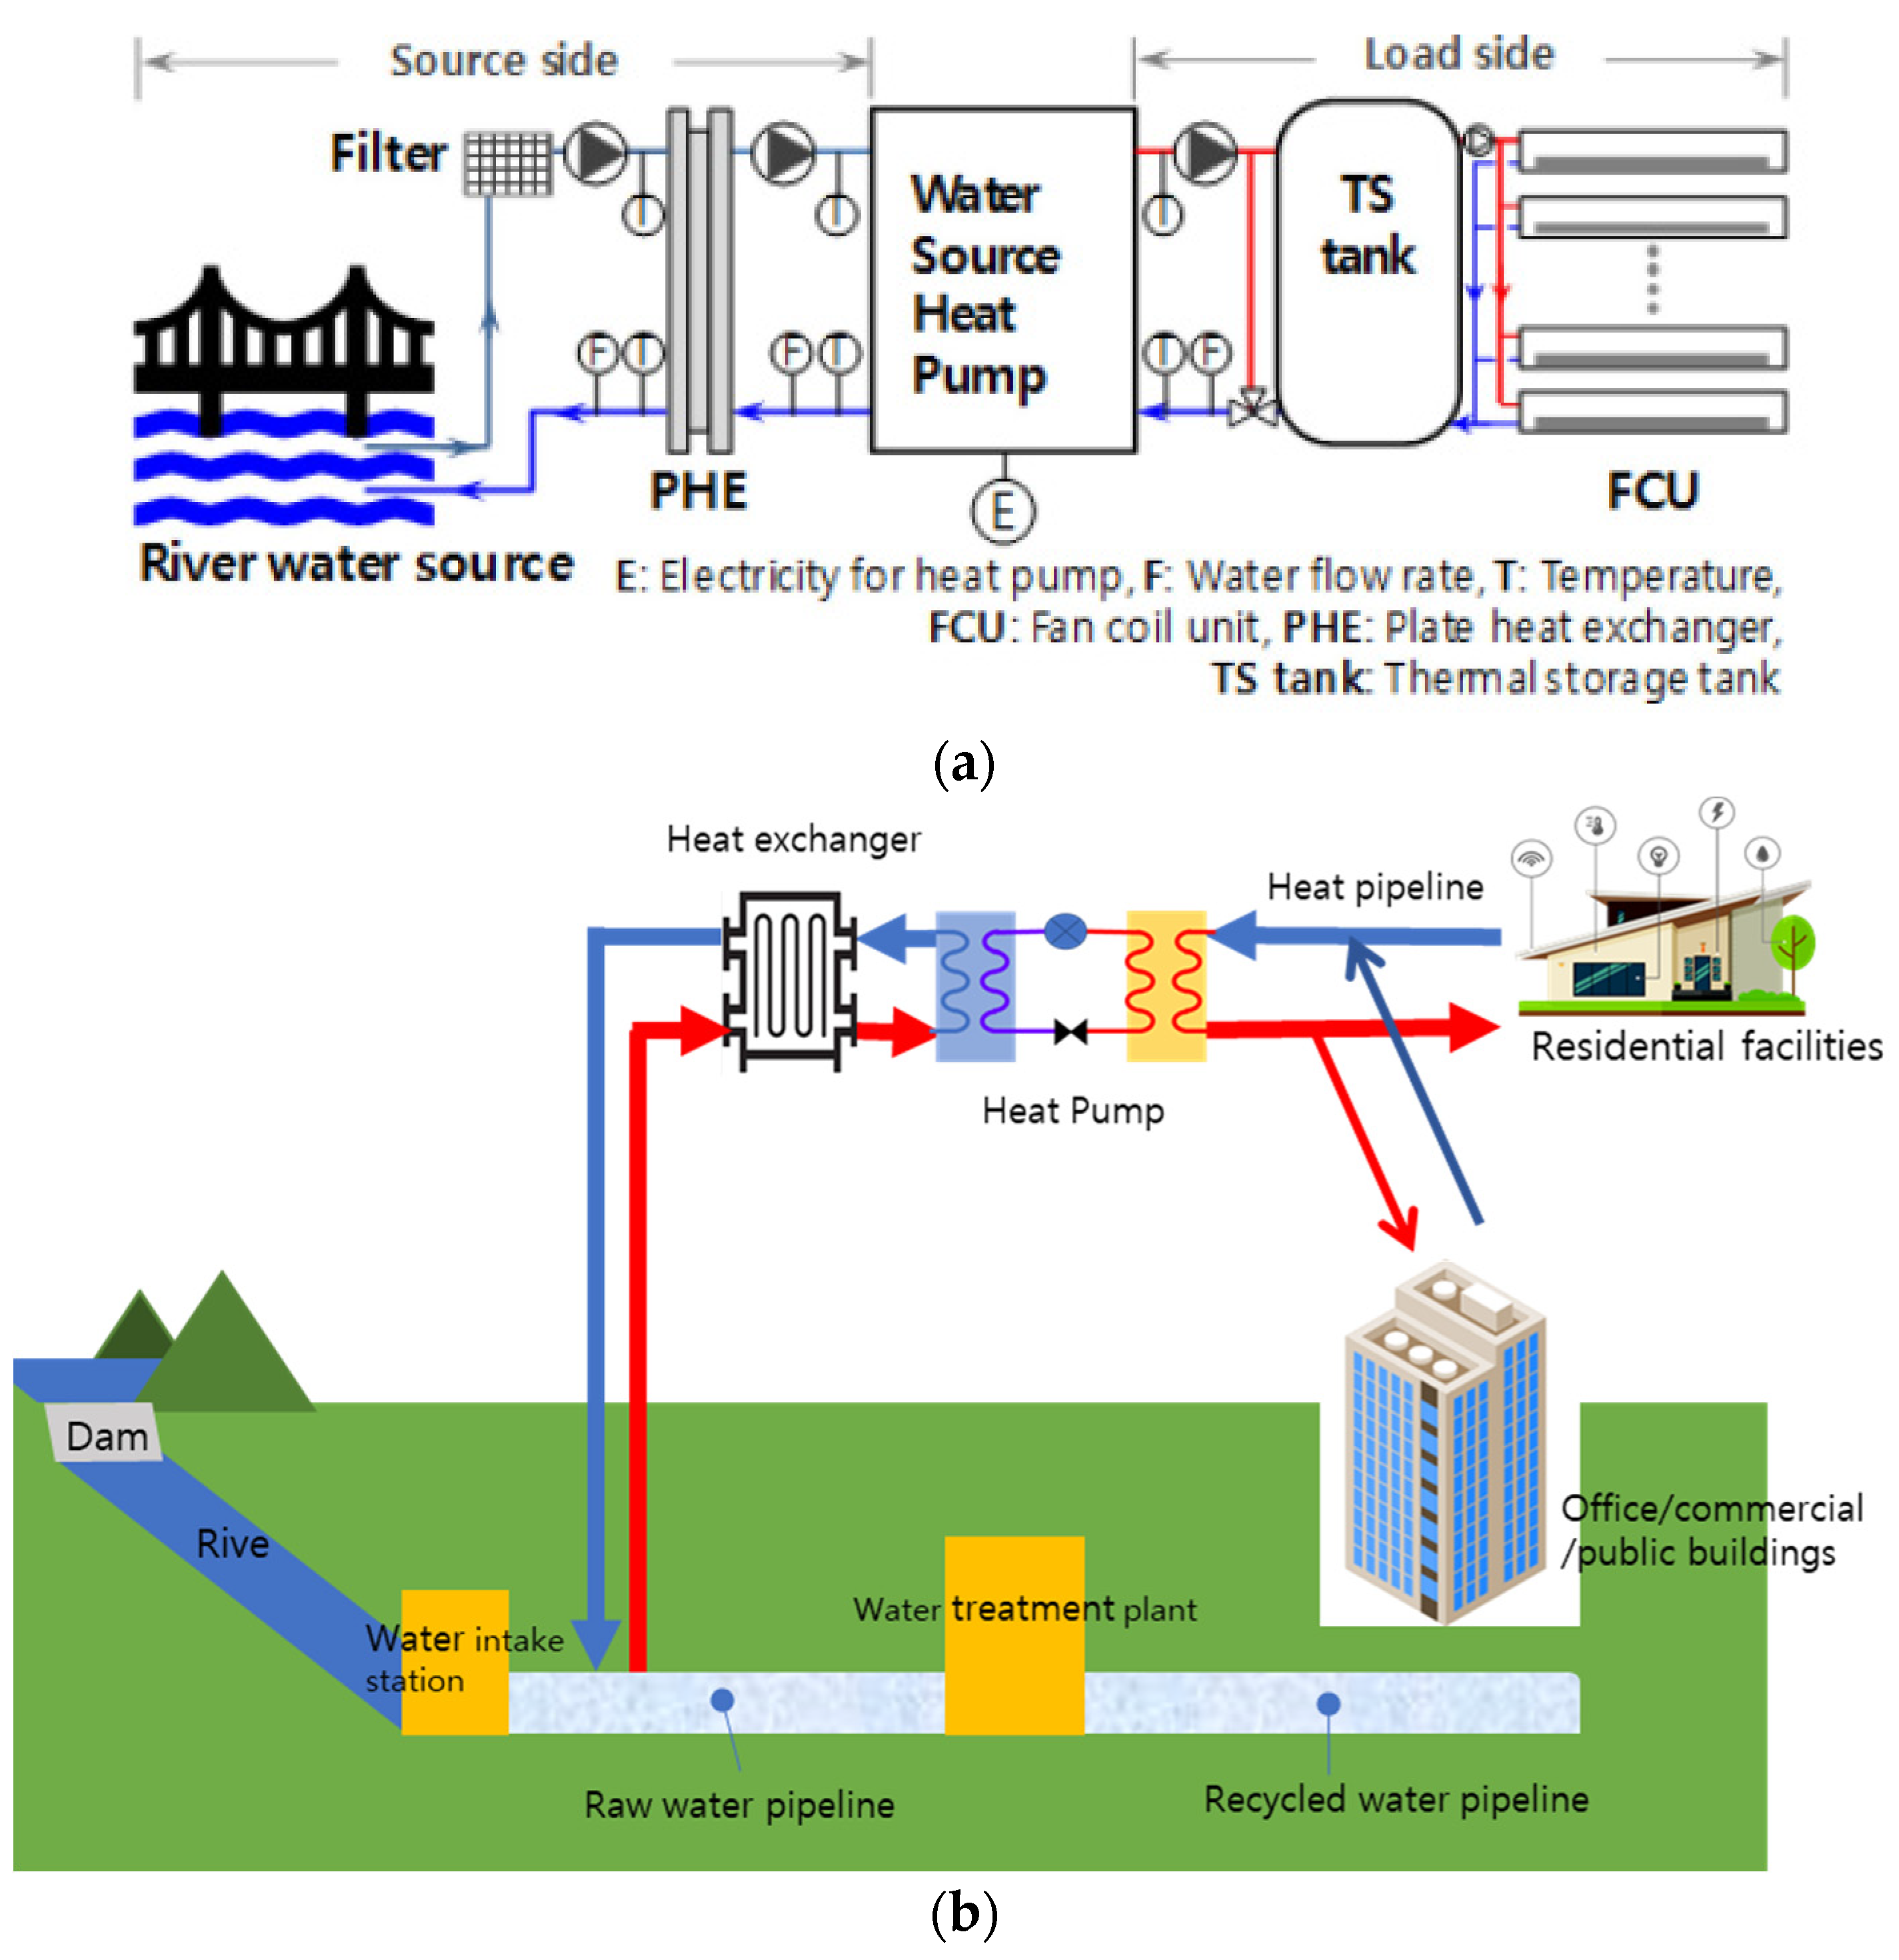
2.1.1. Architecture of a WSHP

A WSHP system consists of source and load sides, with the WSHP positioned in the center. Figure 1 provides a schematic diagram of the river WSHP system and a concept map for the utilization of hydrothermal energy along the water supply pipeline (raw water pipe). The source side of the system is composed of a water intake inlet from the water source or raw water pipe, filter, circulating pump, and heat exchanger, distinct from the air source heat pump (ASHP) or GSHP systems. The load side is similar to that of a traditional heat pump system, comprising a heat pump, thermal (cold/hot water) storage tank, and an indoor unit designed to supply the heat necessary for the building through refrigerant condensation during the heating operation, using hydrothermal energy to evaporate the refrigerant, remove heat from the building, and condense the refrigerant in the outdoor unit during the cooling operation.

2.1.2. Relationship between Water Temperature and Outside Temperature

In a recent study by Sohn [17], the changes in river water temperature (water temperature) throughout the year followed a similar pattern to those of outdoor temperature (air temperature). However, during the day, the temperature change of water was more stable than that of air temperature, allowing the assumption that the WSHPs would outperform the ASHPs. Additionally, unlike outside air temperature, water temperature did not show significant differences in hourly and daily average temperatures. Thus, it was inferred that the daily average temperature can be applied to system design without worrying about capacity calculations and performance in regions with little hourly water temperature changes. Consequently, it was reasonable to derive reference meteorological data from the average water temperature as a heat source rather than from the correlation between water and air temperatures.

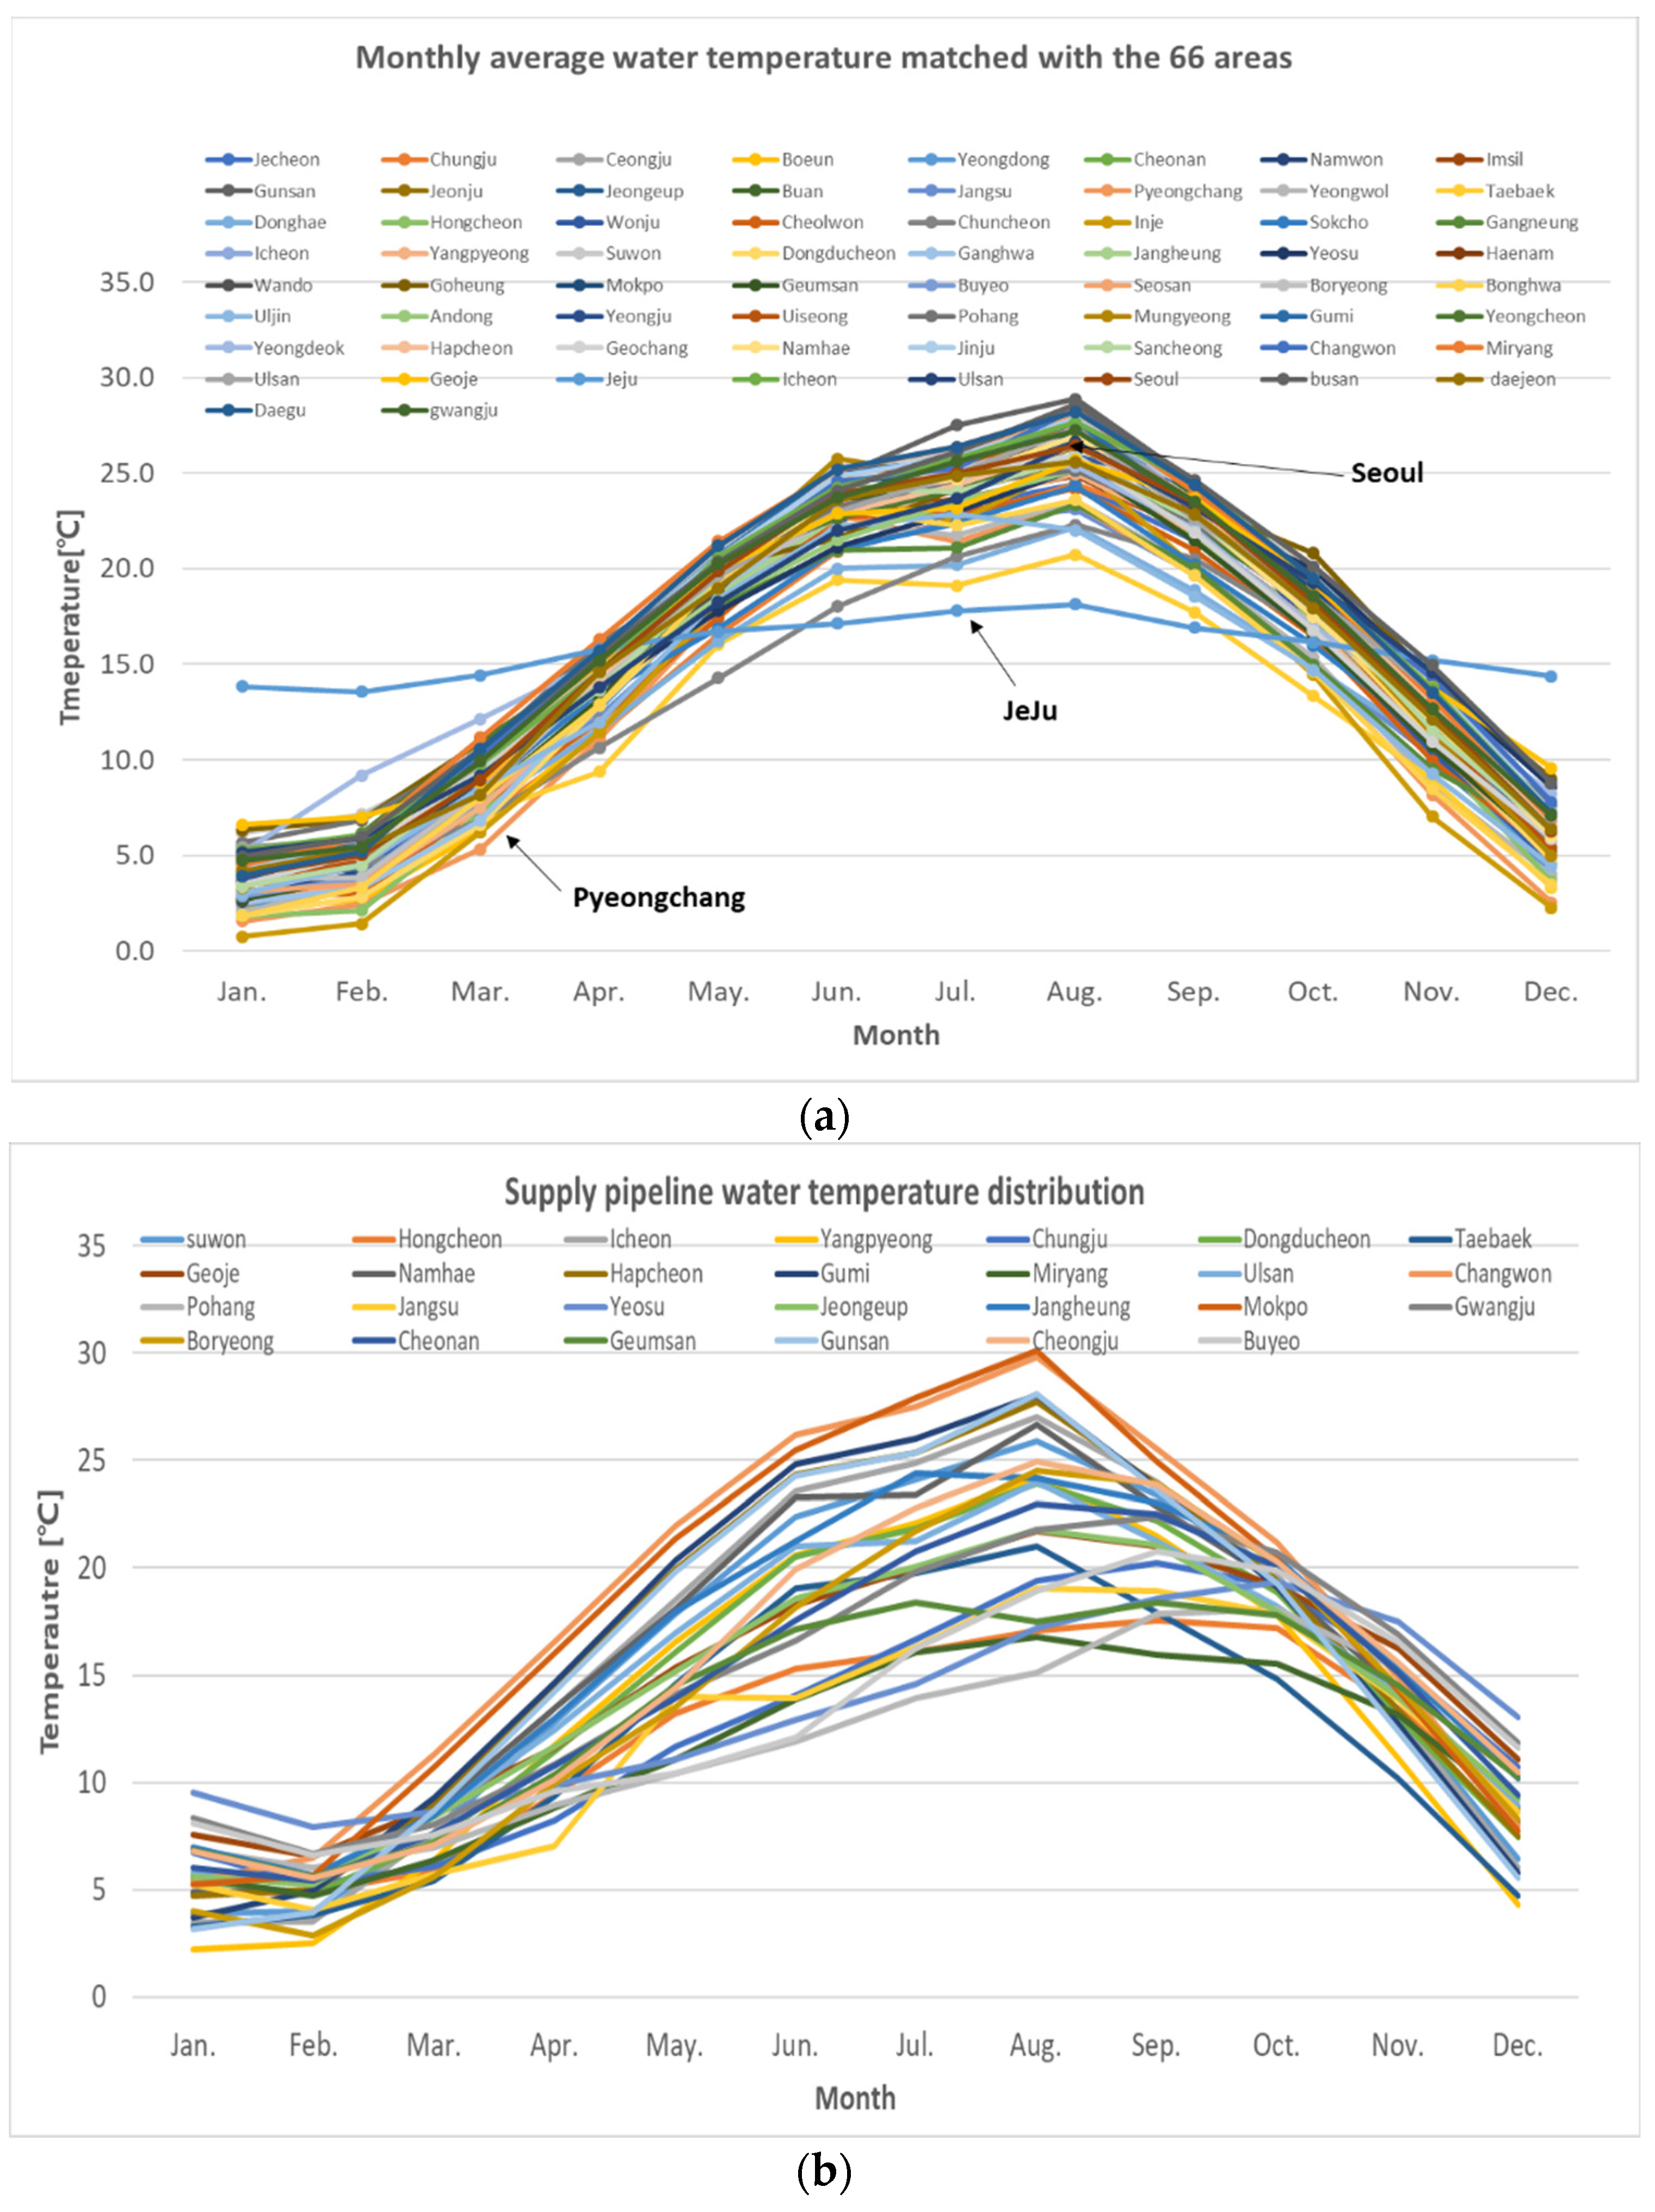
2.1.3. Seasonal Temperature Data Collection of River Water Heat Sources

For the seasonal temperature data used for the WSHP evaluation, a database (DB) of water heat sources was constructed for each administrative district using officially approved databases. The criteria set for DB collection was the water quality measurement network data of the water environment information system from 2010 to 2020 [18]. The river temperature measurement points amounted to 691 and were dispersed across the rivers in each region. Therefore, the mean value was obtained for regions with multiple measurement points. Table 1 outlines the DB collection process for data on river water heat sources.

2.1.4. Methodology for Deriving Pipeline Data

Unlike river water heat sources, pipeline water data cannot be obtained from a water environment information system in the form of a database. Pipeline water data are sporadically collected by local governments; however, data of all regions are not managed. Therefore, data of only 27 regions could be secured from the Water Resources Corporation for 5 years (2015–2020).
In addition, these data have limitations because they are for environmental evaluation, not data for energy sources. Pipeline water temperature data can be used for ECO2 by reflecting the data based on building location or meteorological area, given that they are sporadically managed by K-water and local governments. Therefore, unlike river water data, which are used in the ECO2 program to reflect the meteorological data conditions of the area corresponding to the building to be rated, the standard data on pipeline water is defined as a single case value. Once the pipeline DB is established in the future similarly to the river water DB, pipeline data may be derived by area, as is the case with river water data.
27 regions: Suwon, Hongcheon, Icheon, Yangpyeong, Chungju, Dongducheon, Taebaek, Geoje, Namhae, Hapcheon, Gumi, Miryang, Ulsan, Changwon, Pohang, Jangsu, Yeosu, Jeongeup, Jangheung, Mokpo, Gwangju, Boryeong, Cheonan, Geumsan, Gunsan, Cheongju, and Buyeo.

2.2. ECO2-Based Calculation of Geothermal/Hydrothermal Energy Self-Sufficiency Rate

2.2.1. ECO2 Program

The ECO2 program [19] is an officially approved national energy simulation program used to quantitatively evaluate five building energy items (heating, cooling, lighting, hot water supply, and ventilation) based on monthly mean meteorological data as per ISO 13790 and DIN V18599 [20]. The default value of the program was set according to the building use time, operating time, minimum external air inlet, hot water demand, demand for lighting time settings, human body and device heat emissions, HVAC indoor temperature settings, and monthly usage days according to the purpose of the building. As weather data, the monthly average values, calculated based on the meteorological data collected for 66 regions in Korea according to the typical meteorological year method, are provided, whereby the standard profile is imported from the ECO2 server.

2.2.2. Renewable Energy Self-Sufficiency Rate Calculation Standard for Evaluation Purposes

Renewable primary energy (RPE) is the total energy produced by renewable energy systems subtracted by the non-renewable primary energy used for the system operation. For example, in the case of a GSHP, the value obtained by subtracting the electric energy used to drive the pumps from the heat output produced by the system is recognized as the RPE, as expressed by the following formula:
Energy self-sufficiency rate   ( % ) = Total renewable primary energy per unit area Total primary energy per unit area × 100 .
Note (1) Total RPE per unit area (kWh/m2·year) = ∑{(renewable energy production—energy required to produce renewable energy) × relevant primary energy conversion factor}/evaluation area. Note (2) Total primary energy per unit area (kWh/year) = total primary energy per unit area + total RPE per unit area.

2.2.3. Selection of WSHPs

To compare the self-sufficiency rates achieved by buildings through WSHPs, sample buildings were selected considering four building purposes (culture/sports, offices, accommodation, and education/research) and eight meteorological data types among ZEB-certified buildings. Table 2 provides an overview of the 10 case study buildings.
The input variables for the ECO2 simulation of the GSHP rating were the heat pump capacity, thermal efficiency (heating/cooling COP), primary pump power, secondary pump power, heat exchanger installation or non-installation, and input values for the geothermal expansion tank. The ECO2 rating was conducted under a conservative renewable energy production model subject to the rated COP value at the rated power at 15 °C (heating) and 25 °C (cooling). In the case of WSHPs, there is no concept of rating, which needs to be established in line with the GSHPs. For the study case of WSHPs, the COP rating was conducted by applying the COP values for the GSHP cases rated at 5/15 °C (heating) and 25/35 °C (cooling) as temperature standards.

3. Results and Discussion

3.1. Extraction of Reference Meteorological Data from River and Pipeline Water

Figure 2 illustrates the locations corresponding to the monthly river water data in nine provinces and sixty-six areas in major cities across the country and the distribution graphs for the pipeline water temperature data. The regional standard deviations are 3° or less, and the average upper and lower confidence limits are less than 2°. In addition, the monthly average river water heat source temperatures matched with the 66 areas are plotted in Figure 2a, which shows significant seasonal variations, except for Jeju-do. Therefore, considerable differences in the COP values are expected depending on the regions in which the WSHPs are operated. In Figure 2c, the pipeline water temperature is more stable than the river water temperature, with the smallest temperature difference observed in February (0.4°) and the largest difference in June (4.2°). The average river water data were observed to be more sensitive to changes in the outside temperature than pipeline water, and the latter showed a smoother curve.
Table 3 presents the reference river water and pipeline water heat source data derived from these monthly average temperatures (Seoul, Pyoungchang, and Jeju). The remaining regions are presented in Table S1.

3.2. Self-Sufficiency Rates of WSHPs by ECO2 Rating

In this section, the building energy self-sufficiency rates are calculated for the case study buildings producing energy with WSHPs using the hydrothermal energy data extracted above with the ECO2 program, followed by a performance comparison with the GSHPs operated under the same conditions in the same type of building and regional conditions. The results for all 10 cases, based on building use purpose (reference: Seoul) are presented in Table 3. As shown in Figure 3, the GSHPs exhibited a higher self-sufficiency rate than the WSHPs in all cases. The GSHPs performed better than the WSHPs by 11–33%, which may be attributed to differences in COP depending on the performance of traditional GSHPs. Pipeline water appears to be less sensitive than river water depending on single-standard hydrothermal source data, whereby the magnitude of the difference is likely to depend largely on the regional water temperature data. Seoul, in particular, recorded the greatest differences of −31% (Case2) and −33% (Case 6), where the river water heat source was generally outperformed by other sources regardless of the location (categorized into Center 1 (cold region), Center 2, south, and Jeju depending on the heating degree days when calculating building energy demand in the building energy design standards; Seoul belongs to Center (2).
To estimate the regional differences among buildings with equal performance levels, one case was subjected to a region-dependent comparison of the total primary energy, RPE, and self-sufficiency rate of buildings in the cold (Jeongseon), central (Seoul), and southern (Jeju) regions. Figure 4 shows the comparison results of the consumption, production, and self-sufficiency rates obtained using the GSHP and WSHP in each region.
There are marginal differences in building energy consumption depending on the renewable energy production equipment, with only regional differences significant because building energy demand is the energy required by the building to keep the interior comfortable under specific conditions (such as temperature, insulation, and airtightness) and that building energy consumption is also building-specific energy demand that includes the energy required by facilities and equipment. As such, with the performance of buildings remaining similar and only the regional standard meteorological data changing, building energy demand and consumption vary only according to regional conditions. Figure 4 shows the regional comparison of ground-source heat pumps and water-source heat pumps for building energy consumption, production amd self-sufficiency rate. Figure 4b shows production comparison graphs of each region; unlike in the above 10 case comparisons, the river water sources in Jeju show higher production than those in other regions. In Figure 2, this is expressed by the smooth temperature variations around 15 °C in the Jeju-do River water throughout the year, which seems to influence the performance of river water heat pumps. Figure 4c shows the self-reliant rate comparison graph. As the self-reliant rate is determined by the energy production volume, with the consumption maintained at the same level, GHSPs are advantageous in areas exposed to abrupt water heat source temperature changes, such as Seoul or Jeongseon, whereas WSHPs are more advantageous in areas with smooth water temperature variations, such as Jeju-do.

4. Conclusions

This study was conducted to derive reference meteorological data related to temperature data of water heat sources necessary for evaluating WSHPs by region for application to the ECO2 rating, Korea’s ZEB certification rating program, and comparing the self-sufficiency rates between WSHPs and GSHPs by collecting 10 cases of ZEB-certified buildings with GSHPs, using the calculation logic for the ZEB certification rating. The results are summarized as follows:
(1)
Compared to outside air temperature, water heat sources showed no significant variations in the daily average and hourly temperatures. Based on the findings of previous research, stating that, in areas with no hourly water temperature data, system design is possible with daily or monthly average data, river water data provided by each region were taken and averaged, and a reference hydrothermal source database was constructed by matching the averaged data with the currently available standard meteorological data in 66 areas for them to be linked to the selected building rating area in the ECO2 program.
(2)
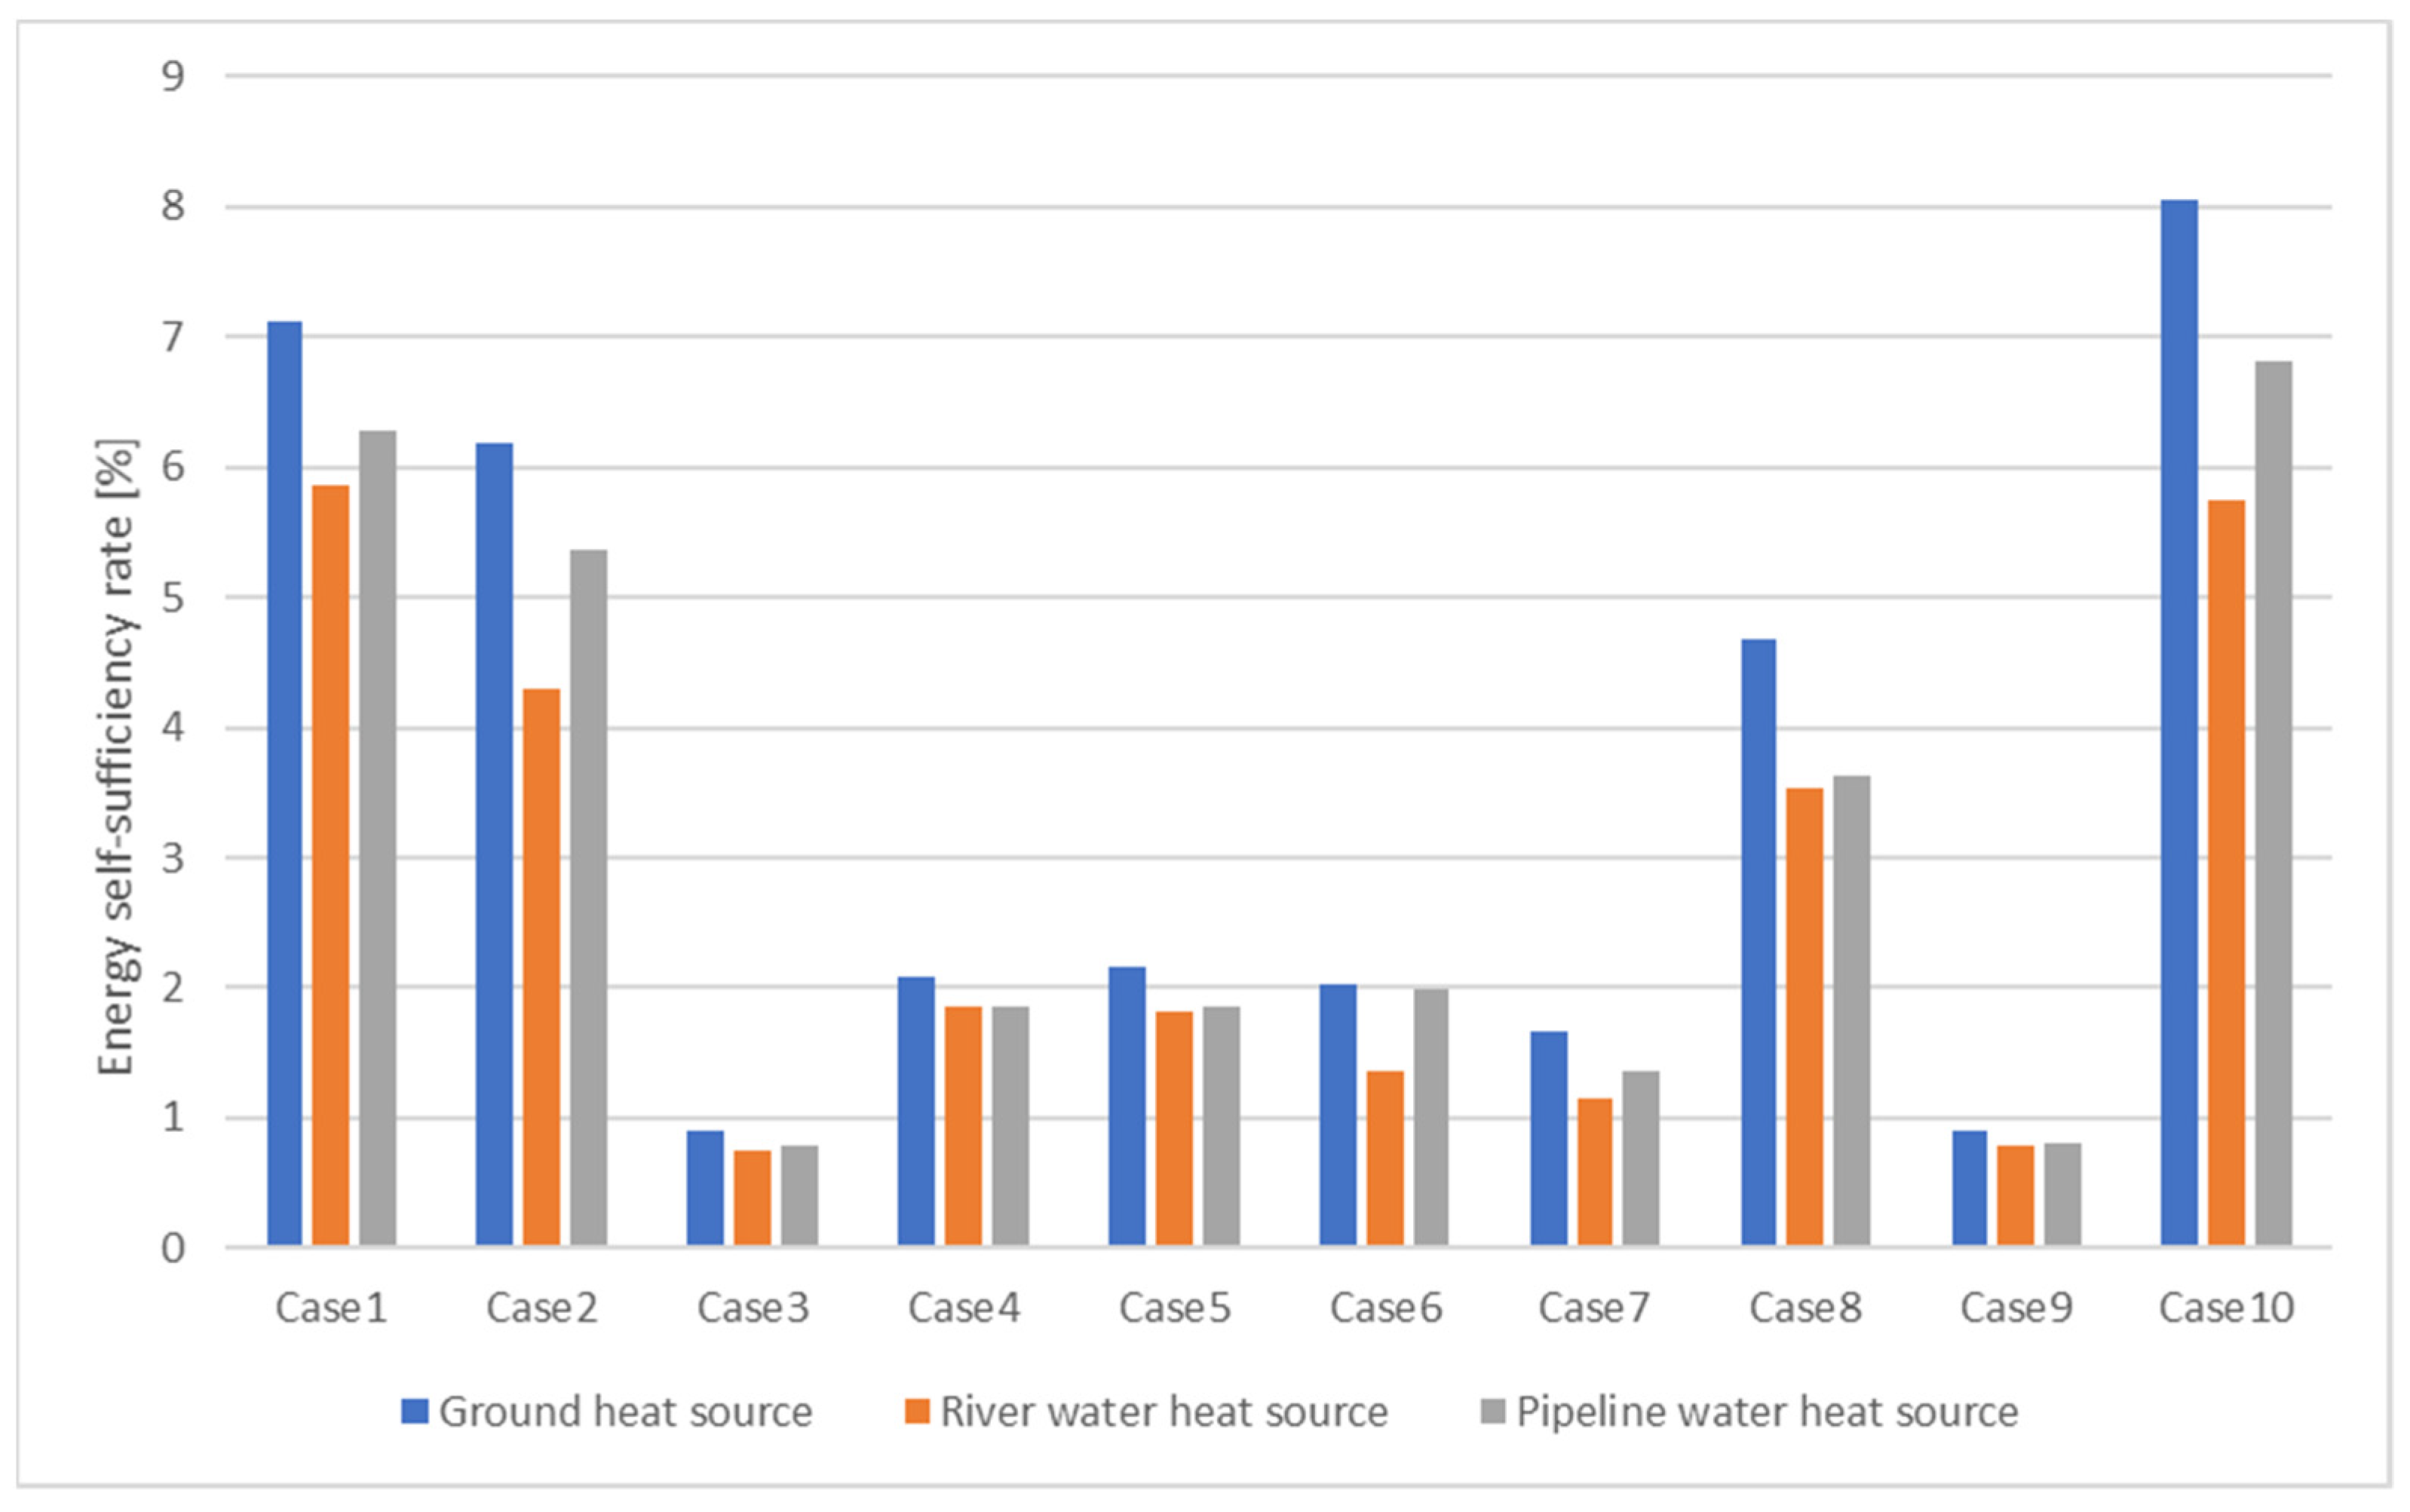
Among ZEB-certified buildings, those with GSHPs were selected. Applying the standard meteorological data and reference hydrothermal data to the ECO2 rating yielded the following findings: in all cases (reference: Seoul), GSHPs had a higher self-sufficiency rate than WSHPs (ground source > pipeline water > river water), whereby GSHPs outperformed WSHPs by 11–33%, possibly because the water source temperature in Seoul is higher in summer and lower in winter, compared to the constant annual ground-source temperature of 15 °C. Pipeline water appeared to be less sensitive than river water, depending on single-standard hydrothermal source data.
(3)
A one-case regional comparison, which was performed in the cold (Jeongseon), central (Seoul), and southern (Jeju) regions to estimate the regional differences, revealed that in areas with good reference hydrothermal conditions (i.e., higher water temperature in winter and lower water temperature in summer, compared to the geothermal temperature), WSHPs yield a higher self-sufficiency rate than GSHPs.
By standardizing the monthly water temperature, this study paved the way for the performance assessment of WSHPs within the framework of the building energy conservation policy during the zero-energy building certification process.
However, the purpose of this research was to establish a methodology to evaluate water heat pumps using the data collected by the nationally authorized DB, Water Environment Information System Water Quality Measurement Network Data, compiled by the Water Resources Corporation utilizing the already-produced water heat source temperature data. Therefore, there is no methodology that could be applied to measure each heat source, which limits the generalizability and robustness of the results.

Supplementary Materials

The following supporting information can be downloaded at: https://www.mdpi.com/article/10.3390/en16010543/s1, Table S1: Monthly data on the reference river water heat sources.

Author Contributions

All authors contributed to the study conception and design. Material preparation, data collection, and analysis were performed by Y.K. and K.-H.Y. The first draft of the manuscript was written by Y.K. and all authors commented on previous versions of the manuscript. All authors have read and agreed to the published version of the manuscript.

Funding

This research was supported by the Ministry of Land, Infrastructure and Transport of the Korean government under 2022 Zero Energy Building New Industry Promotion Grant (grant number 26-11-4-140-142-6100-6133-312) and Korea Water Resources Corporation (grant number 20210620).

Data Availability Statement

The datasets used and/or analyzed during the current study are available from the corresponding author on reasonable request.

Conflicts of Interest

The authors declare no conflict of interest.

References

  1. United Nations Environment Programme, Global Alliance for Buildings and Construction. Towards a Zero-Emissions, Efficient and Resilient Buildings and Construction Sector, 2020 Global Status Report for Buildings and Construction. 2020, pp. 1–7. Available online: https://globalabc.org/sites/default/files/inline-files/2020%20Buildings%20GSR_FULL%20REPORT.pdf (accessed on 17 December 2022).
  2. Kim, Y.; Yu, K. Study on the certification policy of zero-energy buildings in Korea. Sustainability 2020, 12, 5172. [Google Scholar] [CrossRef]
  3. Hunt, J.D.; Byers, E.; Sánchez, A.S. Technical potential and cost estimates for seawater air conditioning. Energy 2019, 166, 979–988. [Google Scholar] [CrossRef] [Green Version]
  4. Kindaichi, S.; Nishina, D.; Wen, L.; Kannaka, T. Potential for using water reservoirs as heat sources in heat pump systems. Appl. Therm. Eng. 2015, 76, 47–53. [Google Scholar] [CrossRef]
  5. Lund, R.; Persson, U. Mapping of potential heat sources for heat pumps for district heating in Denmark. Energy 2016, 110, 129–138. [Google Scholar] [CrossRef]
  6. Schibuola, L.; Scarpa, M. Experimental analysis of the performances of a surface water source heat pump. Energy Build. 2016, 113, 182–188. [Google Scholar] [CrossRef]
  7. Liu, Z.; Tan, H.; Li, Z. Heating and cooling performances of river-water source heat pump system for energy station in shanghai. Procedia Eng. 2017, 205, 4074–4081. [Google Scholar] [CrossRef]
  8. Wang, Y.; Wong, K.K.L.; Liu, Q.; Jin, Y.; Tu, J. Improvement of energy efficiency for an open-loop surface water source heat pump system via optimal design of water-intake. Energy Build. 2012, 51, 93–100. [Google Scholar] [CrossRef]
  9. Lv, N.; Zhang, Q.; Chen, Z.; Wu, D. Simulation and analysis on the thermodynamic performance of surface water source heat pump system. Build. Simul. 2017, 10, 65–73. [Google Scholar] [CrossRef]
  10. ASHRAE. ASHRAE Handbook: Handbook HVAC Applications; American Society for Heating, Refrigerating, and Air Conditioning Engineers Inc.: Atlanta, GA, USA, 2011. [Google Scholar]
  11. Zhu, N.; Hu, P.; Wang, W.; Yu, J.; Lei, F. Performance analysis of ground water-source heat pump system with improved control strategies for building retrofit. Renew. Energy 2015, 80, 324–330. [Google Scholar] [CrossRef]
  12. Sciacovelli, A.; Guelpa, E.; Verda, V. Multi-scale modeling of the environmental impact and energy performance of open-loop groundwater heat pumps in urban areas. Appl. Therm. Eng. 2014, 71, 780–789. [Google Scholar] [CrossRef]
  13. Nam, Y.; Ooka, R. Numerical simulation of ground heat and water transfer for groundwater heat pump system based on real-scale experiment. Energy Build. 2010, 42, 69–75. [Google Scholar] [CrossRef]
  14. Liang, J.; Yang, Q.; Liu, L.; Li, X. Modeling and performance evaluation of shallow ground water heat pumps in Beijing plain, China. Energy Build. 2011, 43, 3131–3138. [Google Scholar] [CrossRef]
  15. NEDO. Survey for Preparation of New Energy Technology Development Related Data Collection (Unused Energy); Investigation Report NEDO-P-9810; Japan Systems Development Laboratory: Kawasaki City, Japan, 1998; pp. 1–66. [Google Scholar]
  16. Jung, J.; Nam, J.; Jung, S.; Kim, J.; Kim, H. Feasibility Study on the Use of River water Hydrothermal Energy in Korea: (1) Estimation of the Permitted Standard Discharge and Determination of the Potential water Intake Area. New Renew. Energy 2018, 12 Vol.14, 27–37. [Google Scholar] [CrossRef]
  17. Sohn, B. An Applicability Analysis of River Water Source Heat Pump System Using EnergyPlus Simulation; Korean Society for Geothermal and Hydrothermal Energy (KSGHE): Seoul, Republic of Korea, 2022; Volume 18, pp. 10–21. [Google Scholar]
  18. Water Environment Information System’s Water Quality Measurement Network Data. Available online: https://water.nier.go.kr/web/waterMeasure?pMENU_NO=2 (accessed on 3 August 2022).
  19. Jo, J.-H. A Study on Evaluation Criteria and Evaluation Tool for Energy Performance of Internal and External Building, Construction Technique/Sangyong, Special Project II—Zero Energy Building Policies and Trends of Internal and External. Building 2017, 23. Available online: http://www.auric.or.kr/User/Rdoc/DocRdoc.aspx?BrsDataBaseName=RDOC&PrimaryKey=350201&DBNM=RDCR#.XvGVO3duKUl (accessed on 20 April 2020).
  20. Kim, Y.; Jang, H.K.; Yu, K.H. Study on extension of standard meteorological data for cities in South Korea using ISO 15927–4 ISO 15927-4. Atmosphere 2017, 8, 220. [Google Scholar] [CrossRef]
Figure 1. Schematic diagram of (a) a river water-source heat pumps system and (b) a concept map for utilizing hydrothermal energy along the water supply pipeline.
Energies 16 00543 g001
Figure 2. Hydrothermal sources of (a) river water, (b) pipeline water, and (c) monthly mean temperature of pipeline water, river water, and standard meteorological data.
Energies 16 00543 g002aEnergies 16 00543 g002b
Figure 3. Comparison of ground, river water, and pipeline water heat source self-sufficiency rates for each case.
Energies 16 00543 g003
Figure 4. (ac) Regional comparison of ground-source heat pumps and water-source heat pumps.
Energies 16 00543 g004aEnergies 16 00543 g004b
Table 1. Database (DB) collection process for data on river water heat sources.
DB Collection DB Processing DB Matching
  • Collecting data from the water environment information system
  • Classifying water heat sources by region according to ECO2 standard meteorological data
  • Clustering of measurement points in the same region·
  • Processing the 10-year mean river water temperature database by month
  • Matching regional standard meteorological databases (n = 66) and river water databases
ECO2, Korea’s building energy efficiency rating program, is based on monthly meteorological data using the reference meteorological data for the region closest to the evaluation area among the available weather databases in 66 areas. To enable simulations with relevant information for location selection during the ECO2 program operation, 66 regional (si-gun-gu) standard meteorological databases were matched with corresponding river water databases. In total, 691 address values were matched with 83 administrative districts, and the resulting data points were further divided into 66 meteorological areas. In addition, even within the same meteorological area, there were several measuring points, and for the data points with different measurement time points, the average monthly values were derived according to the standard data format of ECO2.
Table 2. Overview of the case study buildings.
No.UseStructureGross AreaRegionGround-Source Heat Pump Capacity
(kW)
Primary Pump Power (W)Geothermal Expansion Tank Volume (L)
1Non-residential
(Sports)
RC, SF, SRC a4517.54Gyeonggi-do (Gimpo)354.9014,700200
2Non-residential
(Offices)
RC7971.42Seoul73222,0001000
3Non-residential
(Culture/Gathering)
RC, SRC28,442.65Gyeongsangbuk-do (Andong)1071.582/
1170.036
33,000
/33,000
1600
/1600
4Non-residential
(Accommodation)
RC107,220.55Incheon978.419/313.464/903.156/246.90918,500/7500/18,500/7500800/800/800/800
5Non-residential
(Education)
RC9512.81Sejong463.6216,500300
6Non-residential
(Offices)
RC10,960.00Seoul402.80716,500300
7Non-residential
(Education/Research)
RC, SF3207.68Gangwon-do (Wonju)166.511,100200
8Non-residential
(Education/Research)
SRC, M, LSF b2925.66Chungcheongbuk-do (Cheongju)105.2105900200
9Non-residential
(Offices)
SRC28,442.65Gyeongsangbuk-do (Andong)1170.03633,0001600
10Non-residential
(Offices)
SRC3760.17Chungcheongbuk-do (Cheongju)1071.58233,0001600
a RC: reinforced concrete structure; SF: steel-framed structure; SRC: steel-reinforced concrete structure; M: masonry structure. b LSF: lightweight steel-framed structure.
Table 3. Monthly data of the reference river water heat sources.
(a) River water heat source data
RegionJanFebMarAprMayJunJulAugSepOctNovDec
Seoul3.95.09.014.619.923.92526.523.518.212.56.3
Jeju13.813.514.415.816.717.117.818.116.916.215.214.4
Jeongseon1.62.45.311.117.722.821.423.419.7158.22.5
(b) Regional raw water heat source data
JanFebMarAprMayJunJulAugSepOctNovDec
5.65.17.811.515.719.221.022.921.518.914.28.6
Disclaimer/Publisher’s Note: The statements, opinions and data contained in all publications are solely those of the individual author(s) and contributor(s) and not of MDPI and/or the editor(s). MDPI and/or the editor(s) disclaim responsibility for any injury to people or property resulting from any ideas, methods, instructions or products referred to in the content.

