1. Introduction
In 1939, the same year in which the first open cycle gas turbine for power production ( 4
) became operational, [
1], the first closed Brayton cycle ( 2
) was also built in Zurich [
2] (p. 11).
The closed Brayton cycles did not have the overwhelming success and the technological development of the internal combustion gas turbine, due to limitations on the maximum turbine inlet temperatures; nevertheless, many systems were built between 1939 and 1972 using air as a working fluid and with maximum turbine inlet temperatures between 650
and 750
[
2]. Moreover, the first helium cycle was developed in 1962, with a maximum temperature of 650
, which served an air liquefaction system [
3]. In the years that followed, many studies were dedicated to closed helium cycles for cogeneration plants, for nuclear applications, and for the thermodynamic conversion of solar energy [
2,
4,
5,
6,
7,
8]. The interest in closed Brayton cycles never failed, and it has recently been revived.
In addition to air and to helium, different working fluids have been suggested and studied, including nitrogen, argon, carbon dioxide, and their mixtures, in ideal gas conditions [
9,
10,
11].
As an example, carbon dioxide was used as coolant in the primary circuit of the Calder Hall (England) nuclear power plant in 1956, with a pressure of about 14 bar and a reactor inlet and outlet temperature of 180
and 390
, respectively [
12].
Starting from the observation that real gas effects can significantly improve the performance of closed Brayton cycles [
13], studies on supercritical cycles with carbon dioxide as a working fluid began in the late 1960s. For example, in [
14], the supercritical cycle (with the minimum pressure above the critical one) was introduced, and its basic thermodynamics were described; in [
15], carbon dioxide cycles with condensation were introduced, and some peculiar plant configurations were reported. Specifically, in this paper, the author discusses the thermodynamics of the so-called re-compressed cycle and some cycle configurations with expansion below the condensation pressure. Reference [
16] is a patent dedicated to a nuclear cycle with condensation and with a storage tank for controlling the engine pressure levels according to the required power. In [
17], the authors explored the characteristics of the supercritical cycle with a preliminary design of its main components assuming a reference power of 150
. In [
2], p. 164, with reference to a hypothetical fast breeder nuclear reactor, a supercritical indirect secondary supercritical cycle with carbon dioxide was described and sized. Semi-Closed cycle gas turbine designed from the 1950s and 2000s were discussed in [
2], Chapter 9.
Detailed studies, research, and reviews on the performance and on the main components of supercritical closed cycles with carbon dioxide, in different plant configurations, still continue. For example, in [
18], an interesting discussion was dedicated to the use of supercritical carbon dioxide as a coolant in heavy-water reactors. References [
19,
20,
21] were also dedicated to the use of supercritical carbon dioxide cycles for nuclear reactors plants. In [
22,
23], the application of supercritical carbon dioxide in Concentrating Solar Thermal Power Plants (CSPs) and some results for a test rig of 10
were discussed and described, respectively. In reference [
24], there was an interesting update on the development stage of the so-called Allam Cycle (a well known semi-open carbon dioxide power cycle). A recent review on semi-closed Brayton cycles is in [
25].
Extensive reviews on the potential applications and on the thermodynamic performance of Brayton carbon dioxide cycles are numerous. For example, see [
8,
26,
27,
28,
29,
30,
31,
32]. Lately, there is now a great interest towards mixtures with carbon dioxide as working fluids for CSP (Concentrating Solar Thermal Power Plant) applications, as have been studied in [
33,
34,
35,
36,
37,
38,
39].
Obviously, other working fluids can be used in closed supercritical cycles. For example, the use of a perfluoro-carbon (octafluorocyclo-butane) was proposed in [
40]; in [
41], the author discussed the possibility to use steam; the use of organic working fluids and their mixtures were also explored in [
42].
In our opinion, determining the best type of cycle (with carbon dioxide and strong real gas effects or with noble gases as working fluids) is still an open and unresolved question. The choice of operating pressures and temperatures depend on the power size, on the specific application, and on the available heat source. Moreover, the compatibility of the working fluid with the cycle components materials is essential. Just as an example, in the old nuclear reactor plant of Latina (200
e net, Italy), the maximum temperature of the carbon dioxide in the primary circuit, at about 14 bar, was reduced from about 400
to 360
due to corrosion problems in the steam generators [
43]. This led to a reduction of about 20% of the nominal power with a consequent increase in the energy production cost.
Another point to consider is that, the higher the maximum cycle temperature, the lower the impact of the real gas effects in the compression step. In addition, it is not easy to identify organic or inorganic fluids that are environmentally acceptable (e.g., toxicity, flammability, Global Warming Potential, and Ozone Depletion Potential) with the right critical temperature and a proper cost and thermal stability. Carbon dioxide can be considered an exception, but it requires really high working pressures.
The reviews on the use of carbon dioxide in closed cycles are already numerous and exhaustive. A quick search on the “Web of Science” data base resulted in 38 papers between 2015 and 2023 that were specifically dedicated to a review of supercritical carbon dioxide cycles. A bibliometric analysis of all the articles on the use of carbon dioxide in closed Brayton cycles was carried out in [
44]. According to the authors, between 2000 and 2019, 724 publications from 1378 authors, distributed over 55 counties, have been devoted to this particular topic. In [
45], the authors carried out a review of the proposals for the use of supercritical cycles with CO
2 for Concentrating Solar Thermal Power Plants (CSPs): since 2010, the number of publications has increased exponentially from a few tens to a few hundred. The paper also listed international projects (in the EU and in the USA) dedicated to the use of supercritical CO
2.
In this paper, we summarise the thermodynamic aspects related to the behaviours of real gas and their consequences on the power cycle performance. In the authors’ opinion, as far as they know, there is no a comprehensive, complete, and clear discussion of this specific topic in the literature.
2. Some Basic Considerations and Assumptions
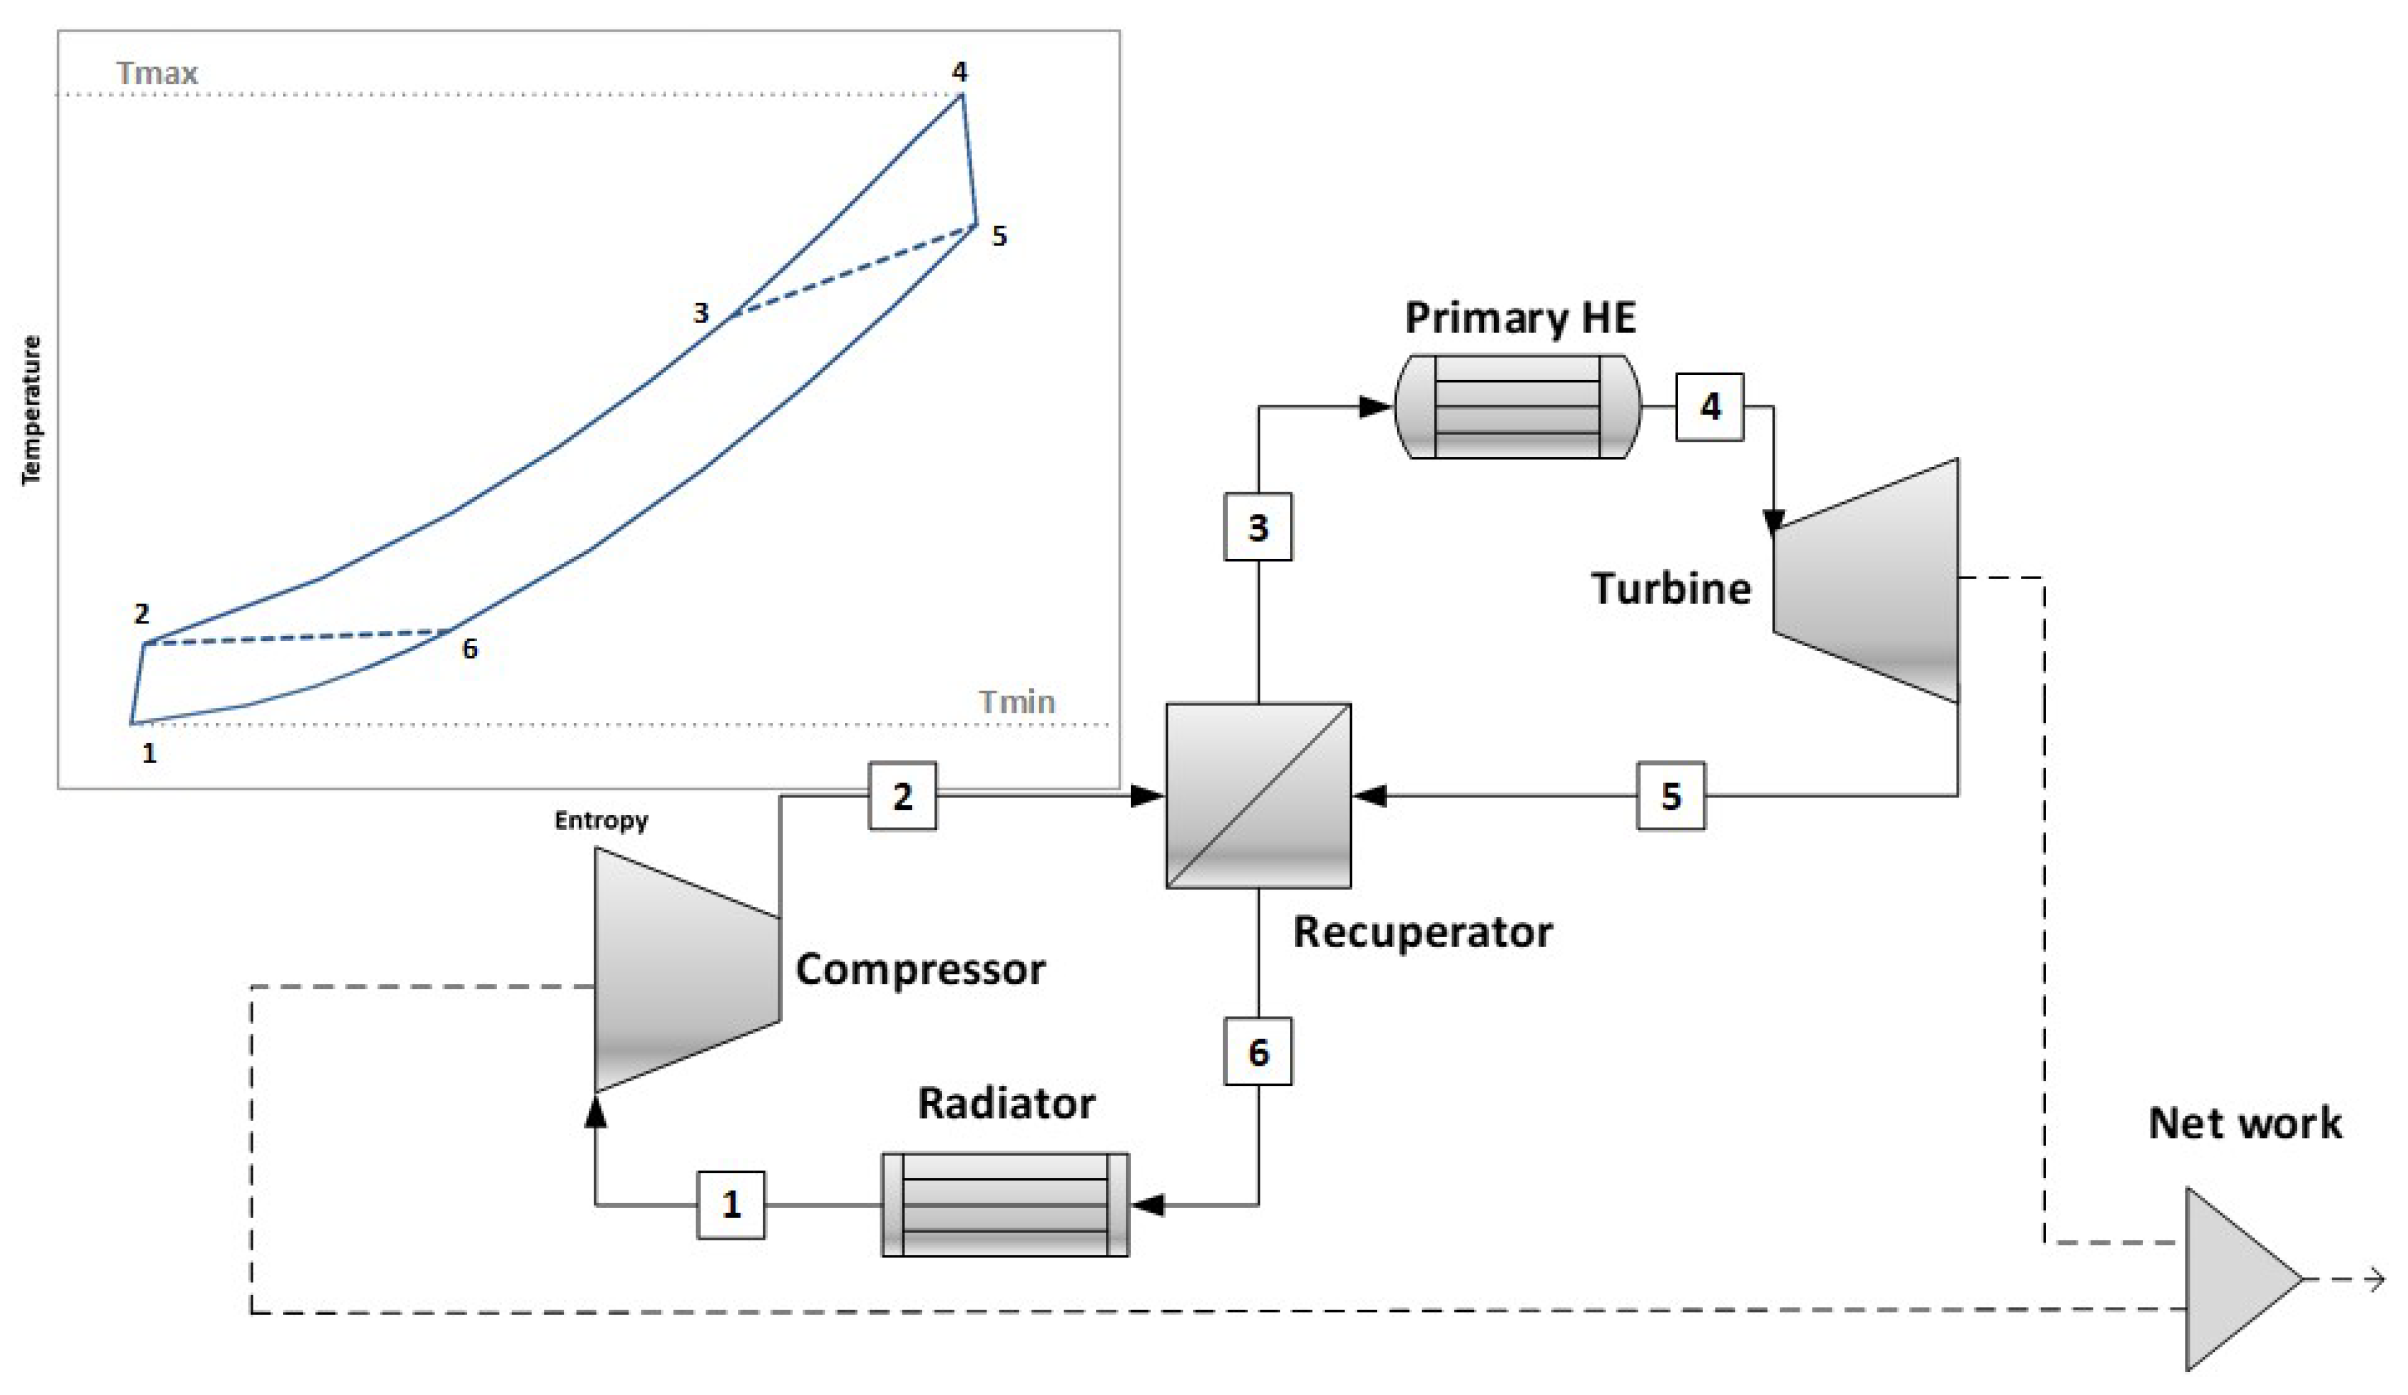
The simple cycle assumed as a reference is shown in
Figure 1: the AspenPlus© V9 software was used for all the calculations. The compression and the expansion processes were divided into ten stages, each one at an equal compression/expansion ratio, so the compression/expansion ratio of each stage results in
. The isentropic efficiencies for each compression stage
and for each expansion stage
were assumed equal to 0.85. The multistage approach implies that the stage isentropic efficiency can be assumed as an approximate value of the polytropic (or small-stage) efficiency. For the sake of simplicity, the pressure drops have not been considered. Other parameters are reported, when necessary, in the figures and in the text.
In the following also a thermodynamic cycle with an inter-refrigerated compression will be discussed, and its reference scheme is in
Figure 2.
In real gas conditions, the accurate estimation of the thermodynamic properties of the working fluids is essential for a right evaluation of the cycle performance. The proper model should be thermodynamically consistent and capable of accurately predicting the properties of interest even outside the domain of available experimental data. In addition, the ability to correctly evaluate the phase equilibrium is also fundamentally important [
46].
Many Equations of State (EoS) are available today. Usually, the most precise EoS have many optimised parameters and are difficult to generalise. Typical examples of this EoS family are those based on the Helmholtz free energy potential [
47]. On the other hand, the cubic equations of state are the most commonly used due to their relative simplicity and versatility [
48]. For example, the accepted reference model for carbon dioxide, a compound typically considered as a working fluid in real gas Brayton cycles, is a Helmholtz-based EoS [
49]. Nevertheless, in [
50], the use of a cubic equation of state was recommended for the evaluation of the modelling of direct supercritical power cycles with carbon dioxide.
Regarding the mixtures of fluids, it is often difficult to have numerous experimental data available for the model calibration; thus, in this case, cubic equations of state, which are relatively simple and reasonably accurate, are to be preferred. Furthermore, even relatively simple equations of state are suitable for evaluating the overall performance of thermodynamic cycles. More precise and complex methods (also integrated by transport properties) can be used for the specific design of the different components of the engine [
38].
For this reason, for the following calculations, we have used the well-known Peng–Robinson equation of state, [
51] (p. 256) and [
52].
The fluids considered here for a general discussion about the real gas effects in closed Brayton cycles are reported in
Table 1, and they are ordered by increasing critical temperatures. The table includes some of their thermodynamic parameters of interest.
Carbon dioxide is the typical working fluid considered today in supercritical closed Brayton cycles; therefore, it represents our basic reference. Nitrous oxide has properties very similar to carbon dioxide, so it is interesting to verify general correlations for the thermodynamics of closed Brayton cycles with important real gas effects. From this point of view, ethane is also interesting due to its critical temperature being close to that of carbon dioxide. Perfluoro-propane and propane have critical temperatures that are higher than those of carbon dioxide and have higher molecular complexity. Helium, Argon, and Xenon are noble gases: their thermodynamic behaviours at temperatures near ambient are typical of the ideal gases. Perfluoro-ethane has a critical temperature close to that of Xenon, but a much higher molecular complexity. The molecular complexity of a pure fluid is defined in [
53], p. 109: it is proportional to the molar specific heat.
The temperature increase of a fluid during an isentropic compression is
for ideal gases.
So, for an ideal gas,
with
mol
−1−1.
Therefore, for the relation (
3), fixed the initial conditions and a temperature increase of
; the gases with greater molecular complexity (i.e., with greater
), required a greater compression ratio. As demonstrated in [
54], for a closed Brayton cycle with ideal gases as working fluids, fixed the maximum and minimum cycle temperatures and the main design parameters of the components, the maximum cycle efficiency does not depend on the choice of the working fluid, but only on the temperature variations during compression and expansion.
For compounds with high molecular complexity, we should, therefore, basically only expect good thermodynamic cycle efficiencies with large compression ratios.
With regard to the compression work
, it is defined as:
with
being the molecular weight and
Z being the compressibility factor, which is usually equal to one for ideal gases.
As can be seen in relation (
4), the ratio
is constant for any fluid, thereby fixing the law of variation of the reduced temperature
as a function of the reduced pressure
by virtue of the Law of Corresponding States; see [
53] (p. 101) [
51] (Section 8.2).
As a consequence of relation (
4), the compression work decreases with the molar mass
, and it is a direct function of
Z. For a given compression ratio and fixed initial reduced temperature
, the compression work can be reduced if the compression starts in areas of the thermodynamic plane that are characterised by low
Z values (i.e., near the critical point), with a resulting positive effect on the thermodynamic cycle efficiency.
Unfortunately, near the critical point, the specific heat capacity at a constant pressure varies significantly with the pressure, as shown in
Figure 3a for carbon dioxide. This behaviour has an impact on the recuperator efficacy, where the high pressure fluid could heat it up along the line Ⓑ, while the low pressure fluid could cool along the isobar Ⓐ. The large difference in the specific heats causes an imbalance between the hot-side and the cold-side thermal capacities, with significant thermodynamic irreversibility in the recuperator.
In any case, even at relatively large reduced temperatures, the heat capacity at a constant pressure increases with the pressure. See, for example,
Figure 3b.
It is precisely the reduction of the compression work and the large variations in the heat capacity with pressure to which we refer when speaking of real gas effects in Brayton cycles. In the following sections, we will discuss their effects. It is also worth mentioning the effects of real gas connected to the reversible reactions of molecular dissociation and association, which, however, will not be considered here; please refer to [
35,
55,
56,
57].
3. Thermodynamic Effects of the Compressor Inlet Temperature and Pressure
In this section, the thermodynamics of Brayton cycles with strong real gas effects will be discussed by adopting the simplifying assumptions described in
Section 2. First of all, results using pure fluids will be shown, taking carbon dioxide as a reference fluid; then, the effects for binary mixtures of fluids will be delineated.
Pure Fluids
Figure 4 shows the thermodynamic efficiencies of ideal Brayton cycles (in dashed lines) and of real Brayton cycles (in solid lines) for different initial reduced pressures
using CO
2 as the working fluid.
The ratio is assumed to be equal to 0.55, and the compressor inlet reduced temperature is equal to 1.03 (corresponding to about 40 in this case). The parameters and are the minimum internal temperature approach and the logarithmic mean temperature difference in the recuperator, respectively. In the ideal cycles, has been assumed to be (close to) zero; for real cycles, the ratio is assumed to be 0.08, thus corresponding to a of about 25 .
For ideal cycles, the efficiency significantly decreases as the minimum cycle pressure increases. For example, when affixing the compression ratio 2, it is about 0.48 at 0.01, while at 0.9 results in about 0.4. On the contrary, in a real cycle, an increase in the minimum pressure improves the thermodynamic cycle efficiency. As an example, the efficiency at 2 moves from about 0.21 at 0.01 to about 0.29 at 0.9.
The entropic analysis explains the reasons for the different behaviours in the two cases. In the ideal cycle (
Figure 5a), when
is 0.01 (i.e., ideal gas), the only two thermodynamic losses are related to the heat introduction and rejection phases (loss items 3 and 5 in
Figure 5a, respectively). On the other hand, with the same ideal cycle using a working fluid with intense real gas effects (at
0.9,
Figure 5a), a significant thermodynamic loss appears in the recuperator despite the fact that the
is equal to zero (loss item 2). The loss in the recuperator, due to real gas effects, is a consequence of the differences between the hot-side and the cold-side thermal capacities discussed in
Section 2.
The results change drastically if the efficiencies of the machines and the recuperator efficacy are taken into account, as shown in
Figure 5b. The low values of the compressibility factor of a real gas in the compression step halved the corresponding efficiency loss (loss item 1 in
Figure 5b), as defined in relation (
4), from about 0.07 for the working fluid in ideal gas conditions to about 0.03 for the real gas. Considering that the recuperator loss is similar, the advantage of the real gas leads to a cycle efficiency of 0.29 against a value of 0.22 for the real cycle with an ideal gas.
Figure 6 shows the effect of the minimum reduced temperature
on the cycle efficiency for a real gas (
0.9). By moving the start of compression away from the critical point of the working fluid, the positive effects of low compressibility factor on the cycle are reduced. For
1.7, for example, the cycle efficiency decreased by about two percentage points when
changed from 1.01 and 1.2.
Furthermore, increasing the maximum temperature mitigates the benefits of real gas effects on the final cycle efficiency. In
Figure 7, the increasing of
from 0.55 to 0.65, while at the same
1.03, reduced the maximum
by half.
The efficiency loss in the recuperator can be reduced by modifying the simple cycle: alternative cycle configurations with carbon dioxide have been the most investigated.
A long time ago, Angelino proposed different cycle configurations in their seminal works [
15,
58,
59]. These included a split before the radiator and a re-compression with a possible reheated expansion or compound cycles with a partial intermediate pre-compression, at relative low temperatures, thereby allowing an expansion at pressures that were lower than the assumed minimum cycle pressure. All these configurations and many more have been extensively discussed in [
27]. Comprehensive reviews on carbon dioxide thermodynamic cycles and on their technological aspects have been described in [
22,
26,
29,
31,
32].
Figure 8a shows the layout of a supercritical cycle with a recompression. In point 9, a fraction of the flow rate is directly compressed up to the pressure of point 4, thereby bypassing the low temperature recuperator.
The split mass flow rate fraction
to be compressed from the point 9 to the point 4 is calculated from a thermal power balance on the low temperature recuperator:
The reduction in the mass flow rate at high pressure in the cold-side of the recuperator balances the two flow stream capacities, thereby reducing the corresponding irreversibility loss. For the calculation of
, we assumed
. As presented in
Figure 8b, the maximum efficiency for the recompressed cycle was about four points higher compared to the case of the simple cycle with the assumptions above mentioned. It is worth mentioning that the required recuperator exchange areas increases with the cycle efficiency. Assuming a
of 5
in both recuperators, the resulting
, representing the ratio between the total required
and the produced net power, of the recompressed cycle was about double compared to the simple cycle.
The cycle efficiency of a simple cycle for different working fluids, such as those in
Figure 1, as a function of the compression ratio
is shown in
Figure 9. By fixing the reduced conditions, the maximum cycle efficiency was almost the same for all the fluids. As discussed in
Section 2, the optimum compression ratio increases with the molecular complexity of the working fluid.
In any case, the beneficial compression work reduction was greatest when the compression began near the critical point, where the compressibility factor was about 1/3. Therefore, depending on the application, the choice of the right working fluid becomes an important design variable. From a strictly thermodynamic point of view, the use of mixtures of fluids is so really interesting, because it will add an additional degree of freedom.
4. Mixtures as Working Fluids
The thermodynamics of a mixture can still be described with an equation of state such as the cubic Peng–Robinson equation used in the previous sections for the pure fluids. In the case of mixtures, however, the binary interactions between the molecules of the components must be taken into account, and, in the case of the Peng–Robinson equation, additional coefficients
, for each couple
, must be introduced in the analytical model. For mixtures with two components (
),
usually has to be estimated from the experimental data of vapour–liquid phase equilibria; see [
51], p. 323.
The interest in adopting fluid mixtures as working fluids in thermodynamic cycles involves the critical point changes with the composition. In principle, the critical point can be modified by adapting it to the different operational requirements. For example, a high critical temperature can be interesting for a cogeneration unit or for a cycle that must operate in places with high ambient temperatures.
As an example, in
Figure 10a and
Figure 11a, the critical loci for mixtures of carbon dioxide and propane and of ethane and propane are depicted, respectively.
The critical point of the mixture varies continuously when modifying its composition. A critical temperature of 60 , for example, in the case of the mixture of carbon dioxide and propane, could be obtained with an equi-molar composition. By contrast, in the case of the mixture of ethane and propane, the same critical temperature was obtainable with a molar fraction of ethane equal to 65%. Usually, mixing two different fluids implies a temperature difference between the dew and boiling points at sub-critical pressure. This temperature “glide”, more or less pronounced, usually depends on the relative difference of the boiling points of the individual components.
In
Figure 10a and
Figure 11a, there are also the T–P envelopes for the two cited compositions corresponding to mixtures with a critical temperature of 60
. In
Figure 10b and
Figure 11b, there are, in the T–S thermodynamic plane, the corresponding saturation domes and two isobars in the subcritical and supercritical region, respectively. For a bubble temperature of 40
, in case of the equi-molar mixture between carbon dioxide and propane, the corresponding pressure was about 50 bar with a corresponding temperature “glide” of about 20
. For the mixture of ethane (65% molar) and propane (35% molar), a bubble temperature of 40
was reached at a pressure of about 35 bar, with a temperature “glide” of about 10
.
Figure 12 shows the efficiencies for different simple recuperative cycles using pure fluids or mixtures as working fluids. The minimum temperature was assumed to be equal to 40
; so, as a consequence, the heat rejection unit became a condenser in the case of the two considered mixtures. The compression of the saturated liquid appreciably increased the cycle efficiency with respect to cycles that operated just in the gas phase region. This type of cycle can be classified as a liquid phase compression gas turbine [
60].
Apart from efficiency, an important difference among the various thermodynamic cycles in
Figure 12 is the law of heat transfer to the environment.
Figure 13 shows precisely the temperature variations during the cooling of the working fluids for the cycles shown in the previous figure. The possibility to select the working fluid (a pure fluid or mixtures) according to the temperature “glide” and the minimum temperature offers the possibility to satisfy various cogeneration needs and applications. An increase in the minimum temperature, however, keeping the same
, also leads to the growth of the maximum cycle temperature, which makes it difficult to identify working fluids with adequate thermal stability and chemical inertness. From this point of view, carbon dioxide is an exception. Among other chemical species, some perfluoro-carbons are, for example, characterized by good stability [
61,
62]. In principle, some perfluoro-carbons could be used in mixtures with carbon dioxide, but they have a very high GWP (Global Warming Potential), and their effective thermal stabilities are above 450
[
36,
39]. For high temperature applications, it may then be interesting to consider the possibility of using mixtures of carbon dioxide and inert gases.
5. Mixtures of Carbon Dioxide and Inert Gases as Working Fluids
Figure 14 shows the cycle efficiency of inter-cooled compression cycles (see the layout in
Figure 2) through the blending of CO
2 with helium at different mixture compositions with respect to the resulting efficiency for different cycles adopting pure CO
2 or He. The inter-cooled compression is widely used to reduce the compression work, and this process is often proposed for closed Brayton cycles with inert gases as working fluids [
4,
8]. For the pure He cycle, the minimum pressure, in practice, has no effects on the efficiency of the cycle, as helium behaved as ideal gas in the investigated operating conditions: the optimal efficiency was about 40% with a minimum pressure range of 10 bar to 80 bar.
In the same figure, for , the results are also reported for a simple compression cycle, for an inter-cooled compression cycle, and for a re-compressed cycle using CO2. The inter-cooled compression for real gas cycles with carbon dioxide was not really useful, due to the losses in the recuperator, which are, however, important. On the contrary, real cycles with mixtures of carbon dioxide and helium were characterised by good thermodynamic performance with a maximum value of 44%, which was an intermediate value between those of the simple and of the re-compressed cycle.
Helium, mixed with carbon dioxide, attenuates the real gas effects, thereby causing an increase in compression losses while, at the same time, significantly improving the regeneration step: see
Figure 15a,b.
As a matter of fact, the choice of the best cycle configuration depends on the real performance of the components, on the pressure losses, on the dimensions of the heat exchangers, and of the power size of the engine. In the following section, we will discuss some aspects related to the components’ design.
6. Some Consideration on the Components’ Design
The resulting maximum cycle efficiencies, under equal operating conditions, are often very similar. For example, in
Figure 14, values of efficiency of about 0.45 and 0.44 for the recompressed cycle and for the inter-cooled cycle with
were obtainable, respectively; in
Figure 9, the calculated cycle efficiencies resulted in about 0.29 and 0.3 for the simple cycle with carbon dioxide and for the cycle using C
2F
6 as a working fluid, respectively.
In such a situation, the final choice of the type of cycle and of the working fluid depends on the actual performance of the components. Specifically, it depends on the actual efficiency of the turbomachines, on the dimensions of the heat exchangers, and on the real pressure drops.
Assuming
where
is the temperature difference during the compression, and, according to [
54], the cycle efficiency results are just a function of
,
, and of the performance of the single components (compressor, turbine, recuperator), at least in the case of ideal working fluids.
Therefore, in our case, it is also relatively simple to make some general considerations on the dimensioning of the key components of the engine.
6.1. The Sizing of the Turbomachines
We can assume, as a first rough approximation, that, with reference to the work
of the turbine, we arrive at the following:
Since the maximum enthalpy drop per each stage is limited, as the molecular complexity increases (that is, decreases) and/or the molar mass of the fluid decreases, the number of stages (and the axial size) of the turbine will increase. However, usually, the molecular mass increases with the molecular complexity. From this point of view, the ideal working fluid could be a “heavy” fluid with a moderate molecular complexity (a low molar ). Obviously, the conclusion is valid as a first approximation, because other factors (the speed of sound, for example) intervene in the final design of the turbomachines.
The variation in the volumetric flow during the expansion, for example, is fundamental. Thus, we have the following:
and
Therefore, at equal , if the compression/expansion ratio increases, the variation in the Volumetric Flow Ratio (VFR) becomes more and more important, and the overall efficiency of multistage turbomachines tends to decrease. At equal , fluids with low molecular complexity (with a monatomic molecule, for example), from this point of view, are at an advantage.
Just as an example, in
Table 2, the turbine specific work
and the turbine Volumetric Flow Ratio
were compared with the corresponding values of the carbon dioxide cycle. The results confirmed relations (
6) and (
9). The three considered working fluids in
Table 2 all had the same molar mass but different molecular complexities (see
Table 1).
6.2. The Sizing of the Heat Exchangers
The working fluid nature also influences the sizing of the heat exchangers. With reference to the recuperator, for example, according to [
53], p. 59, the ratio between the power required by the pressure drops
and the thermal power exchanged
, for a stream, results in the following:
Assuming that
and
, Equation (
10) begins
At an equal hydraulic radius , the lower the ratio is, the greater the . Moreover, depends on the parameter . In all our calculations, the is assumed to be equal to 25 , while, as regards the parameter , we have to assume a value for the Reynolds number .
We considered, just as an example, the simple cycle with carbon dioxide in
Figure 14 as case “1” and the inter-cooled compression cycle with a mixture of carbon dioxide and helium with
as case “2”. An additional assumptions was made regarding the pumping power per unit of heat exchange area, which we can assume was the same for both cases “1” and “2”.
We have the following:
We then obtain
from which, with
,
From the ratio
, at equal
, we can evaluate the ratio
For the considered cases, the ratio resulted in about 1.14 (as a mean value at a pressure of 75 bar and for a temperature range from 25 to 700). Then, the resulting recuperator exchanged thermal power resulted, with the assumed hypothesis at equal , for the mixture of carbon dioxide () and helium, to be greater than 14% of the corresponding value for the pure CO2.
7. Conclusions
In the previous sections, the thermodynamic peculiarities of closed Brayton cycles with working fluids exhibiting real gas effects at temperatures close to the compression were discussed.
In principle, according to the application, different working fluids can be used, and the possibility of resorting to appropriate mixtures widens the possible choices even further. However, it is difficult to identify thermally stable organic fluids at temperatures above 400 . For this reason, carbon dioxide is currently the most often proposed working fluid for applications with maximum cycle temperatures up to 700 .
In general, given the high pressures involved, the useful powers tend to be rather high (of the order at least of ) to avoid excessively small and very fast turbomachines. On the other hand, it has been shown how the weight of the positive real gas effects on the cycle efficiency decreased with the increase in the maximum cycle temperature, and, from this point of view, the greatest thermodynamic benefits were obtained for applications characterised by modest temperature maximums (of about 300–400 ).
The possibility of selecting mixtures with a critical point that allow condensation appears very interesting in cogeneration applications and in locations where the cooling fluid of the heat rejection unit is air.
In
Section 5, we explored the possibility of using mixtures of carbon dioxide with noble or inert gases (helium, for example): the inter-cooled compression further contributed to reducing the compression work, and the presence of the noble gas improved the performance of the recuperator.
The compatibility of the working fluid with materials at high temperatures is always a problem. Even helium, in the presence of impurities (water, nitrogen…), is reactive with alloy steels at temperatures of 700 . In the specific case of helium, many consider it as a critical strategic resource.
Definitely, closed Brayton cycles represent a good opportunity for the conversion of thermal energy from different sources (solar, biomass…) and also for thermal recovery. Furthermore, the effects of real gases significantly undoubtedly increase their efficiency, thereby making them attractive, even with relatively low maximum temperatures: for example, this can include from 300 to 400 with proper thermodynamic efficiencies (≈0.2 to 0.3). However, the working fluid becomes an important variable when also considering the possibility of using mixtures of fluids. Therefore, for the development of efficient heat engines operating in a closed Brayton cycle, measurements on the thermodynamic properties of a liquid–vapour equilibrium for potentially interesting mixtures are fundamental. Measurements of the thermodynamic properties are also associated with investigations on material compatibility and thermal stability.


