Article

Non-Thermal Plasma Pyrolysis of Fuel Oil in the Liquid Phase

by
Evgeniy Yurevich Titov
1,*,
Ivan Vasilevich Bodrikov
1,
Alexander Leonidovich Vasiliev
2,3,4,
Yuriy Alekseevich Kurskii
1,
Anna Gennadievna Ivanova
2,
Andrey Leonidovich Golovin
2,
Dmitry Alekseevich Shirokov
1,
Dmitry Yurievich Titov
1 and
Evgenia Ruslanovna Bodrikova
1
1
Technology of Electrochemical Production and Chemistry of Organic Substances, Nizhny Novgorod State Technical University n.a. R.E. Alekseev, 603155 Nizhny Novgorod, Russia
2
FSRC “Crystallography and Photonics” RAS, 119333 Moscow, Russia
3
National Research Center, Kurchatov Institute, 123098 Moscow, Russia
4
Moscow Institute of Physics and Technology, National Research University, 141701 Dolgoprudny, Russia
*
Author to whom correspondence should be addressed.
Energies 2023, 16(10), 4017; https://doi.org/10.3390/en16104017
Submission received: 18 April 2023 / Revised: 29 April 2023 / Accepted: 9 May 2023 / Published: 10 May 2023
(This article belongs to the Special Issue Plasma Application in Fuel Conversion Processes)

Abstract

:
A pulsed plasma pyrolysis reactor with an efficient control system was designed for fuel oil processing. Non-thermal plasma pyrolysis was carried out in the liquid phase at low temperatures (not higher than 100 °C) in a 300 cm3 reactor without additional reagents or catalysts. The main process parameters and characteristics of non-thermal plasma fuel oil products were investigated within the DC source voltage range of 300–700 V. An increase in the energy of pulsed discharges led to an increase in the productivity of the plasma pyrolysis process and the yield of hydrogen but reduced the yield of acetylene and ethylene. The resulting gas consisted predominantly of hydrogen (46.5–50.0 mol%), acetylene (28.8–34.3 mol%), ethylene (7.6–8.6 mol%), methane (4.2–6.2 mol%), and C3–C5 hydrocarbons. The solid-phase products were in the form of disordered graphite and multilayer nanotubes.

1. Introduction

Heavy oil reserves are estimated to contain 5.5 trillion barrels, which accounts for over 70% of the world’s oil reserves [1,2]. Heavy oil has a density of 920–1000 kg/m3 and extra-heavy oil has a density above 1000 kg/m3. The sulfur content in these oils reaches up to 7% [3,4]. The low content of light fractions and hydrogen to carbon ratio, as well as high viscosity, a large number of heterocompounds, asphaltenes, resins, and high-molecular-weight paraffins also complicate the processing of heavy oils via conventional methods [5,6,7,8]. Current processing methods for heavy hydrocarbon feedstocks (visbreaking, delayed coking, hydro pyrolysis, and catalytic cracking) have several disadvantages: high temperature (400–600 °C) and pressure (up to 20 MPa) requirements, the need for hydrogen, and high costs for equipment and coke removal [9,10,11,12,13]. Heating the raw materials and maintaining high temperatures during the process requires burning a large volume of hydrocarbon fuel with high CO2 emissions [14,15,16]. Replacing high-temperature reactors and furnaces with plasma reactors using carbon-free electricity will significantly reduce CO2 emissions [17,18,19]. Plasma technologies for refining heavy oils reduce the use of hydrogen and also exclude the use of expensive catalysts [20,21,22,23].
The action of plasma on hydrocarbons leads to primary reactions such as excitation, dissociation, and ionization. Chemically active particles resulting from these reactions (radicals, ions, and excited particles) undergo rapid recombination to form products at the relaxation stage. A distinction is made between thermal plasma (TP) and non-thermal plasma (NTP) according to particle energy and plasma temperature [24]. TP requires tens of kilowatts of power at a plasma temperature of ~10,000 °C, which helps increase the yield of gas phase products such as hydrogen, acetylene, and other gaseous hydrocarbons [25,26]. However, a significant portion of the input power for TP generation is lost through heating the system. In contrast, NTP requires relatively little power and does not cause an obvious increase in system temperature.
The generation of highly reactive species, such as radicals and other active particles, is a significant advantage of NTP for chemical processes. These species can selectively activate specific chemical bonds or functional groups in a molecule, leading to specific reaction pathways that may not be accessible through conventional chemical methods [27,28]. The utilization of NTP for chemical processes enables strongly endothermic reactions at moderate temperatures, limiting joule heating effects and thereby minimizing energy loss through heating the reactant mass [29,30,31]. This attribute renders plasma processes energetically efficient and promising for thermocatalytic reactions, which are customarily executed at elevated temperatures and pressures.
While examples of large-scale plasma applications have been demonstrated, problems hinder widespread introduction into the chemical industry [32,33,34]. These relate mainly to scaling up laboratory plasma processes, which requires solving technical challenges in designing an entire high-power plasma system including a reactor and power supply. Solving these problems is required to launch large-scale plasma processes.
The transition to a low-carbon economy has led to the intensification of the development of plasma-chemical technologies for hydrocarbon processing [35]. Plasma-chemical pyrolysis makes it possible to produce turquoise hydrogen together with olefins and carbon materials [36,37,38]. Plasma-chemical technologies are also being developed for waste recycling [39,40,41] and for the decomposition of CO2 [42,43].
Previous studies [44,45] show the possibility of using NTP pyrolysis for processing heavy oil fractions and thermostable toxic organochlorine substances. A 40 cm3 reactor with pulsed discharges in the liquid phase generated by one automatically moving electrode was used. Pulsed discharges in the liquid phase were generated by the automatic movement of an electrode according to a predetermined algorithm using the control system [46,47]. The developed principle for generating electric discharges, control system, and plasma reactor are effective for inducing chemical processes.
This paper describes a 300 cm3 plasma pyrolysis unit with an efficient control system for generating electric discharges in the liquid phase. The modified unit is used to study the NTP pyrolysis of fuel oil using 300–700 V DC electric discharges. The results will allow the creation of small modular plasma-chemical reactors with high productivity and process selectivity.

2. Materials and Methods

2.1. Characteristics of Raw Material

Fuel oil was used as an experimental object with the following characteristics: density at 20 °C—0.955 g/cm3, kinematic viscosity at 100 °C—31.169 mm2/s, sulfur content—2.675%, boiling start point—298.5 °C, boiling end point—671.3 °C, non-volatile residue—30.6%, C/H ratio—7.07.

2.2. Experimental Setup

The plasma pyrolysis unit (Figure 1) includes a reactor, a system for controlling and recording electric discharge parameters, and an off-gas collection system. The reactor is made of carbon steel. The reactor volume is 300 cm3. Graphite electrodes are inside the reactor. An EA-PSI 9750-06 2U DC power supply up to 750 V is used to generate electric discharges. Fuel oil is poured between graphite electrodes. Before starting, helium was pumped through the entire installation to create an inert atmosphere and prevent possible ignition of the resulting gases (hydrogen, acetylene, and others) inside the reactor. Plasma-chemical pyrolysis is carried out at a slight excess pressure of 1–2 atm. Gaseous products from the reactor pass through a seamless gas sampler and are then burned on a Bunsen burner. The pyrolysis process is carried out until the gas formation stops.
Low-voltage discharges are generated by a semiconductor switch. Discharge frequency, duration, number, and operating sections are set by the control system. The adjustable power supply (DC VS) sets the voltage at which discharges occur in a multi-section system. The microprocessor control system (MCS) measures the voltage value at the DC VS output using a voltage sensor (VS) and compares it with the set value. When the voltage reaches the set value with the measured one, it generates control pulses for the transistor VT1. The number of discharges is counted by the MCS using the current sensor (CS).
During the process of NTP pyrolysis, the oscilloscope was employed to record the instantaneous values of current and voltage at a 2 min interval (600,000 measured values). MATLAB was employed to process the recorded values, obtain time-dependent representations of transients (discharges), and determine current pulse parameters. This analysis enabled the determination of current pulse parameters, including the number of pulses within each 2 min interval, the duration of each pulse, the total discharge exposure time, and the amplitude (maximum current) of each pulse. The average values (Table 1) were then calculated using the method described in [47].
Typical oscillograms of current and voltage pulses of plasma-chemical pyrolysis of fuel oil at 300–700 V are shown in Figure 2.

2.3. Sample Analysis and Characterization

The raw material and liquid NTP pyrolysis products of fuel oil were analyzed for several characteristics. The fractional composition was determined via ASTM D7169 using a Chromatec-Crystall 5000.2 gas chromatograph equipped with a flame ionization detector (JSC SDO Chromatec, Yoshkar-Ola, Russian Federation). The kinematic viscosity at 100 °C was determined according to ASTM D7042. The density at 20 °C was measured using an Anton Paar SVM 3000 Stabinger viscometer-densitometer (Anton Paar GmbH, Graz, Austria), following ASTM D4052. The sulfur content was analyzed according to ASTM D4294, using a Lab-X 3500 X-ray fluorescence analyzer. IR spectra were measured using an FSM-1202 Fourier-transform infrared spectrometer. Gas product composition was determined using a Chromatec-Crystall 5000.2 chromatograph (JSC SDO Chromatec, Yoshkar-Ola, Russian Federation).
NMR spectra were recorded on a Bruker Avance III 400 spectrometer at 400 MHz for 1H NMR and 100 MHz for 13C NMR using residual CHCl3 as an internal reference.
1H and 13C NMR spectra were acquired on a Bruker Avance III spectrometer. Fuel oil samples were dissolved in CDCl3 solutions following the ASTM D5292 method, with a 5% volume concentration. The signals of chloroform-d (δC = 77.0) and residual CHCl3 in the solvent (δH = 7.26 ppm) were used as an internal standard. To enhance the sensitivity of the analysis and reduce noise, the solid particles were removed from the samples via filtering through a 0.22 μm pore size fluoroplate filter. The aromatic hydrogen and carbon coefficients were calculated using the following equations: FHA = Har/(Har + Hal) and FCA = Car/(Car + Cal), where Har and Car are the total integrals of aromatic hydrogen and aromatic carbon atoms, respectively, and Hal and Cal are the total integrals of aliphatic hydrogen and carbon atoms, respectively [48].
The still bottoms obtained after NTP pyrolysis of fuel oil were extracted with heptane, and the solid phase was filtered using a paper filter. The solid products were then dried in a muffle furnace at 110 °C for one hour.
Solid product analysis was conducted using various analytical techniques, including scanning electron microscopy (SEM) together with energy-dispersive X-ray spectroscopy (EDXS), transmission electron microscopy (TEM), scanning transmission electron microscopy (STEM), electron diffraction (ED), energy-dispersive X-ray (EDX) microanalysis, X-ray phase analysis (XRD), X-ray fluorescence analysis, and Raman spectroscopy.
SEM/EDX studies were performed in a Supra 50 VP electron microscope (Carl Zeiss AG, Jena, Germany) with the INCA microanalysis system (Oxford Instruments, Abingdon-on-Thames, UK). The SEM images were obtained in the secondary electron (SE) registration mode.
Samples for TEM/STEM/EDXS studies were prepared through depositing sample particles on an electron microscopic copper grid with a Lacey carbon film. Samples were examined using an Osiris TEM/STEM (Thermo Fisher Scientific, Waltham, MA, USA) equipped with a high-angle annular dark-field detector (HAADF) (Fischione, Export, PA, USA) and a Super-X EDXS (Bruker, Billerica, MA, USA) at 200 kV accelerating voltage.
X-ray fluorescence analysis was performed using the Orbis (EDAX, Mahwah, NJ, USA). The accelerating voltage in the X-ray tube was 40 kV, the current was 100 μA, and the diameter of the X-ray beam was 2 mm. The studies were conducted without air pumping. Such conditions make it possible to register elements starting with sodium.
X-ray diffraction measurements were performed on a Rigaku MiniFlex600 diffractometer (Rigaku Corporation, Matsubara-cho Akishima, Japan) using CuKα radiation (40 kV, 15 mA, Ni-Kβ filter) in the angular range 2θ = 3–80° with a scanning step of 0.02° and a rate of 0.5°/min. The size of the beam falling on the sample was set by horizontal and vertical slits—10 mm and 1.25°, respectively. Phase identification was performed in the PDXL software (Rigaku Corporation, Matsubara-cho Akishima, Japan) using the ICDD PDF-2 database (2017) (https://www.icdd.com/pdf-2/, accessed on 10 May 2023) (ICDD, Newtown Square, PA, USA).
Raman (combination scattering) spectra of the samples were measured using a spectrometer consisting of a monochromator (Solar Laser Systems M266, Minsk, Belarus) with a CCD detector (charge-coupled device, U2C-16H10426, Japan). A 532 nm reflector (532 nm StopLine® single-notch filter, Semrock, Rochester, NY, USA) was also used in the setup. This filter reflects laser beams at the specified frequency, allowing only scattered light to pass to the spectrometer. Source imaging and laser beam alignment were performed using an optical system consisting of a video camera (The Imaging Source DFK 22AUC03, 644 × 484 pixels, Germany), a light source, a lens (50×, Plan Apo, ULWD, NA = 0.42, WD = 22.5 mm, Edmund Optics, Burlington, NJ, USA), two lenses, and two light beam dividers. Measurements of the Raman spectra were performed at an exposure time of 200 s, and the laser irradiation power on the sample was 0.47 mW at a laser wavelength of 532 nm.
The ABK-1B calorimeter was used, which belongs to variable-temperature calorimeters, in which the amount of heat is determined by the change in the temperature of the calorimeter vessel to determine the energy of combustion of the solid product.

3. Results and Discussion

3.1. Characteristics of NTP Pyrolysis and Analysis of Gaseous Products

The study of the effect of voltage on the phase and component composition of NTP pyrolysis products of fuel oil was carried out at voltages of 300–700 V. Table 2 presents the experimental results of the effect of stress on NTP pyrolysis of fuel oil. The main substances in the gas phase are hydrogen (46.5–50.0 mol%), acetylene (27.8–34.4 mol%), ethylene (7.6–8.3 mol%), and methane (4.2–6.2 mol%).
When conducting the NTP pyrolysis process at higher voltages, the energy consumption for the formation of gaseous products is significantly reduced from 39.7 to 8.3–11.7 kWh/kg (Table 2) as the process speed and gas flow rate increase from 7 to 555–709 mL/min. This effect can be attributed to an increase in the specific energy density and the number of radical and active particles, which result from an increase in the average pulse energy from 1.5 to 4.6 J (Table 1). The highest productivity of NTP pyrolysis is observed at 700 V; however, at a voltage of 500 V, the lowest energy consumption (3.9 kWh/kg of fuel oil), the highest yield of valuable gaseous hydrocarbons (46.5 wt%), and a high content of acetylene (30.4 mol%) are observed.

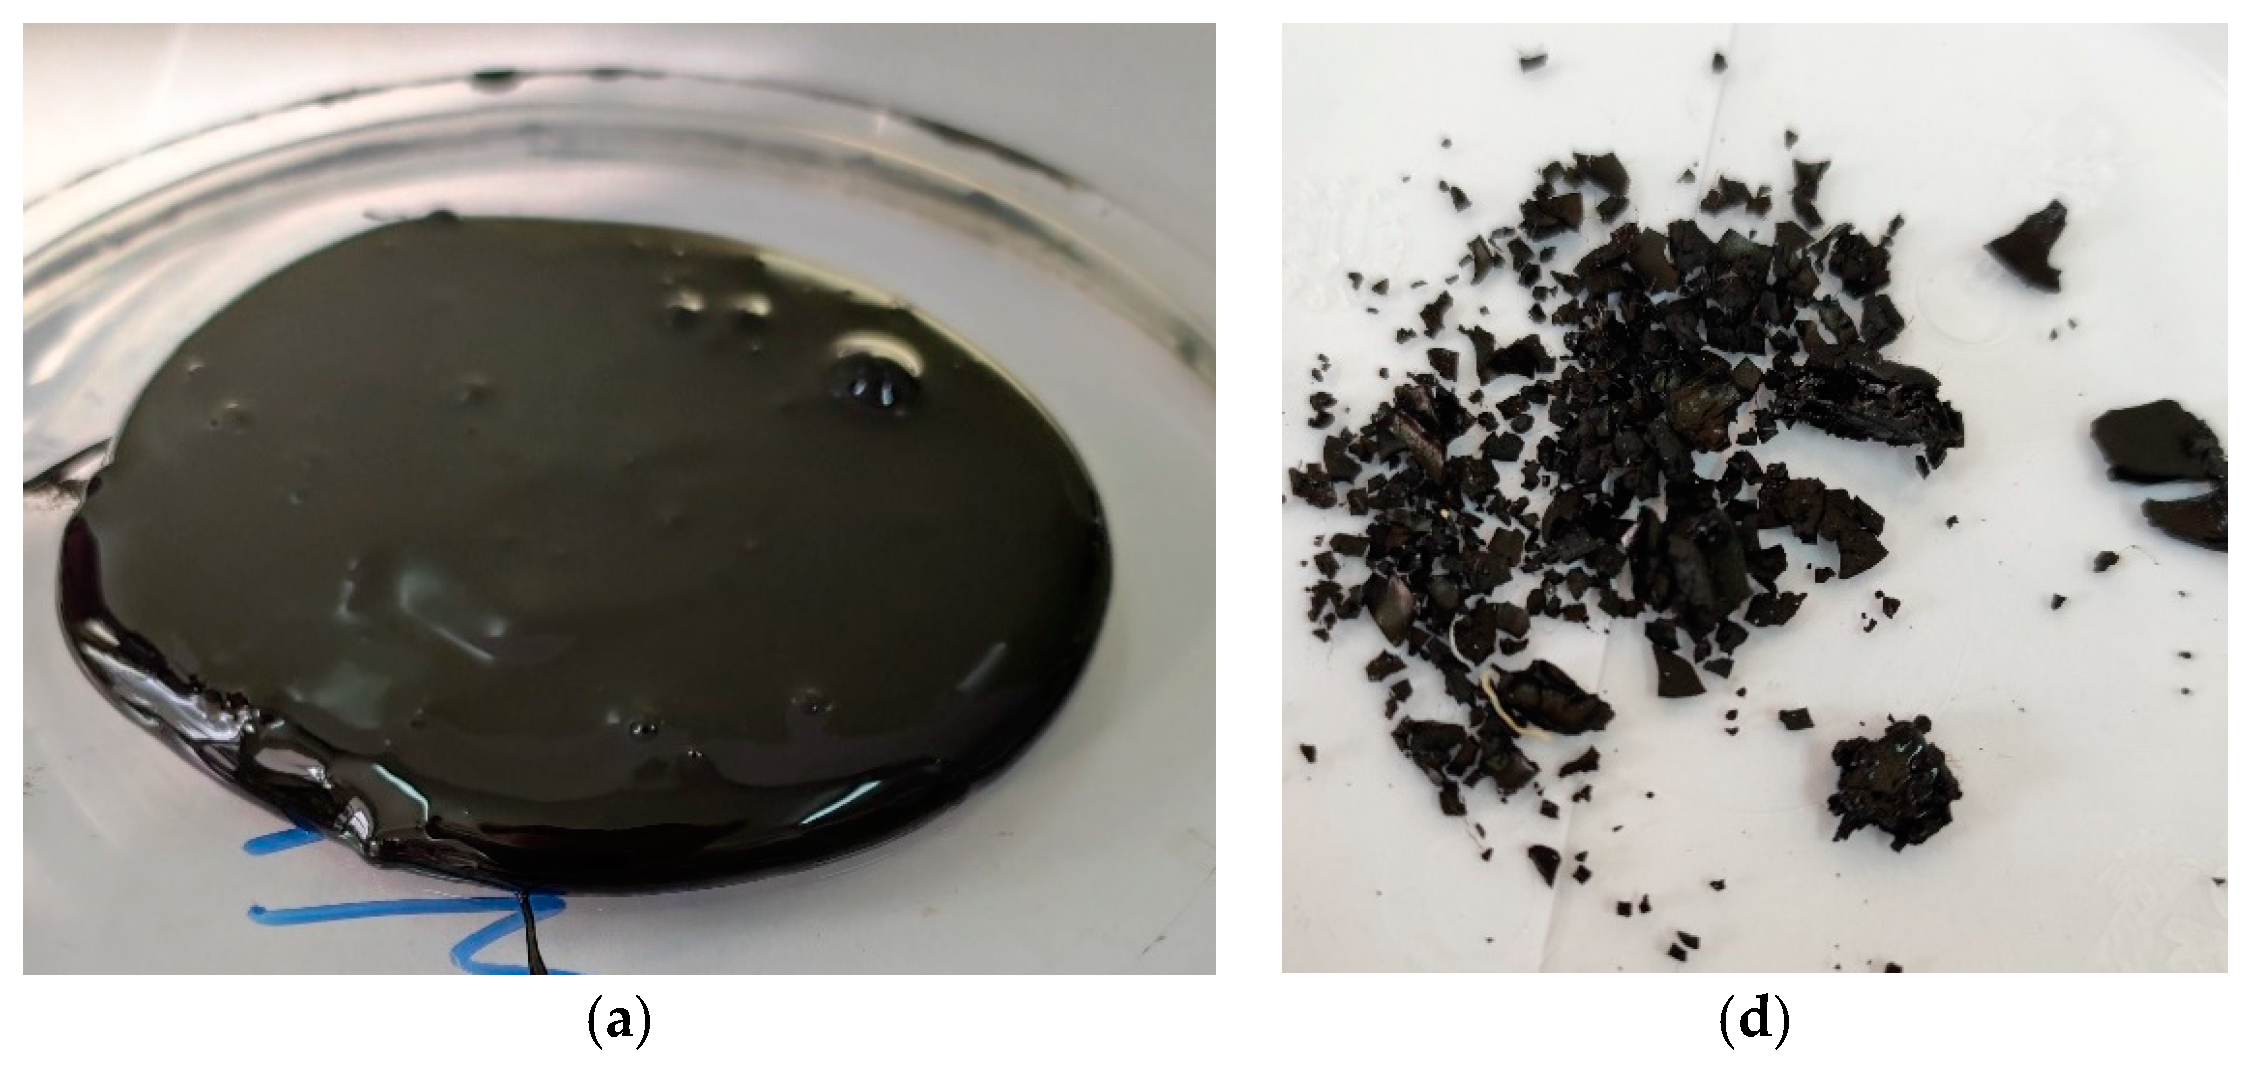
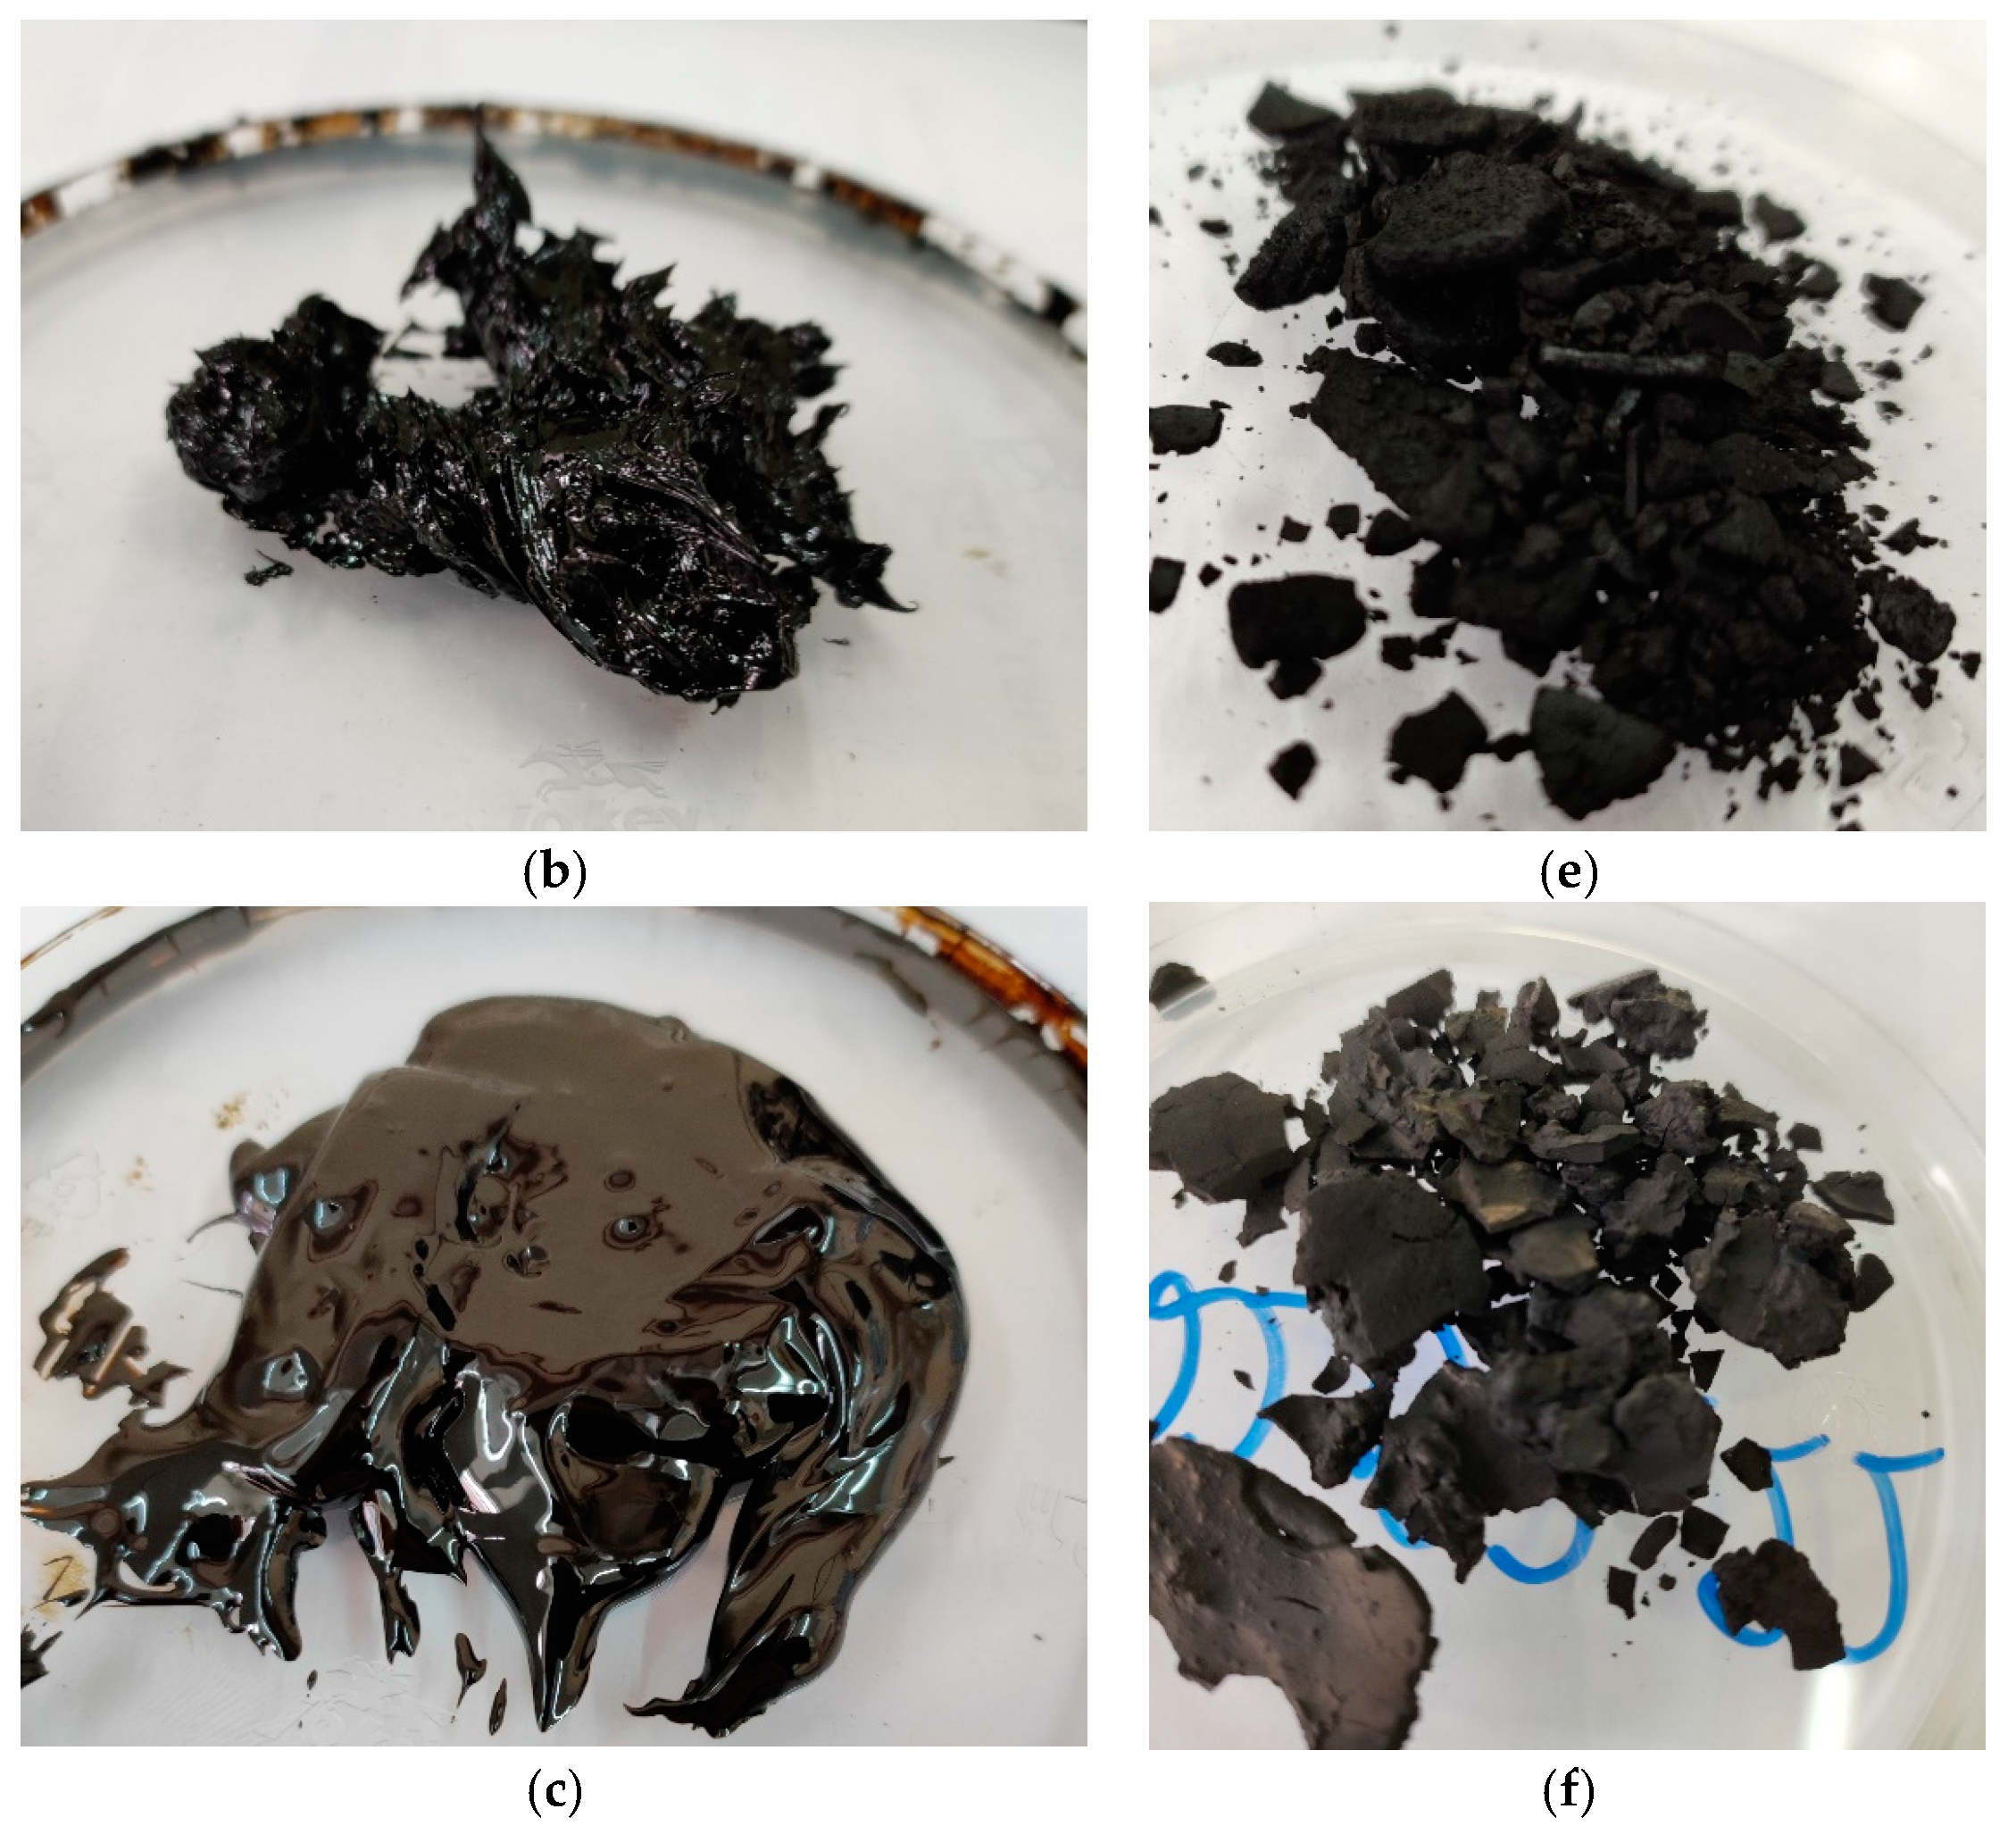
3.2. Still Bottoms Characteristics from the NTP Pyrolysis of Fuel Oil

The fractional composition (Figure 3) of the initial fuel oil and still bottoms after NTP pyrolysis at 300–700 V was determined using simulated distillation (ASTM D7169). The results showed that the NTP pyrolysis process led to the production of heavier fuel oil (Table 3 and Figure 3) with increased stress and degree of conversion compared to the initial fuel oil. Additionally, the NTP pyrolysis process increased the boiling point of the products while reducing the proportion of volatile components from 69% to 43–44%.
Table 3 presents the results of the analysis of fuel oil and still bottoms obtained from NTP pyrolysis of fuel oil. An increase in the density and viscosity of the pyrolysis products was observed. However, it was not possible to measure the viscosity and density of the pyrolysis still bottoms accurately at 500 and 700 V due to their high viscosity, solids content, and stickiness. The high content of solid structures (33.6–33.9 wt%) leads to an increase in the electrical conductivity of the fuel oil suspension and limits the conversion to 46.2–49.0 wt% (Table 2). The fuel oil suspension exhibited low resistance and started to conduct electric current, which resulted in the heating of the reaction medium. The increase in the carbon–hydrogen ratio in the still bottoms agreed with the composition of the obtained gaseous products (Table 2). As the stress increased in the NTP pyrolysis of fuel oil, the hydrogen content increased from 46.5 to 50.0 mol%, while the acetylene content decreased from 34.3 to 27.8 mol%.
Figure 4a–c show photos of still bottoms and solid products (d–f) isolated from still bottoms after plasma-chemical pyrolysis of fuel oil. The heat of combustion of the solid product (Figure 4f) is 36,439.6 ± 187.2 kJ/kg.

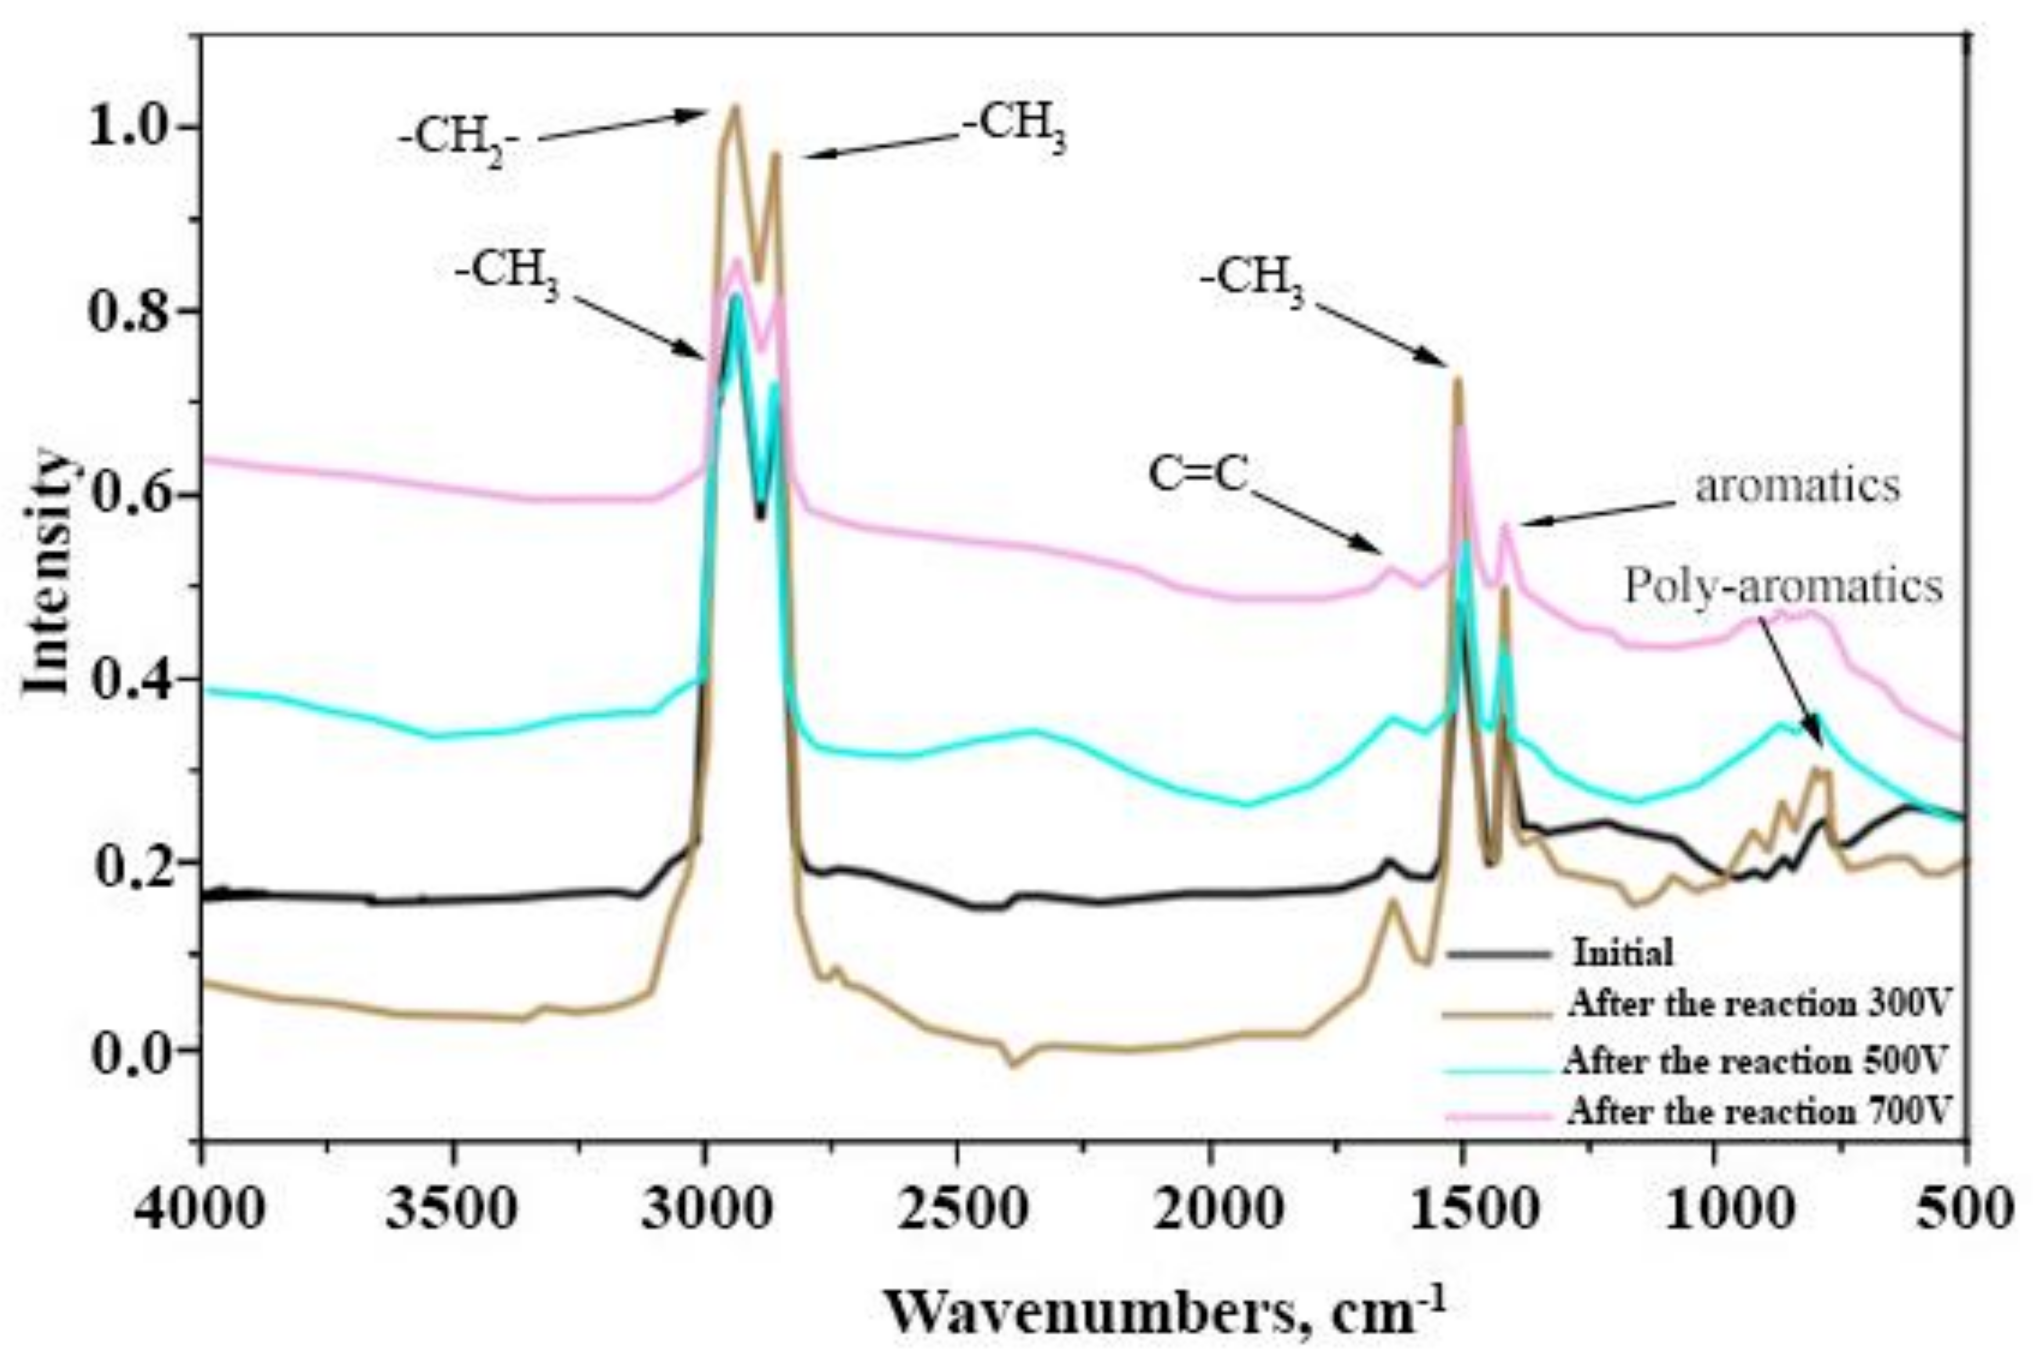
3.3. IR and NMR Spectroscopy of Still Bottoms of the NTP Pyrolysis of Fuel Oil

Figure 5 shows the IR spectra of fuel oil and still bottoms obtained from NTP pyrolysis of fuel oil. The FTIR analysis results (Figure 5) are in agreement with the 1H NMR analysis. The IR spectra revealed an increase in the content of aromatic (1380 cm−1) and polyaromatic hydrocarbons (737 cm−1), which may be attributed to the dealkylation of aromatic compounds [49,50]. The ratio of –CH3 and –CH2– groups in aliphatic hydrocarbons in the range of 2850–3970 cm−1 showed little to no change.
In the 1H NMR spectra, the signals observed in the ranges of 7.24–6.5, 8.3–7.3, and 9.0–8.3 ppm (Table 4) were assigned to monoaromatic CH bonds, diaromatic CH, and tri(and more) aromatic CH, respectively [51,52]. The results of NMR analysis showed that the plasma pyrolysis process affects both aliphatic and aromatic hydrocarbons (Table 4). As the fuel oil conversion increased from 28.3 to 49.0 wt%, the proportion of protons in aromatic hydrocarbons (Har) increased significantly compared to aliphatic hydrocarbons (Hal), leading to an increase in the FHA value from 0.0499 to 0.0697. This observation suggests that the alkyl hydrocarbon decomposition process intensified along with the ring condensation process at deeper stages of the NTP pyrolysis of fuel oil. The destruction of single-ring aromatic hydrocarbons (7.24–6.5 ppm) occurred initially, resulting in a decrease in their content from 2.55 to 2.18%. Conversely, triaromatic hydrocarbons (9.0–8.3 ppm) increased significantly from 0.19 to 0.57%, while diaromatic hydrocarbons (8.3–7.3 ppm) increased from 2.26 to 4.23%.
In the 13C NMR spectrum (Figure 6), the signals in the 115–155 ppm region correspond to aromatic carbon atoms, which belong mainly to condensed molecules. Signals of carbon atoms belonging to aliphatic fragments appear in the 5–60 ppm range.
The fraction of condensed aromatic molecules in the NTP pyrolysis cube residues increases with increasing stress (Table 5).
Signals 13C NMR in the 115–155 ppm range refer to aromatic carbon (Figure 7a). In the 13C NMR spectrum DEPT-135 (Figure 7b), the signals of aromatic hydrocarbons coupled with protons are presented, so there are no signals in the 135–155 ppm region related to condensed structures.
The NTP pyrolysis of fuel oil results in the formation of condensed aromatic rings, which significantly reduces the proportion of volatile components and increases the boiling point of the products (Figure 3). The excitation of condensed aromatic hydrocarbons requires more energy and results in a higher hydrogen yield [53], leading to increased energy costs for gas production (Table 2). However, the involvement of condensed aromatic hydrocarbons in the pyrolysis process can also result in coking. This occurs through a consecutive scheme involving a series of consolidation monomers and intermediates formed during condensation, polymerization, dehydrocyclization, binding of aromatic rings, and hydrogen depletion processes, ultimately leading to the formation of carbon structures [54]. These findings have implications for the optimization of the NTP pyrolysis process for the production of value-added products with reduced coking and energy costs.

3.4. Characteristics of Solid Products of the NTP Pyrolysis of Fuel Oil

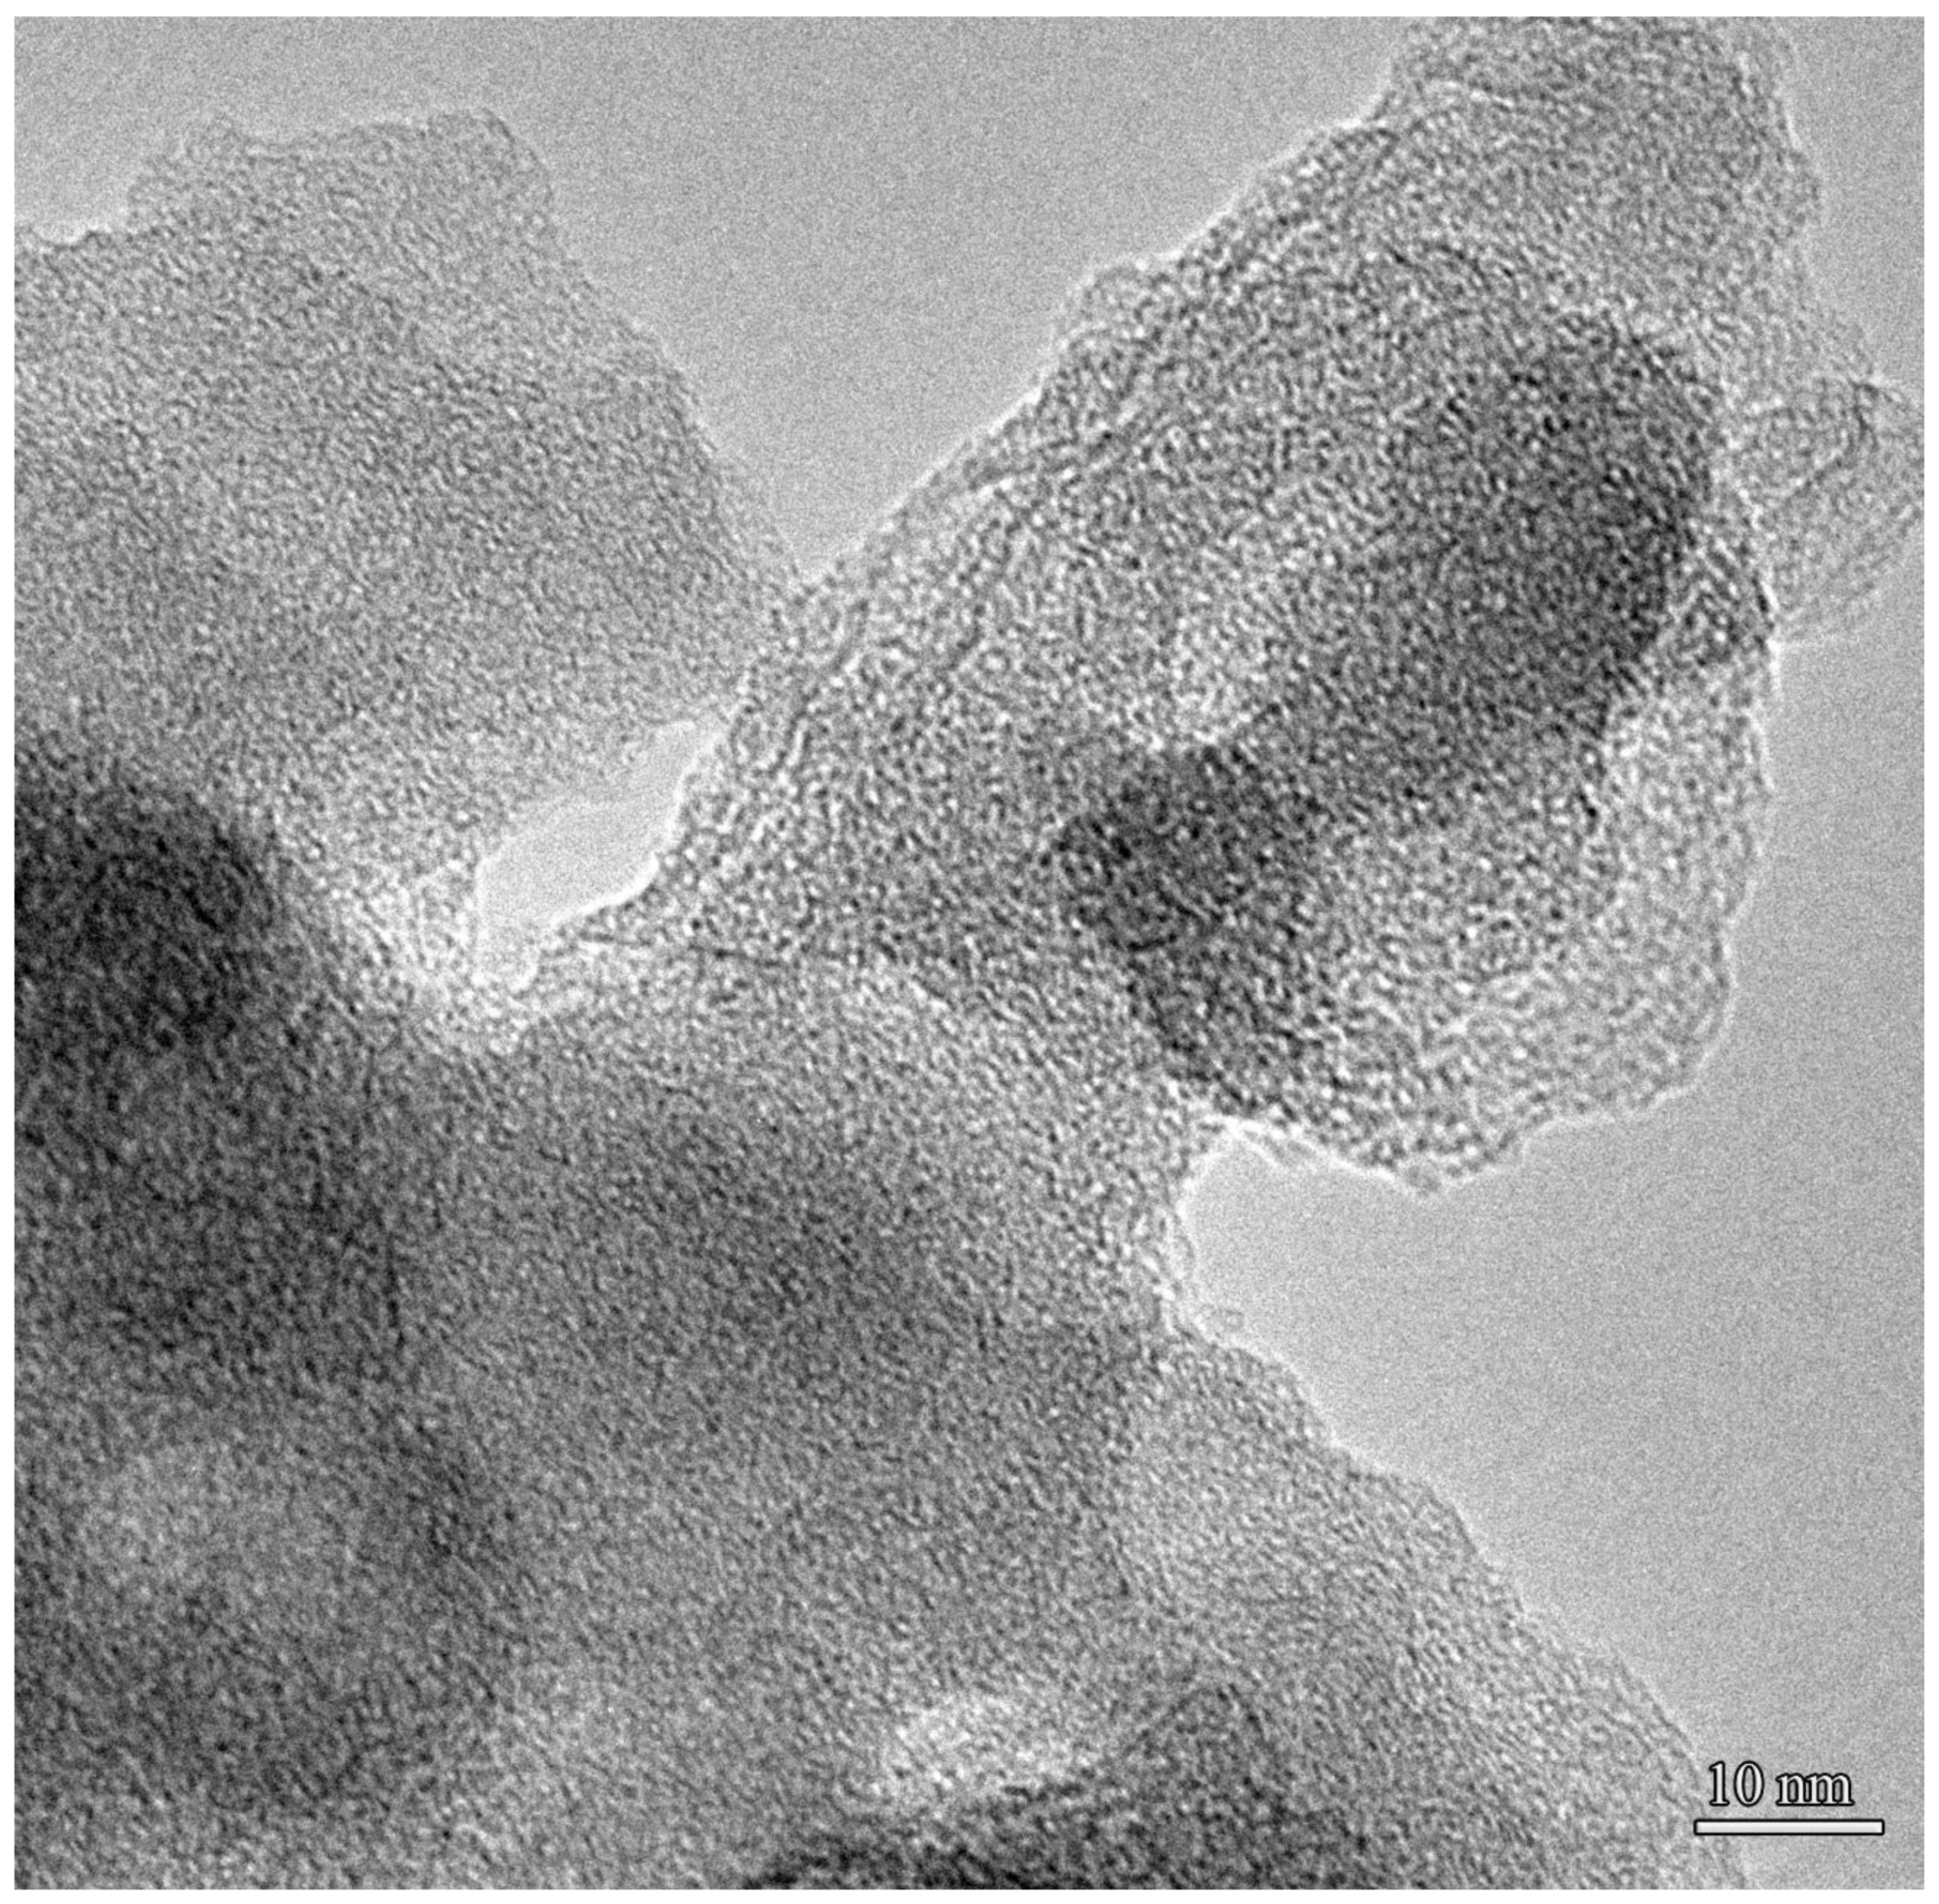
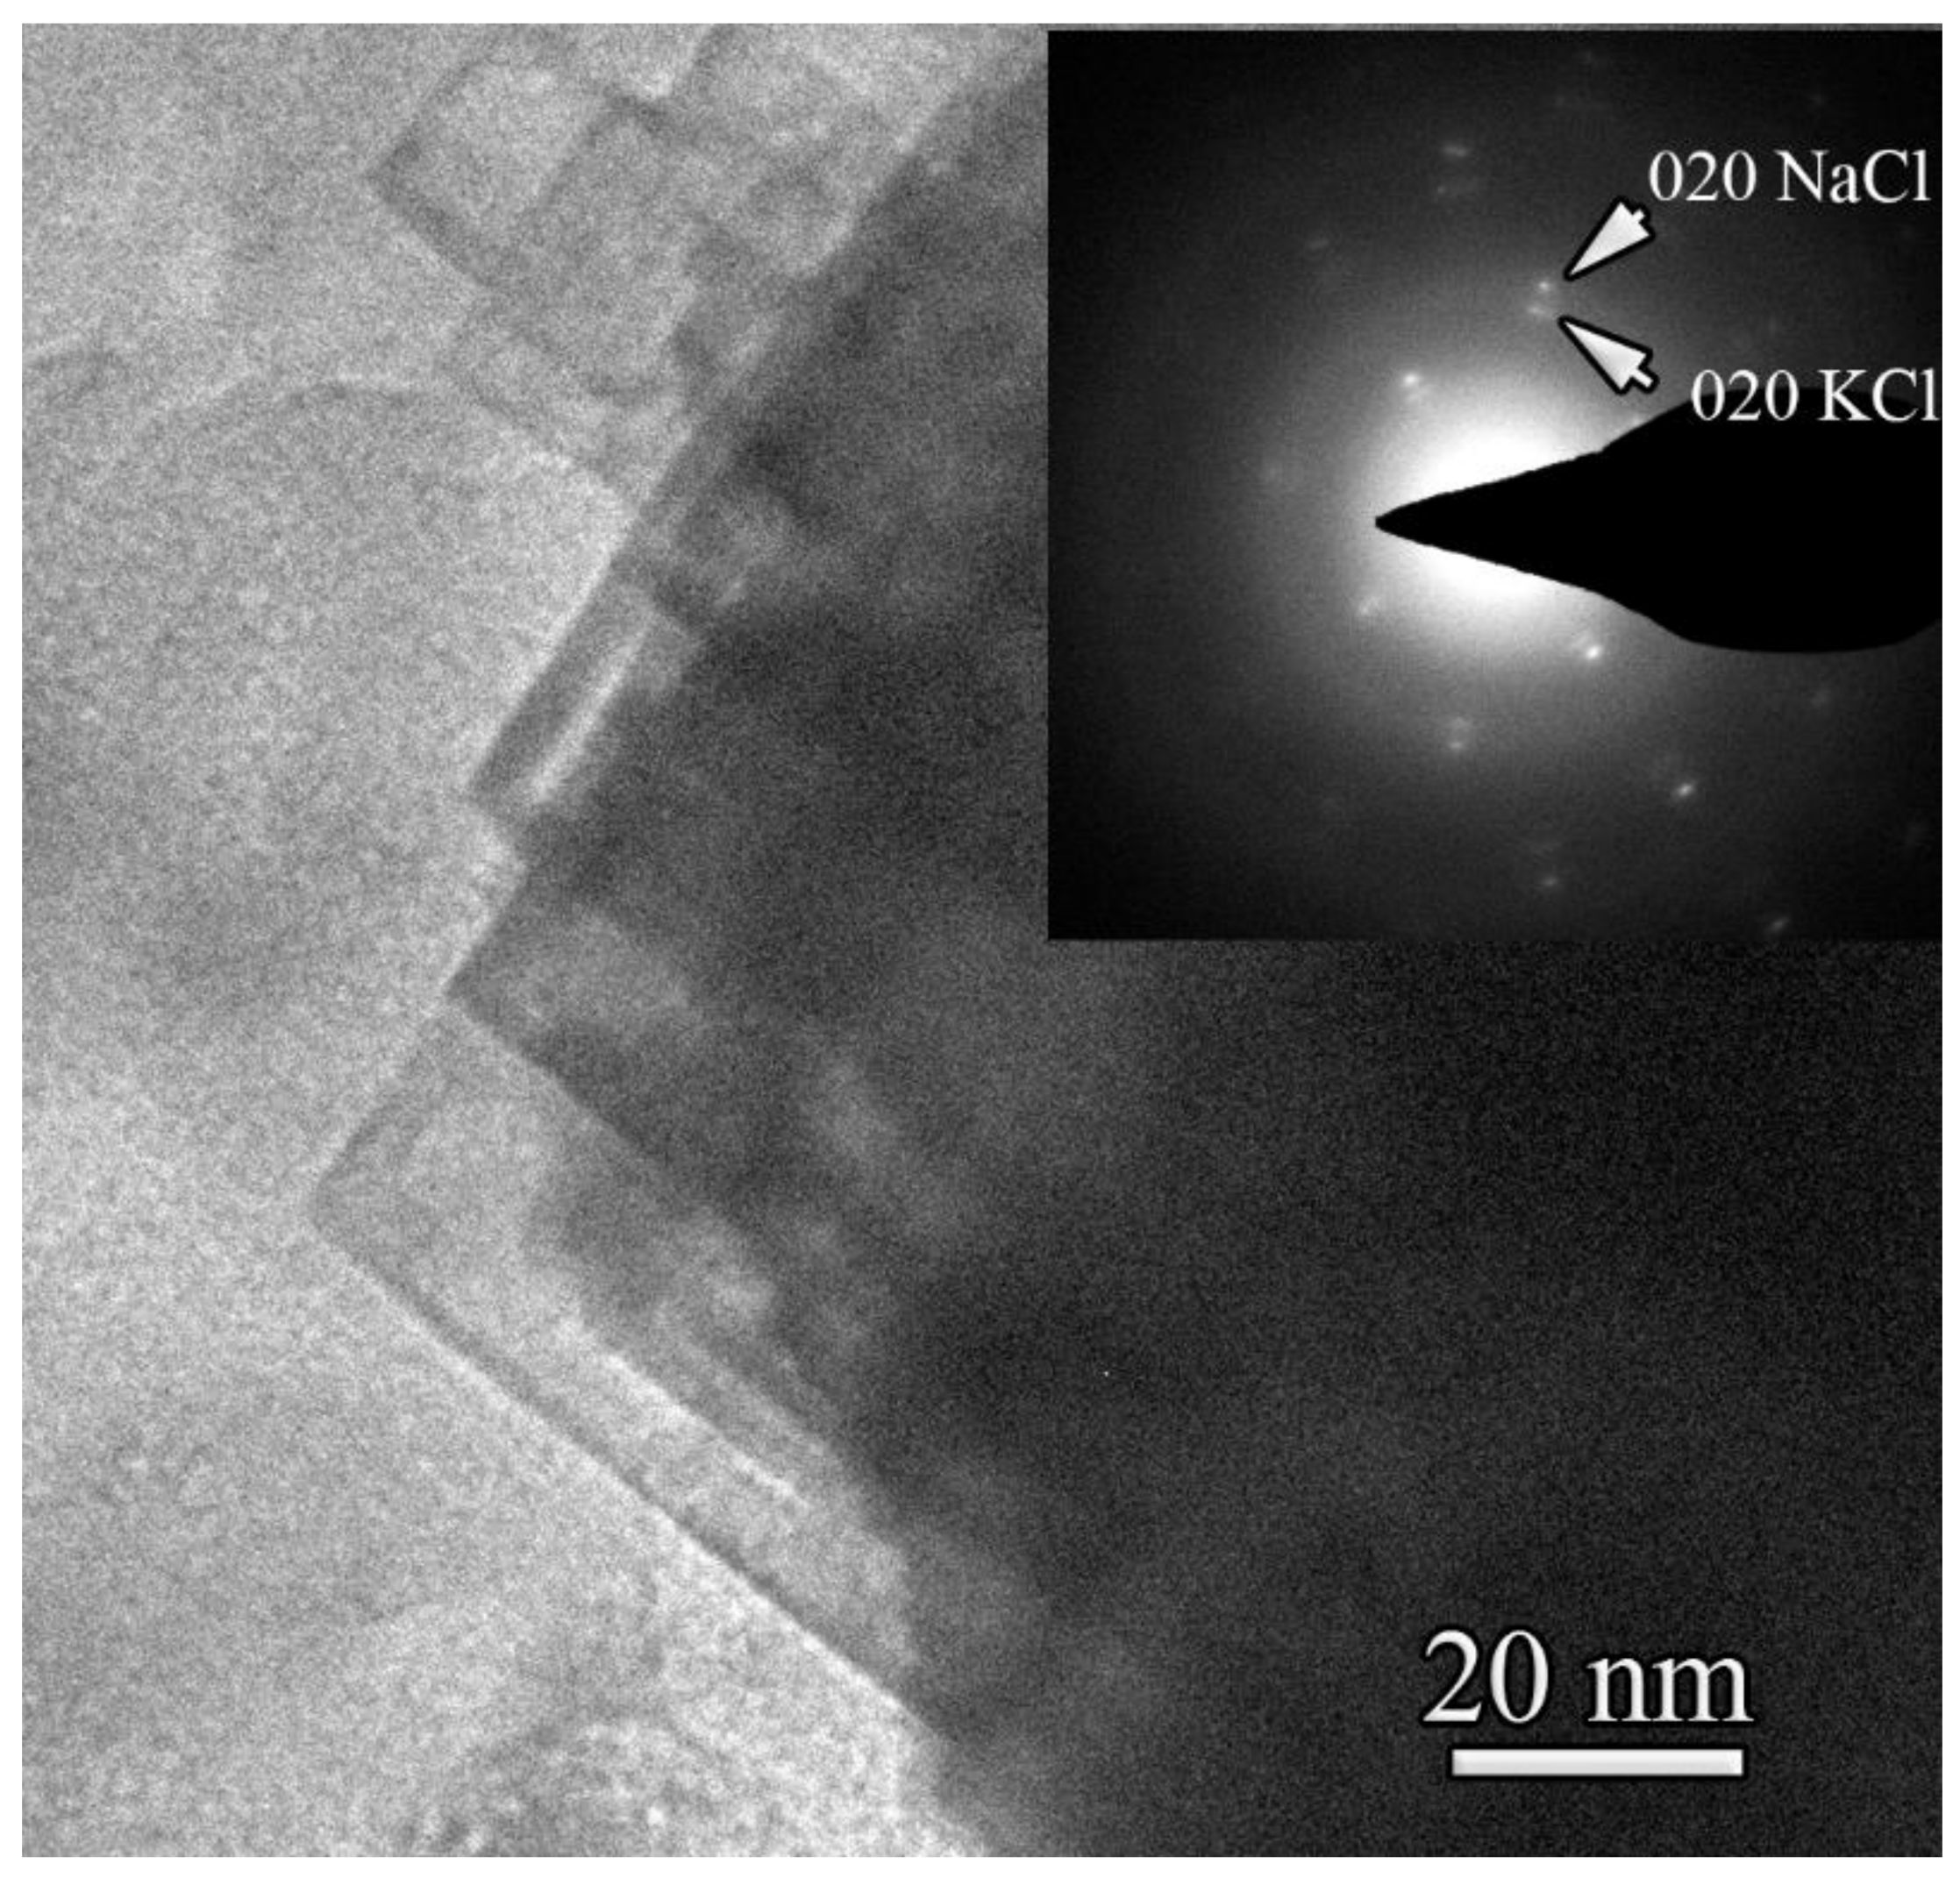
3.4.1. Transmission Electron Microscopy and Microanalysis

The solid products of the NTP pyrolysis of fuel oil are morphologically similar for the whole range of the power supply, namely 300–700 V. A typical low-magnification bright-field TEM image of a solid product of plasma-chemical pyrolysis of fuel oil at 700 V of demonstrates a particle conglomerate (Figure 8). The conglomerate consists of round-shape particles stacked together. The size of the particles ranges between one and tens of µm.
A selected-area electron diffraction (SAED) pattern of the solid product of NTP pyrolysis (obtained at 700 V DC) and the histogram of radially averaged SAED are shown in Figure 9a,b, respectively. The SAED and the histogram indicate the glassy and/or nanocrystalline nature of the solid product of fuel oil pyrolysis. Several diffuse rings and corresponding maxima on the histogram are close to the 002, 100/101, and 102/004 hexagonal graphite interplanar distances.
The presence of an amorphous/glassy phase was confirmed via HR TEM study of the particles in the conglomerates, and one example is presented in Figure 10. Close inspection of HR TEM images did not reveal any traces of atomic ordering.
However, particles of other types, namely, graphite flakes and multilayer carbon nanotubes (MCN), were also found in the solid product of fuel oil pyrolysis, and TEM images of an MCN are shown in Figure 11a–c. Interestingly, the thickness of the wall is not uniform: the left wall (Figure 11b) is at least twice as thick as the right one (Figure 11c). Inside the tube, there are carbon flakes (see Figure 11a).
The EDX microanalysis was performed on a sample of the solid product of fuel oil NTP pyrolysis. The EDXS spectra obtained from the group of particles (Figure 12) reveal the presence of C, S, O, Cl, Na, K, and traces of Ca and Fe.
After the inspection of the EDX spectra, elemental mapping was carried out, and the maps are shown in Figure 13. The maps demonstrate the uniform distribution of C, S, and O, and the compositional map confirms that Na and K form precipitates of NaCl and KCl.
The results of the quantitative EDX microanalysis of the elemental composition of the solid product obtained from the area marked in the compositional map (Figure 13) by a black square are presented in Table 6.
The high oxygen content (1.1–1.4 wt%) in the solid product may indicate the presence of oxidized asphaltenes, which can be used as economically advantageous catalysts [55,56].
In some conglomerates, the nanocrystals were observed to exhibit cubic morphology (Figure 14). Surprisingly, the SAED pattern (see Figure 14 inset), together with EDX mapping (not shown here), revealed the mixture of NaCl and KCl nanocrystals.
NaCl and KCl are used together with calcium compounds in drilling fluids. During oil rectification, these compounds are concentrated in fuel oil and then remain in solid products after pyrolysis.

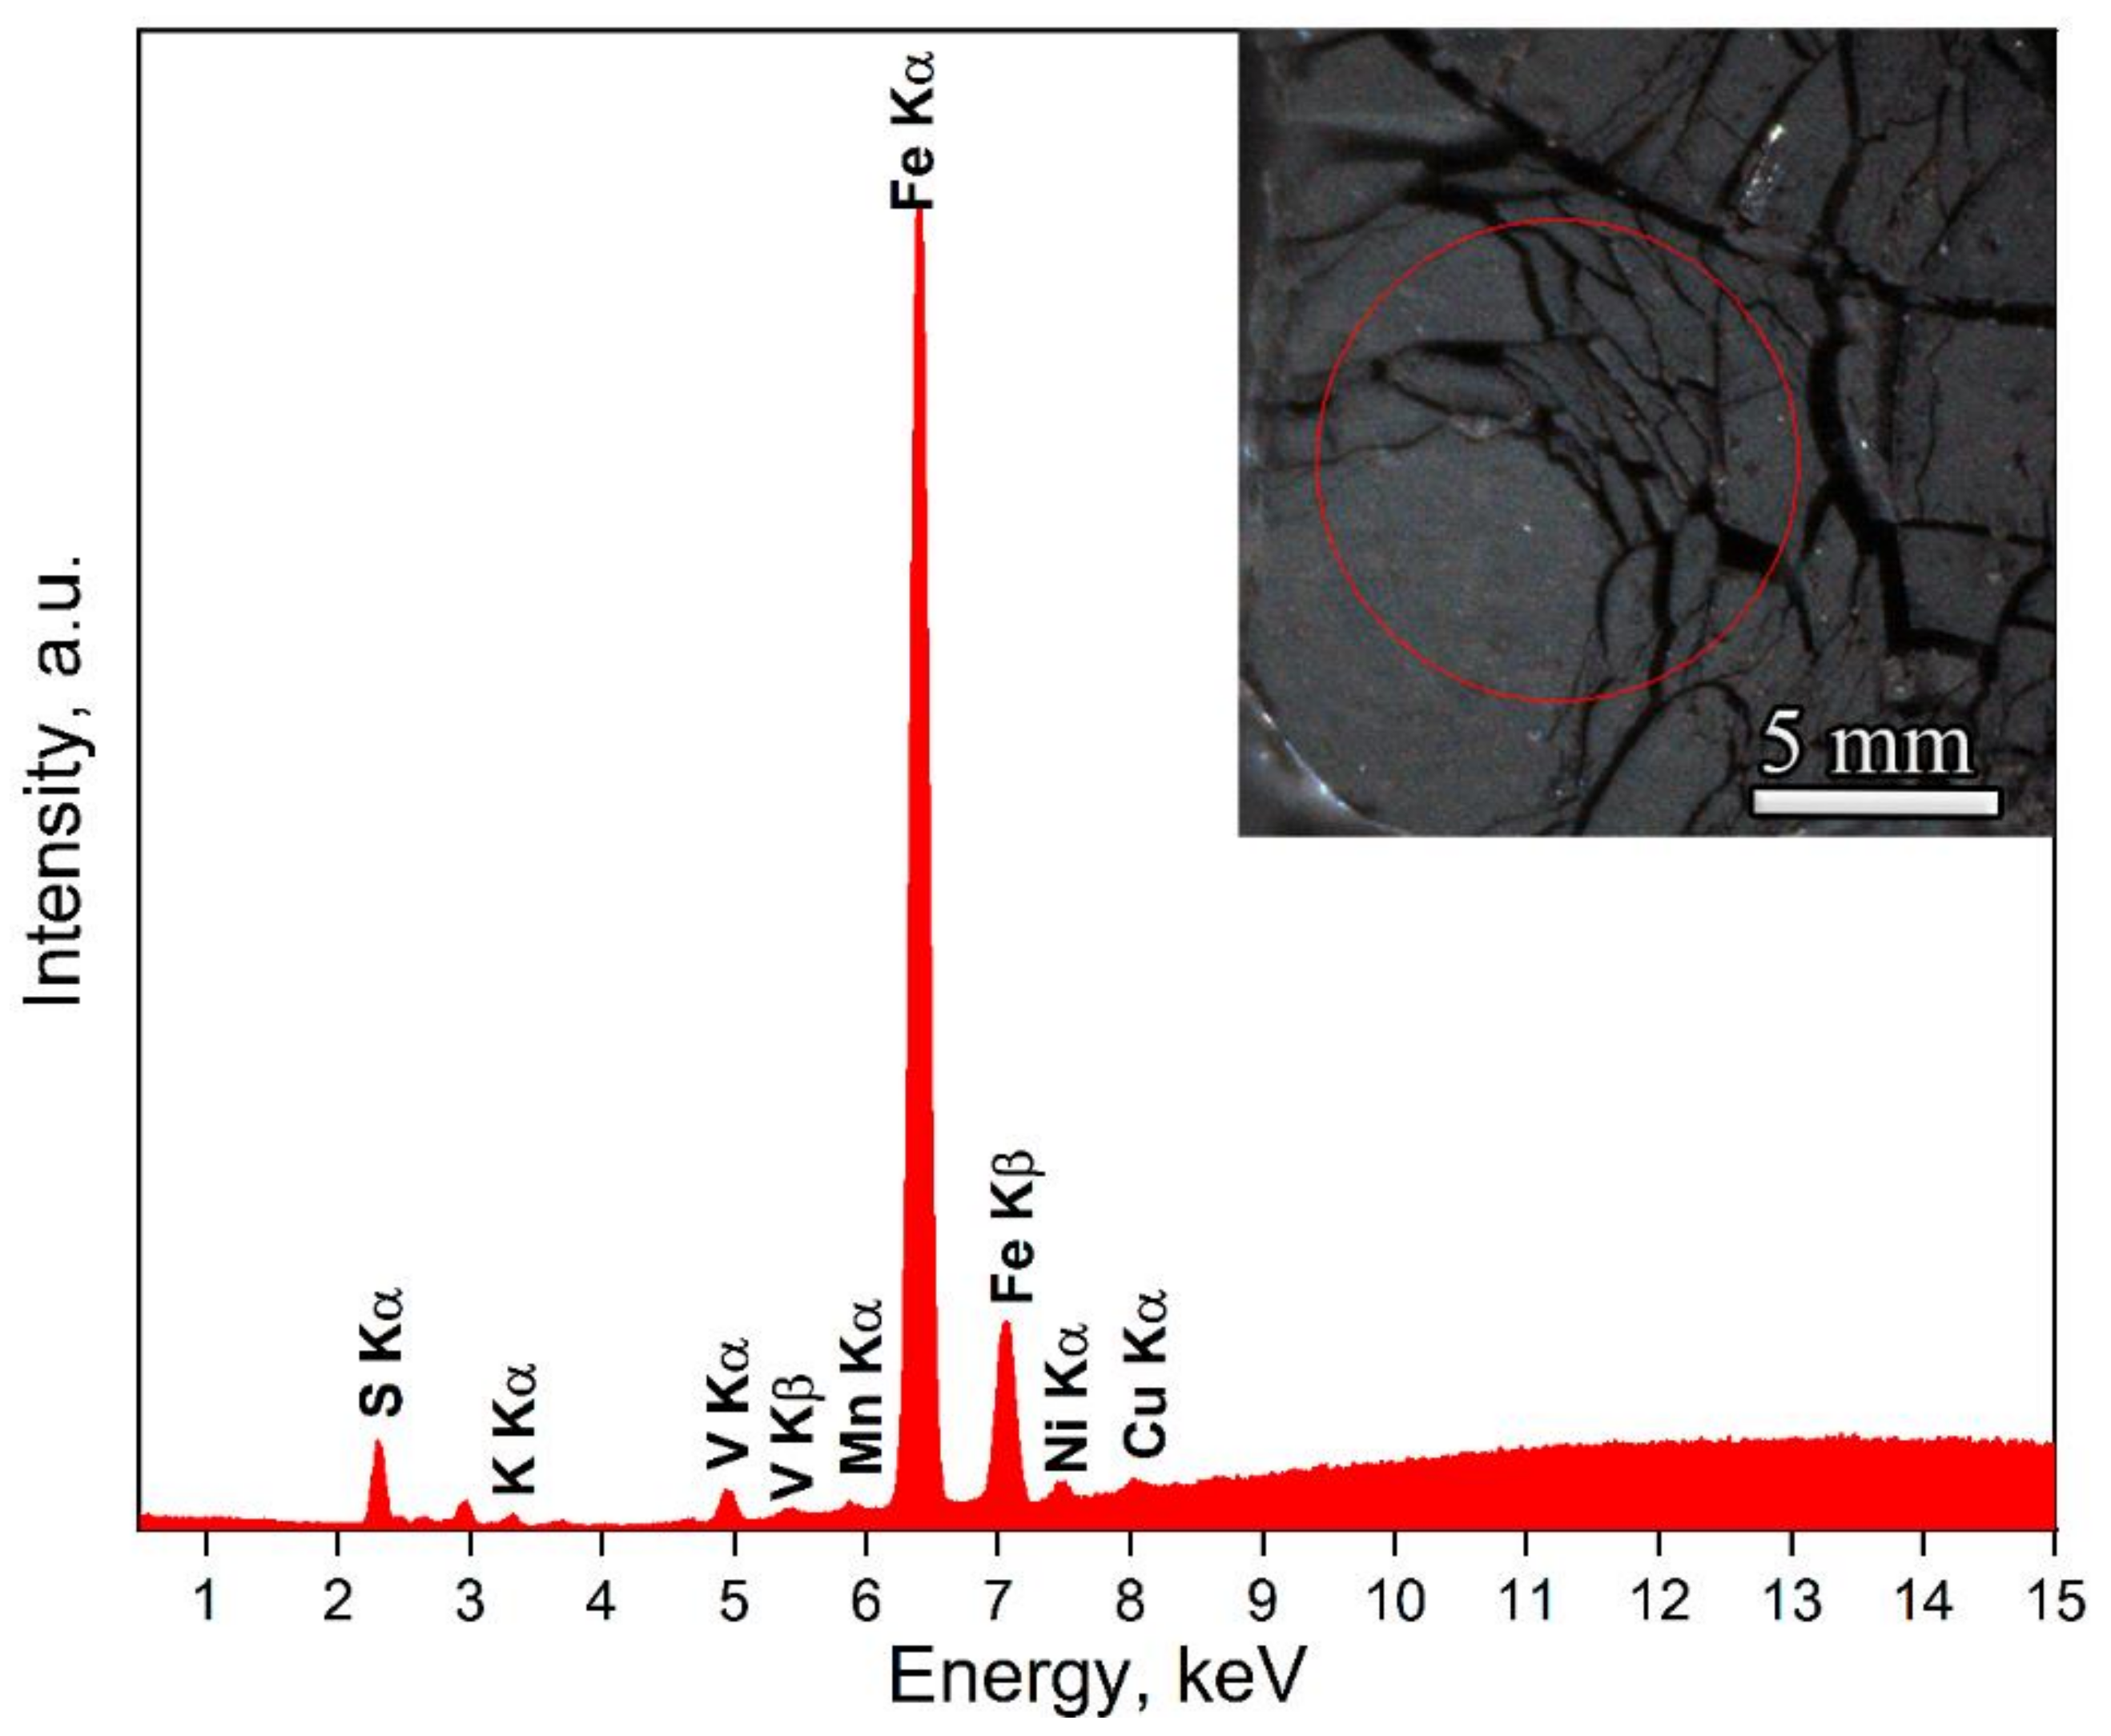
3.4.2. X-ray Fluorescence Analysis

The X-ray fluorescence analysis was performed from an area with a diameter of about 10 mm (see one example as the inset in Figure 15. This method allowed us to obtain composition information from a significantly larger sample volume compared to EDX microanalysis.
The X-ray fluorescence spectra are shown in Figure 15, and the quantitative results are presented in Table 7. These results were quite similar (within 5% accuracy) to other areas of the sample. The extremely high content of impurities in the solid product was due to the absence of C, O, and N in the spectra, which are not registered during X-ray fluorescence analysis. The high content of nickel and vanadium is associated with the concentration of the initial heavy oil [57].

3.4.3. X-ray Phase Analysis

A diffractogram of the solid product of the NTP pyrolysis of fuel oil at 700 V is shown in Figure 16. The peaks from the graphite (2H graphite Space Group #194 P63/mmc, a = 0.2464 nm, c = 0.6711 nm) [58] are marked by asterisks. There is a good match of the most intense peak, which corresponds to the 0002 reflection of the graphite (at 2θ = 26.382°), but there is a slight discrepancy between the experimental peak and the 0004 reflection of cited graphite. That discrepancy could be explained by the high density of defects in the material. The reflection marked by the cross at 2θ = 21.342° (see Figure 15) matches with sodium stearate’s (C18H35NaO2 PDF-2 00-001-0418) most intense peak. The estimation of the average size of graphite crystallites according to the Scherer formula for the 0002 main peak with a half-width of 0.2° corresponds to ~50 nm. At the same time, this character of the spectrum can be associated with the superposition of reflections from C5H10O2, C29H60 and C14H28 compounds as well as asphaltene [59,60] compounds.

3.4.4. Raman Spectroscopy

The Raman spectrum (Figure 17) of the solid product of the NTP pyrolysis of fuel oil at 700 V has broad peaks with the maximum positions at 1350–1360 cm−1 and 1580–1583 cm−1. Peaks with maxima around 1350 cm−1 are characteristic of disordered graphite and are denoted by the letter D (disordered).
Peaks with a maximum of 1580 cm−1 are denoted by the letter G (graphitic), and their location refers to the bond length in sp2-coordinated carbon [61]. The ratio of peak intensities, ID/IG, is directly related to the size of small (on the order of several nanometers) sp2-linked clusters of ordered aromatic rings in carbon films. The proportion of sp3 links is inversely proportional to the ID/IG ratio. The area of the G peak decreases as the sp3 bonds increase for samples 20–30 ID/IG~1.2. Thus, the Raman spectra indicate that the solid product samples are disordered graphite.

4. Conclusions

NTP pyrolysis of fuel oil was carried out via the application of electric discharge in the liquid phase at a voltage of 300–700 V at the DC source. Increasing the power of energy exposure leads to higher productivity, energy efficiency of the process, and gaseous product yields, and also affects the composition of the gaseous products of NTP pyrolysis. The gaseous products of the NTP pyrolysis of fuel oil include substances that are widely used in the chemical industry: hydrogen (46.5–50.0 mol%), acetylene (28.8–34.3 mol%), ethylene (7.6–8.6 mol%), methane (4.2–6.2 mol%), and hydrocarbons C3–C5.
NTP pyrolysis at a voltage of 500 V at the DC source is optimal because the energy consumption is the lowest (3.9 kWh/kg of fuel oil), yield of valuable gaseous products is the highest (46.5 wt%), and there is low methane content (4.2 mol%) and high acetylene content (30.4 mol%) in the gas flow (555.5 mL/min).
The pyrolysis process accumulates polyaromatic hydrocarbons, which are further transformed into carbon structures. The yield of solid-phase products is 53.5–70.1 wt%. The solid-phase products are disordered graphite and multilayer nanotubes. In the elemental composition of solid products, S, O, V, and Ni were determined, which indicates the possible use of these carbon structures as catalysts.
Further work will involve improving the energy efficiency of the process and studying carbon structures for commercial applications.

Author Contributions

E.Y.T.: Conceptualization, Methodology, Validation, Investigation, Writing—original Draft, Writing—review and Editing, Project administration, Funding acquisition; I.V.B.: Methodology, Writing—original Draft, Supervision, Writing—review and Editing; A.L.V.: Methodology, Investigation, Formal analysis, Writing—original Draft, Resources, Writing—review and Editing; Y.A.K.: Methodology, Formal analysis, Writing—review and Editing; A.G.I.: Investigation, Formal analysis; A.L.G.: Investigation, Formal analysis; D.A.S.: Validation, Investigation, Writing—original Draft; D.Y.T.: Software, Formal analysis, Data Curation, Writing—review and Editing; E.R.B.: Validation, Investigation. All authors have read and agreed to the published version of the manuscript.

Funding

This research was funded by the Russian Science Foundation, grant number 21-73-10119. https://rscf.ru/project/21-73-10119/ (accessed on 10 May 2023). The work was carried out using the equipment of the center for collective use «Analytical Center of the IOMC RAS» with the financial support of the grant «Ensuring the development of the material and technical infrastructure of the centers for collective use of scientific equipment» (Unique identifier RF—2296.61321X0017, Agreement Number 075-15-2021-670). In part of XRD, XRF analysis, and electron microscopy, the work was performed within the State Assignment of FSRC “Crystallography and Photonics” RAS using the equipment of the Shared Research Center FSRC “Crystallography and Photonics” RAS.

Data Availability Statement

Not applicable.

Conflicts of Interest

The funders had no role in the design of the study; in the collection, analyses, or interpretation of data; in the writing of the manuscript; or in the decision to publish the results.

References

  1. Li, J.; Li, M.; Zhang, Y.; Zhang, W.; Qiao, P. Research on the pyrolysis characteristics and kinetics of two typical inferior heavy oils. Fuel 2022, 328, 125330. [Google Scholar] [CrossRef]
  2. Ganapathi, R.; Henni, A.; Shirif, E. Solubility of carbon dioxide and ethane in Lloydminster heavy oil: Experimental study and modeling. Can. J. Chem. Eng. 2022, 100, 1235–1243. [Google Scholar] [CrossRef]
  3. Santos, R.G.; Loh, W.; Bannwart, A.C.; Trevisan, O.V. An overview of heavy oil properties and its recovery and transportation methods. Braz. J. Chem. Eng. 2014, 31, 571–590. [Google Scholar] [CrossRef]
  4. Houda, S.; Lancelot, C.; Blanchard, P.; Poinel, L.; Lamonier, C. Oxidative desulfurization of heavy oils with high sulfur content: A review. Catalysts 2018, 8, 344. [Google Scholar] [CrossRef]
  5. Al-Samhan, M.; Al-Fadhli, J.; Al-Otaibi, A.M.; Al-Attar, F.; Bouresli, R.; Rana, M.S. Prospects of refinery switching from conventional to integrated: An opportunity for sustainable investment in the petrochemical industry. Fuel 2022, 310, 122161. [Google Scholar] [CrossRef]
  6. Moud, A.A. Asphaltene induced changes in rheological properties: A review. Fuel 2022, 316, 123372. [Google Scholar] [CrossRef]
  7. Ampah, J.D.; Liu, X.; Sun, X.; Pan, X.; Xu, L.; Jin, C.; Sun, T.; Geng, G.; Afrane, S.; Liu, H. Study on characteristics of marine heavy fuel oil and low carbon alcohol blended fuels at different temperatures. Fuel 2022, 310, 122307. [Google Scholar] [CrossRef]
  8. Xia, Y.; Ma, C.; Ju, R.; Zhao, C.; Zheng, F.; Sun, X.; Li, Z.; Wang, C.; Shi, D.; Lin, X.; et al. Characterization of nitrogen-containing compounds in petroleum fractions by online reversed-phase liquid chromatography-electrospray ionization Orbitrap mass spectrometry. Fuel 2021, 284, 119035. [Google Scholar] [CrossRef]
  9. Gao, N.; Li, J.; Quan, C.; Tan, H. Product property and environmental risk assessment of heavy metals during pyrolysis of oily sludge with fly ash additive. Fuel 2020, 266, 117090. [Google Scholar] [CrossRef]
  10. Rana, M.S.; Ancheyta, J.; Maity, S.K.; Marroquin, G. Comparison between refinery processes for heavy oil upgrading: A future fuel demand. Int. J. Oil Gas Coal Technol. 2008, 1, 250–282. [Google Scholar] [CrossRef]
  11. Bello, S.S.; Wang, C.; Zhang, M.; Gao, H.; Han, Z.; Shi, L.; Su, F.; Xu, G. A review on the reaction mechanism of hydrodesulfurization and hydrodenitrogenation in heavy oil upgrading. Energy Fuels 2021, 35, 10998–11016. [Google Scholar] [CrossRef]
  12. Prajapati, R.; Kohli, K.; Maity, S.K. Slurry phase hydrocracking of heavy oil and residue to produce lighter fuels: An experimental review. Fuel 2021, 288, 119686. [Google Scholar] [CrossRef]
  13. Tirado, A.; Yuan, C.; Varfolomeev, M.A.; Ancheyta, J. Kinetic modeling of aquathermolysis for upgrading of heavy oils. Fuel 2022, 310, 122286. [Google Scholar] [CrossRef]
  14. Yaqoob, H.; Teoh, Y.H.; Sher, F.; Jamil, M.A.; Murtaza, D.; Al Qubeissi, M.; UI Hassan, M.; Mujtaba, M.A. Current Status and Potential of Tire Pyrolysis Oil Production as an Alternative Fuel in Developing Countries. Sustainability 2021, 13, 3214. [Google Scholar] [CrossRef]
  15. Fairuzov, D.; Gerzeliev, I.; Maximov, A.; Naranov, E. Catalytic dehydrogenation of ethane: A mini-review of recent advances and perspective of chemical looping technology. Catalysts 2021, 11, 833. [Google Scholar] [CrossRef]
  16. Dolganov, I.; Bunaev, A.; Dolganova, I. Unsteady-state mathematical modeling of hydrocarbon feedstock pyrolysis. Processes 2020, 8, 1394. [Google Scholar] [CrossRef]
  17. Honegger, M.; Burns, W.; Morrow, D.R. Is carbon dioxide removal ‘mitigation of climate change’? Rev. Eur. Comp. Int. Environ. Law 2021, 30, 327–335. [Google Scholar] [CrossRef]
  18. Wéry, F.; Geerts, M.; Vandewalle, L.A.; Reyniers, P.A.; Heynderickx, G.J.; Marin, G.B.; Van Geem, K.M. Assessing the CO2 emission reduction potential of steam cracking furnace innovations via computational fluid dynamics: From high-emissivity coatings, over coil modifications to firing control. Chem. Eng. Res. Des. 2023, 190, 129–142. [Google Scholar] [CrossRef]
  19. Rajabloo, T.; De Ceuninck, W.; Van Wortswinkel, L.; Rezakazemi, M.; Aminabhavi, T. Environmental management of industrial decarbonization with focus on chemical sectors: A review. J. Environ. Manag. 2022, 302, 114055. [Google Scholar] [CrossRef]
  20. Hao, H.; Wu, B.S.; Yang, J.; Guo, Q.; Yang, Y.; Li, Y.W. Non-thermal plasma enhanced heavy oil upgrading. Fuel 2015, 149, 162–173. [Google Scholar] [CrossRef]
  21. Rathore, K.; Bhuiyan, S.I.; Slavens, S.M.; Staack, D. Microplasma ball reactor for JP-8 liquid hydrocarbon conversion to lighter fuels. Fuel 2021, 285, 118943. [Google Scholar] [CrossRef]
  22. Khosravi, A.; Khani, M.R.; Goy, E.D.; Shokri, B. The processing of pyrolysis fuel oil by dielectric barrier discharge plasma torch. Plasma Chem. Plasma Process. 2018, 38, 365–378. [Google Scholar] [CrossRef]
  23. Delikonstantis, E.; Cameli, F.; Scapinello, M.; Rosa, V.; Van Geem, K.M.; Stefanidis, G.D. Low-carbon footprint chemical manufacturing using plasma technology. Curr. Opin. Chem. Eng. 2022, 38, 100857. [Google Scholar] [CrossRef]
  24. Bruggeman, P.J.; Kushner, M.J.; Locke, B.R.; Gardeniers, J.G.E.; Graham, W.G.; Graves, D.B.; Hofman-Caris, R.C.H.M.; Maric, D.; Reid, J.P.; Ceriani, E. Plasma-liquid interactions: A review and roadmap. Plasma Sources Sci. Technol. 2016, 25, 053002. [Google Scholar] [CrossRef]
  25. Huang, W.; Jin, J.; Wen, G.; Yang, Q.; Su, B.; Ren, Q. Effect of nitrogen/oxygen substances on the pyrolysis of alkane-rich gases to acetylene by thermal plasma. Energies 2018, 11, 351. [Google Scholar] [CrossRef]
  26. Bilera, I.V.; Lebedev, Y.A. Plasma-chemical production of acetylene from hydrocarbons: History and current status (a review). Pet. Chem. 2022, 62, 329–351. [Google Scholar] [CrossRef]
  27. Shao, T.; Wang, R.; Zhang, C.; Yan, P. Atmospheric-pressure pulsed discharges and plasmas: Mechanism, characteristics, and applications. High Volt. 2018, 3, 14–20. [Google Scholar] [CrossRef]
  28. Lebedev, Y.A.; Krashevskaya, G.V.; Batukaev, T.S.; Mikhaylyuk, A.V. Time-resolved study of ignition of microwave discharge in liquid hydrocarbons. Plasma Process. Polym. 2022, 19, 2100215. [Google Scholar] [CrossRef]
  29. Matsui, Y.; Kawakami, S.; Takashima, K.; Katsura, S.; Mizuno, A. Liquid-phase fuel re-forming at room temperature using nonthermal plasma. Energy Fuels 2005, 19, 1561. [Google Scholar] [CrossRef]
  30. Bodrikov, I.V.; Kut’in, A.M.; Titov, E.Y.; Titov, D.Y.; Kurskii, Y.A.; Gazizullin, R.R. Fragmentation of thiophene and 3-methyl-2-thiophenecarboxaldehyde by direct liquid phase low-voltage discharges. Plasma Process. Polym. 2018, 15, 1800094. [Google Scholar] [CrossRef]
  31. Bodrikov, I.V.; Ivanova, A.G.; Vasiliev, A.L.; Titov, E.Y.; Titov, D.Y.; Serov, A.I. Influence of low-voltage discharge energy on the morphology of carbon nanostructures in induced benzene transformation. RSC Adv. 2021, 11, 39428–39437. [Google Scholar] [CrossRef] [PubMed]
  32. Delikonstantis, E.; Scapinello, M.; Stefanidis, G.D. Process modeling and evaluation of plasma-assisted ethylene production from methane. Processes 2019, 7, 68. [Google Scholar] [CrossRef]
  33. Rabinovich, A.; Nirenberg, G.; Kocagoz, S.; Surace, M.; Sales, C.; Fridman, A. Scaling up of non-thermal gliding arc plasma systems for industrial applications. Plasma Chem. Plasma Process. 2022, 42, 35–50. [Google Scholar] [CrossRef]
  34. Mehta, P.; Barboun, P.; Go, D.B.; Hicks, J.C.; Schneider, W.F. Catalysis enabled by plasma activation of strong chemical bonds: A review. ACS Energy Lett. 2019, 4, 1115–1133. [Google Scholar] [CrossRef]
  35. Das, A.; Peu, S.D. A Comprehensive Review on Recent Advancements in Thermochemical Processes for Clean Hydrogen Production to Decarbonize the Energy Sector. Sustainability 2022, 14, 11206. [Google Scholar] [CrossRef]
  36. Park, D.K.; Kim, J.-H.; Kim, H.-S.; Kim, J.-H.; Ryu, J.-H. Possibility Study in CO2 Free Hydrogen Production Using Dodecane (C12H26) from Plasma Reaction. Energies 2023, 16, 1589. [Google Scholar] [CrossRef]
  37. Barkhordari, A.; Mirzaei, S.I.; Falahat, A.; Krawczyk, D.A.; Rodero, A. Experimental Study of a Rotating Electrode Plasma Reactor for Hydrogen Production from Liquid Petroleum Gas Conversion. Appl. Sci. 2022, 12, 4045. [Google Scholar] [CrossRef]
  38. Korányi, T.I.; Németh, M.; Beck, A.; Horváth, A. Recent Advances in Methane Pyrolysis: Turquoise Hydrogen with Solid Carbon Production. Energies 2022, 15, 6342. [Google Scholar] [CrossRef]
  39. Stryczewska, H.D.; Boiko, O. Applications of Plasma Produced with Electrical Discharges in Gases for Agriculture and Biomedicine. Appl. Sci. 2022, 12, 4405. [Google Scholar] [CrossRef]
  40. Ali, M.; Cheng, Y.; Li, Y.; An, H.; Jin, Y. Direct conversion of poor-quality residual oil to light gases in electricity-driven thermal plasma reactor. Can. J. Chem. Eng. 2023, 101, 137. [Google Scholar] [CrossRef]
  41. Oost, G.V. Applications of Thermal Plasmas for the Environment. Appl. Sci. 2022, 12, 7185. [Google Scholar] [CrossRef]
  42. Barkhordari, A.; Karimian, S.; Rodero, A.; Krawczyk, D.A.; Mirzaei, S.I.; Falahat, A. Carbon Dioxide Decomposition by a Parallel-Plate Plasma Reactor: Experiments and 2-D Modelling. Appl. Sci. 2021, 11, 10047. [Google Scholar] [CrossRef]
  43. Kaufmann, S.J.; Rößner, P.; Renninger, S.; Lambarth, M.; Raab, M.; Stein, J.; Seithümmer, V.; Birke, K.P. Techno-Economic Potential of Plasma-Based CO2 Splitting in Power-to-Liquid Plants. Appl. Sci. 2023, 13, 4839. [Google Scholar] [CrossRef]
  44. Titov, E.Y.; Bodrikov, I.V.; Serov, A.I.; Kurskii, Y.A.; Titov, D.Y.; Bodrikova, E.R. Liquid-phase non-thermal plasma discharge for fuel oil processing. Energies 2022, 15, 3400. [Google Scholar] [CrossRef]
  45. Bodrikov, I.; Titov, E.Y.; Vasiliev, A.; Titov, D.; Ivanova, A.; Subbotin, A. Nonthermal plasma in the induction of polycondensation processes and intermolecular dehydrochlorination of chloroethanes in the liquid phase. Plasma Process. Polym. 2022, 19, 2200008. [Google Scholar] [CrossRef]
  46. Titov, E.Y.; Titov, D.Y.; Bodrikov, I.V.; Kut’in, A.M.; Kurskii, Y.A.; Gazizzulin, R.R. A device for generation of low-voltage discharges in liquid dielectric media. High Energy Chem. 2018, 52, 512–513. [Google Scholar] [CrossRef]
  47. Titov, E.; Bodrikov, I.; Titov, D. Control of the energy impact of electric discharges in a liquid phase. Energies 2023, 16, 1683. [Google Scholar] [CrossRef]
  48. Sanchez-Minero, F.; Ancheytab, J.; Silva-Olivera, G.; Flores-Vallec, S. Predicting SARA composition of crude oil by means of NMR. Fuel 2012, 110, 318–321. [Google Scholar] [CrossRef]
  49. Rakhmatullin, I.Z.; Efimov, S.V.; Tyurin, V.A.; Al-Muntaser, A.A.; Klimovitskii, A.E.; Varfolomeev, M.A.; Klochkov, V.V. Application of high-resolution NMR (1H and 13C) and FTIR spectroscopy for characterization of light and heavy crude oils. J. Pet. Sci. Eng. 2018, 168, 256–262. [Google Scholar] [CrossRef]
  50. Djimasbe, R.; Varfolomeev, M.A.; Al-Muntaser, A.A.; Yuan, C.; Feoktistov, D.A.; Suwaid, M.A.; Kirgizov, A.J.; Davletshin, R.R.; Zinnatullin, A.L.; Fatou, S.D.; et al. Oil-dispersed nickel-based catalyst for catalytic upgrading of heavy oil using supercritical water. Fuel 2022, 313, 122702. [Google Scholar] [CrossRef]
  51. Cao, Y.B.; Zhang, L.L.; Xia, D.H. Catalytic aquathermolysis of Shengli heavy crude oil with an amphiphilic cobalt catalyst. Pet. Sci. 2016, 13, 463–475. [Google Scholar] [CrossRef]
  52. Chen, M.; Li, C.; Li, G.R.; Chen, Y.L.; Zhou, C.G. In situ preparation of well-dispersed CuO nanocatalysts in heavy oil for catalytic aquathermolysis. Pet. Sci. 2019, 16, 439–446. [Google Scholar] [CrossRef]
  53. Chen, Q.; Yin, M.; Zhang, L.; Liu, H.; Qin, Z.; Wang, Z. Hydrogen-donated thermal upgrading of Venezuela extra-heavy oil: Identifying the role of hydrogen donor. Pet. Sci. Technol. 2020, 38, 550–555. [Google Scholar] [CrossRef]
  54. Chesnokov, V.V.; Chichkan, A.S. Effect of catalysts on tar carbonization. Catal. Today 2021, 379, 28–35. [Google Scholar] [CrossRef]
  55. Jung, H.; Bielawski, C.W. Asphaltene oxide promotes a broad range of synthetic transformations. Commun. Chem. 2019, 2, 113. [Google Scholar] [CrossRef]
  56. Petrova, Y.Y.; Frantsina, E.V.; Grin’ko, A.A.; Pak, A.Y.; Arkachenkova, V.V.; Povalyaev, P.V. Investigation of the process and products of plasma treatment of asphaltenes. Mater. Today Commun. 2022, 33, 104669. [Google Scholar] [CrossRef]
  57. Yakubov, M.R.; Milordov, D.V.; Yakubova, S.G.; Borisov, D.N.; Ivanov, V.T.; Sinyashin, K.O. Concentrations of vanadium and nickel and their ratio in heavy oil asphaltenes. Pet. Chem. 2016, 56, 16–20. [Google Scholar] [CrossRef]
  58. Trucano, P.; Chen, R. Structure of graphite by neutrondifraction. Nature 1975, 258, 136. [Google Scholar] [CrossRef]
  59. Alhreez, M.; Wen, D. Molecular structure characterization of asphaltene in the presence of inhibitors with nanoemulsions. RSC Adv. 2019, 34, 19560. [Google Scholar] [CrossRef]
  60. Induchoodan, G.; Jansson, H.; Swenson, J. Influence of graphene oxide on asphaltene nanoaggregates. Colloids Surf. A Physicochem. Eng. Asp. 2021, 630, 127614. [Google Scholar] [CrossRef]
  61. Ferrari, A.C.; Robertson, J. Interpretation of Raman spectra of disordered and amorphous carbon. Phys. Rev. B 2000, 61, 14095. [Google Scholar] [CrossRef]
Figure 1. Installation diagram. DC VS—direct current voltage source; VS—voltage sensor; CS—current sensor; T—trap; M—manometer; V—valve; VT—insulated-gate bipolar transistor; MCS—microprocessor control system.
Energies 16 04017 g001
Figure 2. Oscillograms of pulses at 300 V (a), 500 V (b), and 700 V (c).
Energies 16 04017 g002
Figure 3. Fractional composition of fuel oil (1) and NTP pyrolysis products at 300 V (2), 500 V (3), 700 V (4).
Energies 16 04017 g003
Figure 4. Photos of still bottoms (ac) and solid products (df) of plasma-chemical pyrolysis of fuel oil at 300, 500, and 700 V, respectively.
Energies 16 04017 g004aEnergies 16 04017 g004b
Figure 5. IR spectra of fuel oil and still bottoms after NTP pyrolysis at 300–700 V.
Energies 16 04017 g005
Figure 6. NMR 13C spectrum of the NTP pyrolysis residue of fuel oil at 300 V.
Energies 16 04017 g006
Figure 7. NMR 13C spectrum of the still bottoms of NTP pyrolysis of fuel oil at 300 V. Region of aromatic groups (a) and only CH-carbons of aromatic groups (b).
Energies 16 04017 g007
Figure 8. Bright-field TEM image of a solid product.
Energies 16 04017 g008
Figure 9. SAED of the solid product of NTP pyrolysis (a) and the histogram of radially averaged SAED (b).
Energies 16 04017 g009
Figure 10. HR TEM image of stuck-together amorphous/glassy particles.
Energies 16 04017 g010
Figure 11. TEM images of an MCN: low-magnification image—(a), carbon flakes inside the wall are arrowed. The HR TEM images of the “left” wall—(b), and the “right” wall—(c).
Energies 16 04017 g011
Figure 12. The EDX spectra from the group of particles.
Energies 16 04017 g012
Figure 13. Dark-field HAADF STEM image; elemental maps of C, S, O, Cl, Na; and compositional map. The scale bar is 3 µm on all maps. The Cu grid is visible in the right upper corner. The EDX microanalysis spectrum quantification was performed from the area marked by a black square in the compositional map.
Energies 16 04017 g013
Figure 14. TEM images of NaCl/KCl nanocrystals.
Energies 16 04017 g014
Figure 15. X-ray fluorescence analysis areas—optical images. X-ray fluorescence spectra of the corresponding areas.
Energies 16 04017 g015
Figure 16. X-ray diffractogram of the solid product of fuel oil pyrolysis. Asterisks indicate the hexagonal graphite reflections and the cross indicates Sodium stearate.
Energies 16 04017 g016
Figure 17. Raman spectrum of the solid product of fuel oil pyrolysis at 700 V.
Energies 16 04017 g017
Table 1. Characteristics of electric discharges during plasma-chemical pyrolysis of fuel oil.
Voltage, V300500700
Average pulse duration, ms2.31.82.1
Average pulse frequency, Hz53.343.540.2
Average pulse amplitude, A41.464.675.4
Average pulse energy, J1.52.44.6
Table 2. Characteristics of NTP pyrolysis of fuel oil and composition of gaseous products at 300–700 V.
Voltage, V300500700
Experiment time, min440150114
Conversion rate, wt%28.349.046.2
Gas yield, wt%29.946.541.1
Solid product yield, wt%70.153.558.9
Energy consumption, kWh/kg of fuel oil11.93.94.8
Energy consumption, kWh/kg of gas39.78.311.7
Gas flow, mL/min7.3555.2709.9
H246.548.450.0
CH44.84.26.2
C2H47.67.88.3
C2H60.30.40.4
C2H234.330.427.8
C3H81.92.42.1
C3H41.01.00.9
1,3-C4H60.70.91.0
C4H100.50.50.8
C5H122.03.22.1
C6+0.40.80.4
Table 3. Characteristics of fuel oil and still bottoms of NTP pyrolysis of fuel oil.
Fuel OilStill Bottom
Voltage, V 300500700
Density at 20 °C, g/cm30.9550.968--
Kinematic viscosity at 100 °C, mm2/s31.169448.26--
Solid structures content, wt%-21.6633.933.6
Sulfur content, %2.6752.7132.8362.630
Non-volatile residue, %30.656.455.756.3
Initial boiling point, °C298.5297.2289.9269.3
End-boiling point, °C671.3649.1659.3673.4
Evaporated, %69.443.644.343.7
Table 4. 1H NMR analysis of fuel oil before pyrolysis and NTP pyrolysis still bottoms *.
Range
NMR
9.0–8.3 ppm8.3–7.3 ppm7.24–6.5 ppm4.4–2.4 ppm2.4–2.1 ppm2.1–1.05 ppm1.05–0.3 ppmFHA
Voltage, V Har, %Hal, %
-0.192.262.557.852.7862.8321.550.0499
3000.353.032.098.342.7162.0321.440.0548
5000.574.232.189.772.7460.0820.440.0697
7000.443.572.188.572.7261.2521.680.0613
* Product solutions in CDCl3 filtered through a membrane filter.
Table 5. NMR 13C analysis of fuel oil before pyrolysis and NTP pyrolysis cube residues *.
Range
NMR
132–155 ppm115–132 ppm5–60 ppmFCA
Voltage, V Car, %Cal, %
-3.277.1289.610.1039
3004.649.2986.080.1392
5004.9816.1478.880.2112
7005.668.6785.670.1433
* Product solutions in CDCl3 filtered through a membrane filter.
Table 6. Elemental composition of the solid product of the NTP pyrolysis of fuel oil.
Elementwt%at%Error, in wt% (3 Sigma)
Carbon83.5938.74
Sulfur2.410.58
Potassium8.131.20
Calcium0.1<10.22
Chlorine3.010.66
Sodium1.710.46
Oxygen1.210.43
Total100100
Table 7. Results of the X-ray fluorescence analysis of areas.
Elementwt%at%
S5971
K22
V11
Mn<1<1
Fe3725
Ni0.5<1
Cu<1<1
Disclaimer/Publisher’s Note: The statements, opinions and data contained in all publications are solely those of the individual author(s) and contributor(s) and not of MDPI and/or the editor(s). MDPI and/or the editor(s) disclaim responsibility for any injury to people or property resulting from any ideas, methods, instructions or products referred to in the content.

