Article

Sizing of Hybrid Power Systems for Off-Grid Applications Using Airborne Wind Energy

Faculty of Aerospace Engineering, Delft University of Technology, 2629 HS Delft, The Netherlands
*
Author to whom correspondence should be addressed.
Energies 2023, 16(10), 4036; https://doi.org/10.3390/en16104036
Submission received: 31 January 2023 / Revised: 19 April 2023 / Accepted: 8 May 2023 / Published: 11 May 2023
(This article belongs to the Special Issue Airborne Wind Energy Systems)

Abstract

:
The majority of remote locations not connected to the main electricity grid rely on diesel generators to provide electrical power. High fuel transportation costs and significant carbon emissions have motivated the development and installation of hybrid power systems using renewable energy such these locations. Because wind and solar energy is intermittent, such sources are usually combined with energy storage for a more stable power supply. This paper presents a modelling and sizing framework for off-grid hybrid power systems using airborne wind energy, solar PV, batteries and diesel generators. The framework is based on hourly time-series data of wind resources from the ERA5 reanalysis dataset and solar resources from the National Solar Radiation Database maintained by NREL. The load data also include hourly time series generated using a combination of modelled and real-life data from the ENTSO-E platform maintained by the European Network of Transmission System Operators for Electricity. The backbone of the framework is a strategy for the sizing of hybrid power system components, which aims to minimise the levelised cost of electricity. A soft-wing ground-generation-based AWE system was modelled based on the specifications provided by Kitepower B.V. The power curve was computed by optimising the operation of the system using a quasi-steady model. The solar PV modules, battery systems and diesel generator models were based on the specifications from publicly available off-the-shelf solutions. The source code of the framework in the MATLAB environment was made available through a GitHub repository. For the representation of results, a hypothetical case study of an off-grid military training camp located in Marseille, France, was described. The results show that significant reductions in the cost of electricity were possible by shifting from purely diesel-based electricity generation to an hybrid power system comprising airborne wind energy, solar PV, batteries and diesel.

1. Introduction

An hybrid power system (HPS) combines two or more often renewable energy sources with or without energy storage. The concept is not new and has primarily been investigated for combinations of wind and solar power [1,2,3]. This combination is particularly suitable because of the general complementary nature of wind speeds and solar irradiance on daily and seasonal time scales [4]. This complementarity can be used for a more secure and stable power supply than stand-alone wind or solar power systems. To manage the intermittency of wind and solar resources, an HPS often includes an energy storage solution [5,6]. By sharing infrastructure, siting, permitting and installation costs, an HPS can be economically more attractive than stand-alone wind and solar solutions. An important target market for renewable-energy-based HPS is remote off-grid locations, where most of the electricity is still provided by diesel generators, which are expensive to operate and responsible for extensive carbon emissions.
Airborne wind energy (AWE) is an emerging technology using tethered flying devices to harness high-altitude wind resources [7]. These systems can operate at variable heights, enabling increased access to better wind resources, since wind speeds generally (not always) increase and become more stable with height [8]. AWE systems use less material and do not require heavy steel towers and massive foundations like conventional wind turbines. Remote locations are generally less accessible than conventional sites, resulting in high transportation and installation costs. Additionally, use cases such as military training camps, mining sites, refugee camps etc., require a temporary power supply and therefore require solutions with easier installation and decommissioning processes. The power demand for such use cases is less than a few megawatts and is mainly supplied by diesel and solar PV systems. The portability of AWE systems and access to higher altitudes can enable the inclusion of wind energy in the mix for such applications.
The objective of this paper is to develop a modelling and sizing framework for HPSs using AWE for remote off-grid applications. A schematic representation of the investigated HPS architecture is shown in Figure 1. The considered components are AWE systems, solar photovoltaic (PV) panels, diesel generators and rechargeable batteries. A controller optimises the dispatch of electricity based on wind, solar and demand forecasts. The solid red lines represent power transmission cables, and the dotted black lines represent communication channels.
The use of AWE within an HPS has been considered by the scientific community, institutions and companies [10,11,12,13,14]. A detailed system design study for off-grid applications was first explored in [15] to determine the optimal capacity of the energy storage solution. With a more futuristic aim, a feasibility study regarding the use of AWE in combination with solar PV to power a Mars habitat was presented in [16,17]. The present paper is based on the graduation project of the first author [18]. The methodology was formulated by combining the knowledge from the abovementioned literature and the identified gaps. The aim was to develop a design framework for effective sizing of all the components of an HPS to minimise the cost of electricity.
The paper is structured as follows. Section 2 explains the HPS modelling and sizing framework. Section 3 presents an off-grid HPS sizing case study in Marseille, France, and Section 4 discusses the conclusions of this study.

2. Modelling Framework

Figure 2 shows a flow chart of the developed framework for the modelling and sizing of a hybrid power system (HPS). The framework has six independent modules of solar PV, AWE, demand, battery, diesel and the system optimiser, which are coupled. Solar PV and AWE are considered the primary energy sources, whereas the battery system and the diesel generator are the secondary components of the HPS. The primary function of the framework is to appropriately size the HPS components with the objective of minimising the cost of electricity while supplying the demand at all times. The framework functions in two stages in every iteration, as depicted by the dashed lines. The first stage consists of varying the number of solar PV modules and the AWE systems. In the second stage, the battery and diesel generators are appropriately sized based on the chosen number of solar PV modules and AWE systems. These iterations are repeated in the input design space to search for the optimal HPS configuration.
The framework can also be used to evaluate different scenarios, such as removing one or more energy sources, limiting the use of diesel, etc. The source code of the framework developed in the MATLAB environment can be found in [19]. Each of the following subsections discusses the respective individual modules of the framework.

2.1. Solar Panel Performance, Generated Energy and Costs

The solar irradiance components used to determine the solar power production profile are the global horizontal irradiance (GHI), the direct normal irradiance (DNI) and the diffuse horizontal irradiance (DHI). Moreover, other meteorological data such as the wind speed at the height of the surface of the solar modules and the ambient temperature were also used to determine more realistic production profiles. Reanalysis data with an hourly resolution were retrieved for multiple years from the National Solar Radiation Database maintained by NREL [20]. The downloaded hourly data for the DHI, DNI and GHI were converted into the direct, diffuse and reflected irradiance components used to calculate the energy production profile of one solar module, as derived in [21].
The direct irradiance on the solar module at a specific hour ( G M dif ) is calculated as
G M dir ( i ) = D N I ( i ) cos ( A O I ( i ) ) S F ,
where i is the hour index of the time-series data, for which the DNI is multiplied by the cosine of the angle of incidence ( A O I ) and the shading factor ( S F ). The diffuse irradiance ( G M dif ) is calculated as
G M dif ( i ) = D H I ( i ) S V F ,
where the DHI is multiplied by the sky view factor ( S V F ), which is dependent on the tilt angle of the module. To keep the model simple and to make sure that the HPS can be placed in any location and orientation, it was decided to mount the solar modules flat on the ground surface, resulting in a zero tilt angle. In this way, no special consideration regarding the azimuth is necessary, and the reflected irradiance vanishes. If it were to be decided to tilt the modules, the reflected irradiance component would be calculated as follows
G M ground ( i ) = G H I ( 1 S V F ) α ,
where the albedo is given as α . The total irradiance on the solar module is calculated as the sum of the three individual components
G M ( i ) = G M dir ( i ) + G M dif ( i ) + G M ground ( i ) .
Both the temperature and the irradiance levels have an effect on the power output of the solar module. Depending on the chosen module type, these effects are more present in the overall outcome of the produced power. Moreover, the system’s energy production is also subject to degradation of the modules, cabling losses and module mismatch. Considering all these effects, the hourly produced energy of the system is estimated as follows
E Solar ( i ) = η sys A M G M ( i ) η M ( i ) ,
where the system’s efficiency is given by η sys , which is multiplied by the module’s surface area ( A M ), the total irradiance ( G M ) and the module’s efficiency ( η M ).
The costs incurred during the project lifetime are divided into capital expenditure (CAPEX) and operational expenditure (OPEX),
C Solar ( t ) = CAPEX ( t ) + OPEX ( t ) ,
where t is the year index in the project lifetime. CAPEX is the initial investment cost required for the project and is associated with buying and installing the solar energy system. OPEX is the recurring costs incurred during the operation time, which comprises the maintenance and replacement costs of the components.

2.2. AWE System Performance, Generated Energy and Costs

The wind resource data were taken from the ERA5 dataset [22]. The European Centre for Medium-Range Weather Forecasts (ECMWF) developed this reanalysis dataset by combining actual measurements with complex weather forecasting models. Because of its high quality and worldwide coverage, the dataset has developed into an important standard for wind energy resource modelling [23]. The dataset has already been used successfully to characterise wind resources for performance estimation of AWE systems [8,24,25,26]. For the present study, an annual average operational height of the AWE system was assumed, for which the corresponding hourly time-series dataset of the wind speed was downloaded.
A similar approach as with the solar PV system was used to calculate the energy and cost profiles of the AWE system. The main technology-specific data used in this study are the power curve of the system, capital costs, and operation and maintenance costs. The power curve ( P ( u ) ) quantifies the functional relation between the wind speed (u) at average operational height and the extractable power (P). The power time series can be computed from the wind speed time series as ( P ( u ( i ) ) ), where i is the hour index. Because of the hourly resolution of the wind speed data and because energy is commonly measured in kilowatt or megawatt hours, the energy time series is identical to the power time series.
E AWE ( i ) [ kWh ] = P ( u ( i ) ) [ kW ] × 1 [ h ] .
As for the solar energy cost calculation, the costs are divided into CAPEX and OPEX. CAPEX comprises the costs for the ground station and kite control unit, as well as the costs for the first kite and tether. The lifetime of these two components, both made of high-performance plastic materials, is substantially lower than the typical project lifetime of 25 years. This means that in addition to the maintenance costs, OPEX includes the costs of regular replacement of the kite and the tether. Although this increases the OPEX component in the total costs, the advantage in this case is that due to the lower capital costs of these components, the total costs are more spread out over the project’s lifetime.

2.3. Demand- and Case-Specific Parameters

Location and case-specific inputs to the framework include parameters such as demand data, project lifetime, discount rate, diesel costs, etc. It would be ideal to be able to use a demand dataset that represents the actual load. However, such a dataset is not always available for academic research. The demand data used in this framework are modelled by combining real-life and theoretical load data so as to simulate a generic dataset. The real-life data were retrieved from ENTSO-E [27], which is a platform responsible for the collection and publication of data related to the European electricity market. The theoretical demand data were modelled using a location-dependent model described in [28]. To generate more representative and generic load data for the off-grid location, the mathematical mean of the two datasets was calculated as
D ( i ) = 1 2 D real-life ( i ) + D theoretical ( i ) .
The mathematical mean of the two datasets is a valid representation only in the case of a sufficient positive correlation between the datasets. This ensures that the temporal nature of the demand curve is preserved, which can also be checked by evaluating the correlation of the generated dataset with the two original datasets individually.

2.4. Battery Capacity and Costs

The battery system stores the energy when there is a surplus and provides it when there is a shortage. The electricity generation by the primary energy sources for each hour is the sum of the AWE and PV generation for that particular hour. The difference between generation and demand is denoted as a mismatch. If the mismatch is positive, the surplus electricity is stored in the batteries, and if the mismatch is negative, the stored electricity is supplied back by the batteries. The primary energy sources and the battery system must be sized adequately to meet the demand at all times. This was achieved using the input wind, solar and demand time-series data. Rechargeable batteries usually have a requirement for a minimum and maximum state of charge for a better lifetime. Therefore, the battery capacity should be within the given range at all times. The evolution of the battery capacity over time is described as
C a p a c i t y ( i + 1 ) = C a p a c i t y ( i ) + M i s m a t c h ( i ) η round-trip ,
where i is the hour index, and η round-trip is the round-trip efficiency of the battery. Equation (9) was used to size the battery according to the requirements.
The mismatch can be negative on a seasonal scale with a higher energy demand than supply for extended periods of time. Since the batteries are dimensioned to cover the load at all times, they have a low utilisation factor, which implies higher costs. Moreover, by oversizing the generating components of the HPS to also cover peak loads, the cost of electricity is also increased, since power has to be curtailed during non-peak hours. Sizing the HPS to supply the complete load means that the capacity factor of the system is low and that the cost of electricity is high.
The cost can be reduced significantly by allowing a certain percentage of peak load to be lost and covered by other means. This implies that the most extreme/expensive periods, for example, the top 5%, are omitted, thereby reducing the sizing requirement of the system. This is also known as peak shaving. In addition to the power and energy rating, the cycle life and lifetime of the battery are the specifications that drive the costs of the battery system.

2.5. Diesel Generator Capacity and Costs

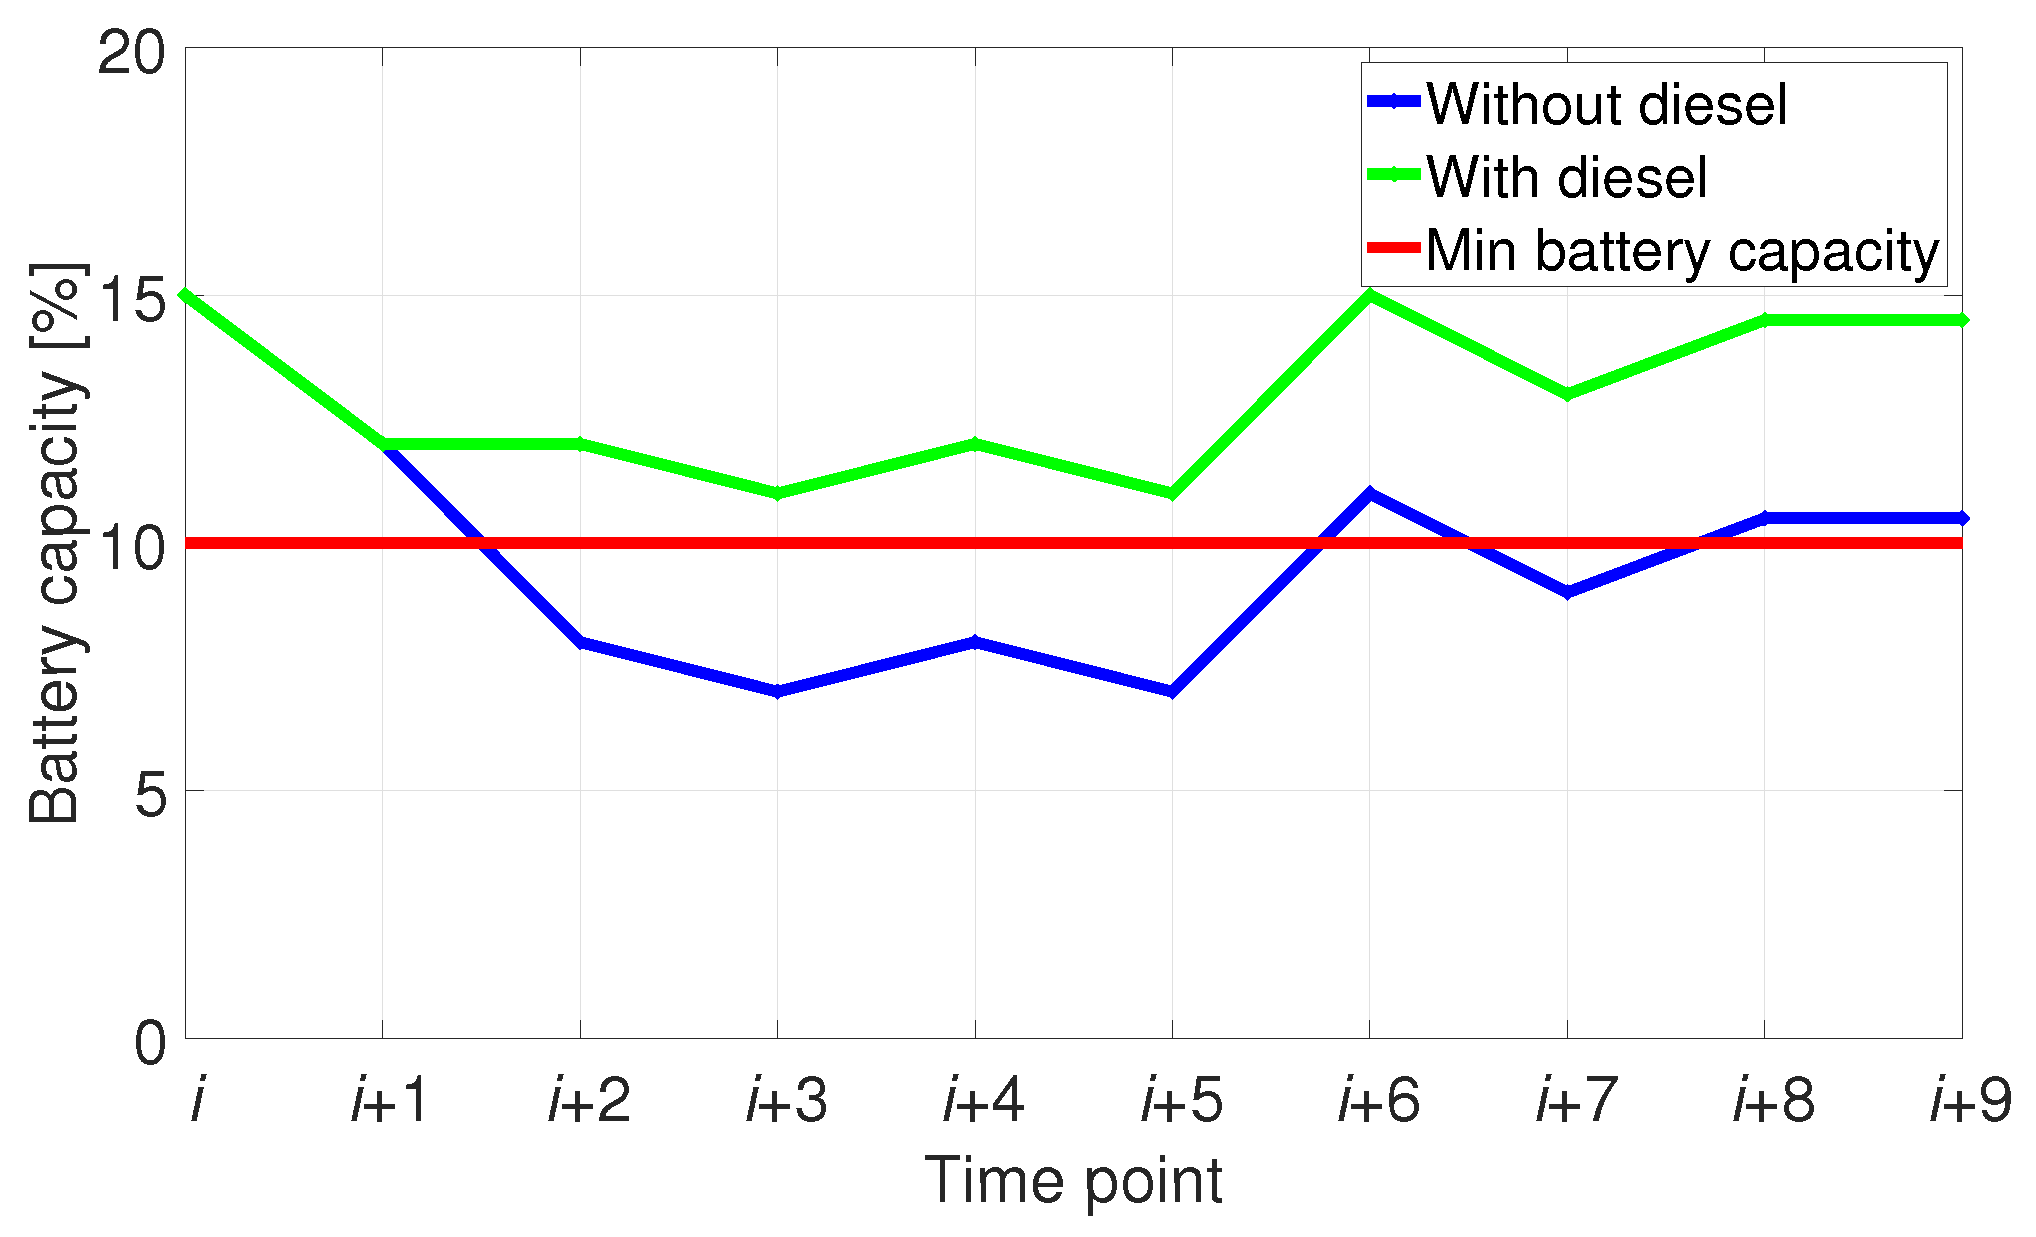
In an off-grid scenario, the demand has to be covered at all times. With both generation methods relying on intermittent natural resources, this would require the HPS to be substantially oversized. The sizing of the battery is driven by the extreme events of high demands, with the majority of the capacity being underutilized for the rest of the time period. This oversizing also leads to curtailment of power during time periods with low demand but high levels of wind and solar resources. To limit or even avoid oversizing, a diesel generator could be integrated as a secondary energy source to help cover the extreme periods. The tradeoff between a diesel generator and battery system can be used to determine the optimum sizes of these two subsystems. Within the optimisation loop for the battery sizing, we set a certain threshold for the permissible loss of load that needs to be covered by the integrated diesel generator. Figure 3 shows an example of the battery capacity evolving over time with and without the integrated diesel generator. Without diesel generation and allowing a certain loss of load, some of the time points are below the minimal capacity of the battery. Therefore, they cannot be supplied by the system. The introduction of diesel in this scenario does not mean that the diesel generator has to deliver electricity for all the time instances when the capacity drops below the minimum capacity. The diesel generator is only used to keep the battery capacity at a constant level. In this scenario, the diesel generator kicks in only for the time i + 2 to offset the capacity above the threshold. At the following times, the electricity can again be delivered by the battery, which would not have been possible without the short activation of the diesel generator. This means that the full load can be supplied by the HPS by introducing diesel capacity, which is below the allowable loss of load in the case without diesel.
Similar to the power rating of the battery, the power rating of the diesel generator was determined by the largest amount of power that needs to be delivered, which is equal to the greatest difference between the renewable electricity supply and demand for the times the diesel generators are used. This power rating defines the diesel generator size.
The CAPEX of a diesel generator is its purchase price. In contrast to renewable energy sources, these generators need to be provided with fuel. The fuel costs, as well as the fuel transportation costs, are considered in the OPEX. For a diesel generator to produce one kWh of electricity, about 0.4 litres of diesel is used [29,30]. Moreover, around 2.6 kg CO2 is emitted into the atmosphere by burning 1 litre of diesel. In Europe, the projected carbon tax in 2030 is 0.125 €/kg [31] and was therefore also considered in the OPEX.

2.6. System Optimiser

The function of the system optimiser is to optimally size the components of the HPS concerning a specified design objective. The sizing of the components depends on the available resources at the location, the performance characteristics of the chosen technologies and the cost assumptions behind them. All these factors are captured in an economic metric denoted as the levelised cost of electricity (LCoE) [32], which is one of the most commonly used design metrics within the industry and is calculated as follows
LCoE HPS = t = 1 T C AWE ( t ) + C PV ( t ) + C Batt ( t ) + C Diesel ( t ) ( 1 + r ) t t = 1 T E AWE ( t ) + E PV ( t ) + E Diesel ( t ) ( 1 + r ) t .
The numerator is the summation of the yearly (t) initial investment costs and the operation and maintenance costs for the entire project lifetime ( T ) for every technology. The denominator is the summation of the energy production by every technology, and r is the discount rate.
The goal of the optimiser is to find the optimal configuration of the HPS for a given location that yields the lowest LCoE. To find the optimal configuration, different combinations within predefined boundaries are tested. The number of AWE systems, the number of solar PV modules and the percentage of (peak) load generated by the diesel generators are varied with specified increments. The optimiser calculates the LCoE for all configurations and selects the configuration that yields the lowest LCoE.
The objective of the system optimiser could also be set to explore specific configurations of the HPS. One of the objectives could be that the system is optimally sized, excluding diesel generators, making it 100% renewable. Moreover, to explore the functionality of just solar or wind energy for specific locations, one can be excluded completely. By altering the optimiser constraints, business-case-specific requirements can be input to the optimization loop of the HPS.

3. Results and Discussion

In this section, a hypothetical case study is evaluated using the developed framework. Section 3.1 describes the case study and the input data, and Section 3.2 discusses the results.

3.1. Case Study Description

A hypothetical off-grid military training camp in Marseille, France, was defined as a case study. The location choice is based on a preliminary resource assessment of multiple European locations. This location has a combination of strong wind speeds and high solar irradiance levels, with sufficient anticorrelation between the resources. A training camp was selected to describe a hypothetical scenario to model the demand and is not linked to the choice of location. The analysis was conducted using data from the year 2019. Table 1 shows an overview of the key information regarding the case study.
The daily irradiance level in Marseille in 2019 is illustrated in Figure 4, which is the sum of the 24 hourly irradiance levels during one specific day. The actual raw data used in the calculations have an hourly resolution. However, for visualisation purposes, the graph shows the daily irradiance levels. As expected, the highest irradiance levels occur in summer (in the middle of the year). The irregular drops in the irradiance are due to intermittent cloud cover occurring throughout the year.
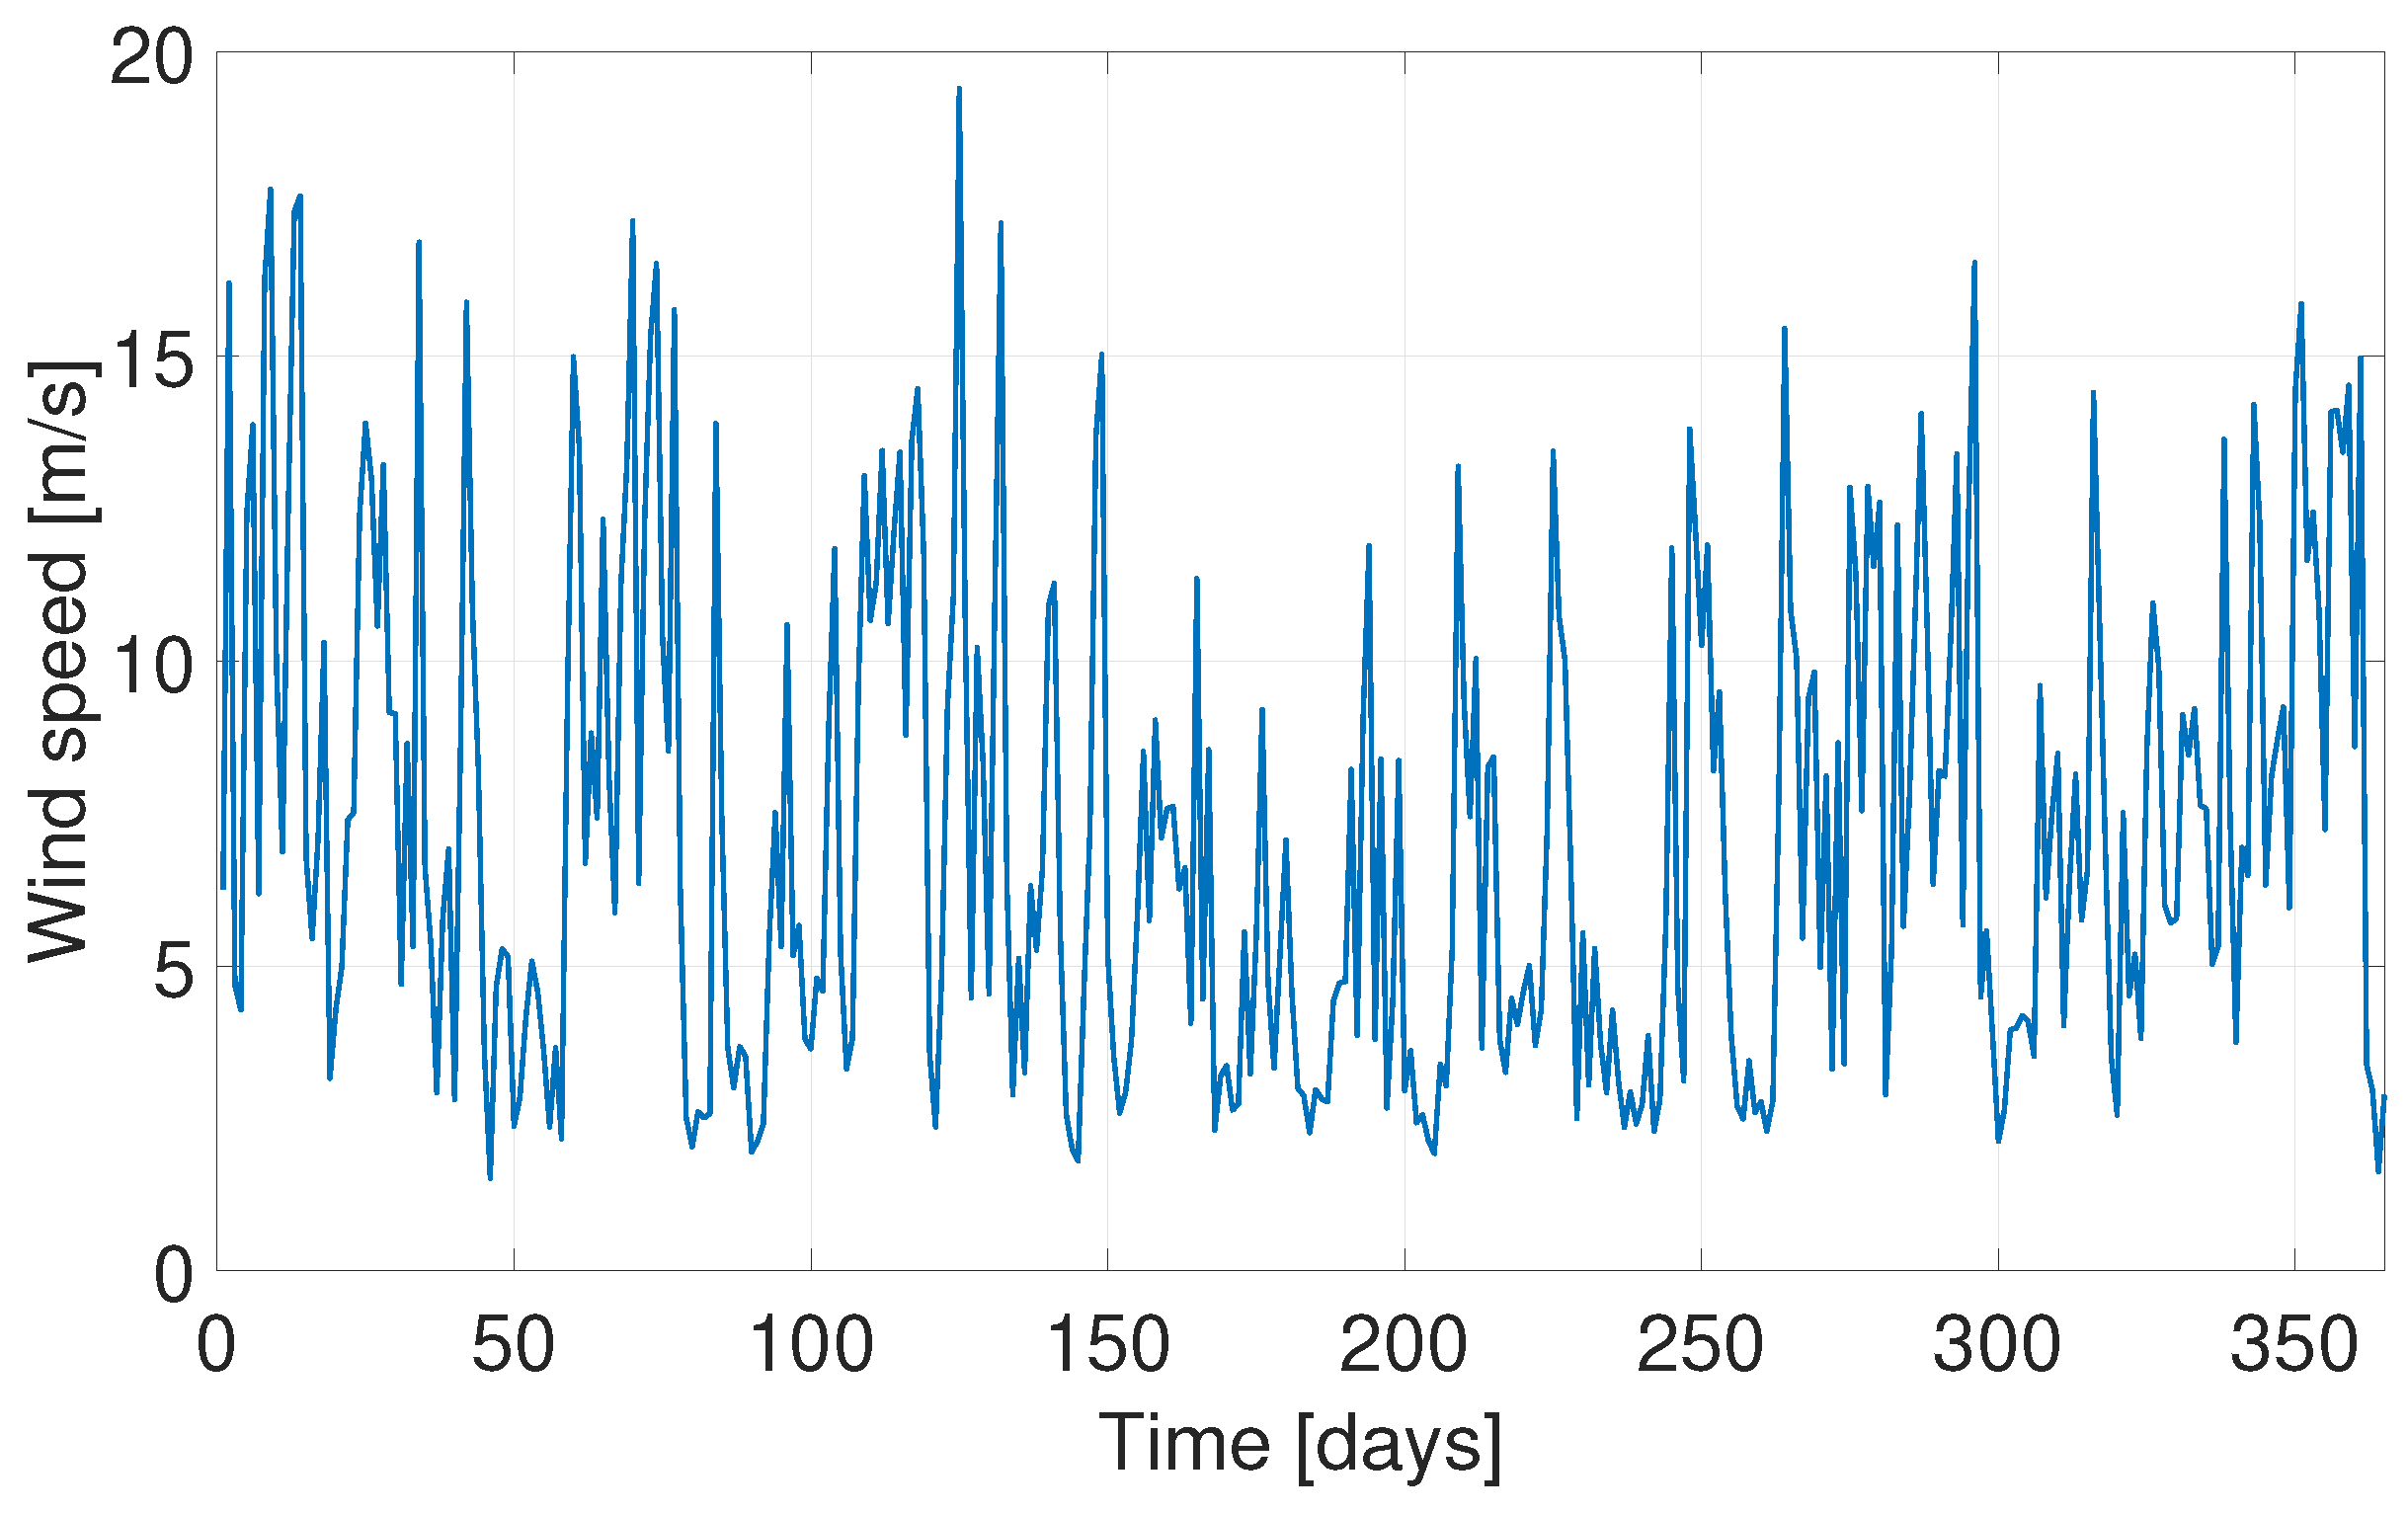
The daily average wind speed in Marseille in 2019 is shown in Figure 5. The hourly raw data were used for calculations, but the average daily wind speeds are shown for the purpose of visual representation. On an hourly time scale, the data show considerable variation, which is due to the inconsistent nature of the resource. On an annual basis, the wind speeds in the winter were slightly higher than in the summer. The average wind speed in Marseille in 2019 was 7.2 m/s.
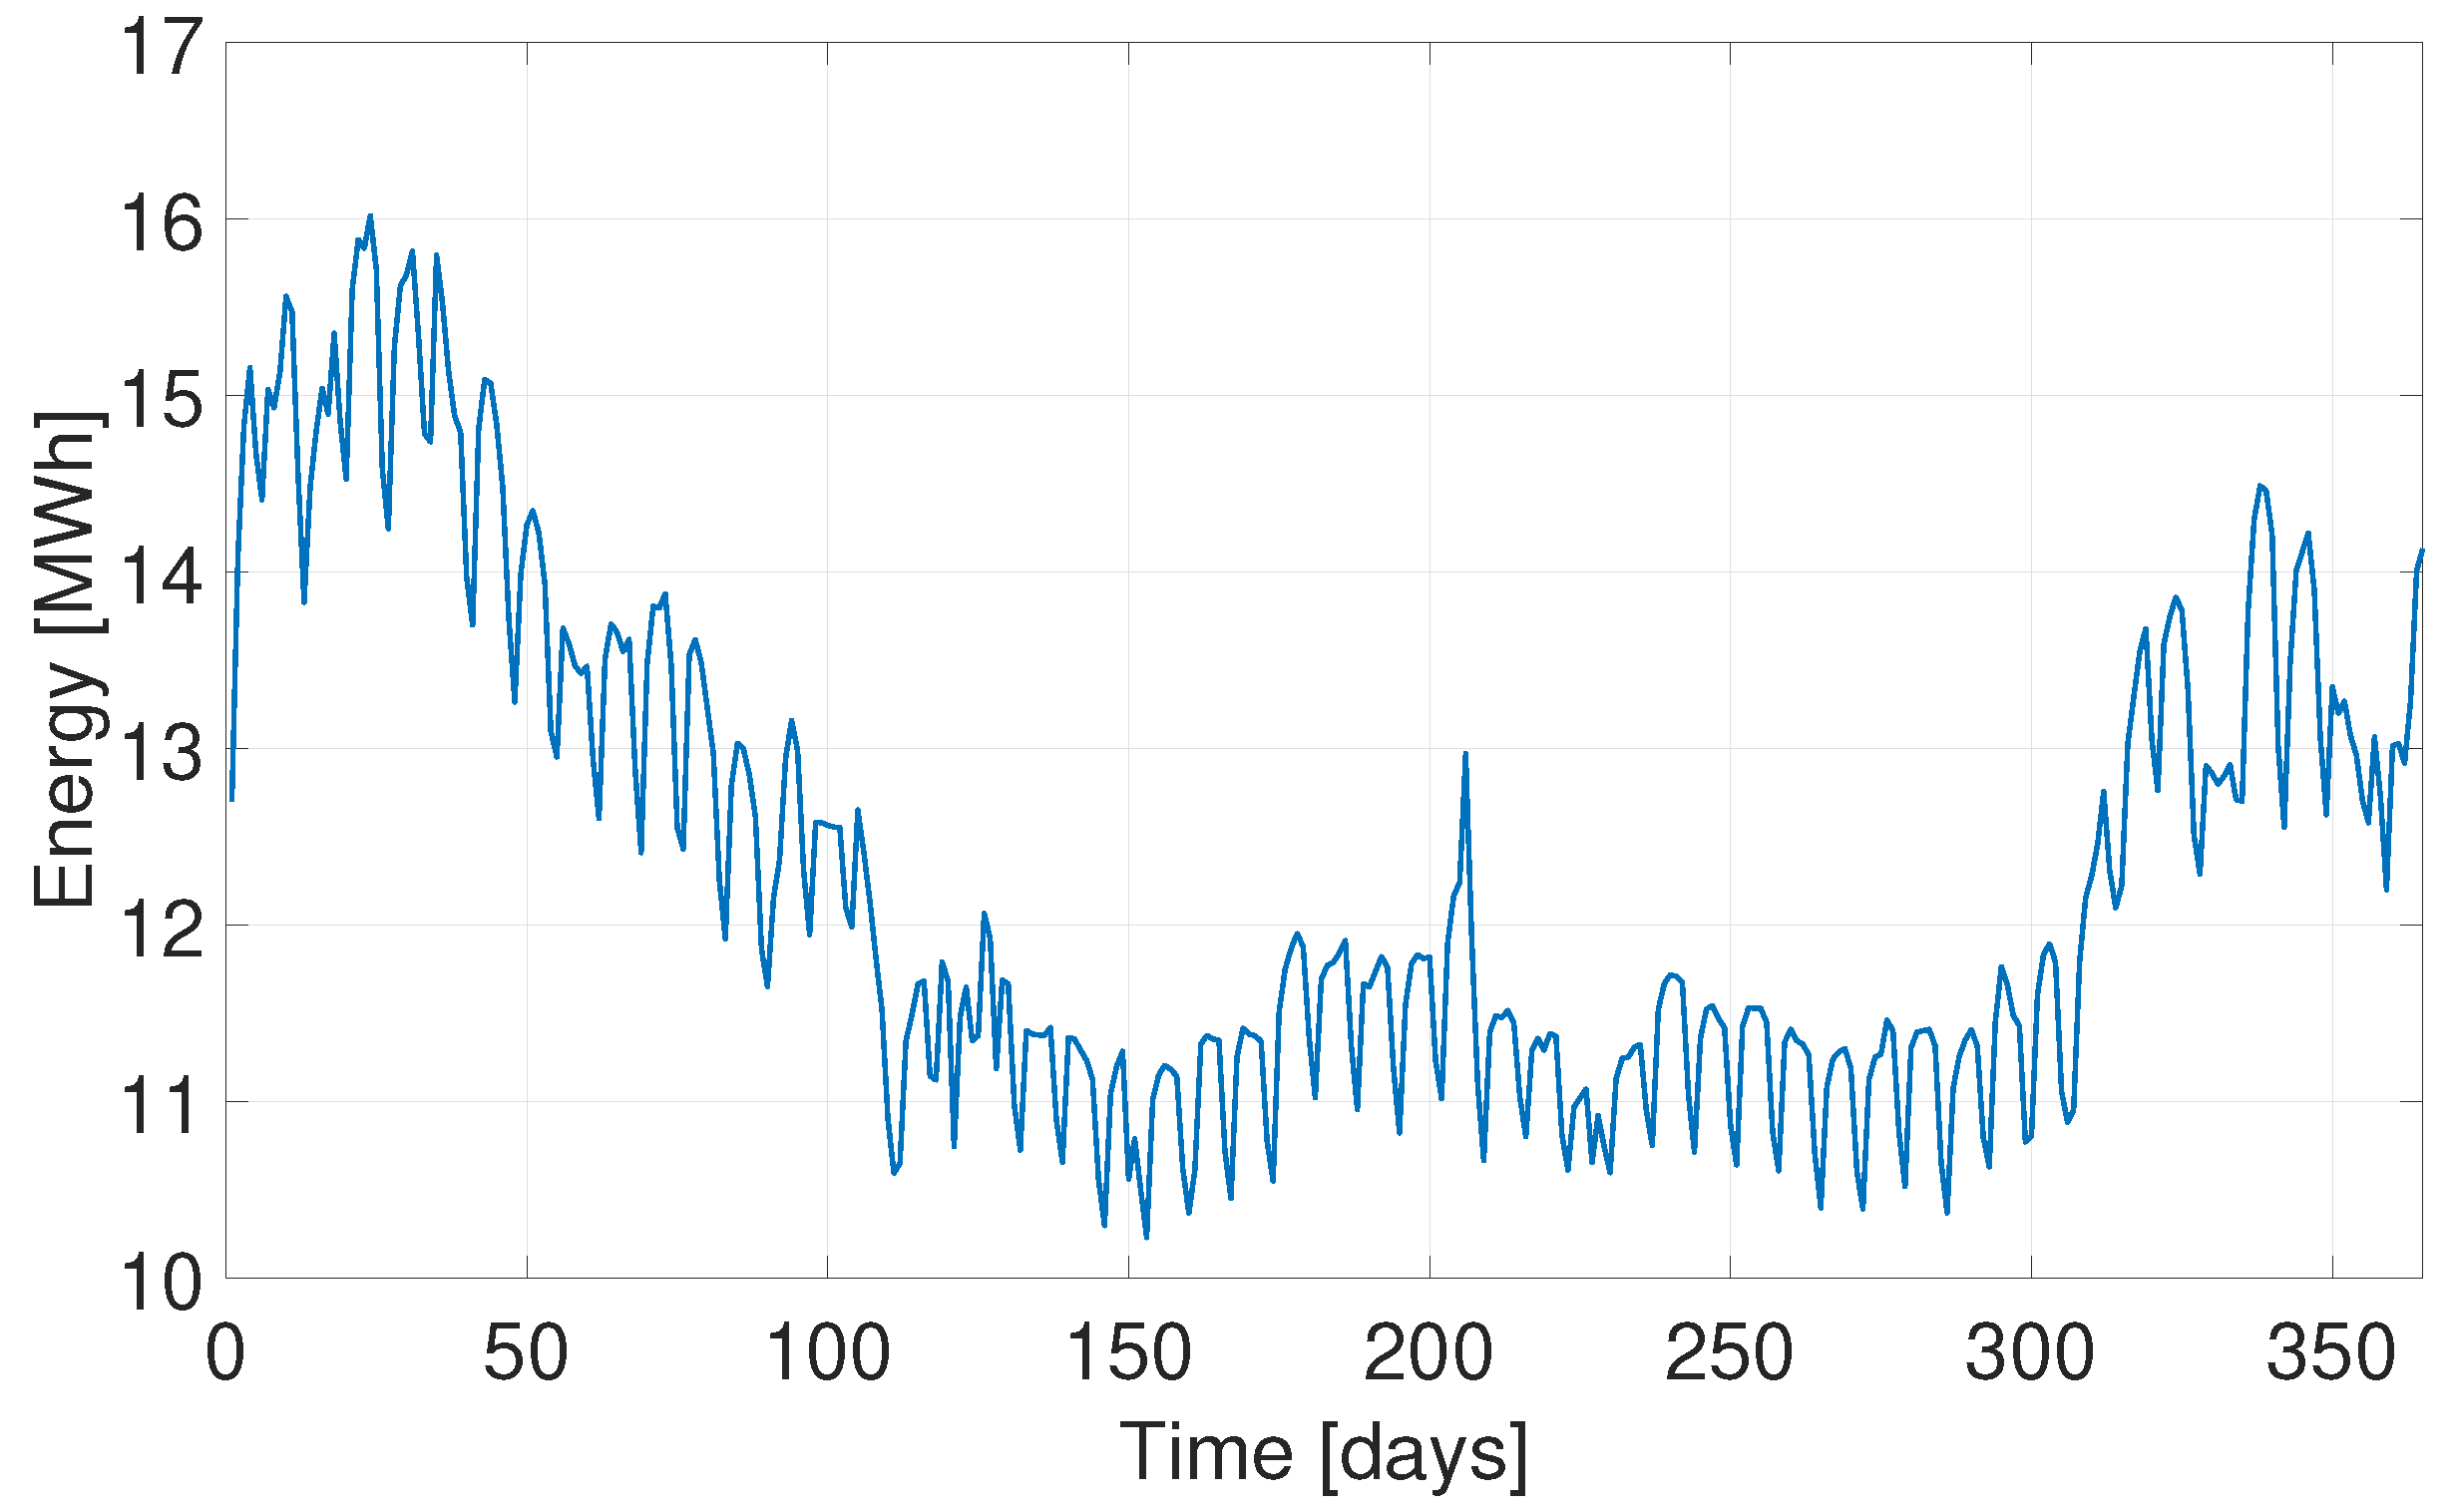
The demand profile was modelled as explained in Section 2.3. The Pearson correlation coefficients between the two demand datasets from [27,28] are 0.47 and 0.52 at an hourly and daily resolution, respectively. This shows that the two datasets have sufficient temporal correlation and could therefore be combined to generate a simulated demand profile. The correlation coefficients between the real-life [27] and generated demand profile are 0.92 at hourly resolution and 0.97 at daily resolution. Between the theoretical [28] and generated profiles, the correlation coefficients are 0.78 at an hourly resolution and 0.70 at a daily resolution. Figure 6 shows the simulated demand profile combining the real-life and theoretical datasets. The average hourly energy demand was 0.5 MWh.
The solar modules considered in this case were ‘Photovoltaic modules HIT’ from Panasonic [35]. These modules have an efficiency of around 20%, a temperature dependency coefficient of around 0.258 %/°C, a module degradation of 0.45 %/year and a guaranteed lifetime of 25 years. The capital expenditure (CAPEX) cost related to the total solar energy system used was 835 €/kW installed, and the operational expenditure (OPEX) cost used was 5 €/kW/year with a discount rate of 5% [36].
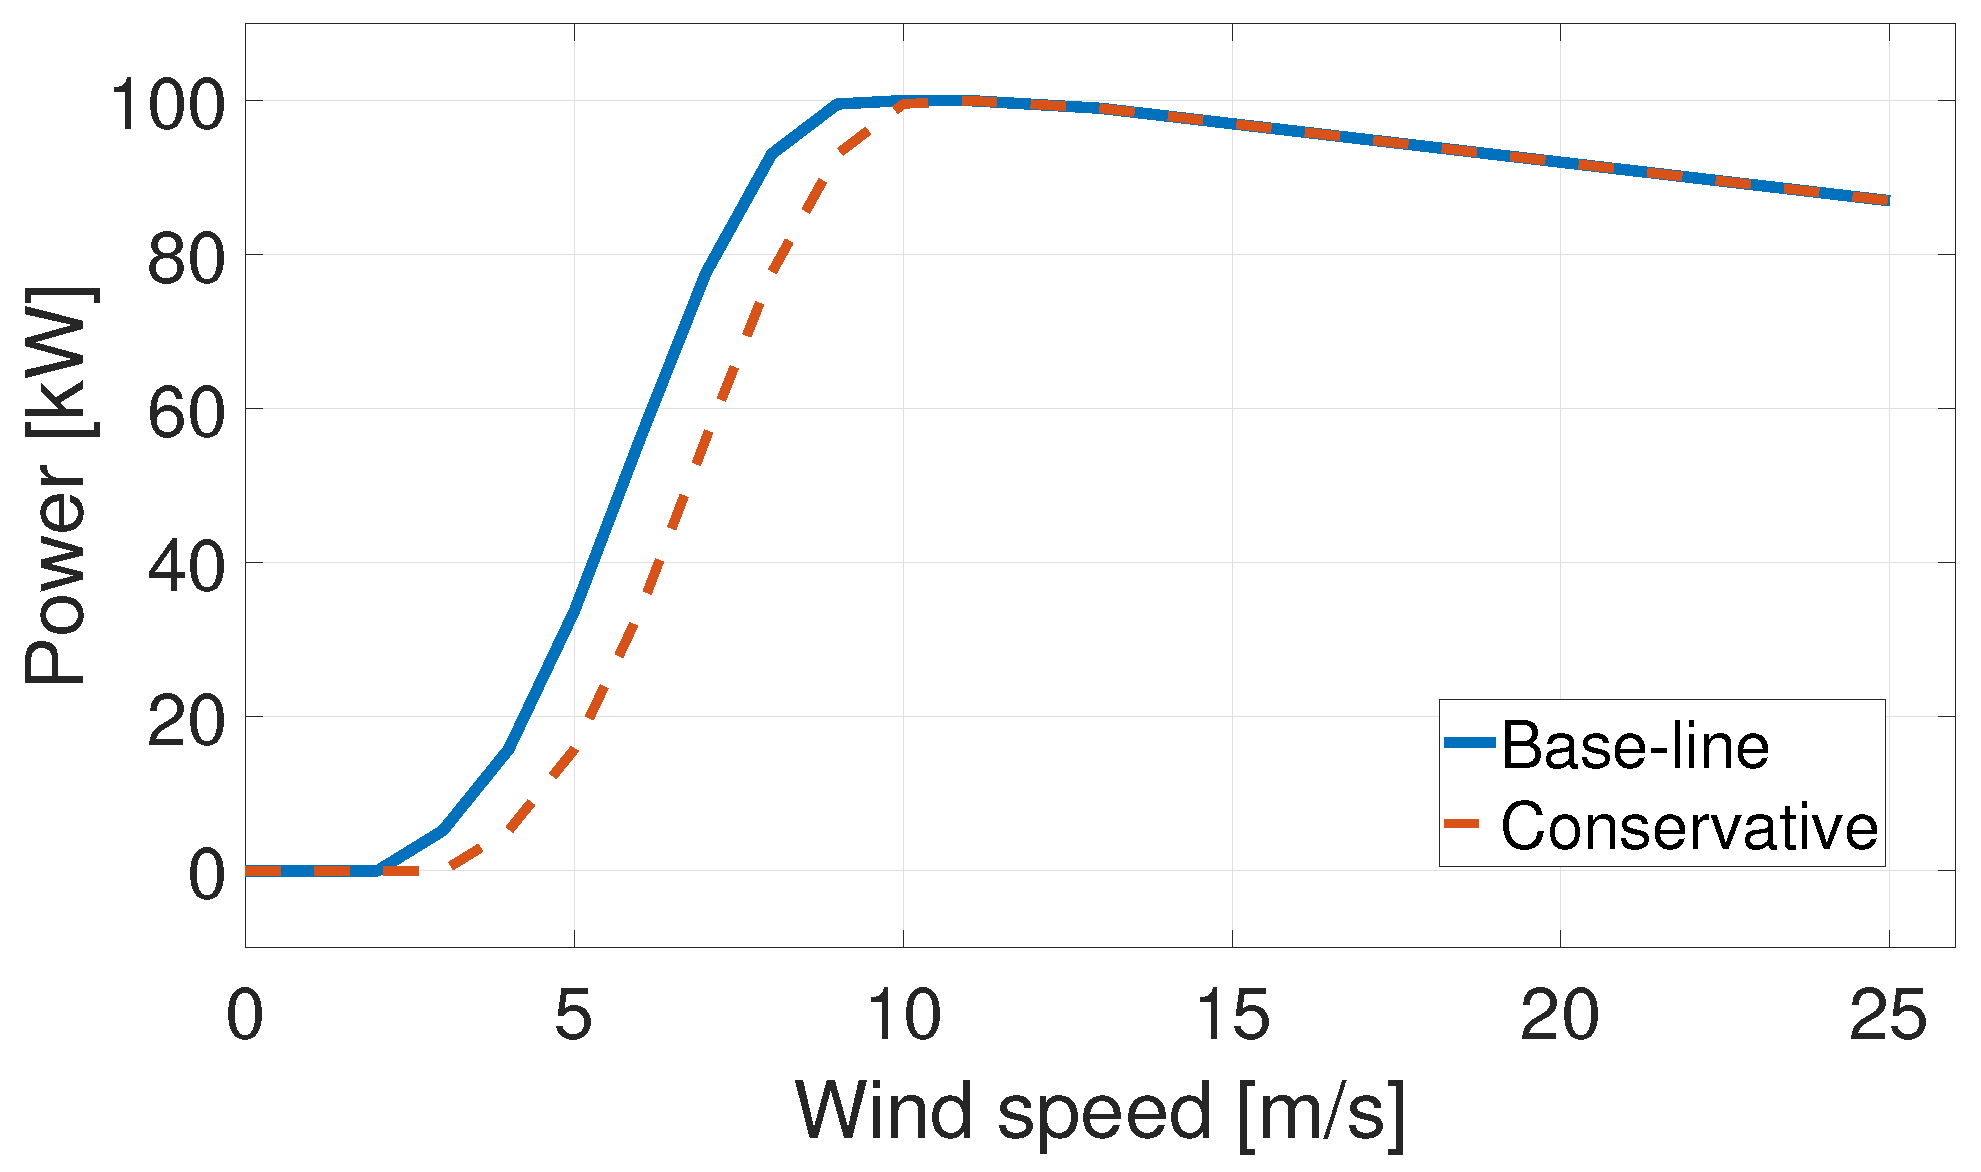
A 100 kW system based on the soft-wing ground generation concept was chosen as the AWE component in the framework. The cost data were obtained from Kitepower B.V. [37] under a non-disclosure agreement with the company. The power curve was computed with the AWERA toolchain [38] using key high-level system specifications provided by the company. These system specifications include the aerodynamic performance of the kite for the reel-out and reel-in phases; masses of the kite, the kite control unit and the tether; the wing surface area of the kite; the minimum and maximum tether lengths; the tether diameter; tether drag; and a maximum tether force limit. The toolchain is based on optimisation of the operation of the AWE system using a quasi-steady model [39] incorporating the effect of vertical wind shear profiles. A representative vertical wind shear profile was composed using eight profiles based on the ERA5 reanalysis data [40] via a clustering process described in [24]. Figure 7 shows the power curve of the system with a cut-in wind speed of 2 m/s and a maximum operating wind speed of 25 m/s. The solid line shows the baseline simulation results, and the dashed line shows a conservative estimate of the power curve. More energy is required during the reel-in phase of the cycle at higher wind speeds, since it has to overcome a larger drag force. Hence, the net cycle power drops with increasing wind speed after reaching the generator-rated power. The average operational height of the system was 320 m. The conservative estimate accounts for uncertainty in the estimation of the kite mass, which is one of the primary factors affecting the system performance at lower wind speeds. Heavier kites shift the power curve to higher wind speeds.
Lithium-ion batteries were selected as the battery type for the hybrid power system (HPS) due to their increasing use within the industry. An overview of the main specifications is provided in Table 2. The energy storage cost was estimated to be 182 €/kWh in 2030 by NREL [41]. Typical round-trip efficiencies of Li-ion battery systems are 90% with operating limits between 10 and 100% of the capacity. The used cycle life was 10,000 cycles, which correspond to a lifetime of about 10 years. Considering a project lifetime of 25 years, the battery system had to be replaced twice. These costs are spread out over the project’s lifetime, resulting in a lower capital cost.
The CAPEX of diesel generators used was 600 € per kW of rated electrical power [43]. The main cost of generating electricity associated with diesel generators is the cost of fuel, which is accounted for in the OPEX as 1.37 €/L of fuel used. About 0.4 litres of diesel is used to generate one kWh of electricity [29,30]. Moreover, the carbon tax is considered, which adds another 0.13 €/kWh of electricity produced. Including the diesel cost and carbon tax, generating one kWh of electricity using the diesel generators costs 0.678 €/kWh. This aligns with the reported diesel electricity cost for off-grid electrification [44].

3.2. HPS Configurations

The objective of this case study was to meet 100% of the demand with a minimal cost of electricity for off-grid locations. The different HPS configurations evaluated are based on all possible combinations of the considered components. This was done to evaluate the advantage of hybrid power systems compared to stand-alone systems. An overview of the different HPS configurations and the respective sizing of components is provided in Table 3.
A fully diesel-based system was considered a base-case scenario to compare different HPS configurations. The levelised cost of electricity (LCoE) of a fully diesel-based system was around 720 €/MWh. Since solar and wind resources are intermittent in nature, they are not always available when there is electricity demand. Therefore, it is most likely impossible to meet 100% of the demand with stand-alone wind or solar installations.
The most expensive HPS configuration is that with AWE and batteries, with an LCoE of 900 €/kWh. Due to the intermittency of wind, the battery had to be sized to meet the peak demands during low winds. But this led to a low utilization factor of the batteries in the overall project lifetime. With the addition of diesel generation to this mix, the LCoE dropped by around 55%, completely eliminating batteries and significantly reducing the AWE capacity by around 65%. This was driven by the tradeoff between the AWE, battery and diesel costs. For a configuration of solar PV and batteries, the installed capacity of solar PV was considerably higher than the peak demand, since the efficiency of solar PV panels is low. Adding diesel to the solar PV and battery configuration reduced the LCoE by around 40% and significantly reduced the installed solar and battery capacities by around 66% and 75%, respectively.
The configuration with combined wind, solar and batteries resulted in an even lower LCoE of 390 €/MWh compared to all the abovementioned individual diesel, wind and solar configurations. If the battery was replaced by diesel, the solar PV capacity dropped by around 70%, but the LCoE dropped only by around 15% because the PV modules did not have to cater to the peak loads and therefore did not need to be oversized. However, since the cost of solar PV is low, the LCoE reduction was also relatively small. The lowest LCoE of 280 €/MWh was achieved by including all four components. These results clearly show the advantage of combining wind and solar resources and demonstrate that a fully diesel-free system is feasible with competitive costs. Figure 8 shows the configurations in increasing order of LCoE, summarising the results.
Cost data are uncertain because they depend on multiple factors, such as the location, market scenario, manufacturers, etc. The data used in this study were obtained from multiple publicly available sources and company supplier quotes to reduce the uncertainty.
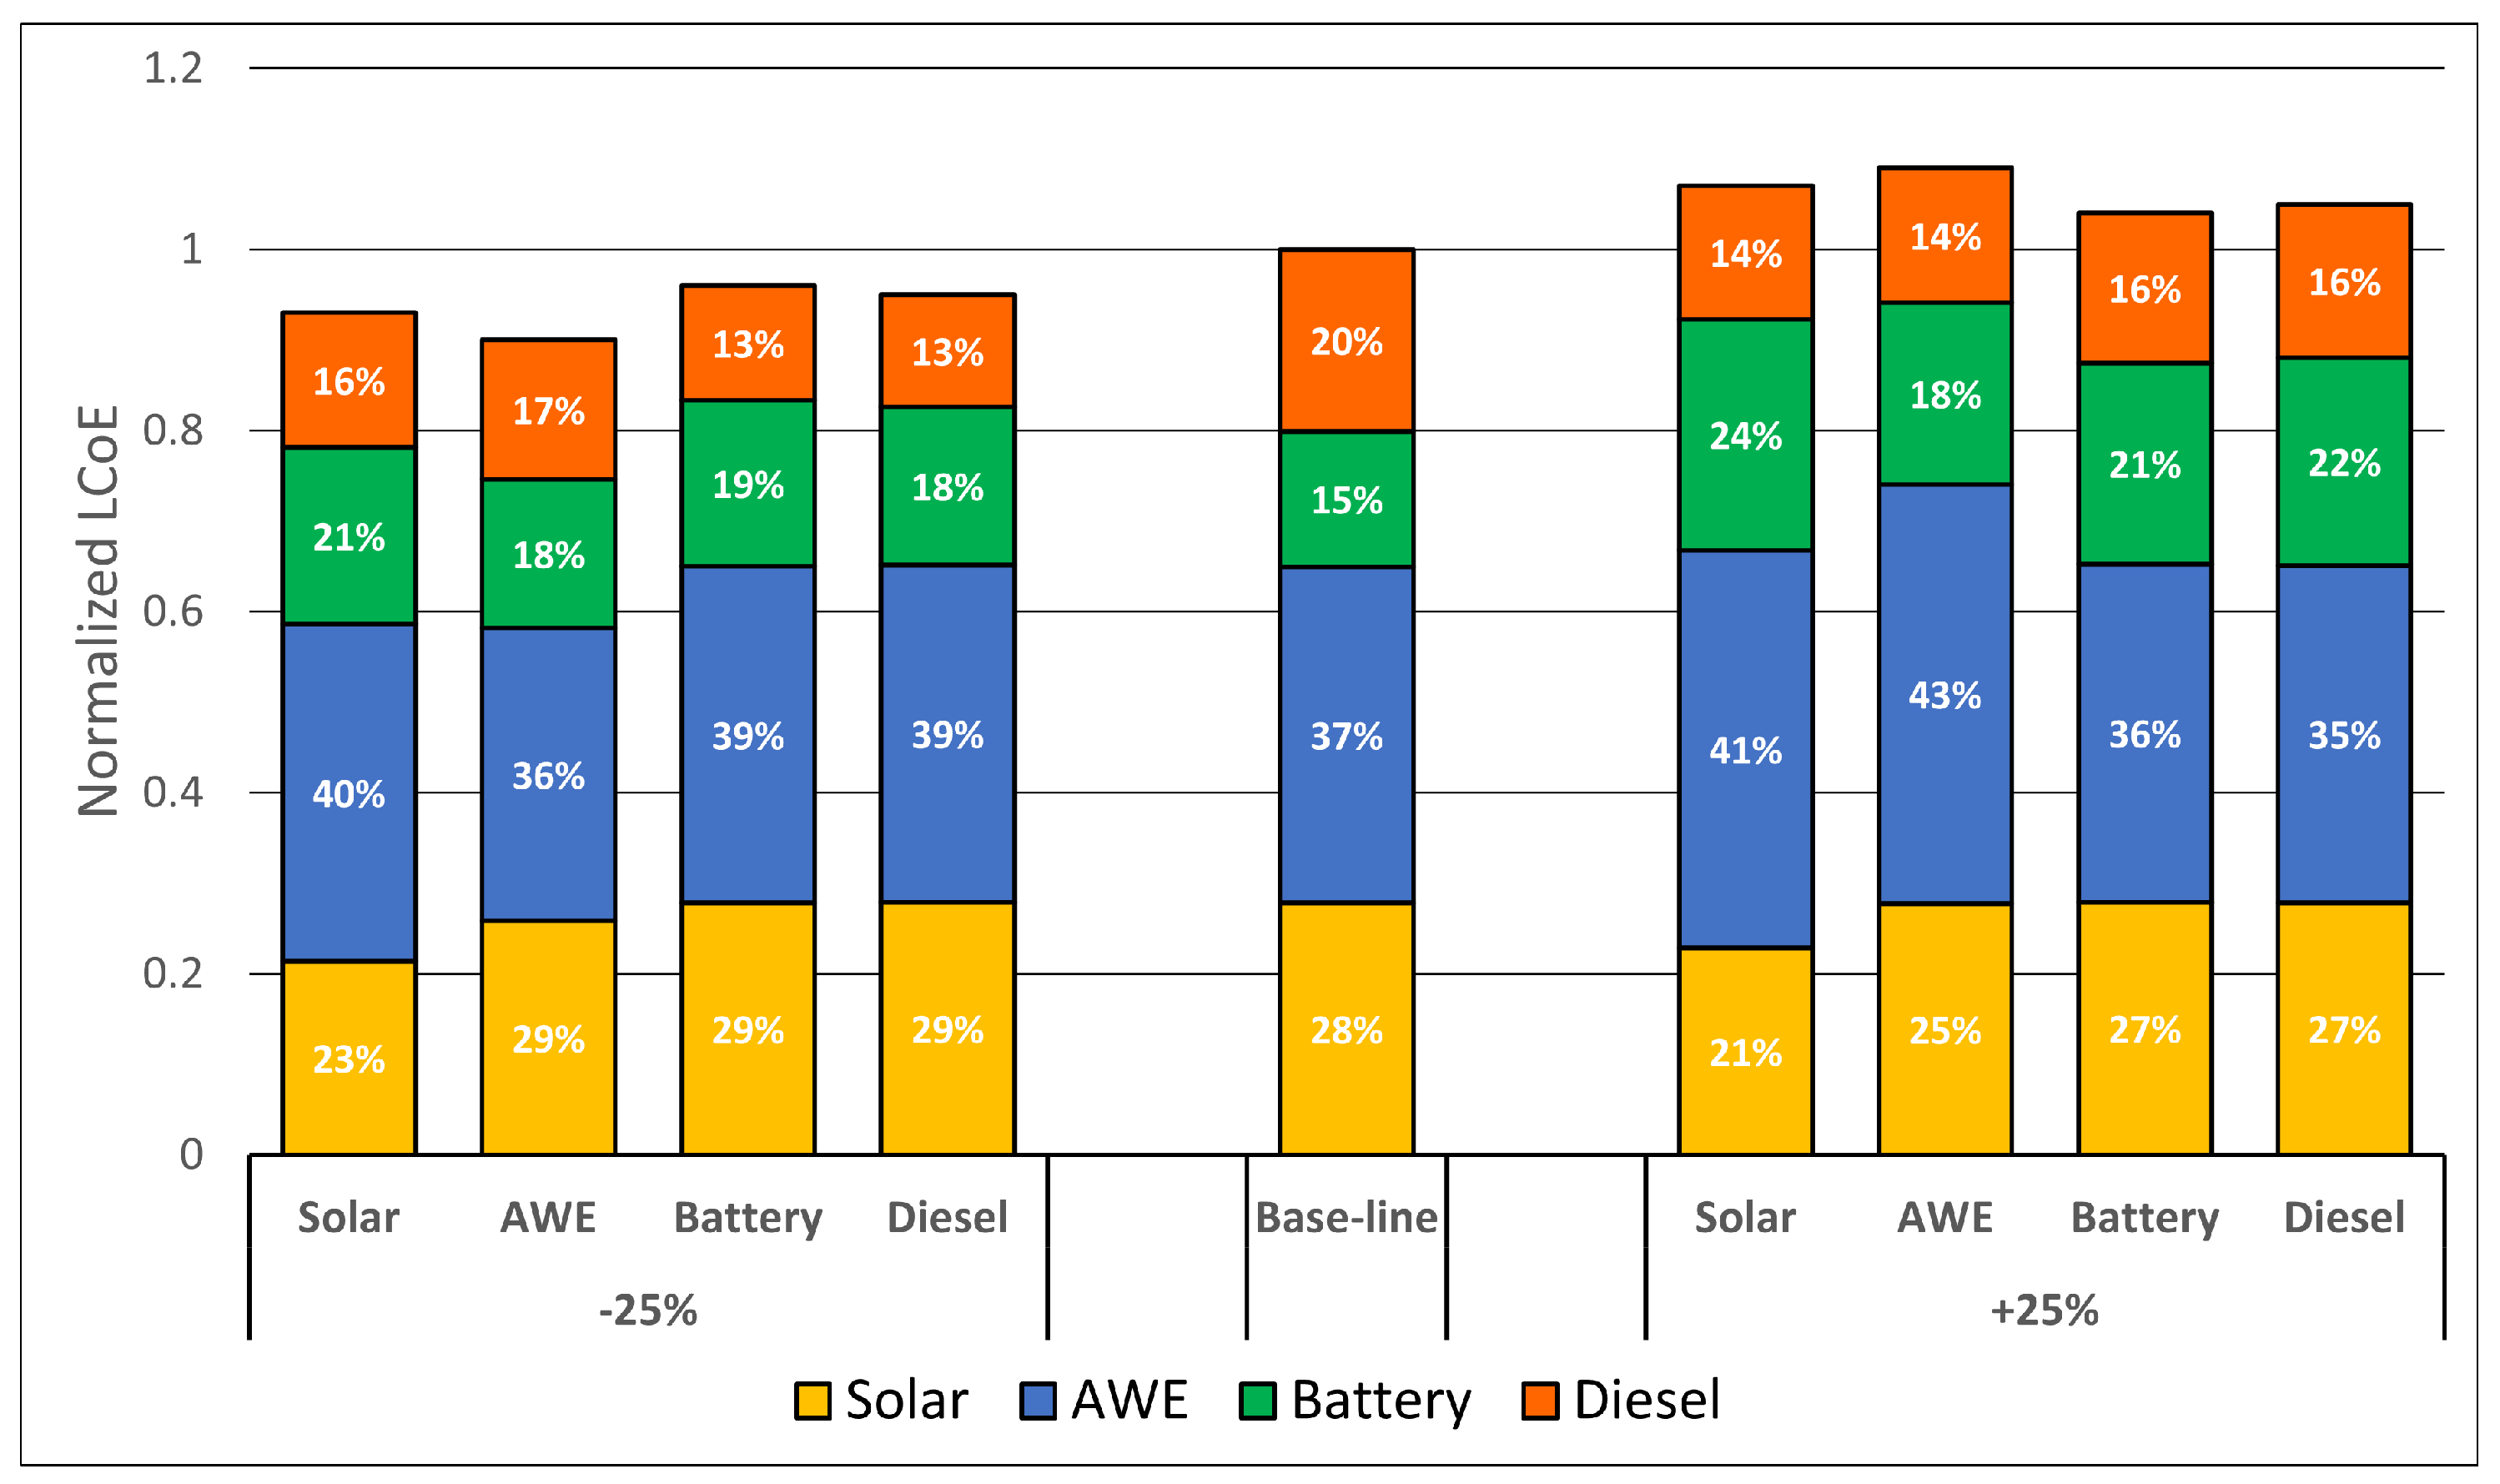
Figure 9 illustrates the results from the performed sensitivity analysis. The bar graphs show the cost distribution of the HPS configurations. The total costs per component include the CAPEX and the discounted OPEX over the entire lifetime of the HPS. The baseline configuration is the optimal configuration presented in Table 3. A cost variation of ± 25 % on every component of the HPS configuration is applied to observe the change in the cost distribution of the resulting optimal HPS configuration. For example, the first bar graph on the left of the baseline scenario is the result of decreasing the cost of diesel by 25 % and keeping the costs of other components constant. Decreasing the cost of diesel, battery, AWE and solar PV by 25 % individually reduced the LCoE of the resulting optimal configurations by 7 , 10 , 4 , and 5 % , respectively. Increasing the cost of diesel, battery, AWE and solar PV by 25 % individually increased the LCoE of the resulting optimal configurations by 7 , 9 , 4 , and 5 % , respectively. The change in the cost of individual components by 25 % influenced the LCoE by only 4–10%. This shows that an HPS can efficiently accommodate the cost uncertainty of a certain component by sizing the components differently, demonstrating the robust nature of an HPS against a stand-alone single power generation source. Additional sensitivity analysis was performed in [18] by varying the costs by 50 % .
In addition to costs, uncertainty in the energy production of the AWE system also needs to be accounted for, since the technology is in the precommercial prototype phase, and the commercial realisation of the technology could deviate from the baseline simulation results. This was achieved using a conservative estimate of the power curve as shown in Figure 7. Evaluating the optimal case of the HPS configuration using the conservative power curve resulted in an LCoE of 308 €/MWh. The mix of different components was 5.7 MWp solar PV, 0.6 MW AWE, 7.64 MWh battery capacity and 9% diesel. Table 3 shows that the diesel generator and the solar PV balanced the reduction in energy production due to the AWE systems. Accounting for cost and performance uncertainty individually led to variation in the LCoE within 10 % compared to the optimal configuration listed in Table 3. This deviation could increase further if the conservative estimates of multiple cost and performance factors are considered together.

4. Conclusions

In this paper, a framework for the modelling and sizing of hybrid power systems (HPS) is proposed with the additional use of airborne wind energy (AWE) as one of its components. The source code of the framework is publicly available. Interest in HPS has been more prominent in remote off-grid locations, where the electricity is primarily provided by diesel generators. HPSs based on renewable energy sources such as wind and solar have the potential to reduce costs and the carbon footprint of the produced electricity. The components of the HPS considered in the presented framework are AWE systems, solar photovoltaic (PV) modules, battery systems and diesel generators. The framework is flexible and can be used to evaluate different scenarios, for example, eliminating diesel, ignoring certain sources such as wind or solar, etc. Time-series data with an hourly resolution were used as an input to the framework, and the components of the HPS were sized to minimise the levelised cost of electricity (LCoE).
The framework was used to evaluate a case study of a remotely located hypothetical off-grid military camp in Marseille, France. Based on the available resources and the demand profile, the most expensive HPS configuration was the combination of AWE systems and batteries. Due to the intermittency of wind, the batteries had to to be largely oversized to meet the peak demands of the camp. Most of the time, this led to an underutilisation of the batteries, which increased the LCoE. A fully diesel-based system was found to be 20% cheaper than the most expensive configuration in the evaluated case study. The configuration including all four components yielded the lowest LCoE, with a reduction of around 60% in the LCoE compared to the fully diesel-based system. This reduction percentage is subject to uncertainty based on the potential variability of the energy production and the cost of the individual components of the optimal HPS configuration. Sensitivity analysis showed that the LCoE of the optimal HPS configuration has an uncertainty of around 10 % with respect to the isolated variations in cost and performance factors of the AWE systems. Conservative estimates of these individual factors for the AWE systems reduced the LCoE of the optimal HPS configuration by around 57% compared to the fully diesel-based system. This uncertainty could increase if the conservative sides of multiple cost and performance factors are evaluated together. One of the advantages of an HPS relative to stand-alone solutions is that the sizing of different components within the system can be effectively adjusted without a high penalty on final costs. We found that eliminating diesel to meet demand using renewable energy sources is possible by using batteries to manage their intermittency. Although this was not the configuration with the minimum LCoE, it was the third-best solution. The case study results show that shifting from purely diesel-based electricity generation to a hybrid power system comprising airborne wind energy, solar PV, batteries and diesel can significantly reduce the cost of energy.

Author Contributions

Conceptualization, S.R., R.J. and R.S.; methodology, S.R. and R.J.; software, S.R.; validation, S.R.; writing—original draft preparation, S.R. and R.J.; writing—review and editing, R.J. and R.S.; supervision, R.J. and R.S.; funding acquisition, R.S. All authors have read and agreed to the published version of the manuscript.

Funding

This publication is jointly financed by the Dutch Research Council NWO (project “NEON: New Energy and Mobility Outlook for the Netherlands”, number 17628), Ampyx Power B.V. and Kitepower B.V. The APC was funded by Delft University of Technology.

Data Availability Statement

Link to a GitHub repository containing the executable MATLAB code, along with dummy case data: https://github.com/awegroup/AWE-HPS (accessed on 1 May 2023).

Acknowledgments

The authors would like to thank Kitepower B.V. for contributing to the performance and cost data for the kite system.

Conflicts of Interest

S.R. and R.J. declare no conflict of interest. R.S. is a full-time employee of Delft University of Technology and is a cofounder of Kitepower B.V., which provided the performance and cost data for the kite system.

Abbreviations

The following abbreviations are used in this manuscript:
AWEAirborne wind energy
HPSHybrid power system
PVPhotovoltaic
GHIGlobal horizontal irradiance
DNIDirect normal irradiance
DHIDiffuse horizontal irradiance
LCoELevelised cost of electricity
AOIAngle of incidence
SFShading factor
SVFSky view factor

References

  1. Paska, J.; Biczel, P.; Kłos, M. Hybrid power systems—An effective way of utilising primary energy sources. Renew. Energy 2009, 34, 2414–2421. [Google Scholar] [CrossRef]
  2. Dykes, K.; King, J.; Diorio, N.; King, R.; Gevorgian, V.; Corbus, D.; Blair, N.; Anderson, K.; Stark, G.; Turchi, C.; et al. Opportunities for Research and Development of Hybrid Power Plants. Technical Report, National Renewable Energy Laboratory (NREL), Golden, CO, 2020. Available online: https://www.nrel.gov/docs/fy20osti/75026.pdf (accessed on 30 January 2023).
  3. WindEurope. Database for Wind + Storage Co-Located Projects. Available online: https://windeurope.org/about-wind/database-for-wind-and-storage-colocated-projects/ (accessed on 3 June 2022).
  4. Bett, P.E.; Thornton, H.E. The climatological relationships between wind and solar energy supply in Britain. Renew. Energy 2016, 87, 96–110. [Google Scholar] [CrossRef]
  5. Das, K.; Grapperon, A.L.T.P.; Sørensen, P.E.; Hansen, A.D. Optimal battery operation for revenue maximization of wind-storage hybrid power plant. Electr. Power Syst. Res. 2020, 189. [Google Scholar] [CrossRef]
  6. Gorman, W.; Mills, A.; Bolinger, M.; Wiser, R.; Singhal, N.G.; Ela, E.; O’Shaughnessy, E. Motivations and options for deploying hybrid generator-plus-battery projects within the bulk power system. Electr. J. 2020, 33, 106739. [Google Scholar] [CrossRef]
  7. Fagiano, L.; Quack, M.; Bauer, F.; Carnel, L.; Oland, E. Autonomous Airborne Wind Energy Systems: Accomplishments and Challenges. Annu. Rev. Control Robot. Auton. Syst. 2022, 5, 603–631. [Google Scholar] [CrossRef]
  8. Bechtle, P.; Schelbergen, M.; Schmehl, R.; Zillmann, U.; Watson, S. Airborne Wind Energy Resource Analysis. Renew. Energy 2019, 141, 1103–1116. [Google Scholar] [CrossRef]
  9. Noun Project. Icons and Photos for Everything. Available online: https://thenounproject.com/ (accessed on 23 May 2022).
  10. Khan, Z.H.; Khan, S.A.; Khan, A.H. Prospects of Airborne Wind Energy Systems in Pakistan. In Proceedings of the Fourth International Conference on Aerospace Science and Engineering (ICASE), Islamabad, Pakistan, 2–4 September 2015. [Google Scholar]
  11. UNFCCC Technology Executive Committee. Emering Climate Technologies in the Energy Supply Sector. Technical Report, United Nations Framework Convention on Climate Change, Bonn, Germany, 2021. Available online: https://unfccc.int/ttclear/tec/energysupplysector.html (accessed on 21 January 2023).
  12. Enerwhere. What Will It Take for Airborne Wind Energy (AWE) to Be Successful in Remote & Mini-Grid Applications? Available online: https://www.enerwhere.com/AWES-Success-Remote-Mini-Grid (accessed on 27 December 2022).
  13. Enerkite GmbH. EK200—Airborne Wind Energy and Storage System, Catering to Off-Grid and Mobile End-Uses (AWESOME). Available online: https://cordis.europa.eu/project/id/736399 (accessed on 22 December 2022).
  14. Nouri, M.; Miansari, M. Airborne wind energy-driven hybrid system for simultaneous production of power, potable water, and liquid carbon dioxide. Energy Convers. Manag. 2021, 233, 113913. [Google Scholar] [CrossRef]
  15. De la Garza Cuevas, R. Kite Power in a Microgrid. Master’s Thesis, Delft University of Technology, Delft, The Netherlands, 2018. Available online: http://resolver.tudelft.nl/uuid:7653081f-710b-4511-be05-f1df9e6abc31 (accessed on 21 January 2023).
  16. Ouroumova, L.; Witte, D.; Klootwijk, B.; Terwindt, E.; van Marion, F.; Mordasov, D.; Vargas, F.C.; Heidweiller, S.; Géczi, M.; Kempers, M.; et al. Combined Airborne Wind and Photovoltaic Energy System for Martian Habitats. Spool 2021, 8, 71–85. [Google Scholar] [CrossRef]
  17. Rodriguez, M. Airborne Wind Energy Systems for Mars Habitats. Master’s Thesis, Delft University of Technology, Delft, The Netherlands, 2022. Available online: http://resolver.tudelft.nl/uuid:52a156ae-c758-4d3a-a403-54ce5fce2e5e (accessed on 21 January 2023).
  18. Reuchlin, S.P.A. Modelling and Sizing of a Hybrid Power Plant Using Airborne Wind Energy. Master’s Thesis, Delft University of Technology, Delft, The Netherlands, 2022. Available online: http://resolver.tudelft.nl/uuid:041b3cf7-4b10-44c2-9b49-8f58b6f8419c (accessed on 21 January 2023).
  19. Reuchlin, S. GitHub Repository of the MATLAB Based Source Code of the Hybrid Power System Sizing Framework. 2022. Available online: https://github.com/awegroup/AWE-HPS (accessed on 1 May 2023).
  20. NREL. NSRDB Data Viewer. Available online: https://maps.nrel.gov/nsrdb-viewer/ (accessed on 21 March 2022).
  21. Smets, A.; Jäger, K.; Isabella, O.; van Swaaij, R.; Zeman, M. Solar Energy: The Physics and Engineering of Photovoltaic Conversion Technologies and Systems; UIT Cambridge Ltd.: Cambridge, UK, 2016. [Google Scholar]
  22. ERA5. ERA5 Hourly Data on Pressure Levels from 1979 to Present. Available online: https://cds.climate.copernicus.eu/ (accessed on 2 February 2022).
  23. Olauson, J. ERA5: The new champion of wind power modelling? Renew. Energy 2018, 126, 322–331. [Google Scholar] [CrossRef]
  24. Schelbergen, M.; Kalverla, P.C.; Schmehl, R.; Watson, S.J. Clustering Wind Profile Shapes to Estimate Airborne Wind Energy Production. Wind. Energy Sci. 2020, 5, 1097–1120. [Google Scholar] [CrossRef]
  25. Schelbergen, M.; Schmehl, R. Validation of the Quasi-Steady Performance Model for Pumping Airborne Wind Energy Systems. J. Phys. Conf. Ser. 2020, 1618, 032003. [Google Scholar] [CrossRef]
  26. Sommerfeld, M.; Dörenkämper, M.; De Schutter, J.; Crawford, C. Offshore and onshore ground-generation airborne wind energy power curve characterization. Wind. Energy Sci. Discuss. 2020, 2020, 1–39. [Google Scholar] [CrossRef]
  27. ENTSOE-E. Total Load—Day Ahead/Actual. Available online: https://transparency.entsoe.eu/load-domain/r2/totalLoadR2/show (accessed on 12 March 2022).
  28. Mulder, F. Implications of diurnal and seasonal variations in renewable energy generation for large scale energy storage. J. Renew. Sustain. Energy 2014, 6, 033105-1–033105-13. [Google Scholar] [CrossRef]
  29. Hanania, J.; Martin, J.; Stenhouse, K.; Donev, J. Energy Education—Diesel Generator. Available online: https://energyeducation.ca/encyclopedia/Diesel_generator (accessed on 6 May 2022).
  30. Solano-Peralta, M.; Moner-Girona, M.; van Sark, W.G.; Vallvè, X. “Tropicalisation” of Feed-in Tariffs: A custom-made support scheme for hybrid PV/diesel systems in isolated regions. Renew. Sustain. Energy Rev. 2009, 13, 2279–2294. [Google Scholar] [CrossRef]
  31. PWC. Green Deal Monitor #4—National or European Taxation of CO2 Emissions? Available online: https://www.pwc.nl/en/topics/sustainability/green-deal-monitor/green-deal-monitor-4.html (accessed on 6 May 2022).
  32. International Renewable Energy Agency (IRENA). Renewable Power Generation Costs in 2019. Available online: https://www.irena.org/publications/2020/Jun/Renewable-Power-Costs-in-2019 (accessed on 2 January 2021).
  33. Statista. Average Monthly Price of Diesel Fuel in France from January 2018 to November 2022. Available online: https://www.statista.com/statistics/499442/average-price-of-diesel-in-france/ (accessed on 22 February 2023).
  34. Mutascu, M.I.; Albulescu, C.T.; Apergis, N.; Magazzino, C. Do gasoline and diesel prices co-move? Evidence from the time–frequency domain. Environ. Sci. Pollut. Res. 2022, 29, 68776–68795. [Google Scholar] [CrossRef] [PubMed]
  35. Panasonic. Photovoltaic Module HIT. Available online: https://www.europe-solarstore.com/download/panasonic/panasonic_VBHN335SJ53_datasheet.pdf (accessed on 13 April 2022).
  36. Rodriguez, L. Breaking Down Solar Farm Costs. Available online: https://ratedpower.com/blog/solar-farm-costs/ (accessed on 13 April 2022).
  37. Kitepower, B.V. Kitepower Falcon. Available online: https://thekitepower.com/product/ (accessed on 13 April 2022).
  38. Thimm, L.; Schelbergen, M.; Bechtle, P.; Schmehl, R. The Airborne Wind Energy Resource Analysis Tool AWERA. In Proceedings of the 9th international Airborne Wind Energy Conference (AWEC 2021), Milano, Italy, 22–24 June 2022; Available online: http://resolver.tudelft.nl/uuid:ba0c7fb2-baff-4110-9a51-c27a8498663b (accessed on 21 January 2023).
  39. Van der Vlugt, R.; Bley, A.; Noom, M.; Schmehl, R. Quasi-steady model of a pumping kite power system. Renew. Energy 2019, 131, 83–99. [Google Scholar] [CrossRef]
  40. European Centre for Medium-Range Weather Forecasts (ECMWF). ERA5 Dataset. Available online: https://www.ecmwf.int/en/forecasts/dataset/ecmwf-reanalysis-v5 (accessed on 2 May 2021).
  41. Cole, W.; Frazier, A.W.; Augustine, C. Cost Projections for Utility-Scale Battery Storage: 2021 Update. Technical Report, National Renewable Energy Laboratory (NREL), Golden, CO, 2021. Available online: https://www.nrel.gov/docs/fy21osti/79236.pdf (accessed on 21 January 2023).
  42. Lane, C. Are Lithium Ion Solar Batteries the Best Energy Storage Option? Available online: https://www.solarreviews.com/blog/are-lithium-ion-the-best-solar-batteries-for-energy-storage (accessed on 6 May 2022).
  43. Lazard. Lazard’s Levelized Cost of Energy Analysis—Version 8.0. Available online: https://www.seia.org/research-resources/lazards-levelized-cost-energy-analysis-v80 (accessed on 12 May 2022).
  44. Zebra, E.I.C.; van der Windt, H.J.; Nhumaio, G.; Faaij, A.P. A review of hybrid renewable energy systems in mini-grids for off-grid electrification in developing countries. Renew. Sustain. Energy Rev. 2021, 144, 111036. [Google Scholar] [CrossRef]
Figure 1. Possible architecture of a hybrid power system using airborne wind energy in a remote off-grid application. Icon credits: [9].
Energies 16 04036 g001
Figure 2. Flow chart of the developed framework for the modelling and sizing of hybrid power systems.
Energies 16 04036 g002
Figure 3. Example evolution of the battery capacity for an HPS with and without diesel.
Energies 16 04036 g003
Figure 4. Daily total irradiance levels throughout 2019 in Marseille. Raw data is obtained from [20].
Energies 16 04036 g004
Figure 5. Average daily wind speed in Marseille in 2019. Raw data is obtained from [22].
Energies 16 04036 g005
Figure 6. Modelled daily electricity demand for the hypothetical military training camp comprising 1300 personnel. Raw data is obatined from [27,28].
Energies 16 04036 g006
Figure 7. The solid line shows the power curve of the Falcon 100 kW system [37] computed with the AWERA toolchain [18,38], and the dashed line shows a conservative estimate result accounting for uncertainty in kite mass.
Energies 16 04036 g007
Figure 8. Comparison of the LCoE of the different HPS configurations.
Energies 16 04036 g008
Figure 9. Distribution of the percentage of total costs per component with the cost of each component subjected to a 25% price increase or decrease with respect to a baseline scenario.
Energies 16 04036 g009
Table 1. Location-specific data for the chosen case study (Year 2019).
PropertyValueUnitSource
Average hourly demand0.5MW[27]
Peak hourly demand0.7MW[27]
Average wind speed at 320 m7.2m/s[22]
Equivalent sun hours4.0kWh/m2/day[20]
Diesel price1.37€/L[33,34]
Carbon tax0.125€/kg[31]
Table 2. Lithium-ion battery specifications [41,42].
PropertyValueUnit
Energy storage cost182€/kWh
Round-trip efficiency90%
State-of-charge limits10–100%
Life cycle10,000cycles
Lifetime10years
Table 3. Sizes of components for different hybrid power system configurations minimising LCoE.
  HPS ConfigurationSolar PV
(MWp)
AWE
(MW)
Battery
(MWh)
Diesel
(%)
LCoE
(€/MWh)
Diesel000100720
AWE + Battery02920900
AWE + Battery + Diesel00.7040410
Solar + Battery300360670
Solar + Battery + Diesel1008.327410
Solar + AWE + Battery100.5250390
Solar + AWE + Diesel2.70.6024330
Solar + AWE + Battery + Diesel50.67.27280
Disclaimer/Publisher’s Note: The statements, opinions and data contained in all publications are solely those of the individual author(s) and contributor(s) and not of MDPI and/or the editor(s). MDPI and/or the editor(s) disclaim responsibility for any injury to people or property resulting from any ideas, methods, instructions or products referred to in the content.