Article

Capacity Optimal Allocation Method and Frequency Division Energy Management for Hybrid Energy Storage System Considering Grid-Connected Requirements in Photovoltaic System

1
School of Electrical Engineering and Automation, Tianjin University of Technology, Tianjin 300380, China
2
School of Electrical Automation and Information Engineering, Tianjin University, Tianjin 300072, China
*
Authors to whom correspondence should be addressed.
Energies 2023, 16(10), 4154; https://doi.org/10.3390/en16104154
Submission received: 27 March 2023 / Revised: 9 May 2023 / Accepted: 16 May 2023 / Published: 17 May 2023

Abstract

:
The coordination between a hybrid energy storage system (HESS) and photovoltaic (PV) power station can significantly reduce grid-connected PV power fluctuations. This study proposes a HESS capacity optimal allocation method considering the grid-connected PV requirements. Firstly, based on the power fluctuation requirements in the PV power station grid-connected regulations, the maximum power point tracking working point switching control is performed for the PV power station, from which the grid-connected PV power and HESS power are obtained. Then, a capacity optimal allocation method and frequency division energy management strategy (EMS) for HESS is proposed to find the energy response and power response of each energy storage source. Furthermore, a multi-objective optimization function with HESS cutoff frequency as the independent variable is constructed, and the input cost of HESS and the life loss of the lithium battery are optimized. Finally, the overall strategy is compared and analyzed under the scenarios of three typical PV power fluctuations. Simulation results show that the control strategy has a good smoothing effect on PV power fluctuations. From the perspective of the annual comprehensive input cost, HESS realizes the optimal capacity allocation when the cutoff frequency is 0.0066 Hz.

1. Introduction

Photovoltaic (PV), as a clean renewable energy, brings a new way to deal with the energy and environmental crisis because of its large-scale application. However, it is difficult to maintain a stable output of active power in photovoltaic power stations (PVPS) due to the randomness, intermittency and unpredictability of solar illumination [1]. The random fluctuation of grid-connected PV power can lead to voltage and frequency fluctuations of the grid, and further affect the power quality and supply reliability of the grid [2,3]. Therefore, the range of PV power fluctuation should be controlled within a safe range by taking some effective measures [4,5].
Many smooth measures have been developed to smooth PV power fluctuation, which are necessary for grid-connected PV [6]. The battery energy storage system (BESS) has been reported to smooth the fluctuation of PV power [7], and obtain grid-connected PV power by improving the swing gate trend algorithm through the Aquila optimizer. Moreover, the dynamic grouping principle, considering the state of health (SOH) and state of charge (SOC) of the battery, is designed to effectively smooth the power fluctuation of PV and balance SOH and SOC more quickly and accurately. The energy storage system (ESS) is also used to smooth the fluctuation of PV power [8]. Additionally, a new step control strategy, which reduces the capacity allocation and life loss of the ESS compared with different advanced control strategies, is proposed. In research using the controllable load method to smooth the fluctuation of PV power [9], power fluctuations are reduced by adjusting the output of the power generation side (PGS) when power fluctuations occur on the PGS. Furthermore, the renewable energy can be effectively absorbed and utilized through the orderly charging and discharging of electric vehicles, and the power fluctuation on the generation side can be effectively compensated in real time [10]. The advantages of no pollution and high energy density of hydrogen EES were discussed in previous research [11], and the combination of lithium battery and supercapacitor can solve the problems of renewable energy absorption and peak shaving.
The hybrid energy storage system (HESS), viewed within the complexity of system control and economy, is currently the mainstream and efficient method to smooth power fluctuation of PV [12,13]. At present, power-based energy storage represented by the supercapacitor and energy-based energy storage represented by the battery have been practically applied in the microgrid [14]. The lithium battery can effectively smooth the low frequency power fluctuation, but when the high frequency power fluctuation occurs, it will cause a large life loss of the lithium battery [15]. Using a supercapacitor as the energy storage system for smoothing can respond to high-frequency and high-power fluctuations in time. However, a supercapacitor cannot meet the long-term energy compensation because of their high cost and small capacity compared with lithium battery [16,17,18]. Therefore, the HESS composed of a lithium battery and supercapacitor can not only reduce the pressure of lithium battery [19], but also extend the service life of the lithium battery [20,21]. From an economic point of view, it can reduce the annual total input cost and annual life loss cost compared with the single ESS [22].
Overall, the study of the HESS capacity configuration considering grid-connected PV system is subject to the following limitations. (1) The current research only focuses on how to smooth the power fluctuation of PV to meet grid connection requirements, the capacity optimal configuration of HESS is ignored. (2) Nowadays, most studies adopt various frequency division methods to achieve power distribution of lithium battery and supercapacitor in HESS. However, there is no clear basis for the selection of high and low frequency cutoff point. (3) Only the economic cost of HESS under normal conditions is considered, and the coupling between the life decay of battery and input cost of HESS under different operating conditions is neglected.
In view of the shortcomings of the existing research, a capacity optimal allocation method and frequency division EMS for HESS considering grid-connected requirements in PV systems. The main contents of this study are as follows: Section 1 introduces the research status of control strategies to smooth the power fluctuation of PV at home and abroad. Section 2 describes the power distribution between the individual units of the system and the design of the overall control strategy. Section 3 describes the control strategy for smoothing the power fluctuation of PV. Section 4 introduces the capacity optimal allocation method and frequency division EMS of HESS. The results and discussion are presented in Section 5. Section 6 is the conclusions.

2. Grid-Connection of PVPS Connected with HESS

2.1. Grid Connection Topology of PV System Connected with HESS

The active power will be generated by the PVPS and then flows into the DC bus through the DC-DC converter when the solar light conditions meet the power generation requirements of the PVPS. When the power fluctuation of the PVPS is detected to exceed the limit, the battery and supercapacitor will be connected to the DC bus through the bidirectional DC-DC converter to absorb or compensate for the excess power [23]. Finally, the PV power meeting the requirements of grid-connection is transmitted to the grid through the DC-AC inverter. Among them, PV is the main power generation unit, and the HESS plays the role of peak shaving and valley filling. The grid-connected topology of the PVPS connected with HESS as shown in Figure 1.
The relationship between the individual unit powers in Figure 1 can be expressed as:
P grid ( t ) + P Load _ AC ( t ) + P Load _ DC ( t ) = P pv ( t ) + P bat ( t ) + P sc ( t )
where P Load _ AC t and P Load _ DC t represent the power consumption of AC load and DC load, respectively; P bat ( t ) and P sc ( t ) represent the output power of battery and supercapacitor, respectively; P pv ( t ) and P grid ( t ) represent the PV active power after and before grid connection, respectively. In particular, the HESS power P HESS ( t ) = P bat ( t ) + P sc ( t ) [24,25].

2.2. Overall Design of Control Strategy

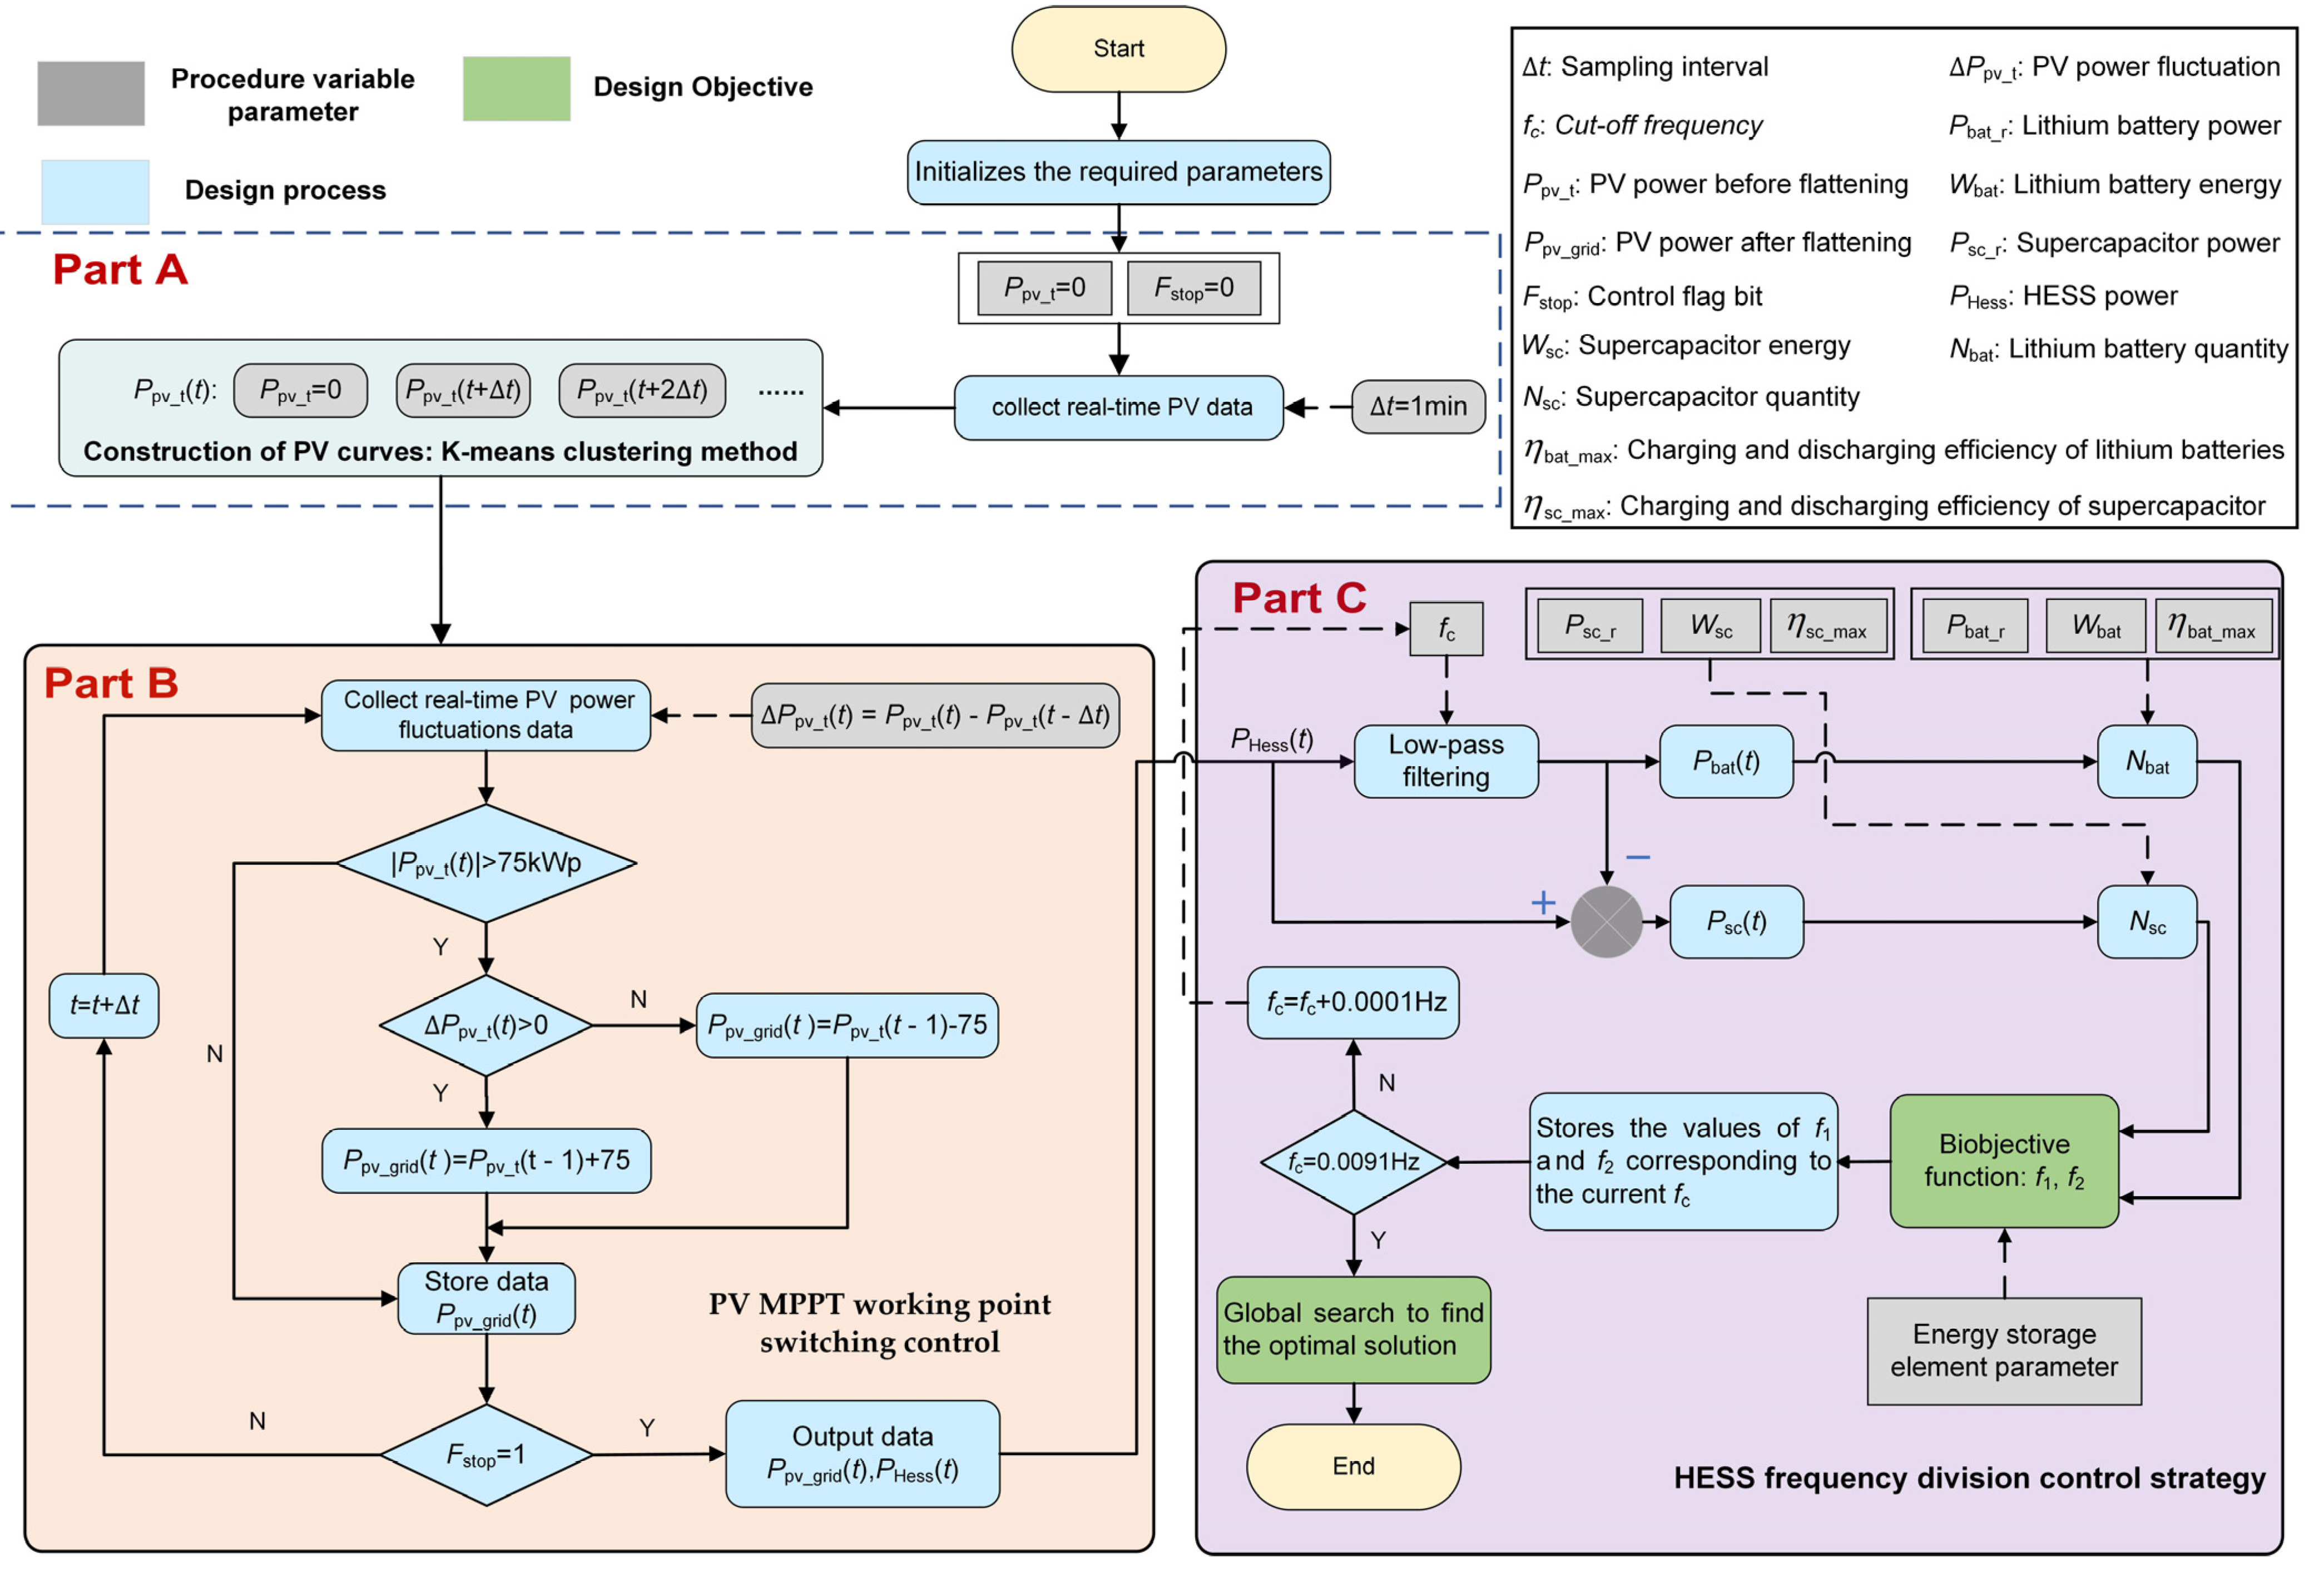
As the active power fluctuation of PVPS strongly with changes in temperature and light intensity, HESS and PV are usually used to coordinate and cooperate to smooth the power fluctuation of PV. In the control process, it is necessary to consider whether the power fluctuation of PV meets the operation requirements of grid connection, and whether the capacity configuration of battery and supercapacitor meets the optimization criteria in terms of economy and performance [26]. Figure 2 shows the overall control strategy.
The detailed steps are as follows:
  • Initializing each required parameter, and the real-time power fluctuations of PV are obtained by using the K-means clustering method introduced in Section 5. Setting the flag bit F stop to zero. When F stop = 0 , the PV power has not been smoothed on the day and the data for the next time period need to be updated. When F stop = 1 , the PV power has been smoothed that day and the grid-connected power after smoothing can be output. (Corresponds to Part A, Figure 2).
  • The MPPT switching control described in Section 3 is adopted to effectively smooth the power fluctuation of PV and finally make it meet the grid connection requirements. (Corresponds to Part B, Figure 2).
  • The dual objective functions f 1 and f 2 are established based on the minimum annual input cost of HESS and the minimum annual life loss cost of lithium battery. Setting the initial value of independent variable f c is 0.001 Hz (the cutoff frequency range of HESS is selected in Section 4).
  • According to the proposed HESS frequency division control strategy, the power distribution and energy distribution of the battery and supercapacitor are obtained.
  • According to the two indicators of power and energy, the target value and the size of the capacity configuration are determined, and the data of the current iteration are stored.
  • Determining the size of the cutoff frequency f c . If the f c is not equal to 0.0091 Hz, the value of the updated f c is increased by 0.0001 Hz and steps 3 to 5 are repeated. If f c is equal to 0.0091 Hz, the update iteration of f c is stopped, and all objective values in the database are globally optimized. (Step 3–6 correspond to Part C, Figure 2).
  • Outputting the value of the minimum target value and the corresponding cutoff frequency f c .

3. Control Strategy of Grid-Connected PV

3.1. Grid-Connected PV Requirements

Referring to the requirements for the power fluctuation of PVPS, the PV active power fluctuations should not exceed 10% of the installed capacity per minute [8,27,28]. The power fluctuation amount of PV at t time is Δ P pv ( t ) as shown in Equation (2):
Δ P pv ( t ) = P pv ( t ) P pv ( t Δ t )
where the data sampling interval Δ t is 1 min.
After the coordinated control of HESS, the power fluctuation of PVPS after grid connection should meet the following requirements:
Δ P pv ( t ) 10 % C pv
where the installed capacity of PVPS C pv is 750 kWp.

3.2. PV MPPT Working Point Switching Control

The control strategy is based on the real-time power fluctuation of PV, which makes the fluctuation range of PV power close to the constrained range by constantly switching between “MPPT mode” and “constant power mode”. The specific meaning is as follows:
First, the installed capacity is set based on the grid-connected requirements of the PVPS, and the allowable range of grid-connected PV power fluctuation is obtained, as shown in Equation (4).
P limit = 10 % C pv
where P limit represents the maximum power fluctuation range of PV, and its value is set to 75 kW.
Then, the power fluctuation amount of the current time period is obtained based on Equation (2), and compared with the specified maximum power fluctuation. The PV can be switched to MPPT mode if the real-time power fluctuation of PV is within the allowable range. A second judgment is made if the real-time power fluctuation exceeds its allowable range, the specific judgment basis is shown in Equation (5).
P grid ( t ) = P pv ( t Δ t ) + P limit P pv ( t ) P pv ( t Δ t ) P limit , , , Δ P pv > P limit , Δ P pv > 0 Δ P P limit Δ P pv > P limit , Δ P pv < 0
When the power fluctuation is less than 75 kW/min, it means that the current power meets the requirements of grid connection, and the control PVPS is transmitted to the grid according to the original maximum power. When the power fluctuation is greater than 75 kW/min, it is necessary to limit the power fluctuation of the PV. When the power fluctuation in this minute is greater than 75 kW, it means that the photovoltaic power surge is more violent, and it is necessary to control the maximum increase in photovoltaic power fluctuation by 75 kW, otherwise it cannot meet the grid-connected requirements. Similarly, when the power fluctuation within the minute is less than −75 kW, it means that the photovoltaic power drop is more violent, and the maximum reduction in the PV power fluctuation is 75 kW. Therefore, the control method proposed in this paper can make the grid-connected power follow the change of the original power to a large extent and avoid the problems of untimely power tracking leading to the decline of PV utilization and excessive capacity configuration of HESS.

4. Capacity Optimal Allocation Method and Frequency Division EMS for HESS

4.1. HESS Energy Characteristics

At present, most of the research is considered from the perspective of spectrum analysis and different frequency division methods to achieve the reasonable allocation of power in HESS, such as low-pass filtering, wavelet decomposition, sliding average filtering, and the Kalman filter algorithm. These methods decompose the power into high and low frequency signals, which the low-frequency signal is usually responded by the battery, and the supercapacitor are often adopted to respond to high-frequency signals.
However, it is worth noting that the cutoff frequency can determine the capacity allocation of the HESS, and further affect the input cost and dynamic performance of the HESS. In many studies, there is no clear basis for the selection of the high and low frequency cutoff point. On the other hand, the capacity constraint, life depreciation and input cost of HESS should be considered simultaneously as the impact factors of capacity allocation.
Therefore, a capacity optimal allocation method and frequency division control EMS for HESS is proposed. The specific control strategy is shown in Figure 2.
HESS power is the difference between the power before and after PV grid connection, which can be expressed as:
P HESS ( t ) = P grid ( t ) P pv ( t )
The power of lithium battery and supercapacitor can be expressed as:
P bat ( t ) = P HESS ( t ) 2 π f c 2 π f c + s
P sc ( t ) = P HESS ( t ) P bat ( t )
where f c is the cutoff frequency of the HESS.
The constraints of HESS capacity configuration mainly include charge–discharge efficiency and SOC. Specifically expressed as:
0.2 S O C bat 0.8 0.1 S O C s c 0.9 η bat , max η bat η bat , max η sc , max η sc η sc , max
where S O C bat and S O C sc are the capacities of battery and supercapacitor, respectively; η sc and η bat are the charging and discharging efficiencies of supercapacitor and battery, respectively. η sc , max and η bat , max are the maximum charge and discharge efficiencies of supercapacitor and battery, respectively.
The power response of battery and supercapacitor under the constraint of charge and discharge efficiency is as follows:
P bat _ r ( t ) P bat ( t ) η bat , max       ,       P bat ( t ) > 0 P bat ( t ) η bat , max           ,           P bat ( t ) < 0
P sc _ r ( t ) P sc ( t ) η sc , max       ,       P sc ( t ) > 0 P sc ( t ) η sc , max           ,           P s c ( t ) < 0
where P bat _ r ( t ) is the battery power under charge and discharge constraints, P bat t   <   0 represent lithium battery is charging; P bat t   >   0 represent lithium battery is discharging; P sc _ r ( t ) is the supercapacitor power under the charge and discharge constraints, P sc t   <   0 represent supercapacitor is charging; P sc t   >   0 represent supercapacitor is discharging.
Thus, the energy response of the battery and supercapacitor are expressed as:
W bat ( t ) = t = Δ t , 2 Δ t , P bat _ r ( t ) P bat _ r ( t Δ t ) Δ t W sc ( t ) = t = Δ t , 2 Δ t , P sc _ r ( t ) P sc _ r ( t Δ t ) Δ t
where W bat ( t ) represent the energy of the battery; W sc ( t ) represent the energy of the supercapacitor. As the capacity allocation results is determined by the energy and power of HESS, the capacity allocation should meet the following requirements:
  • meeting the maximum required power response;
  • meeting the requirement of maximum supply or storage energy.
According to the above two constraints, the number of battery and supercapacitor configurations can be obtained as follows:
N bat = max max P bat _ r ( t ) P bat cell , W bat max W bat min D O D bat W bat cell
N sc = max max P sc _ r ( t ) P sc cell , W sc max W sc min D O D sc W sc cell
where N bat and N sc are the number of battery and supercapacitor configurations, respectively; D O D bat and D O D sc are the discharge depths of the battery and the supercapacitor, respectively. Here, D O D bat is 0.6 and D O D sc is 0.8. W bat cell and P bat cell are the maximum capacity and power of a single battery, W sc cell and P sc cell are the maximum capacity and power of the supercapacitor, respectively.

4.2. Cutoff Frequency Range

The lithium battery and the supercapacitor exhibit different characteristics in terms of the energy density and the power density. The lithium battery has a higher energy density than the supercapacitor, while the supercapacitor has an advantage in terms of power density. In order to avoid defects such as rapid life decay and excessive configuration volume of lithium battery, the cutoff frequency range of lithium battery is determined based on the reported specific concept [29]. The concept is represented as:
f c [ Hz ] = ρ power [ W / kg ] ρ energy [ Wh / kg ]
where ρ energy and ρ power represent the energy density and power density of battery. Figure 3 shows the Ragone diagram of the lithium battery. The energy density range is 10–213 kW/kg and the power density range of lithium battery is 10–1950 W/kg. According to Equation (15), it can be determined that the cutoff frequency is 0.001–0.0091 Hz.

4.3. Construction of Objective Function

Usually, the input cost of HESS and the life loss of lithium battery are the main research hotspots. This paper aims to find out the minimum annual input cost and life loss cost by establishing the objective functions f 1 and f 2   , respectively. Therefore, the objective function f 1 is expressed as follows:
min f 1 = C bat invs + C sc invs + C bat oper + C sc oper
where C bat invs and C sc invs are the investment cost of battery and supercapacitor, respectively; C bat oper and C sc oper are the operation and maintenance costs of battery and supercapacitor, respectively.
In order to get the annual input cost of HESS, the capital recovery factor (CRF) is defined as:
C R F = z ( 1 + z ) L bat z ( 1 + z ) L bat 1
where z represents the discount rate; L bat represents service life of the lithium battery. Thus, the annual investment cost of lithium battery and supercapacitor can be expressed as follows:
C bat invs = C R F ( k bat in _ p N bat P bat cell ) + ( k bat in _ w N bat W bat cell ) C sc invs = C R F ( k sc in _ p N sc P sc cell ) + ( k sc in _ w N sc W sc cell )
where k bat in _ w and k bat in _ p represent investment cost per unit capacity and per unit power of lithium battery; k sc in _ w and k sc in _ p represent investment cost per unit capacity and per unit power of supercapacitor, respectively. The operation and maintenance cost of lithium battery and supercapacitor are as follows:
C bat oper = C R F ( k bat op _ p N bat P bat cell ) + ( k bat op _ w N bat W bat cell ) C sc oper = C R F ( k sc op _ p N sc P sc cell ) + ( k sc op _ w N sc W sc cell )
where k bat op _ p and k bat op _ w are the operation and maintenance cost per unit power and per unit capacity of lithium-ion battery, and k sc op _ p and k sc op _ w are the operation and maintenance cost per unit power and per unit capacity of supercapacitor, respectively.
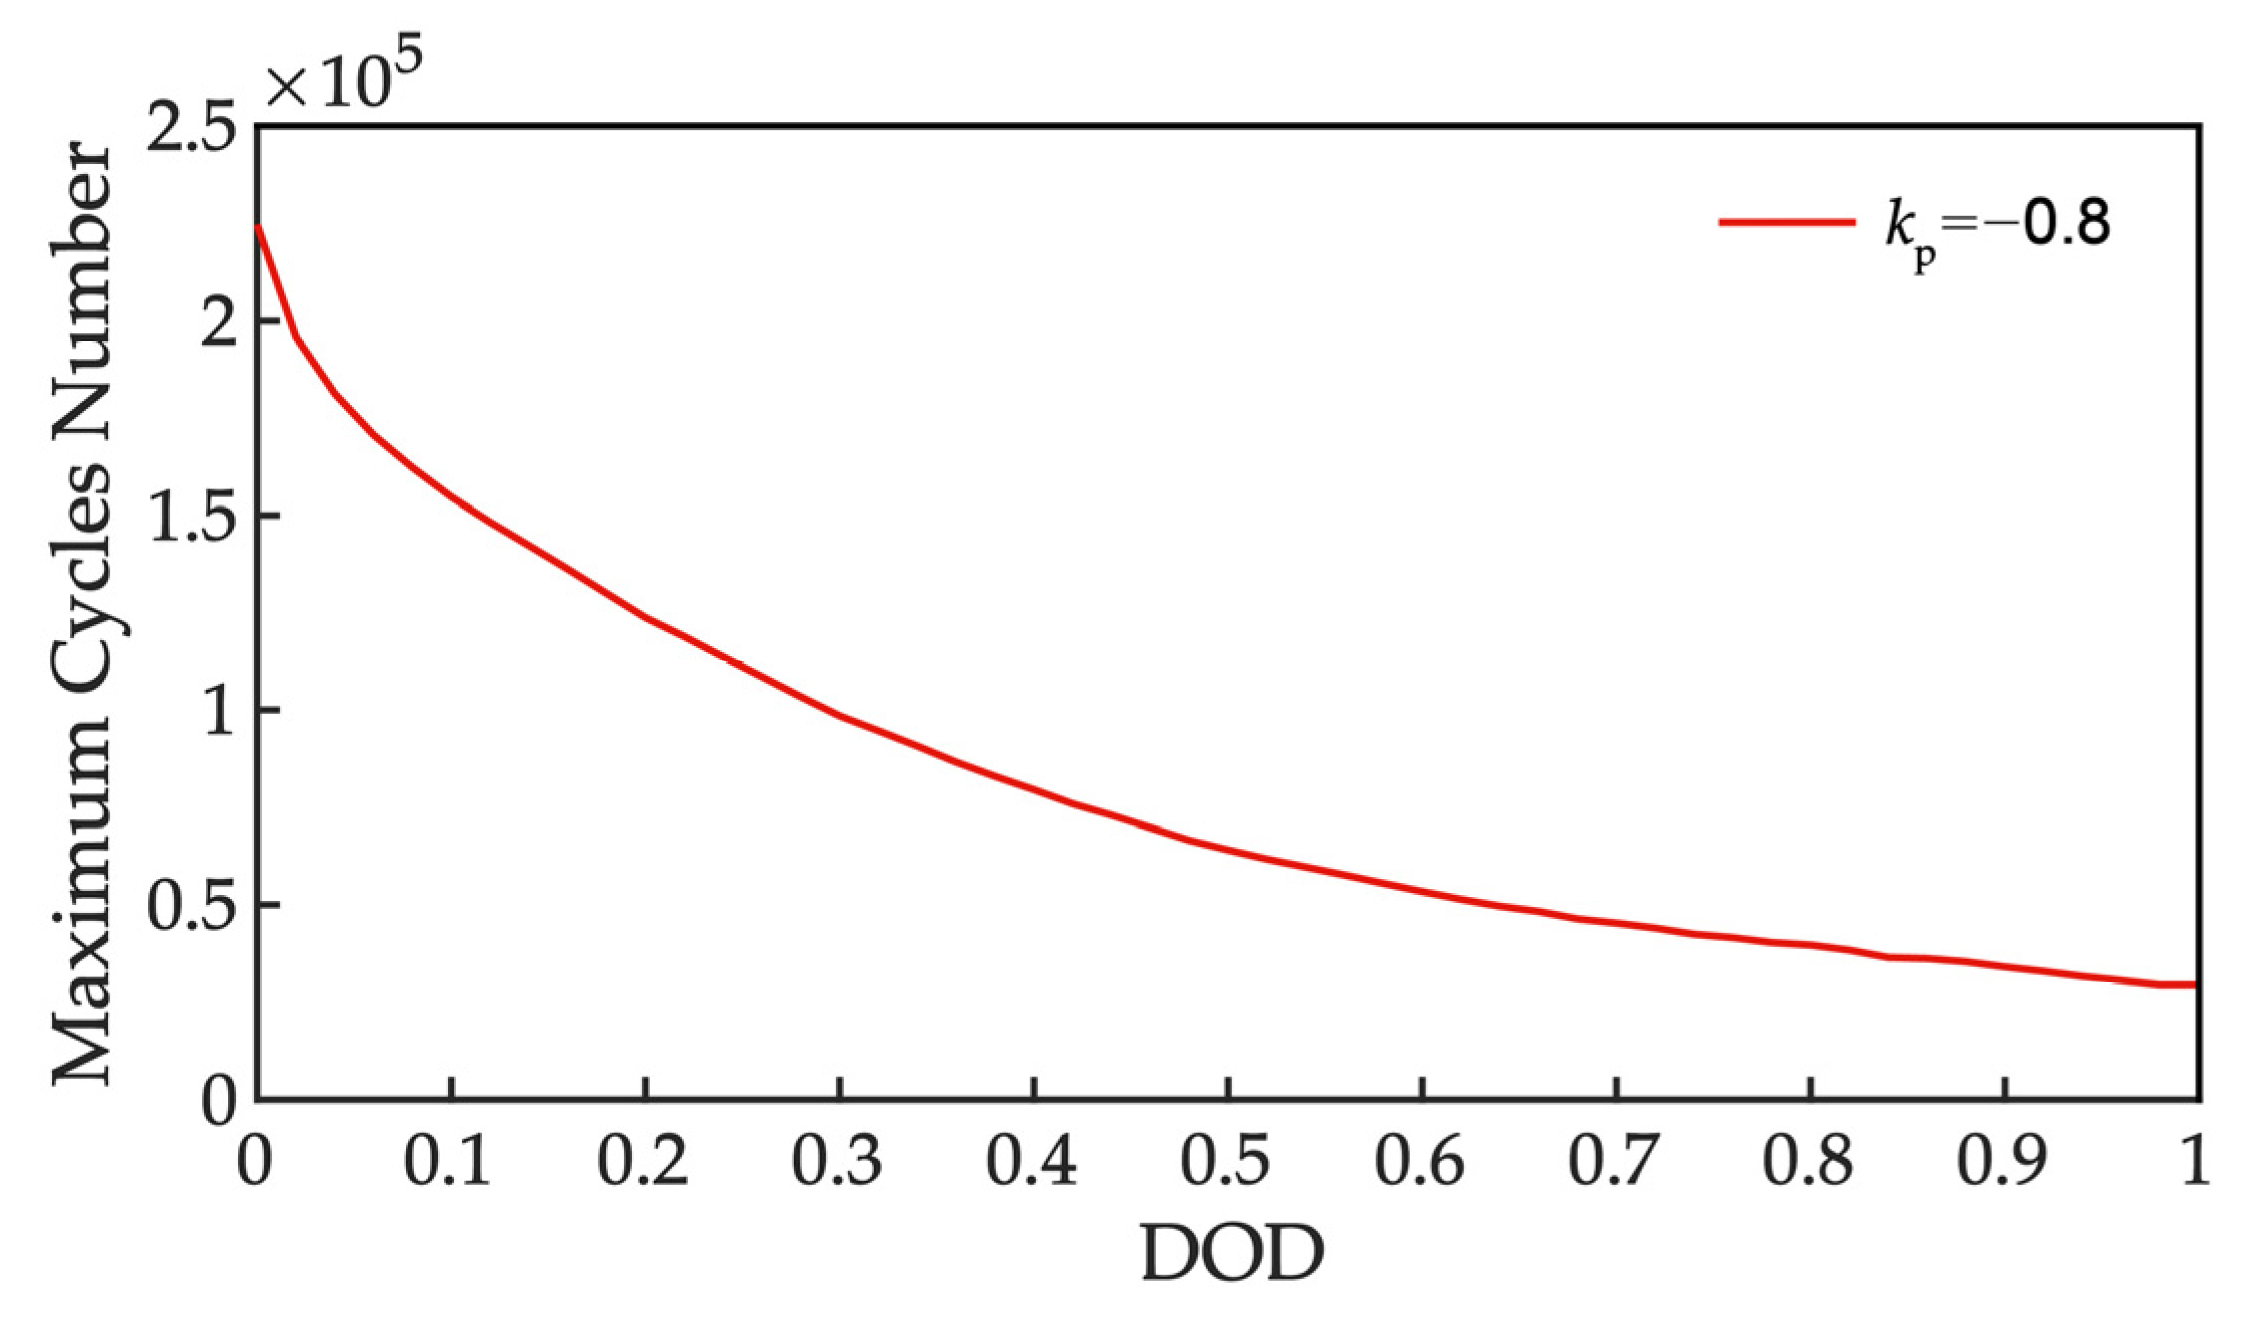
The depth of discharge (DOD) of lithium battery will directly determine its service life. In order to simplify the analysis, only the influence of DOD on battery attenuation degree is considered. Figure 4 shows the relationship between DOD and the maximum cycle number (MCN) of lithium battery. The DOD is closer to 100%, and the MCN of lithium battery is smaller. The relationship between the two can be expressed as:
N ( τ ) = N cycle , 100 % ( τ ) k p
where τ is the DOD of the lithium battery; N ( τ ) represents the MCN of the lithium battery when DOD is τ ; Ncycle,100% is the MCN when the DOD of the lithium battery is equal to 100%; k p is a constant from 0.8 to 2.1. The specific value is related to the parameters of the battery and can be obtained by curve fitting according to the battery’s data sheet [30,31].
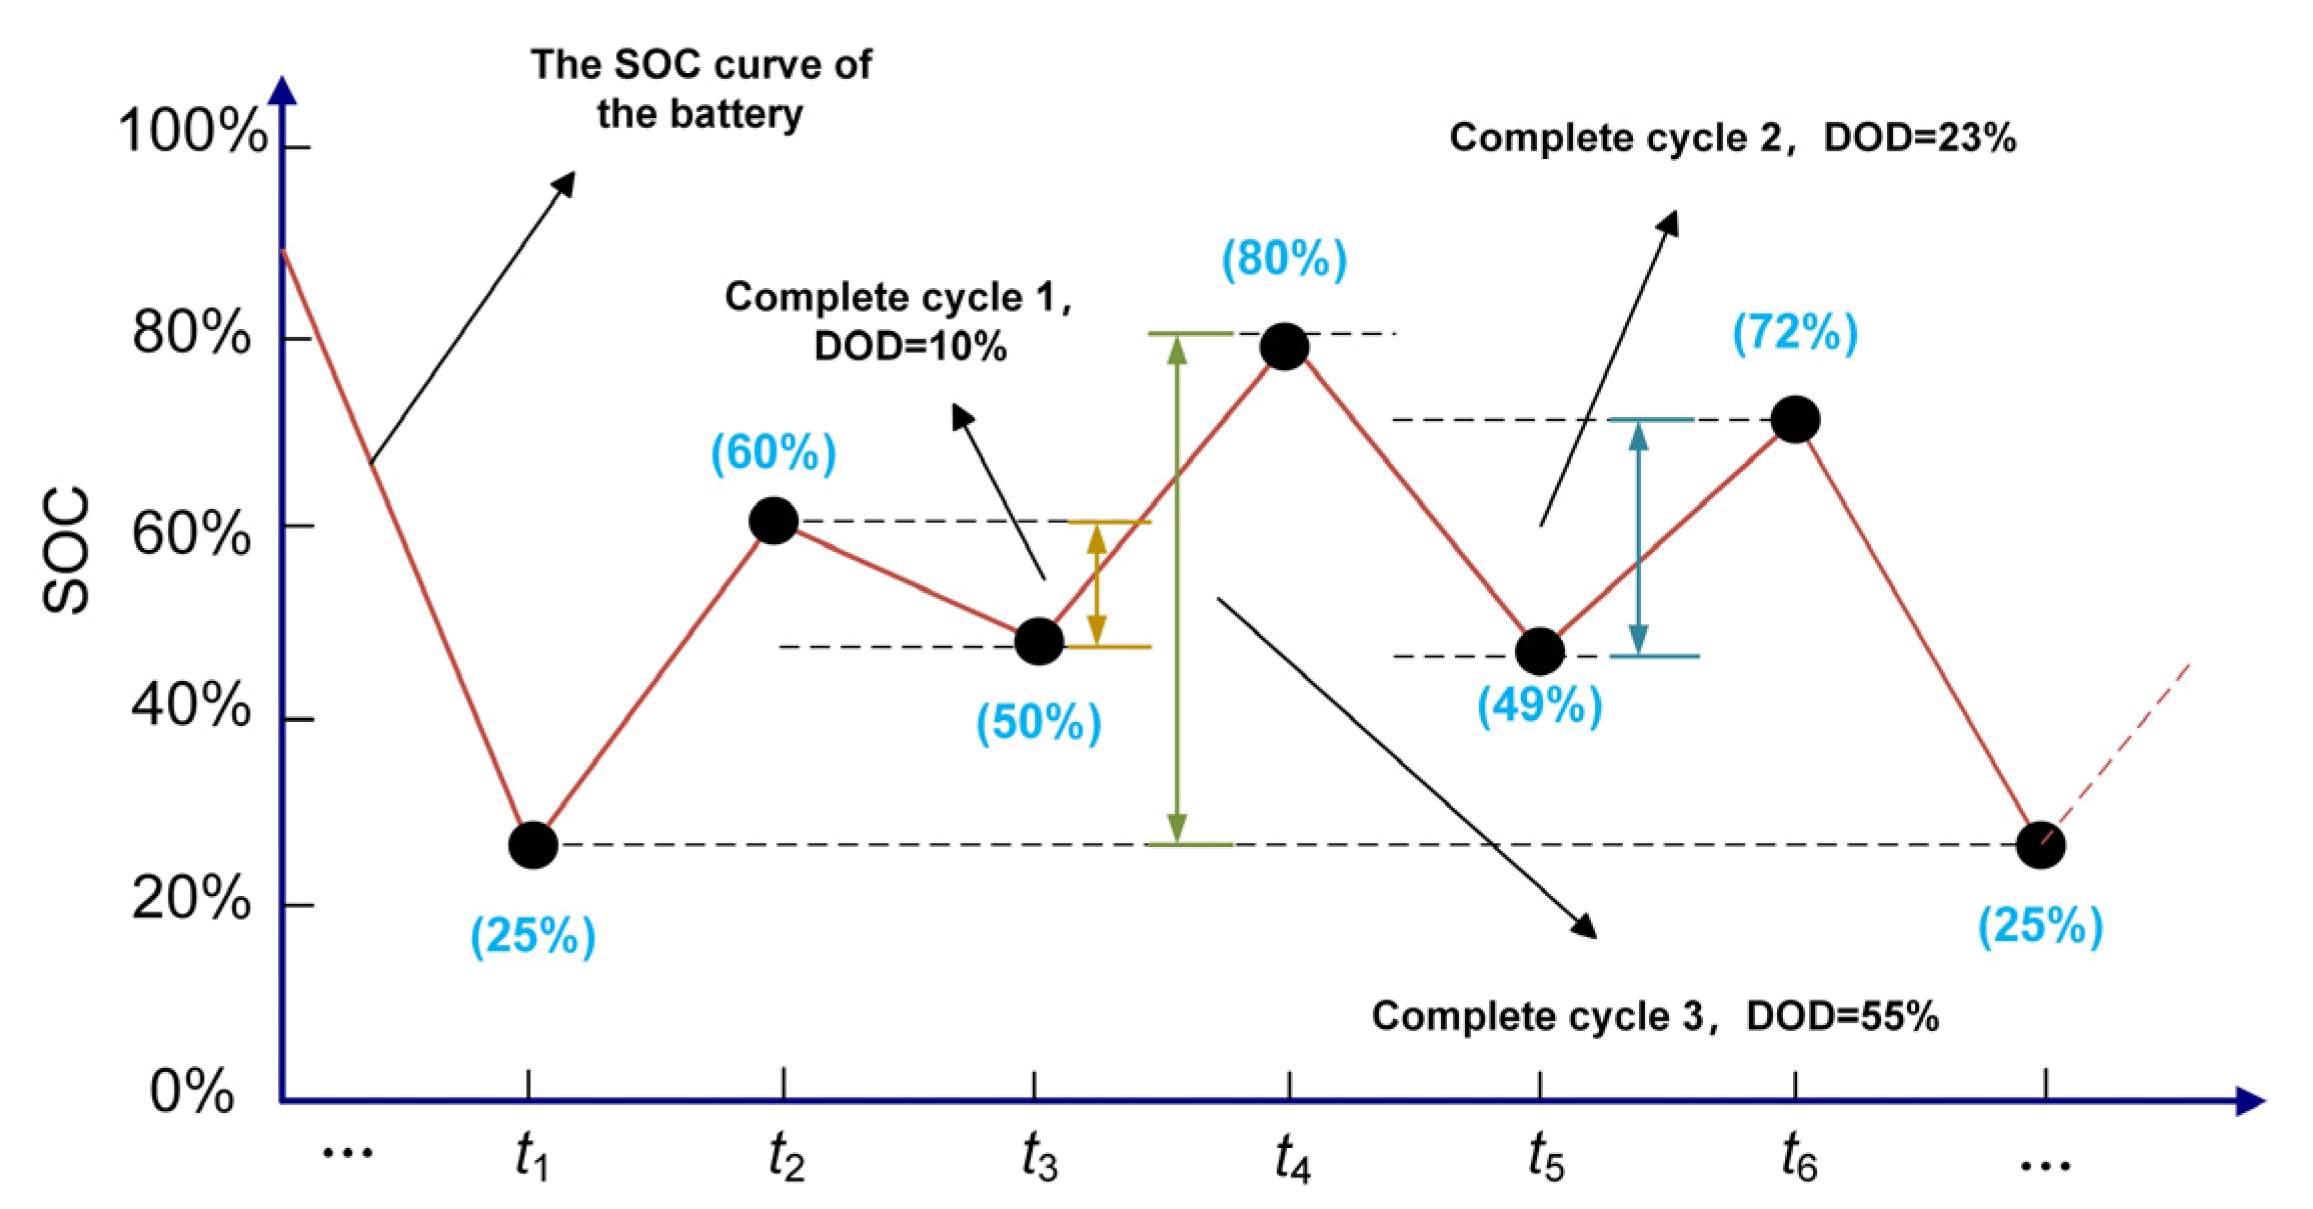
In the actual operation of the energy storage battery, it is difficult to ensure the values of two adjacent maximum points or minimum points on the SOC curve are exactly the same since SOC changes dynamically, so as to form a complete charge and discharge cycle. According to the actual operation of the battery to smooth the PV power fluctuation, the rainflow counting algorithm (RCA) is adopted to convert the incomplete charge and discharge cycle of the battery into a complete charge and discharge cycle under different DOD in this paper. Figure 5 shows the principle of counting the complete charge and discharge cycle of the battery using RCA. The red curve in the figure is the SOC curve of the battery in the typical power fluctuation scenario of the PV, and the black dot represents the maximum or minimum point on the SOC curve. During battery charging and discharging, the DOD of the complete cycle 1 is 10%, and the DOD of the complete cycle 2 is 23%. Cycle 3 has a DOD of 55%.
Thus, the life loss F loss of lithium battery in one day and the objective function f 2 based on the minimum annual life loss cost of lithium battery can be expressed as follows:
F loss = i = 1 , 2 , 3 , 1 N ( τ i )
f 2 = k scenario 365 ρ i k bat in _ w N bat W bat cell F loss C R F
where i is the day of the year and takes the value 1–365; τ i is the DOD on a day; ρ i is the proportion of different weather conditions in a year.

5. Results and Discussion

5.1. Construction of Typical PV Power Fluctuation Scenarios

The 750 kWp PVPS was analyzed using the k-means clustering approach to further assess the power fluctuation at the PVPS throughout the year. The effective power generation time of PVPS is 6:00 to 18:00. Four indexes are established to quantitatively evaluate the power fluctuation of PVPS.
The daily cumulative power fluctuation M1 is the key performance index to judge the impact of PV power generation on the power grid. The greater M1, the greater the impact on the power grid. M1 can be written as follows:
M 1 = 6 : 00 18 : 00 Δ P pv ( t ) Δ t
The daily power fluctuation variance M2 of PVPS is used to indicate the overall fluctuation of the daily power generation of PVPS. The greater M2, the greater the overall volatility of PV. M2 can be expressed as follows:
M 2 = 1 720 6 : 00 18 : 00 Δ P pv ( t ) Δ P pv ¯ 2
where Δ P pv ¯ is the average value of the power fluctuation of the PVPS from 6:00 to 18:00 a day.
In Section 3, the allowable fluctuation range of the grid-connected power of PVPS per minute is ±10% of the installed capacity. According to this standard, the number of daily power fluctuations M3 of the PVPS can be calculated. This characteristic quantity may reflect the number of PV grid-connected power failures, as well as the frequency of occurrence. M3 can be expressed as:
M 3 = 6 : 00 18 : 00 θ ( t ) θ ( t ) = 1 , Δ P pv ( t ) 10 % C pv 0 , Δ P pv ( t ) < 10 % C pv
where θ ( t ) is 0–1 variable, and its actual value is determined according to the size of Δ P pv ( t ) .
The maximum daily power fluctuation M4 of the PVPS is the maximum value of the real-time power fluctuation in a day, and M4 can be expressed as:
M 4 = max Δ P pv ( t ) , t 6 : 00 18 : 00
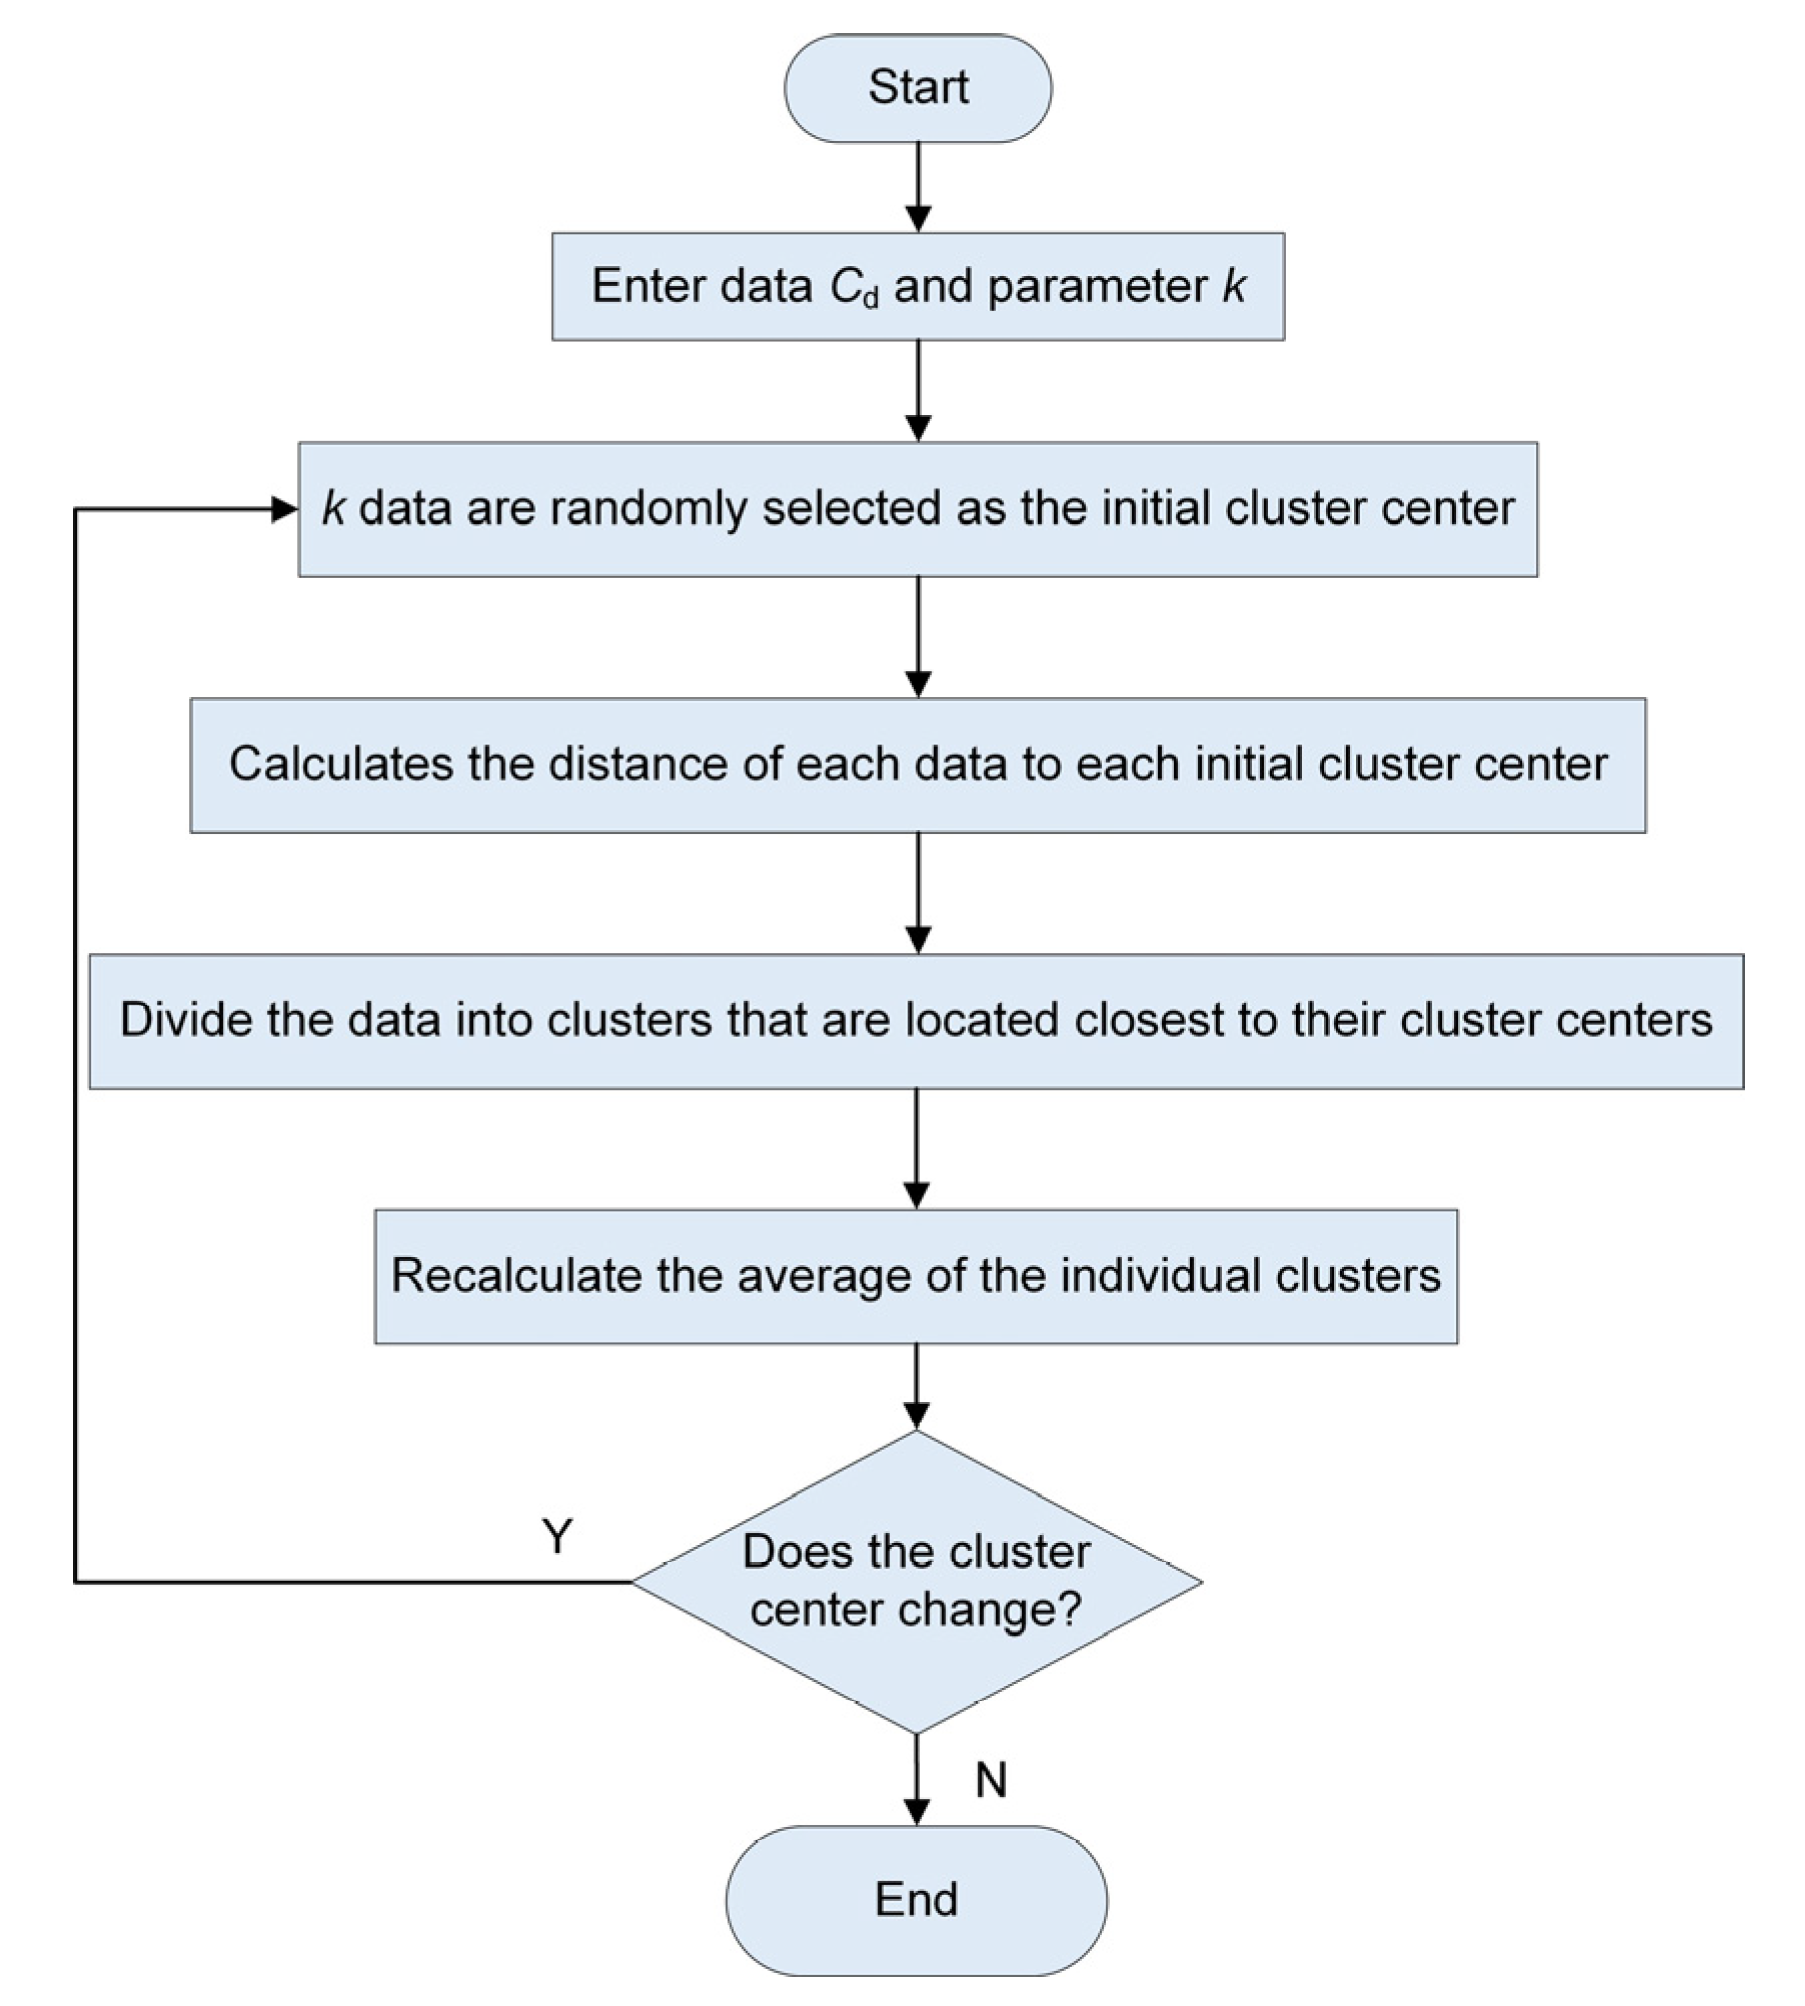
In summary, the power fluctuation of PVPS on day d can be described by the characteristic vector C d = M 1 , M 2 , M 3 , M 4 . Further, the annual eigenvector values of PVPS can be calculated: C 1 ,   C 2 ,   C 3 , ,   C 365 . After normalizing each eigenvector, the K-means clustering algorithm is used to perform cluster analysis on the obtained eigenvectors. The analysis process is as follows:
  • Enter the parameter C d and the parameter k.
  • k data are randomly selected in the dataset as the initial cluster center.
  • Calculate the distance between each data and each initial clustering center, and divide the other data into the class where the nearest clustering center is located.
  • Calculate the cluster center points of the divided clusters and compare these with the initial data and update.
  • The above process is iterated in the subsequent calculation until the data are no longer updated. The clustering process is shown in Figure 6.
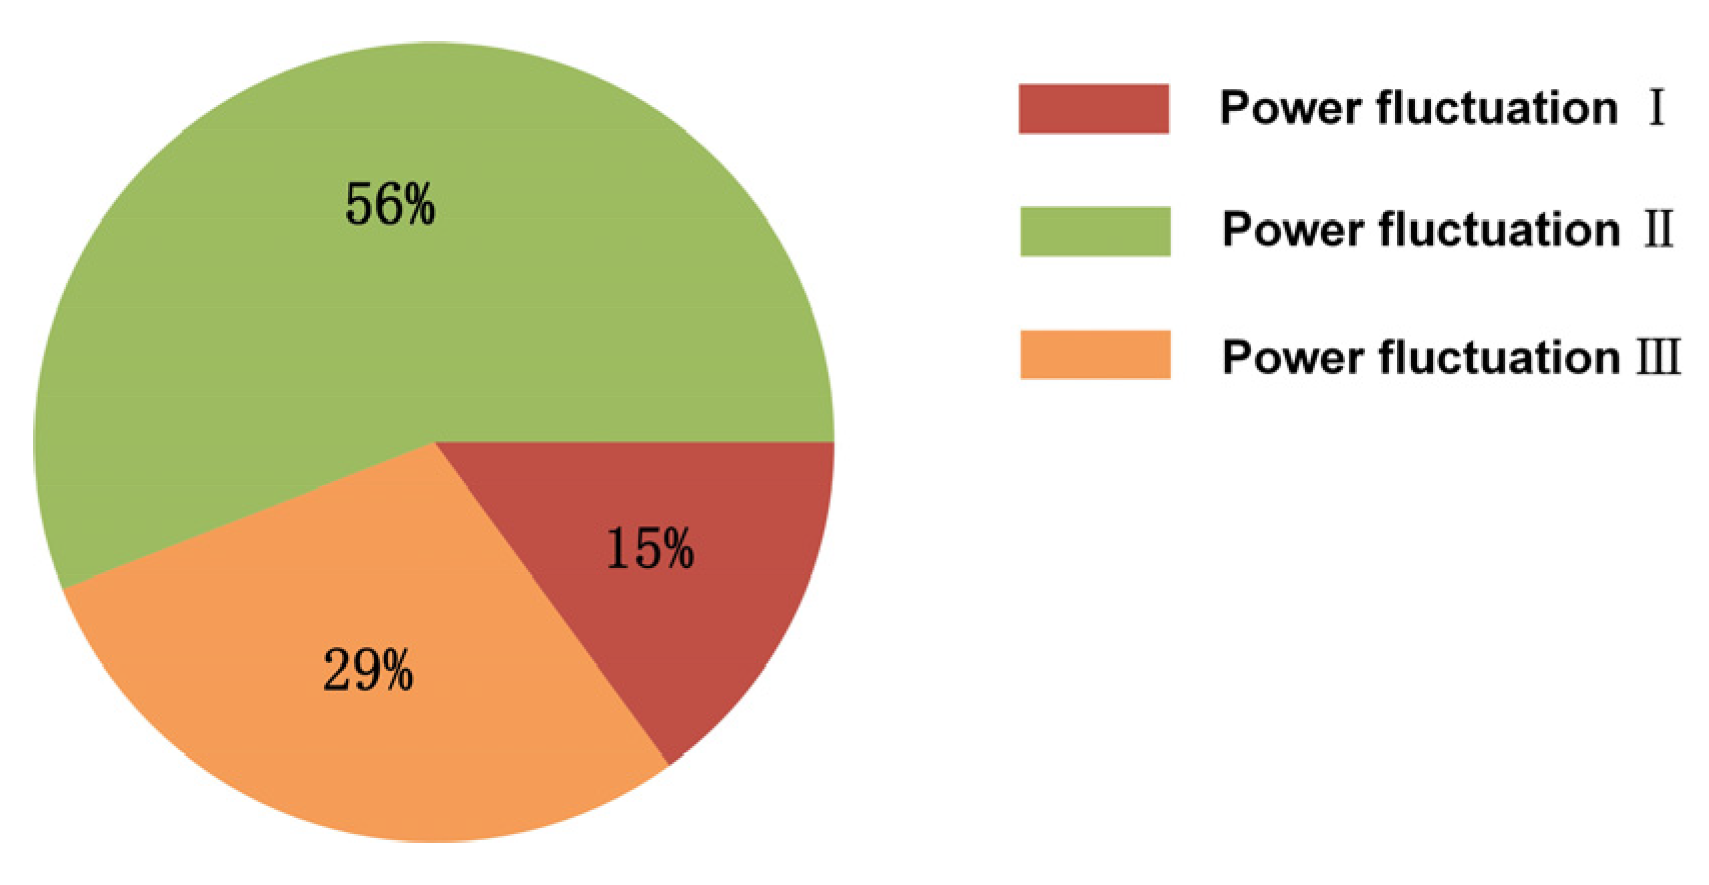
The power fluctuation curves of the PVPS throughout the year are clustered, and the distribution of three typical PV power fluctuation scenarios in the whole year is shown in Figure 7. The power fluctuation of PV is ranked from small to large, and three typical PV power fluctuation scenarios throughout the year were constructed, as shown in Figure 8. From the distribution in Figure 7, the PV power in Figure 8a has a low fluctuation, accounting for only 15% of the whole year. The remaining two PV generation scenarios have large power fluctuations, among which the scenario in Figure 8b accounts for the largest proportion of generation days throughout the year, accounting for about 56%. The PV power fluctuation in Figure 8c is the strongest, accounting for about 29%.

5.2. The Power Fluctuation of PVPS

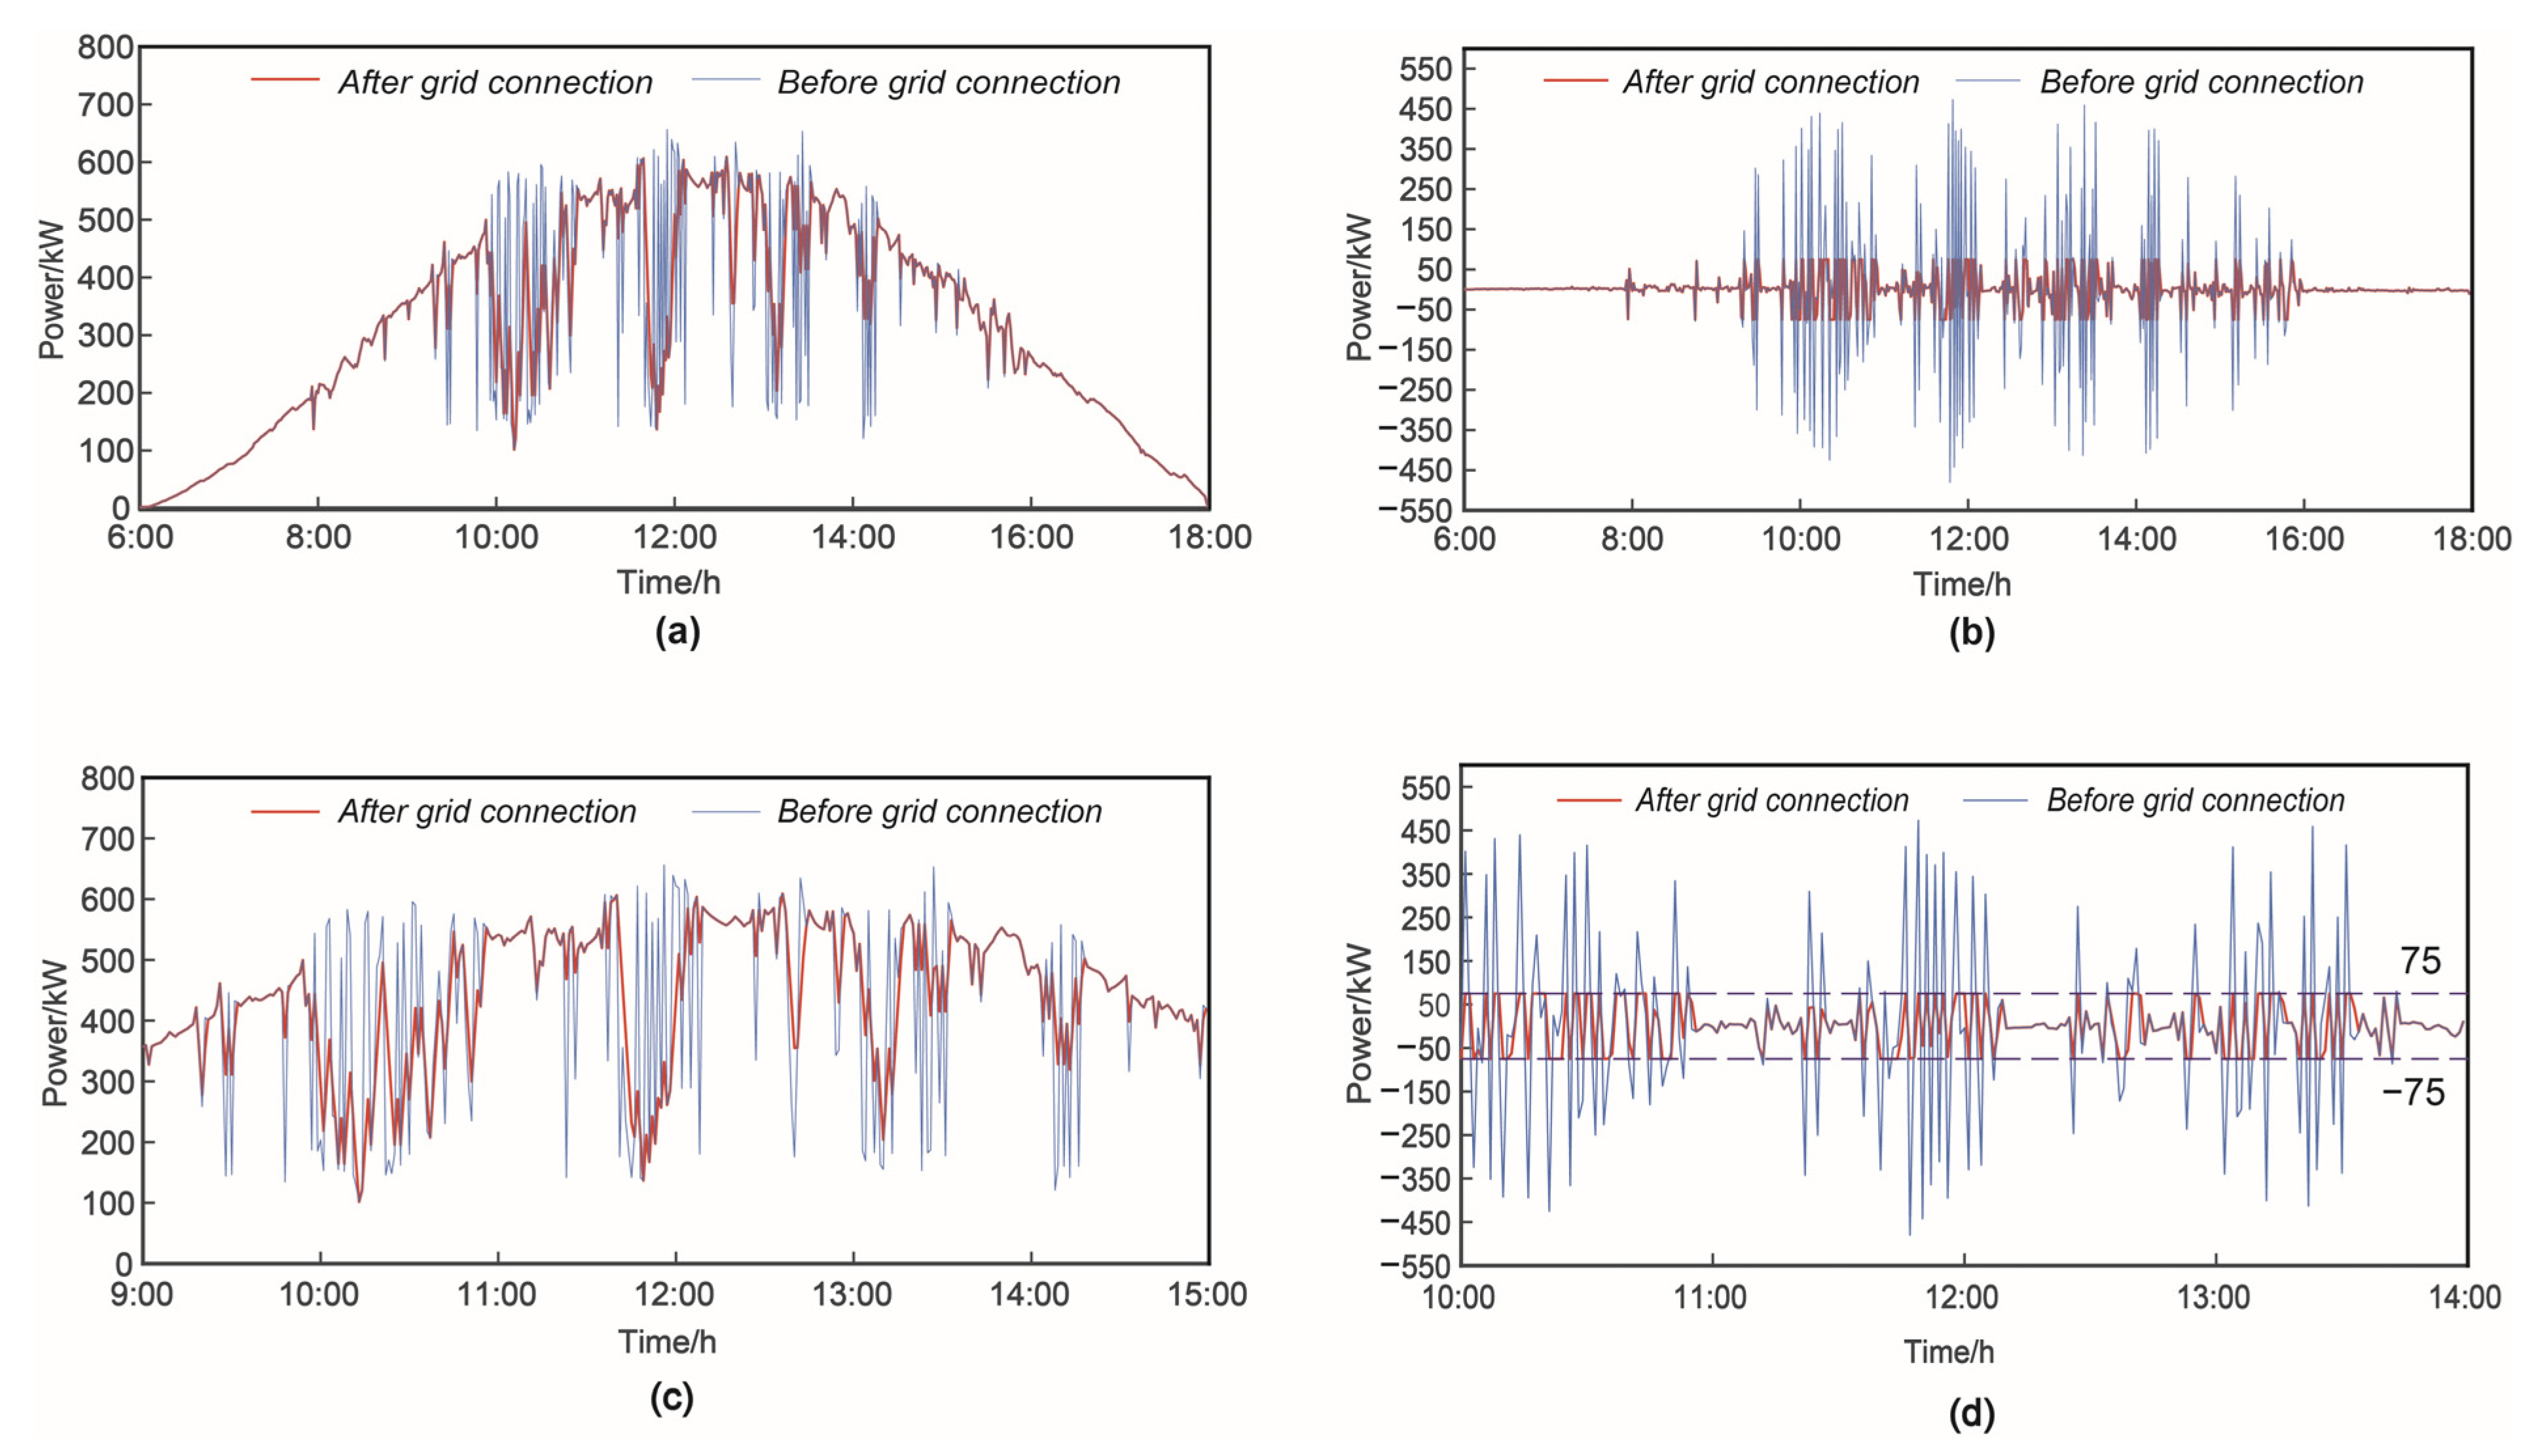
Taking the power fluctuation scenario 3 as an example, the grid-connected PV power after smoothing measures is shown in Figure 9a, and the power curve from 9:00 to 15:00 is enlarged and displayed in Figure 9c. The results indicate that the power fluctuation of PV has been clearly reduced through the coordination of PV and HESS. In order to see the smoothing effect of PV more directly, the amount of power fluctuation of PV at t time before and after grid-connection is compared, as shown in Figure 9b. The power curve is amplified from 10:00 to 14:00, as shown in Figure 9d. The blue curve is the amount of power fluctuation per minute before grid connection, which far exceeds the requirements for grid-connected power fluctuation in Equation (3). After adopting the proposed smooth strategy, the amount of power fluctuation is controlled within the range of ±75 kw/min. Finally, it meets the requirements of grid-connected PV and also verifies the availability and validity of the proposed strategy. The detailed parameters of PVPS are shown in Table 1.

5.3. HESS Power

The power curve of HESS is obtained by Equation (6), as shown in Figure 10. The power fluctuations of HESS are mostly in the range of −400–350 kW, and from a frequency domain perspective, HESS mainly responds to the signals with medium and high frequencies. The parameter settings of the HESS are shown in Table 2.

5.4. Objective Function Solution

The annual input cost of HESS is shown in Figure 11a. According to the results, the annual input cost of HESS shows a large downward trend with the increase in the cutoff frequency f c . In order to observe the relationship with the annual life loss rate of lithium batteries, the Pareto solution is established, as shown in Figure 11c. Regarding this result, there are multiple optimal solutions for the Pareto solution front. Thus, the annual life loss cost of the lithium battery could be obtained according to Equation (22), as shown in Figure 11b. As the cutoff frequency f c increases, the annual life loss cost of lithium battery has a relatively obvious upward trend, and the two cost indicators show a negative correlation trend.
Therefore, the two costs are considered to be combined and converted into the annual comprehensive cost of HESS, as shown in Figure 11d. The results show that with the increase in the cutoff frequency f c , the annual comprehensive input cost of HESS shows a downward trend. When f c   = 0.0066 Hz, the curve has an inflection point and an upward trend begins. From this, it can be determined that when f c = 0.0066 Hz, the annual comprehensive input cost of HESS satisfies the minimum. The specific capacity configurations of HESS are shown in Table 3.

5.5. Power and SOC Variation for Lithium Battery and Supercapacitor

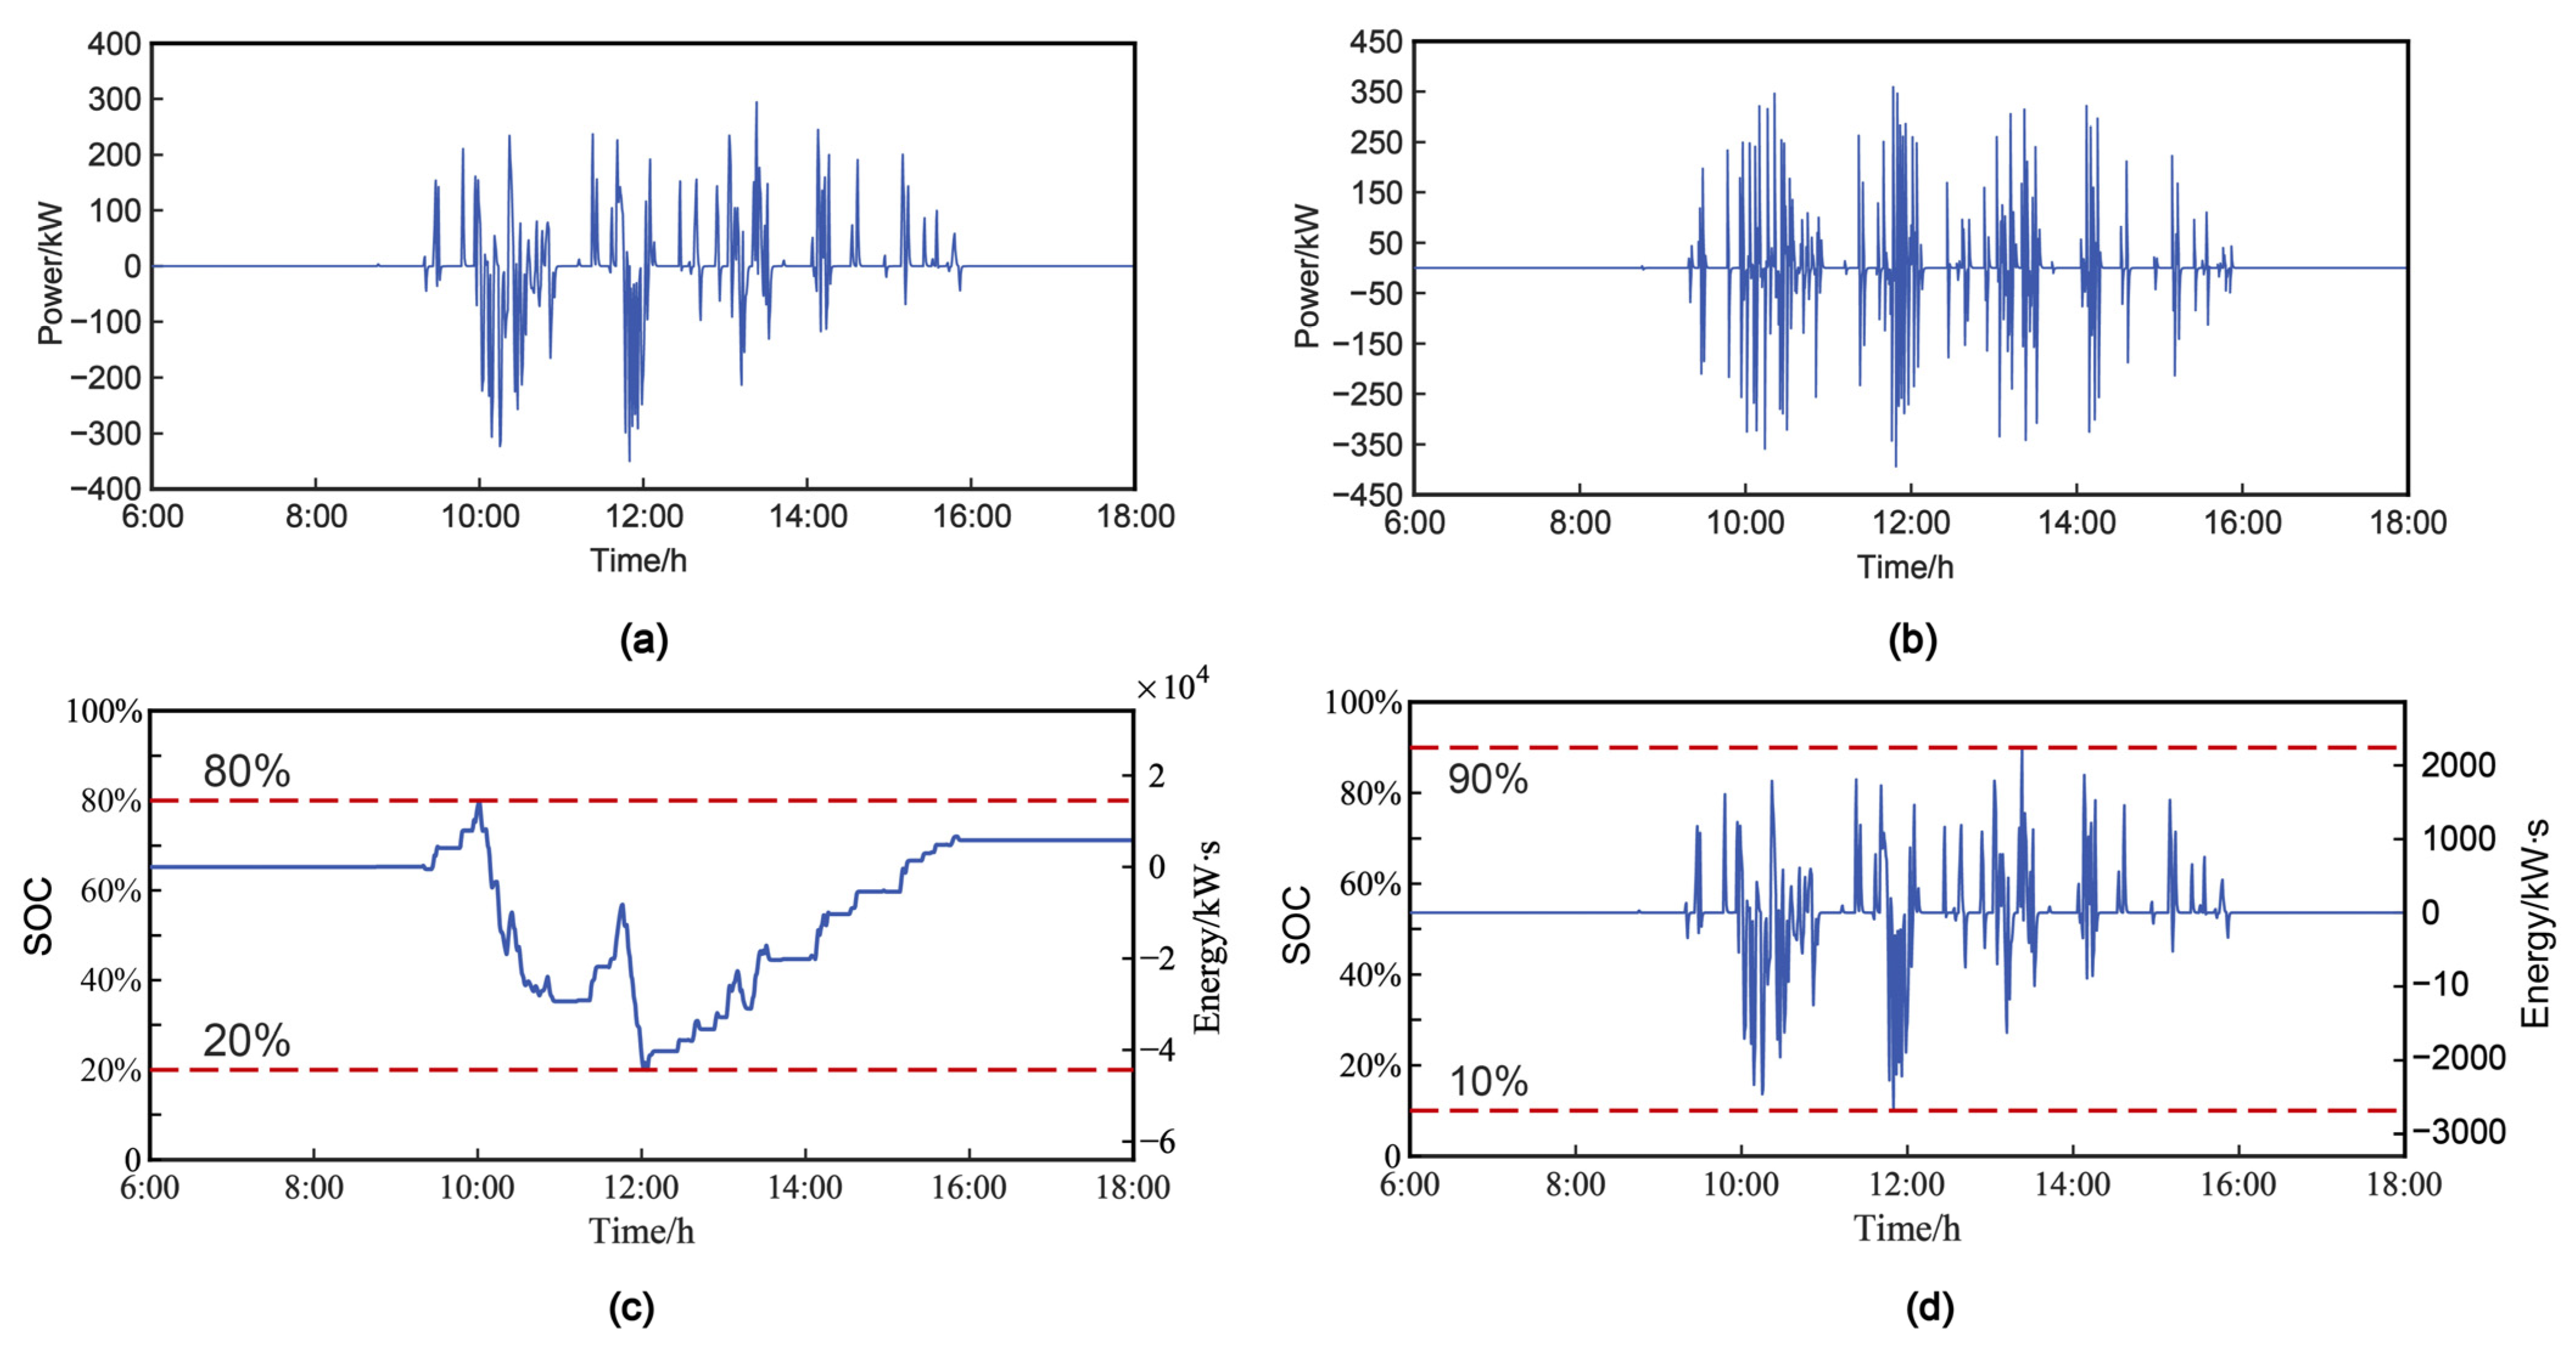
The power curve of lithium battery is shown in Figure 12a, which bears more energy components in the process of smoothing the PVPS power fluctuation and responds to the low-frequency power signal. The power curve of supercapacitor is shown in Figure 12b, which bears more power components in the process of smoothing power fluctuations and responds to the power response of high frequency for a short time. Figure 12c,d shows the SOC change curves of lithium battery and supercapacitor, respectively. The initial capacity of the lithium battery is 65%, and the range of SOC change is controlled within 20–80%. The initial capacity of the supercapacitor is 55%, and the SOC change range is controlled within 10–90%. The SOC changes of the HESS are always guaranteed to be within the prescribed capacity constraints. Finally, it is verified that HESS can correctly allocate power according to subobjectives f 1 and f 2 at this cutoff frequency.

6. Conclusions

It is difficult for the PV power fluctuations to stay within grid-connected requirements due to the random, intermittent, and unpredictable nature of sunlight. An MPPT operating point switching control strategy is proposed in this study to switch between “MPPT mode” and “constant power mode” for PV active power. The over-limit power of PV can be quickly absorbed and compensated through HESS, and the PV power fluctuation finally meets the grid-connected requirements effectively. Compared with conventional filtering methods, this strategy improves the utilization rate of PV system power generation and greatly reduces the capacity allocation of HESS.
According to the characteristics of power and energy of each stored energy source, we proposed a capacity optimal allocation method and frequency division EMS for HESS. The Ragone of lithium battery diagram determines the cutoff frequency range, and both the annual input cost and the annual life loss cost of HESS are carefully taken into account. From the simulation results, the strategy correctly allocates the HESS power. The supercapacitor bears the high-frequency component in the process of smoothing power fluctuations, and the lithium battery bears the low-frequency component. Moreover, the charge and discharge power and SOC of the battery and supercapacitor are always within safety constraints. Finally, the target value is globally optimized within the specified range of independent variables, and the minimum annual comprehensive input cost of HESS and the optimal capacity allocation of HESS are achieved.
This study verified that the power fluctuation of PV can be effectively suppressed by the coordination of PV and HESS, so that the PV power can meet the demands of grid connection, and the optimal capacity allocation of HESS can be realized. In the research of grid-connected PV system with HESS, there are still many areas for improvement and innovation. For instance, the power generation of PVPS affects the overall capacity allocation under the light intensity in different seasons; the impact of PVPS on the power quality of the power grid before and after grid connection; the impact of real-time electricity prices for PV and HESS on overall input costs, etc. The further expansion of the optimization goal needs a more powerful algorithm. Further research could be carried out in these directions.

Author Contributions

Conceptualization, W.L. and R.J.; methodology, X.M.; software, R.J.; validation, R.J., W.L. and X.M.; formal analysis, G.Z.; investigation, R.J.; resources, W.L.; data curation, R.J.; writing—original draft preparation, R.J.; writing—review and editing, W.L.; visualization, W.L.; supervision, W.L.; project administration, R.J.; funding acquisition, W.L. All authors have read and agreed to the published version of the manuscript.

Funding

This research received no external funding.

Data Availability Statement

Can be provided by email if asked.

Conflicts of Interest

The authors declare no conflict of interest.

References

  1. Kong, L.; Yu, J.; Cai, G. Modeling, control and simulation of a photovoltaic/hydrogen/supercapacitor hybrid power generation system for grid-connected applications. Int. J. Hydrogen Energy 2019, 44, 25129–25144. [Google Scholar] [CrossRef]
  2. Wang, G.; Li, Z.; Li, J.; Wang, J.; Tian, H. Grid-connected resonance analysis of half-wavelength transmission system with wind power and photovoltaic power supply. Int. J. Electr. Power Energy Syst. 2022, 135, 107568. [Google Scholar] [CrossRef]
  3. Liang, H.; Han, X.; Yu, H.; Li, F.; Liu, Z.; Zhang, K. Transmission line fault-cause identification method for large-scale new energy grid connection scenarios. Glob. Energy Interconnect. 2022, 5, 362–374. [Google Scholar] [CrossRef]
  4. Guo, W.; Xu, W. Research on optimization strategy of harmonic suppression and reactive power compensation of photovoltaic multifunctional grid connected inverter. Int. J. Electr. Power Energy Syst. 2023, 145, 108649. [Google Scholar] [CrossRef]
  5. Silva, J.L.D.S.; Moreira, H.S.; dos Reis, M.V.G.; Barros, T.A.D.S.; Villalva, M.G. Theoretical and behavioral analysis of power optimizers for grid-connected photovoltaic systems. Energy Rep. 2022, 8, 10154–10167. [Google Scholar] [CrossRef]
  6. Shivashankar, S.; Mekhilef, S.; Mokhlis, H.; Karimi, M. Mitigating methods of power fluctuation of photovoltaic (PV) sources—A review. Renew. Sustain. Energy Rev. 2016, 59, 1170–1184. [Google Scholar] [CrossRef]
  7. Zhang, J.; Hou, L.; Diao, X.; Yang, X.; Tang, P.; Cao, X. Power allocation method of battery energy storage system considering state balance in smoothing photovoltaic power fluctuations. Front. Energy Res. 2022, 10, 965812. [Google Scholar] [CrossRef]
  8. Marcos, J.; De La Parra, I.; García, M.; Marroyo, L. Control Strategies to Smooth Short-Term Power Fluctuations in Large Photovoltaic Plants Using Battery Storage Systems. Energies 2014, 7, 6593–6619. [Google Scholar] [CrossRef]
  9. Tang, R.; Xu, Q.; Fang, J.; Xia, Y.; Shi, Y. Optimal configuration strategy of hybrid energy storage system on industrial load side based on frequency division algorithm. J. Energy Storage 2022, 50, 104645. [Google Scholar] [CrossRef]
  10. Bai, J.; Zhao, Y.; Jiang, H.; Wei, M.; Yu, S. Load frequency control of power system with energy storage based on disturbance observer. Energy Rep. 2022, 8, 615–622. [Google Scholar] [CrossRef]
  11. Hannan, M.; Abu, S.M.; Al-Shetwi, A.Q.; Mansor, M.; Ansari, M.; Muttaqi, K.M.; Dong, Z. Hydrogen energy storage integrated battery and supercapacitor based hybrid power system: A statistical analysis towards future research directions. Int. J. Hydrogen Energy 2022, 47, 39523–39548. [Google Scholar] [CrossRef]
  12. Zhu, F.; Zhou, X.; Zhang, Y.; Xu, D.; Fu, J. A load frequency control strategy based on disturbance reconstruction for multi-area interconnected power system with hybrid energy storage system. Energy Rep. 2021, 7, 8849–8857. [Google Scholar] [CrossRef]
  13. Saenger, P.; Nathalie, D.; Karine, D.; Marie-Cecile, P.; Raphael, C.; Frederic, G. Optimization of Electrical Energy Storage System Sizing for an Accurate Energy Management in an Aircraft. IEEE Trans. Veh. Technol. 2017, 66, 5572–5583. [Google Scholar] [CrossRef]
  14. Wang, Y.; Zhang, Y.; Xue, L.; Liu, C.; Song, F.; Sun, Y.; Liu, Y.; Che, B. Research on planning optimization of integrated energy system based on the differential features of hybrid energy storage system. J. Energy Storage 2022, 55, 105368. [Google Scholar] [CrossRef]
  15. Wang, J.; Wang, B.; Zhang, L.; Wang, J.; Shchurov, N.; Malozyomov, B. Review of bidirectional DC–DC converter topologies for hybrid energy storage system of new energy vehicles. Green Energy Intell. Transp. 2022, 1, 100010. [Google Scholar] [CrossRef]
  16. Hou, H.; Xu, T.; Wu, X.; Wang, H.; Tang, A.; Chen, Y. Optimal capacity configuration of the wind-photovoltaic-storage hybrid power system based on gravity energy storage system. Appl. Energy 2020, 271, 115052. [Google Scholar] [CrossRef]
  17. Li, J.; Zhang, Z.; Shen, B.; Gao, Z.; Ma, D.; Yue, P.; Pan, J. The capacity allocation method of photovoltaic and energy storage hybrid system considering the whole life cycle. J. Clean. Prod. 2020, 275, 122902. [Google Scholar] [CrossRef]
  18. Ding, Y.; Xu, Q.; Yang, B. Optimal configuration of hybrid energy storage in integrated energy system. Energy Rep. 2020, 6, 739–744. [Google Scholar] [CrossRef]
  19. Argyrou, M.C.; Marouchos, C.C.; Kalogirou, S.A.; Christodoulides, P. A novel power management algorithm for a residential grid-connected PV system with battery-supercapacitor storage for increased self-consumption and self-sufficiency. Energy Convers. Manag. 2021, 246, 114671. [Google Scholar] [CrossRef]
  20. Dong, H.; Fu, Y.; Jia, Q.; Wen, X. Optimal dispatch of integrated energy microgrid considering hybrid structured electric-thermal energy storage. Renew. Energy 2022, 199, 628–639. [Google Scholar] [CrossRef]
  21. Etim, N.-B.B.; Giaouris, D. Probabilistic adaptive power pinch analysis for islanded hybrid energy storage systems. J. Energy Storage 2022, 54, 105224. [Google Scholar] [CrossRef]
  22. Ahmad, F.F.; Ghenai, C.; Hamid, A.K.; Bettayeb, M. Application of sliding mode control for maximum power point tracking of solar photovoltaic systems: A comprehensive review. Annu. Rev. Control. 2020, 49, 173–196. [Google Scholar] [CrossRef]
  23. Baboo, J.P.; Jakubczyk, E.; Yatoo, M.A.; Phillips, M.; Grabe, S.; Dent, M.; Hinder, S.J.; Watts, J.F.; Lekakou, C. Investigating battery-supercapacitor material hybrid configurations in energy storage device cycling at 0.1 to 10C rate. J. Power Sources 2023, 561, 232762. [Google Scholar] [CrossRef]
  24. Wang, Y.; Song, F.; Ma, Y.; Zhang, Y.; Yang, J.; Liu, Y.; Zhang, F.; Zhu, J. Research on capacity planning and optimization of regional integrated energy system based on hybrid energy storage system. Appl. Therm. Eng. 2020, 180, 115834. [Google Scholar] [CrossRef]
  25. Pelosi, D.; Baldinelli, A.; Cinti, G.; Ciupageanu, D.-A.; Ottaviano, A.; Santori, F.; Carere, F.; Barelli, L. Battery-hydrogen vs. flywheel-battery hybrid storage systems for renewable energy integration in mini-grid: A techno-economic comparison. J. Energy Storage 2023, 63, 106968. [Google Scholar] [CrossRef]
  26. Devillers, N.; Marie-Cécile, P.; Daniel, B.; Marie-Laure, G. Influence of the Energy Management on the Sizing of Electrical Energy Storage Systems in an Aircraft. J. Power Sources 2014, 270, 391–402. [Google Scholar] [CrossRef]
  27. Manas, M.; Dakka, O.; Sharma, S.; Arandhakar, S.; Kallelapu, R.; Golla, S. A novel metaheuristic-based robust unified control MPPT algorithm for grid-connected PV system. Electr. Power Syst. Res. 2023, 221, 109389. [Google Scholar] [CrossRef]
  28. Ma, W.; Wang, W.; Wu, X.; Hu, R.; Tang, F.; Zhang, W. Control Strategy of a Hybrid Energy Storage System to Smooth Photovoltaic Power Fluctuations Considering Photovoltaic Output Power Curtailment. Sustainability 2019, 11, 1324. [Google Scholar] [CrossRef]
  29. Snoussi, J.; Ben Elghali, S.; Benbouzid, M.; Mimouni, M.F. Optimal Sizing of Energy Storage Systems Using Frequency-Separation-Based Energy Management for Fuel Cell Hybrid Electric Vehicles. IEEE Trans. Veh. Technol. 2018, 67, 9337–9346. [Google Scholar] [CrossRef]
  30. Su, H.; Yang, J.; Du, X.; Wang, Z.; Li, Y. Configuration of community hybrid energy storage system based on retired power battery. Energy Rep. 2020, 6, 934–942. [Google Scholar] [CrossRef]
  31. He, G.; Chen, Q.; Kang, C.; Pinson, P.; Xia, Q. Optimal Bidding Strategy of Battery Storage in Power Markets Considering Performance-Based Regulation and Battery Cycle Life. IEEE Trans. Smart Grid 2015, 7, 2359–2367. [Google Scholar] [CrossRef]
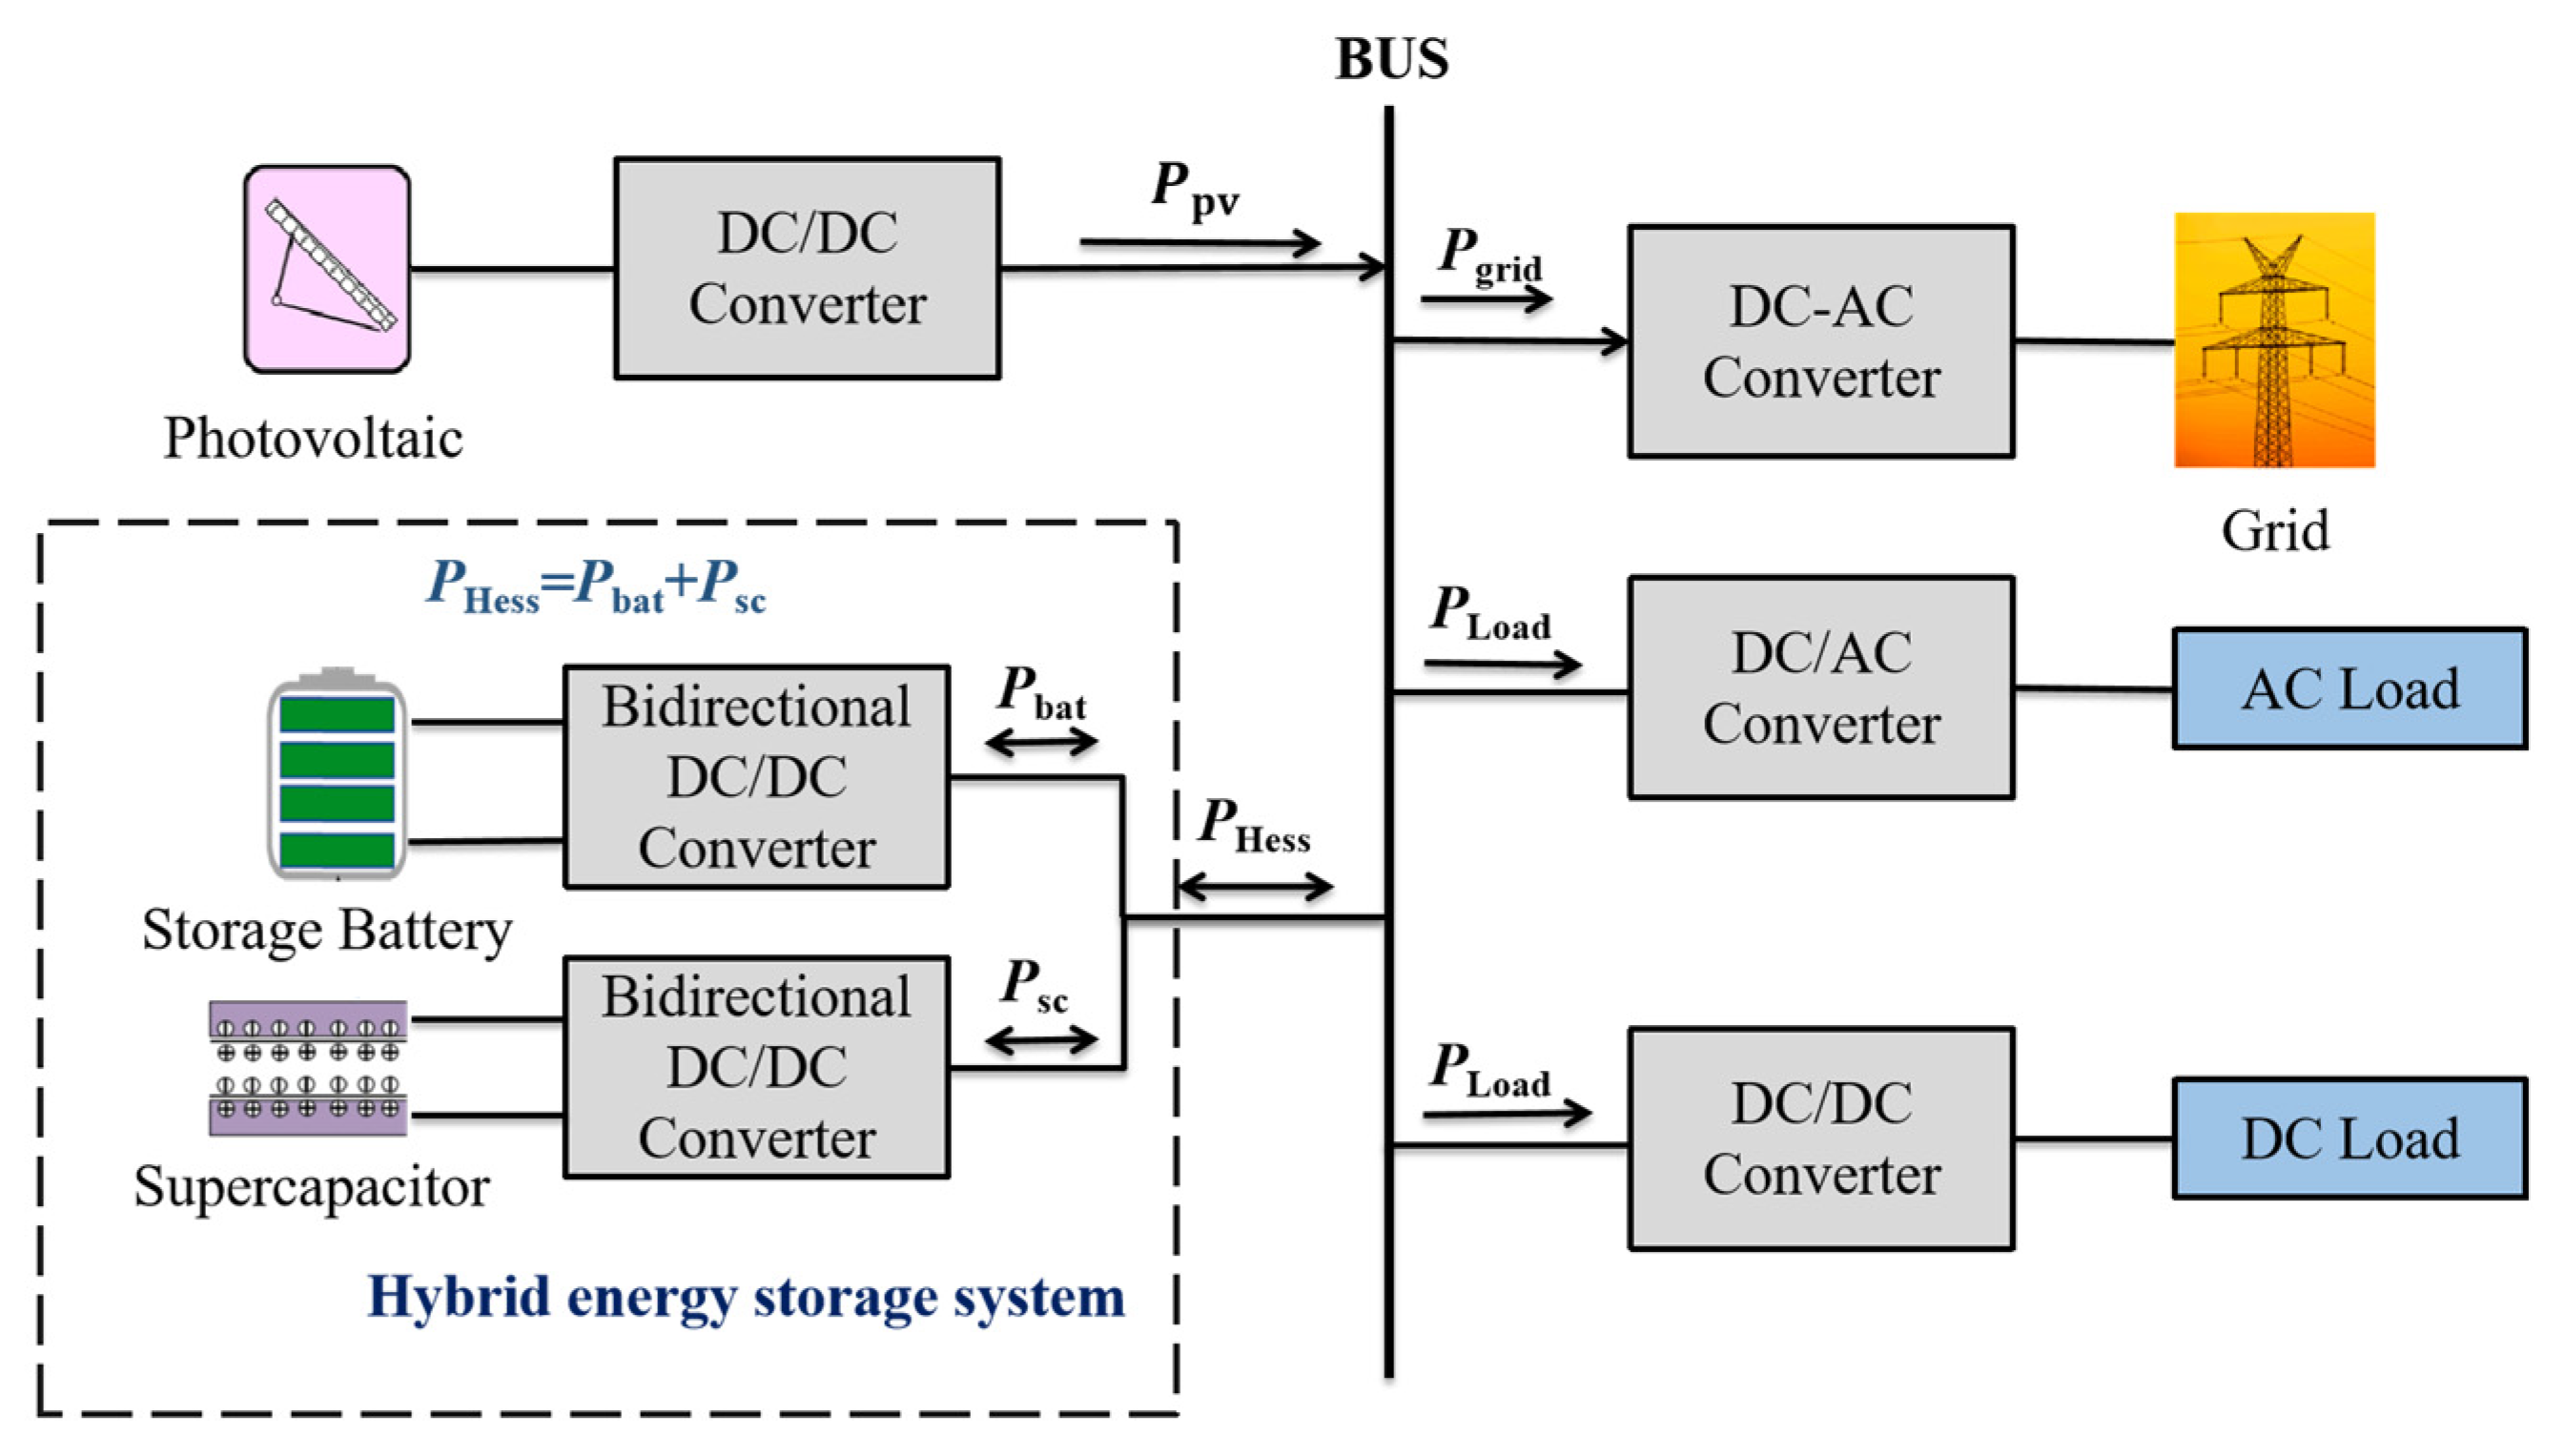
Figure 1. Grid-connected topology of PVPS connected with HESS.
Energies 16 04154 g001
Figure 2. Flow of overall control strategy.
Energies 16 04154 g002
Figure 3. Ragone diagram of lithium battery.
Energies 16 04154 g003
Figure 4. Relationship between DOD and MCN of lithium battery.
Energies 16 04154 g004
Figure 5. Schematic diagram of the equivalent complete charge–discharge cycle of a battery.
Energies 16 04154 g005
Figure 6. K-means clustering process.
Energies 16 04154 g006
Figure 7. Annual distribution of typical scenarios.
Energies 16 04154 g007
Figure 8. Typical fluctuation scenario of PVPS: (a) power fluctuation scenario I; (b) power fluctuation scenario II; and (c) power fluctuation scenario III.
Energies 16 04154 g008
Figure 9. The power fluctuation of PV before and after grid connection: (a) PV power after grid-connection; (b) the amount of PV power fluctuation of PV after grid-connection; (c) grid-connected PV power during 9:00–15:00; (d) the amount of PV power fluctuation during 10:00–14:00.
Energies 16 04154 g009
Figure 10. Response of HESS power.
Energies 16 04154 g010
Figure 11. The objective function solution: (a) the annual input cost of HESS; (b) the annual life loss cost of lithium battery; (c) the Pareto solution of the annual life loss of lithium battery and the annual input cost of HESS; (d) the relationship between the cutoff frequency and the annual comprehensive input cost of HESS.
Energies 16 04154 g011
Figure 12. Power and SOC variation for HESS: (a) the power curve of the lithium battery; (b) the power curve of the supercapacitor; (c) the SOC change curve of lithium battery; (d) the SOC change curve of the supercapacitor.
Energies 16 04154 g012
Table 1. PVPS parameter setting.
ParameterSymbolSetting Values
PV installed capacity C pv 750 (kWp)
Sampling interval Δ t 1 (min)
PV power fluctuation range P limit ±75 (kW/min)
Table 2. Parameter settings of lithium battery and supercapacitor.
SymbolLithium Battery
(3.7 V/5.2 Ah)
SymbolSupercapacitor
(2.7 V/500 F)
W bat cell 17.02 (Wh) W sc cell 0.45 (Wh)
P bat cell 355.35 (W) P sc cell 562.5 (W)
k bat in _ w 3859 (RMB/kWh) k sc in _ p 39,265 (RMB/kWh)
k bat in _ p 2700 (RMB/kW) k sc in _ p 2300 (RMB/kW)
k bat in _ w 1.92 (RMB/kWh) k sc in _ w 19.63 (RMB/kWh)
k bat op _ p 1.35 (RMB/kW) k sc in _ p 1.15 (RMB/kW)
k bat in _ p 10 (year) L sc 20 (year)
z0.06z0.06
kp−0.8//
Table 3. Results of capacity allocation for HESS.
ParameterSymbolResult
Cutoff frequency (Hz) f c 0.0066
Annual comprehensive input cost (RMB)/0.93 × 107
Annual input cost (RMB) f 1 4.82 × 10⁶
Annual life loss cost (RMB) f 2 4.51 × 10⁶
Lithium battery quantity N bat 5552
Supercapacitor quantity N sc 9773
Disclaimer/Publisher’s Note: The statements, opinions and data contained in all publications are solely those of the individual author(s) and contributor(s) and not of MDPI and/or the editor(s). MDPI and/or the editor(s) disclaim responsibility for any injury to people or property resulting from any ideas, methods, instructions or products referred to in the content.