Article

Simulation Analysis of High Radiant Heat Plant Cooling and Endothermic Screen Waste Heat Recovery Performance Based on FLUENT

School of Environment and Energy Engineering, Anhui Jianzhu University, Hefei 230601, China
*
Author to whom correspondence should be addressed.
Energies 2023, 16(10), 4196; https://doi.org/10.3390/en16104196
Submission received: 19 April 2023 / Revised: 16 May 2023 / Accepted: 16 May 2023 / Published: 19 May 2023
(This article belongs to the Section A2: Solar Energy and Photovoltaic Systems)

Abstract

:
In this article, we propose the endothermic screen model. The aim is to reduce the problems of the high temperature and low utilization of waste heat in industrial plants with high radiant heat. In this paper, the Rhino software is used to establish the model and import it into the FLUENT software, divide the mesh, set the boundary conditions and analyze the transient temperature field. Finally, the temperature change law in the plant and the waste heat recovery efficiency of the endothermic screen are obtained. The flow of cooling water in the endothermic screen is used to transform and transfer the high-radiation heat inside the plant to the outside. The simulation results show that after adding the endothermic screen, the average indoor temperature drops from 313.33 K to 305.66 K, which has a cooling effect. The waste heat recovery efficiency reaches up to 56%, and the waste heat recovery effect is obvious. The research results can provide a reference for the application of an endothermic screen in actual high radiant heat plants and provide a more comfortable working environment for the plant workers.

1. Introduction

Industrial waste heat is energy that is generated in industrial processes that is not put to any practical use and is wasted or dumped into the environment. Sources of waste heat mostly include heat loss transferred through conduction, convection and radiation from industrial products, equipment and processes and heat discharged from combustion processes [1]. Thermal energy storage and recovery from industrial waste heat sources are of high importance for promoting world energy saving [2,3,4]. Increased global warming is one of the reasons for the frequent occurrence of extreme weather. China is the world’s largest carbon emitter and one of the countries most affected by extreme climate. In September 2020, the China government proposed at the 75th United Nations General Assembly that its carbon dioxide emissions will reach a peak by 2030, and carbon neutrality will be achieved by 2060. Considering the balance between economic growth and carbon emission reduction, China’s above-mentioned goals are 10 years behind those of the EU and the United States. In industrial plants, due to metallurgy, forging and other production processes, there are some production equipment that continuously emit high radiant heat. The maximum surface temperature of these high radiant heat equipment can reach 1000 °C, the intensity of heat radiation can generally reach 10,000 W/m2 and the average temperature of the production environment can reach up to 100 °C [5]. Hendricks and Choate [6] reported that 33% of manufacturing industrial energy was discharged directly to the atmosphere or cooling systems as waste heat due to the fact that most industries were incapable of recycling excessive waste heat. Moreover, the global energy demand will increase by almost 35% by 2030 compared with the 2005 level or by up to 95% without the use of energy-efficient technologies [7]. The lack of waste heat recovery systems in production plants leads to low effective energy utilization. How to recover various waste heat resources has become the focus of researchers’ attention.
Production plant workers in a high-temperature and high-heat environment for a long time will lead to a large loss of environmental water in the human body and significant changes in physiological and psychological conditions [8]. As body temperature continues to rise, workers’ productivity decreases [9]. Exposure to extreme heat causes various heat-related diseases, such as heat stroke, dehydration and electrolyte imbalance [10,11]. Moreover, safety performance and productivity typically decline in extremely hot environments [12]. Long-term operation of production equipment in high-temperature environments may exceed the temperature tolerance threshold, resulting in irreversible damage to the equipment, resulting in the leakage of harmful substances or casualties in the workshop [13]. Therefore, it is necessary to study how to reduce the ambient temperature of production plants.
The current research on reducing indoor temperature is mainly through roof sprinklers, natural ventilation, mechanical cooling and isolation of heat sources. With the maturity of computational fluid dynamics analysis tools and techniques, computer simulation techniques are more intuitive and economical than experimental testing methods for the study of room temperature reduction. Therefore, simulation techniques are increasingly adopted by researchers. Zhu et al. [14] used COMSOL software to simulate the heat transfer between sprayed and unsprayed rainwater on the roofs of industrial plants and found that rainwater can significantly reduce roof temperature. Ajaya et al. [15] used MATLAB software to analyze the effect of artificial precipitation on the cooling of buildings. In addition, the cooling effect under different spray water volumes and spray speeds was compared, and the optimal water spray conditions were finally obtained. Yang et al. [16] demonstrated that changes in roof morphology and ventilation have a large impact on the thermal comfort of natural ventilation through CFD numerical simulation technology. Zhao et al. [17] used CFD simulation software to study the cooling effect of using air conditioners on the working face in mines and proposed the optimal location of the air outlet of air conditioners and the optimal air supply temperature. Wang et al. [18] used ANSYS software to establish a transient thermal analysis model and optimized them with a variety of thermal insulation structures and materials to achieve the best thermal insulation effect. The use of roof spraying and natural ventilation can only partially improve the ambient temperature of the plant, and the cooling effect is poor. The use of mechanical cooling in the plant is effective but costly. The use of insulation can reduce the indoor temperature, but the waste heat cannot be utilized. The use of mechanical cooling in the plant is effective but costly [19]. The use of insulation can reduce the indoor temperature, but the waste heat cannot be utilized [20].
There are few previous studies on waste heat recovery and room temperature reduction at the same time, so this paper constructs an endothermic screen that can absorb the radiant heat emitted from a high-radiation heat source. The high radiant heat is transferred to the heat transfer fluid water and the radiant heat in the room is discharged from the outside through the heat exchange fluid. The water that absorbs heat can be used for domestic hot water for plant employees. This method not only absorbs the radiant heat emitted by the high radiant heat source, but also reduces the temperature of the plant. The constructed model of the heat-absorbing screen can provide a reference for cooling the actual industrial plant. Therefore, it is an ideal choice for enterprises that need to save costs to reduce the temperature of the plant and can carry out waste heat recovery.

2. Numerical Experiment
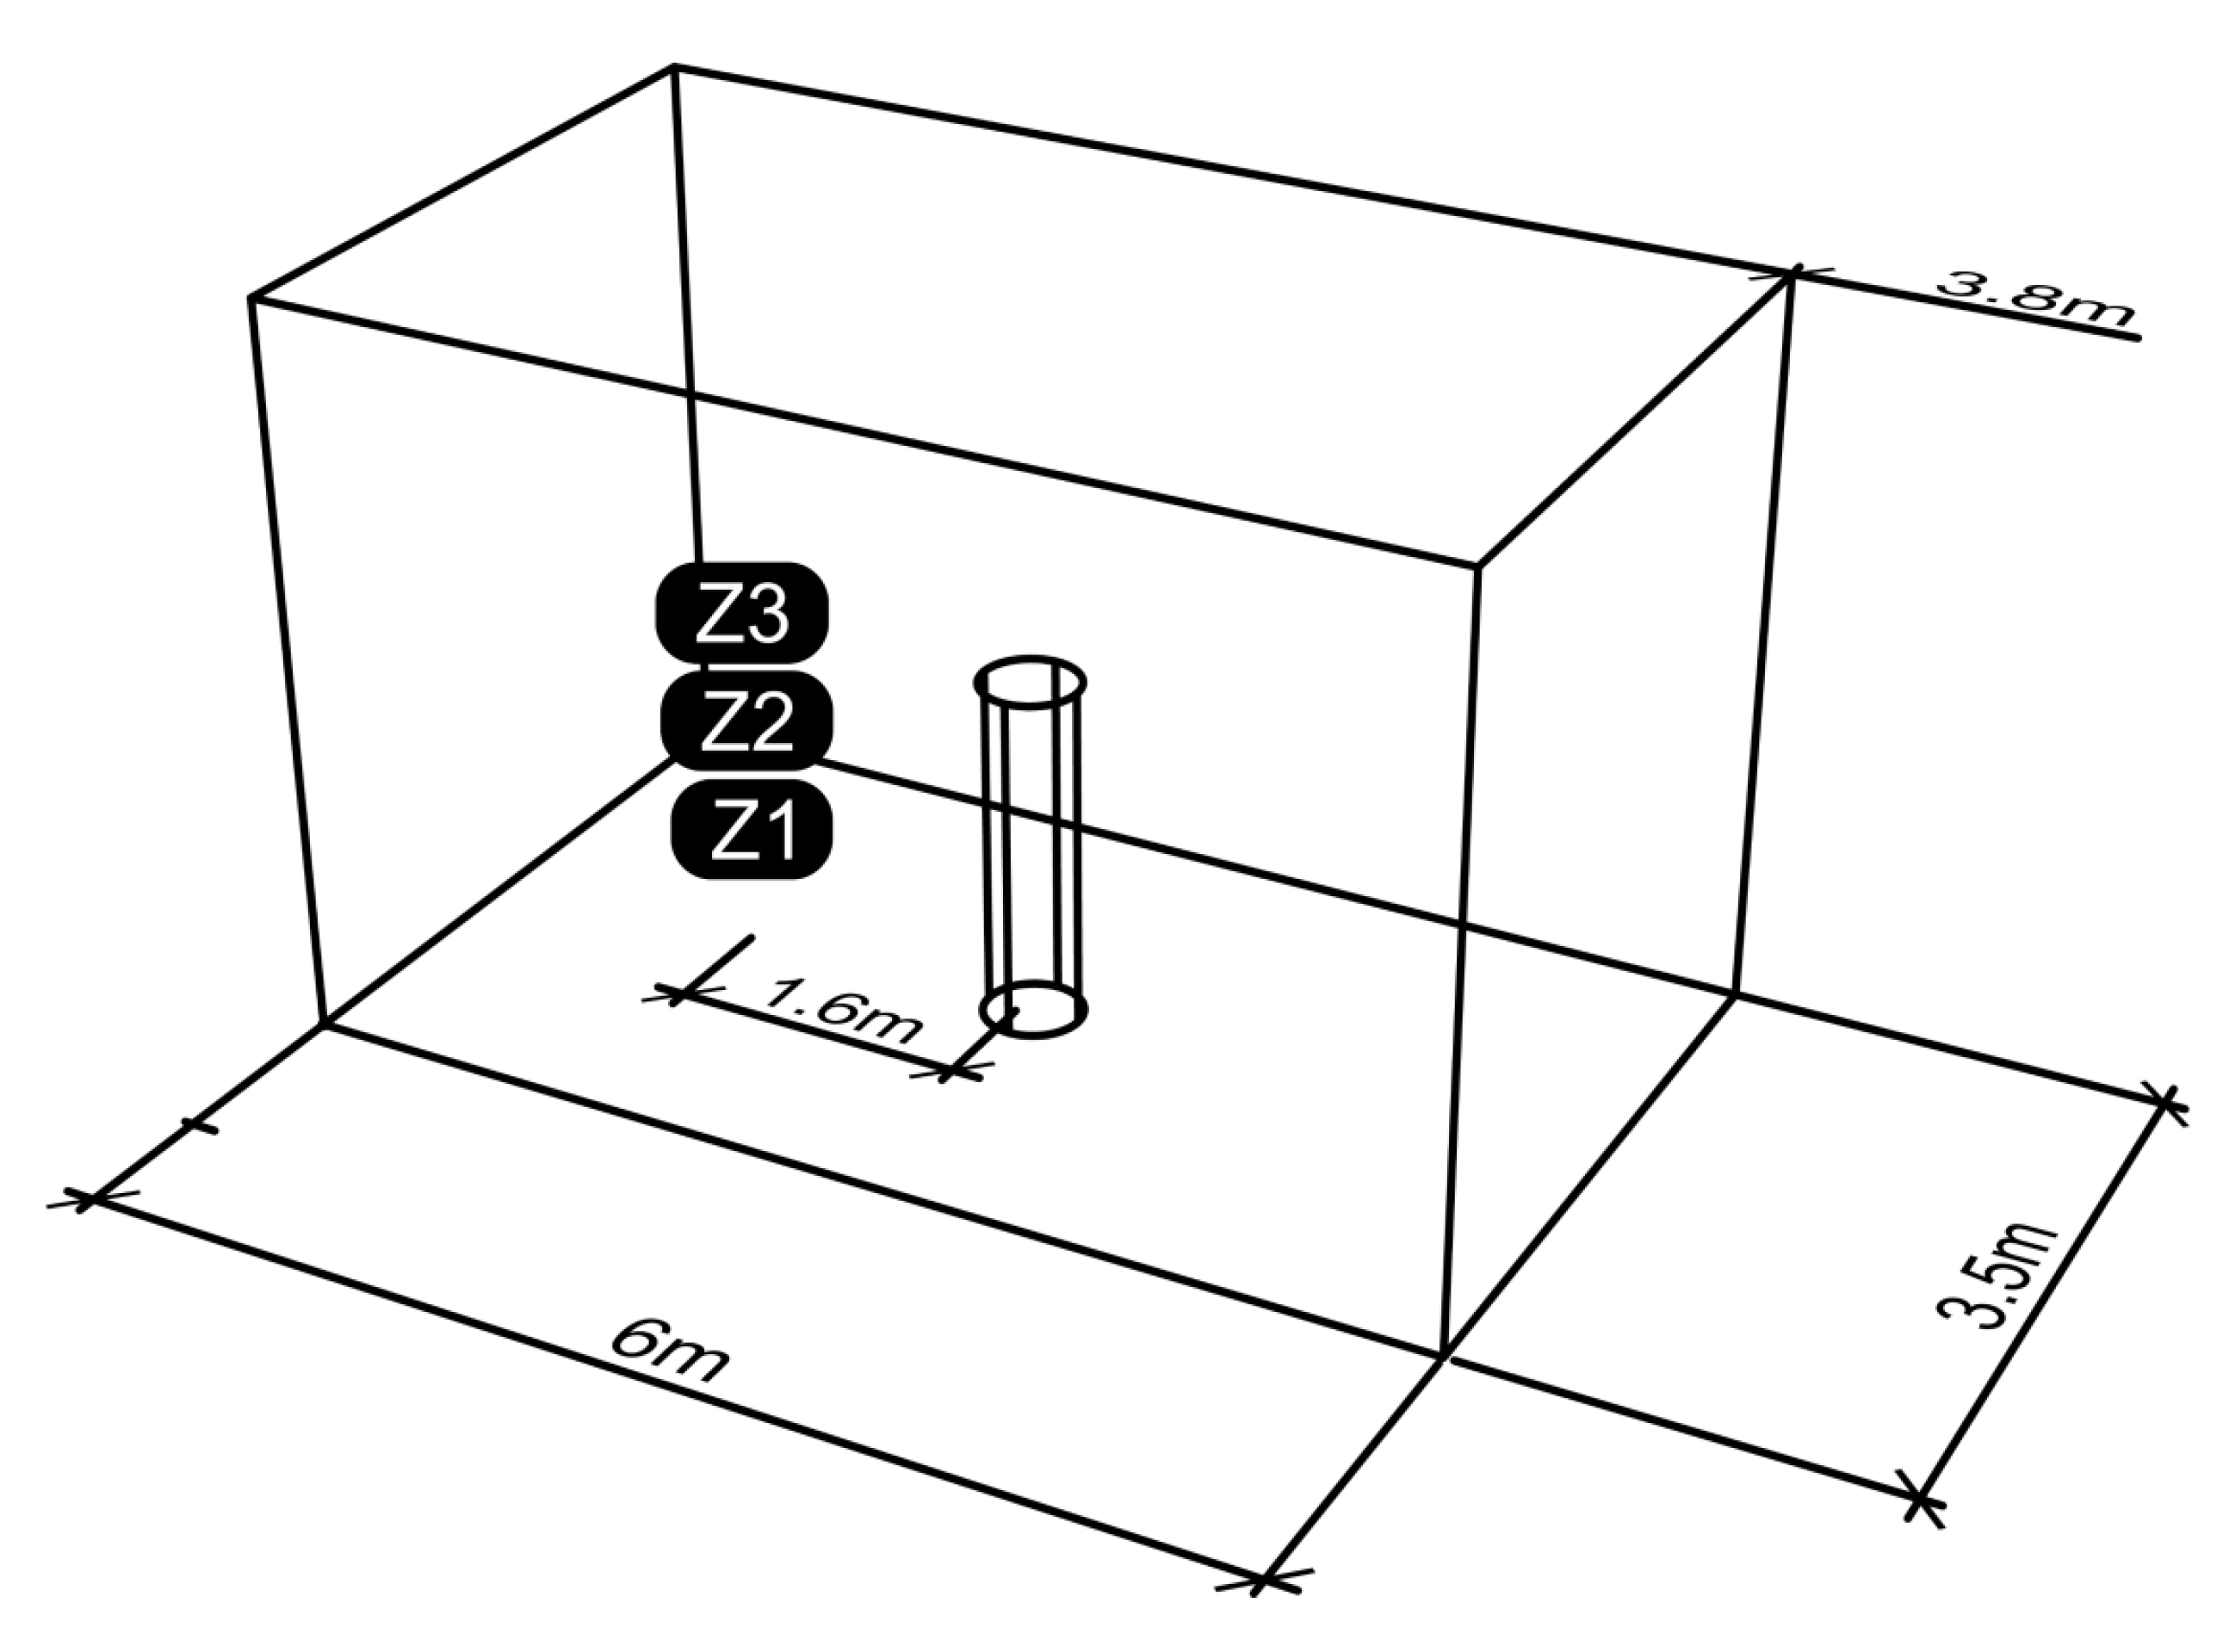
2.1. Physical Model

The endothermic screen model established in this paper is shown in Figure 1. Its structure is mainly composed of a water inlet, serpentine pipe, heat collector plate containing endothermic coating, insulation layer, water outlet and spoiler generator. The equal-area heat-collecting ribs can effectively increase the endothermic area [21], and their surface contains a coating [22], which can improve the heat-collecting performance of the endothermic plate. The heat transfer fluid flows from the water inlet to the water outlet and absorbs the radiant heat obtained by the endothermic plate during the flow process so as to realize the radiant heat removal. A large number of turbulent generators are formed through the mold in the serpentine tube, which can increase the flow around the serpentine tube, reduce the laminar flow pattern in the tube, increase the heat transfer coefficient and improve the heat transfer efficiency in the serpentine tube. The endothermic plate and serpentine tube are filled with an insulation layer around [23] to prevent radiant heat from being dissipated into the room. The endothermic plate is in close contact with the serpentine tube and insulation layer. The two ends of the serpentine pipe are the inlet and the outlet. The shell seals the endothermic plate, serpentine tube and insulation layer to form a sealed heat endothermic screen device. The endothermic surface of the endothermic plate is exposed to a highly radiant heat source, which is convenient for absorbing high radiant heat. The three endothermic screens are connected sequentially through water pipes to form an integral waste heat recovery device.

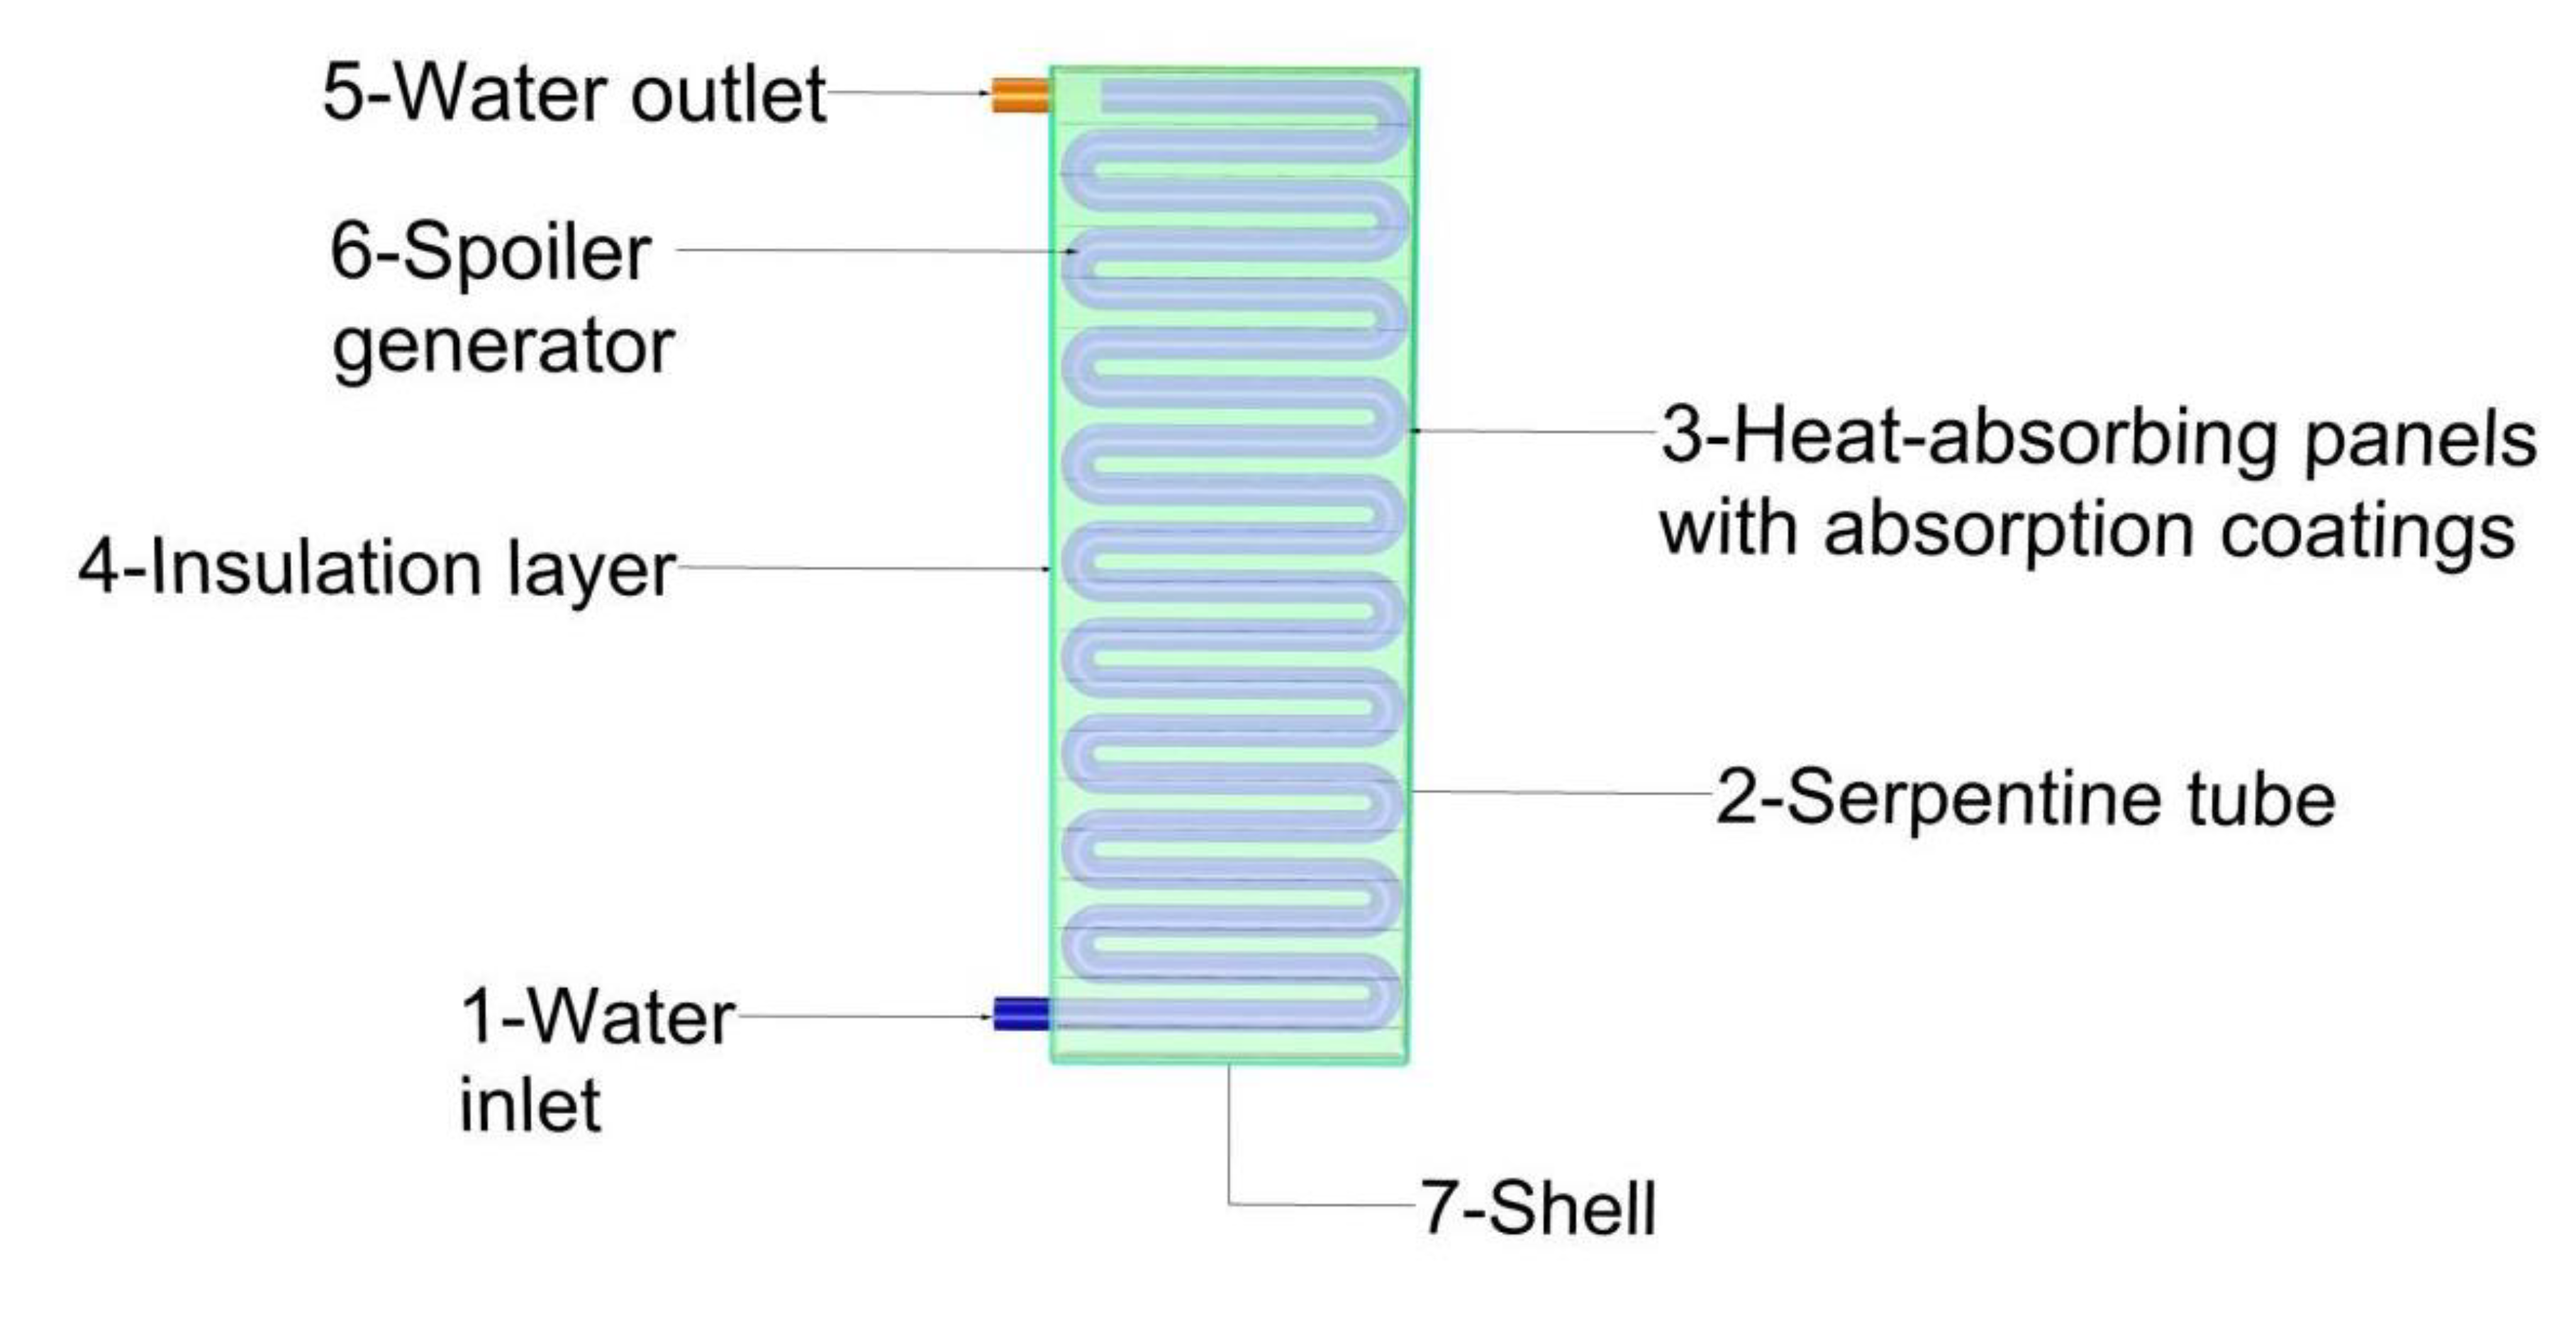
2.2. Principle of Waste Heat Recovery Device

The high-radiation heat source in the plant emits radiation heat into the air, part of which is transferred to the endothermic plate of the endothermic screen. Collector ribs and coatings on endothermic plates can effectively absorb radiant heat and convert radiant heat into thermal energy. The heat transfer fluid enters the inside of the endothermic screen through the water inlet and flows in the serpentine tube. The radiant heat absorbed on the endothermic plate is transferred to the heat transfer fluid through heat conduction. The radiant heat absorbed by the heat transfer fluid transfers heat to the outside through heat conduction and heat convection. The endothermic plate, serpentine tube and shell are filled with a large amount of insulation in order to reduce the radiant heat dissipated to the room again. The heat transfer fluid flows in the serpentine tube of the endothermic screen, and the temperature rises after endothermic to generate a large amount of heat energy, thereby realizing the absorption and transfer of high radiant heat sources to the outdoors.

2.3. Endothermic Screen Arrangement

Because the heat of the plant is mainly generated by the high-temperature production equipment of the plant, the heat dissipation of other equipment and the human body is negligible. In the actual plant, the high-temperature heat source continuously releases radiant heat. The heating density of indoor air decreases and eventually rises to a high place indoors. In this paper, the high-temperature heat source is replaced by a stainless steel cylinder. The endothermic screen is placed directly above the heat source, and the two endothermic screens on the left and right and the middle endothermic screen form an angle of 120°. The heat exchange fluid flows in from the right endothermic screen and flows out to the outside through three endothermic screens in turn. The trapezoidal gap in the front and rear of the center endothermic screen is blocked with an insulation layer to prevent excessive heat loss into the room. This endothermic screen arrangement is an ideal arrangement plan.

2.4. Simulation Model
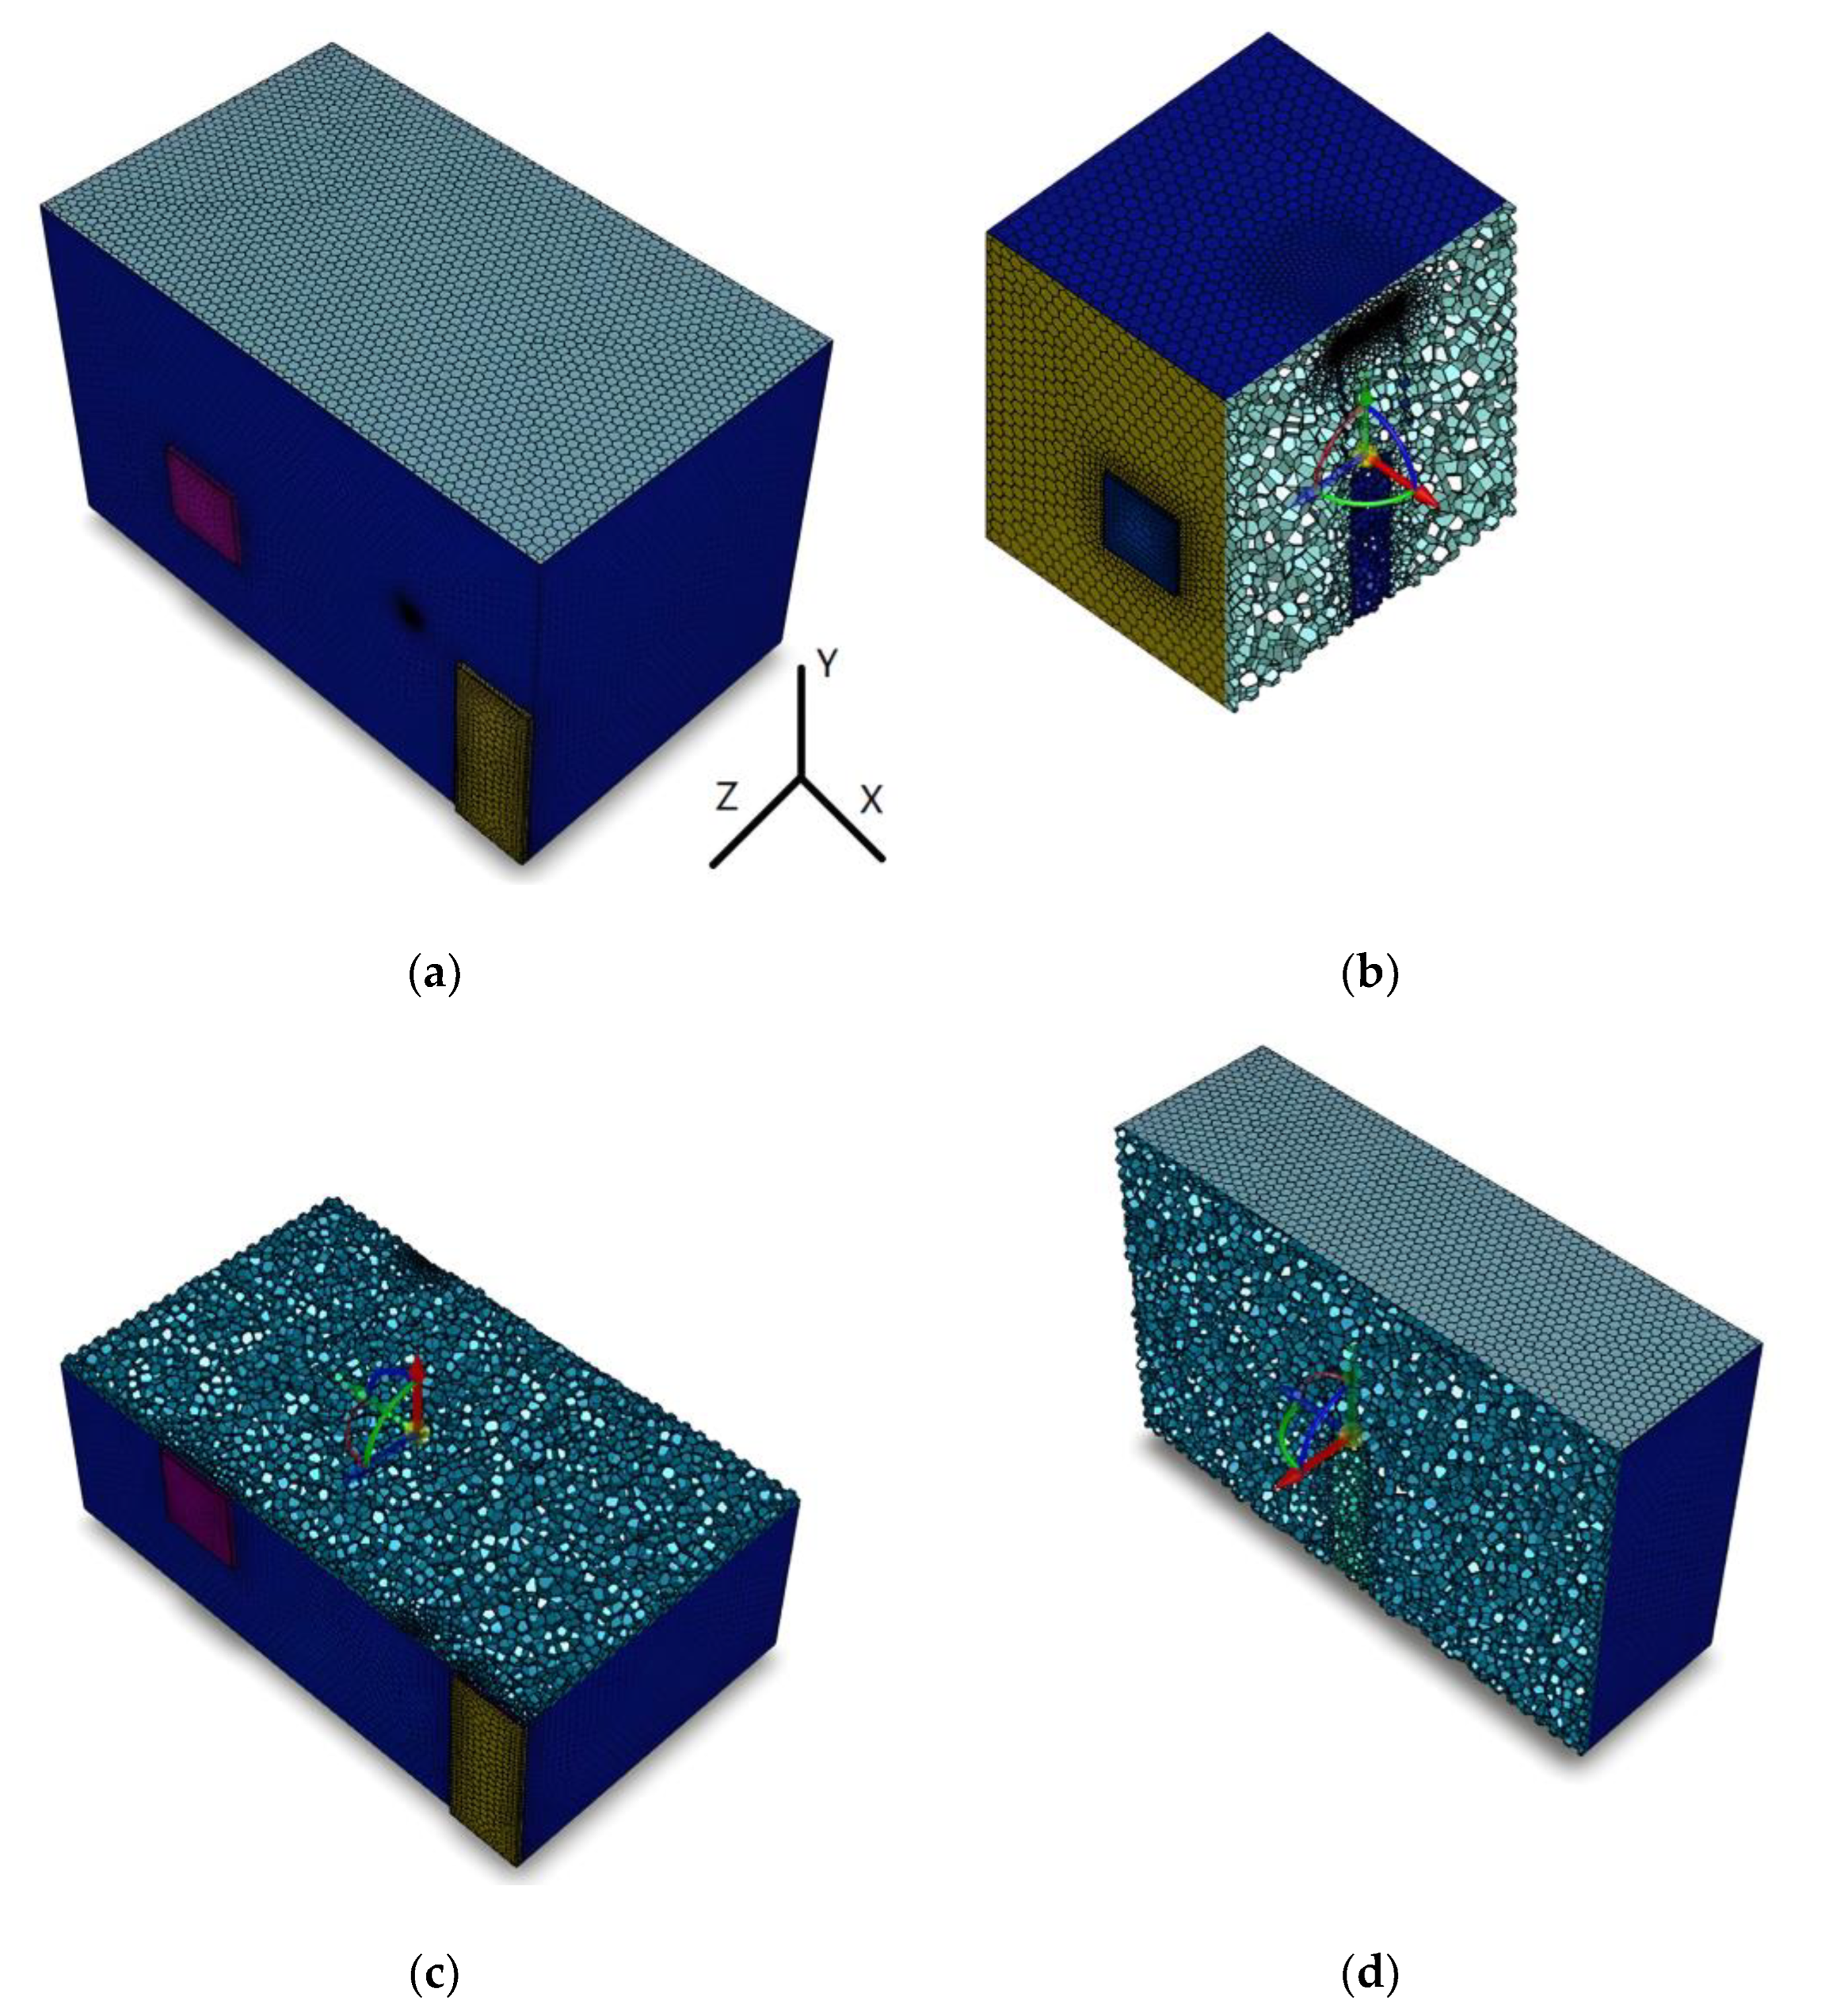
The specific parameters of the high-radiation heat plant model established in this paper are shown in Table 1. The high-temperature heat source in the high-radiation plant is simplified as a cylinder, and three endothermic screens are located directly above the high-temperature heat source. The model picture of the plant without an endothermic screen is shown in Figure 2a. The model picture of the plant with an endothermic screen is shown in Figure 2b.

2.5. Mesh Division

In this paper, the unstructured mesh is used. The mesh of the plant model without an endothermic screen is shown in Figure 3. Figure 3 contains three XYZ cross-sectional maps, with a total of 78,531 meshes. The mesh of the plant model with an endothermic screen is shown in Figure 4. Figure 4 contains three XYZ cross-sectional maps, with a total of 6,546,976 meshes.

2.6. Simulation Setup

The numerical simulation in this paper is based on the finite-element volume method and adopts the SIMPLE algorithm. In this paper, the SST k-omega model is used, and the S2S model is selected for the radiation model. The materials selected in this paper are as follows. The heat transfer fluid is water. The material of the plant door is wood. The material of the plant window is glass. The material of the heat source is stainless steel. The material of the serpentine tube is copper. The material of the heat collector plate is aluminum alloy. The material of the insulation layer is phenolic foam. The material of the plant wall is brick. The material parameters are set as shown in Table 2. The boundary condition parameters are set as shown in Table 3. The model in this article can be approximated into four different domains. Between the heat source and the endothermic screen is the air domain. The endothermic screen insulation layer is a solid domain. The inside of the endothermic screen is a fluid domain. Between the surface of the heat shield shell and the wall, there is an air domain. The material of the air domain is air. The material of the fluid domain is water. In order to improve the calculation accuracy and better control the calculation process, it is necessary to set the discrete term, relaxation factor, residual and initialization settings. The solution control parameter settings are shown in Table 4.
To facilitate the study, some assumptions need to be made:
(1)
Ignore the viscous dissipation in the energy equation;
(2)
The surface emissivity and absorption rate of each material do not change with temperature;
(3)
The physical parameters of the endothermic screen do not change with temperature;
(4)
The physical parameters of air and water only change with density with temperature, and other parameters are considered unchanged.
The heat source power is 20 KW, and the volume is 0.35343 m3, so the heat source volume power is 56,588 W/m3. The monitoring items include heat source temperature, indoor average temperature, heat-absorbing screen outlet water temperature, and three temperature monitoring points Z1, Z2 and Z3. The location of the temperature monitoring points is shown in Figure 5. The horizontal distance between the temperature measurement point and the heat source is 1.6 m. The three temperature measurement points are vertically spaced at 0.6 m.

2.7. Analysis of Heat Dissipation

The heat dissipation of high radiant heat equipment in the plant contains radiation heat transfer and convection heat transfer between the equipment surface and the indoor air. The amount of heat dissipated by high radiant heat equipment can be calculated according to the following Equation (1).
Q = Q r a d + Q con
where Q is the heat dissipation of the high radiant heat source, W; Q r a d is radiant heat transfer between high radiant heat equipment and indoor air, W; Q con is heat transfer between the surface of a high radiant heat source and indoor air, W.
Q r a d = A b ε b σ ( T b 4 T a 4 )
where A b is the high radiant heat source surface area, m2; ε b is high radiant heat source surface emissivity; σ is the Stephen–Boltzmann constant, σ = 5.67 × 10⁻⁸ W/(m2·K4); T b  is high radiant heat source surface temperature, T; T a  is ambient air temperature, T;
Q c o n = A b ( T b T a )
where is the high convective heat transfer coefficient between the radiant heat source and surrounding air, W / ( m 2 · K ) .
= C λ a l b ( G r · Pr ) n
G r = g v ( T b T a ) l b 3 υ 2
Pr = μ C p λ a
= 0 . 10 λ a l b [ g v ( T b T a ) l b 3 ν 2 · μ C p λ a ] 1 3
where the constant C and the coefficient n are related to the model and location of the heat transfer surface and other conditions; C is taken as 0.10 and n is taken as 1/3 in this study. λ a is the thermal conductivity of the air in the plant, W/(m·K); lb is high-radiation heat source characteristic length, m; Gr is the Grashof number; Pr is Prandtl number; g is the acceleration of gravity, g = 9.8 m/s2; v is the volume expansion coefficient of air in the plant, 1/K; v is the kinematic viscosity coefficient of air in the plant, m2/s; u is the aerodynamic viscosity coefficient in the plate, N/(m2/s); Cp is the air constant pressure specific heat capacity of the plant, J/(kg·K).
Bringing Equation (7) into Equation (3) and Equation (2) into Equation (1), the heat dissipation of the high radiation heat source can be obtained as:
Q = A b [ ε b σ ( T b 4 T a 4 ) + 0.10 λ a 2 3 ( g v μ C p ν 2 ) 1 3 · ( T b 4 T a 4 ) 4 3 ]
Introduction of high radiant heat source radiant heat dissipation to convective heat exchange ratio:
I = Q r a d Q con = ε b σ ( T b 2 + T a 2 ) ( T b + T a )
In view of the actual value of Tb and Ta, can be known I value is much greater than 1. Radiant heat transfer dominates the heat dissipation of high radiant heat sources and the convective heat transfer with air is negligible.

3. Results and Discussion

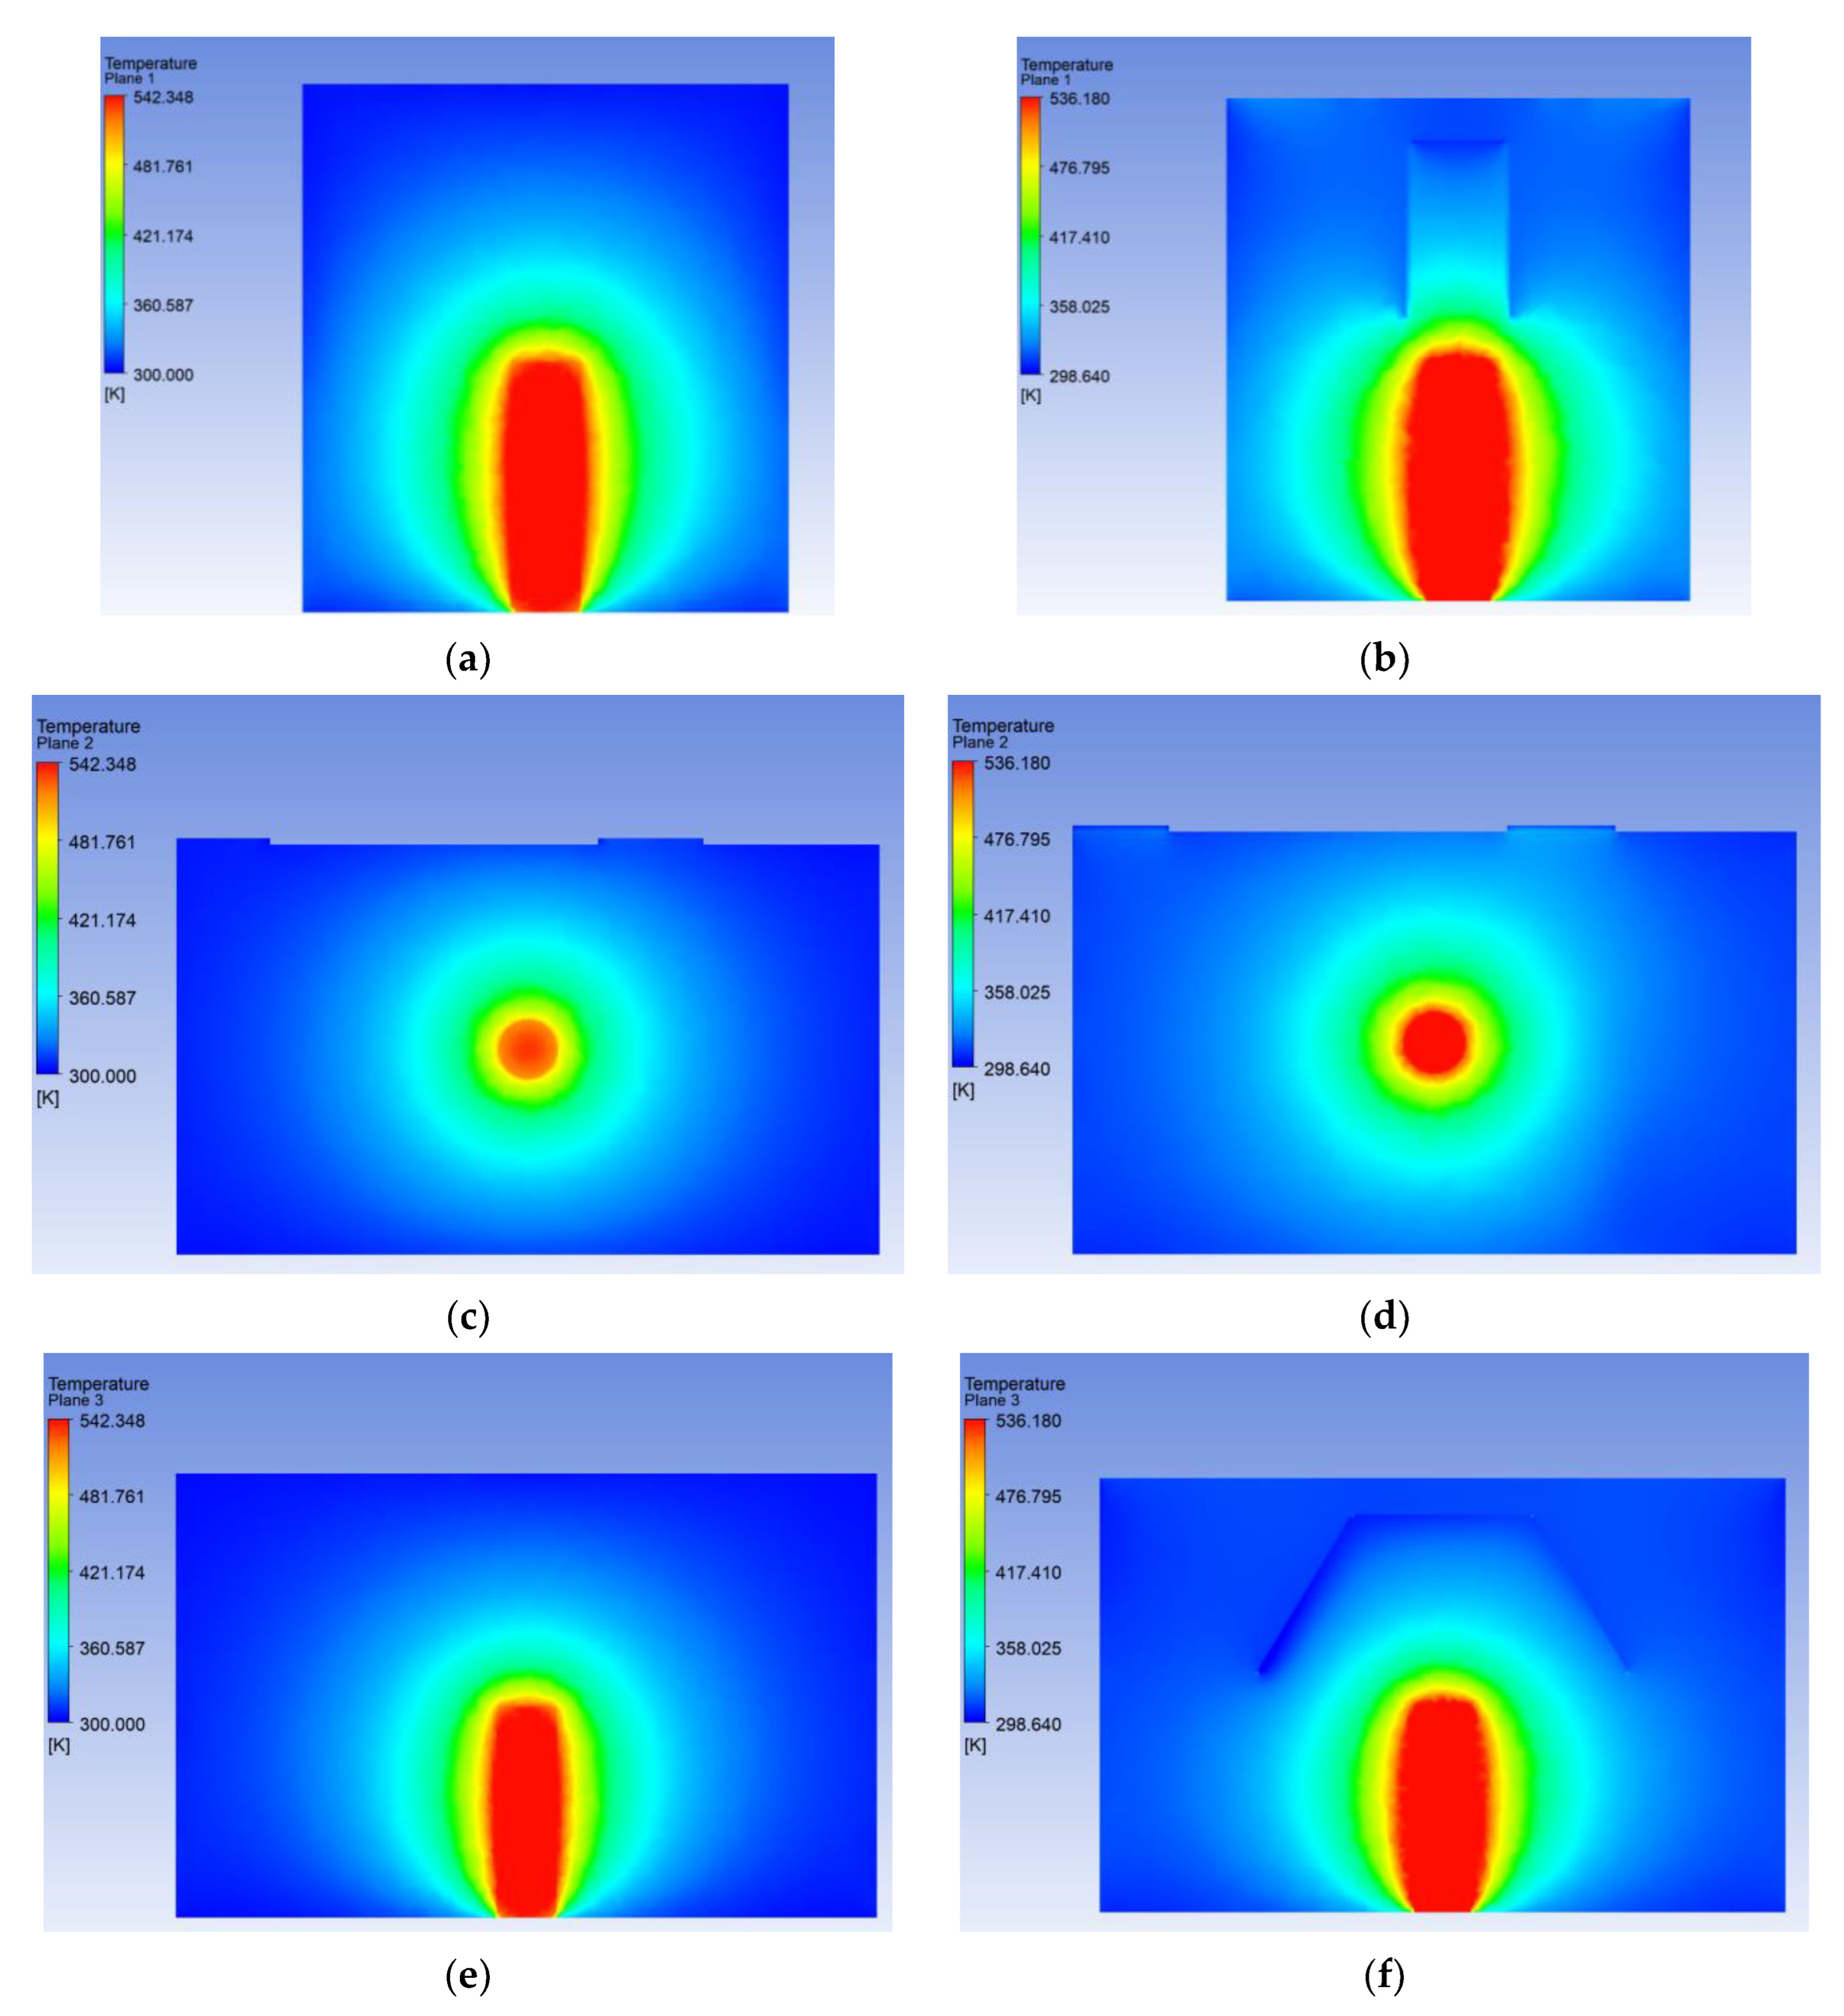
3.1. Stability Analysis of Heat Source

The heat source temperature curve graph is shown in Figure 6. The figure shows that the simulation of the initial heat source temperature is 298 K. At the initial stage of heating, the heat source temperature rises faster. After 20 h of heating, the temperature stabilized and finally stabilized at 568 K. It can be seen that the stainless steel cylinder can better simulate the high radiant heat source of the plant.

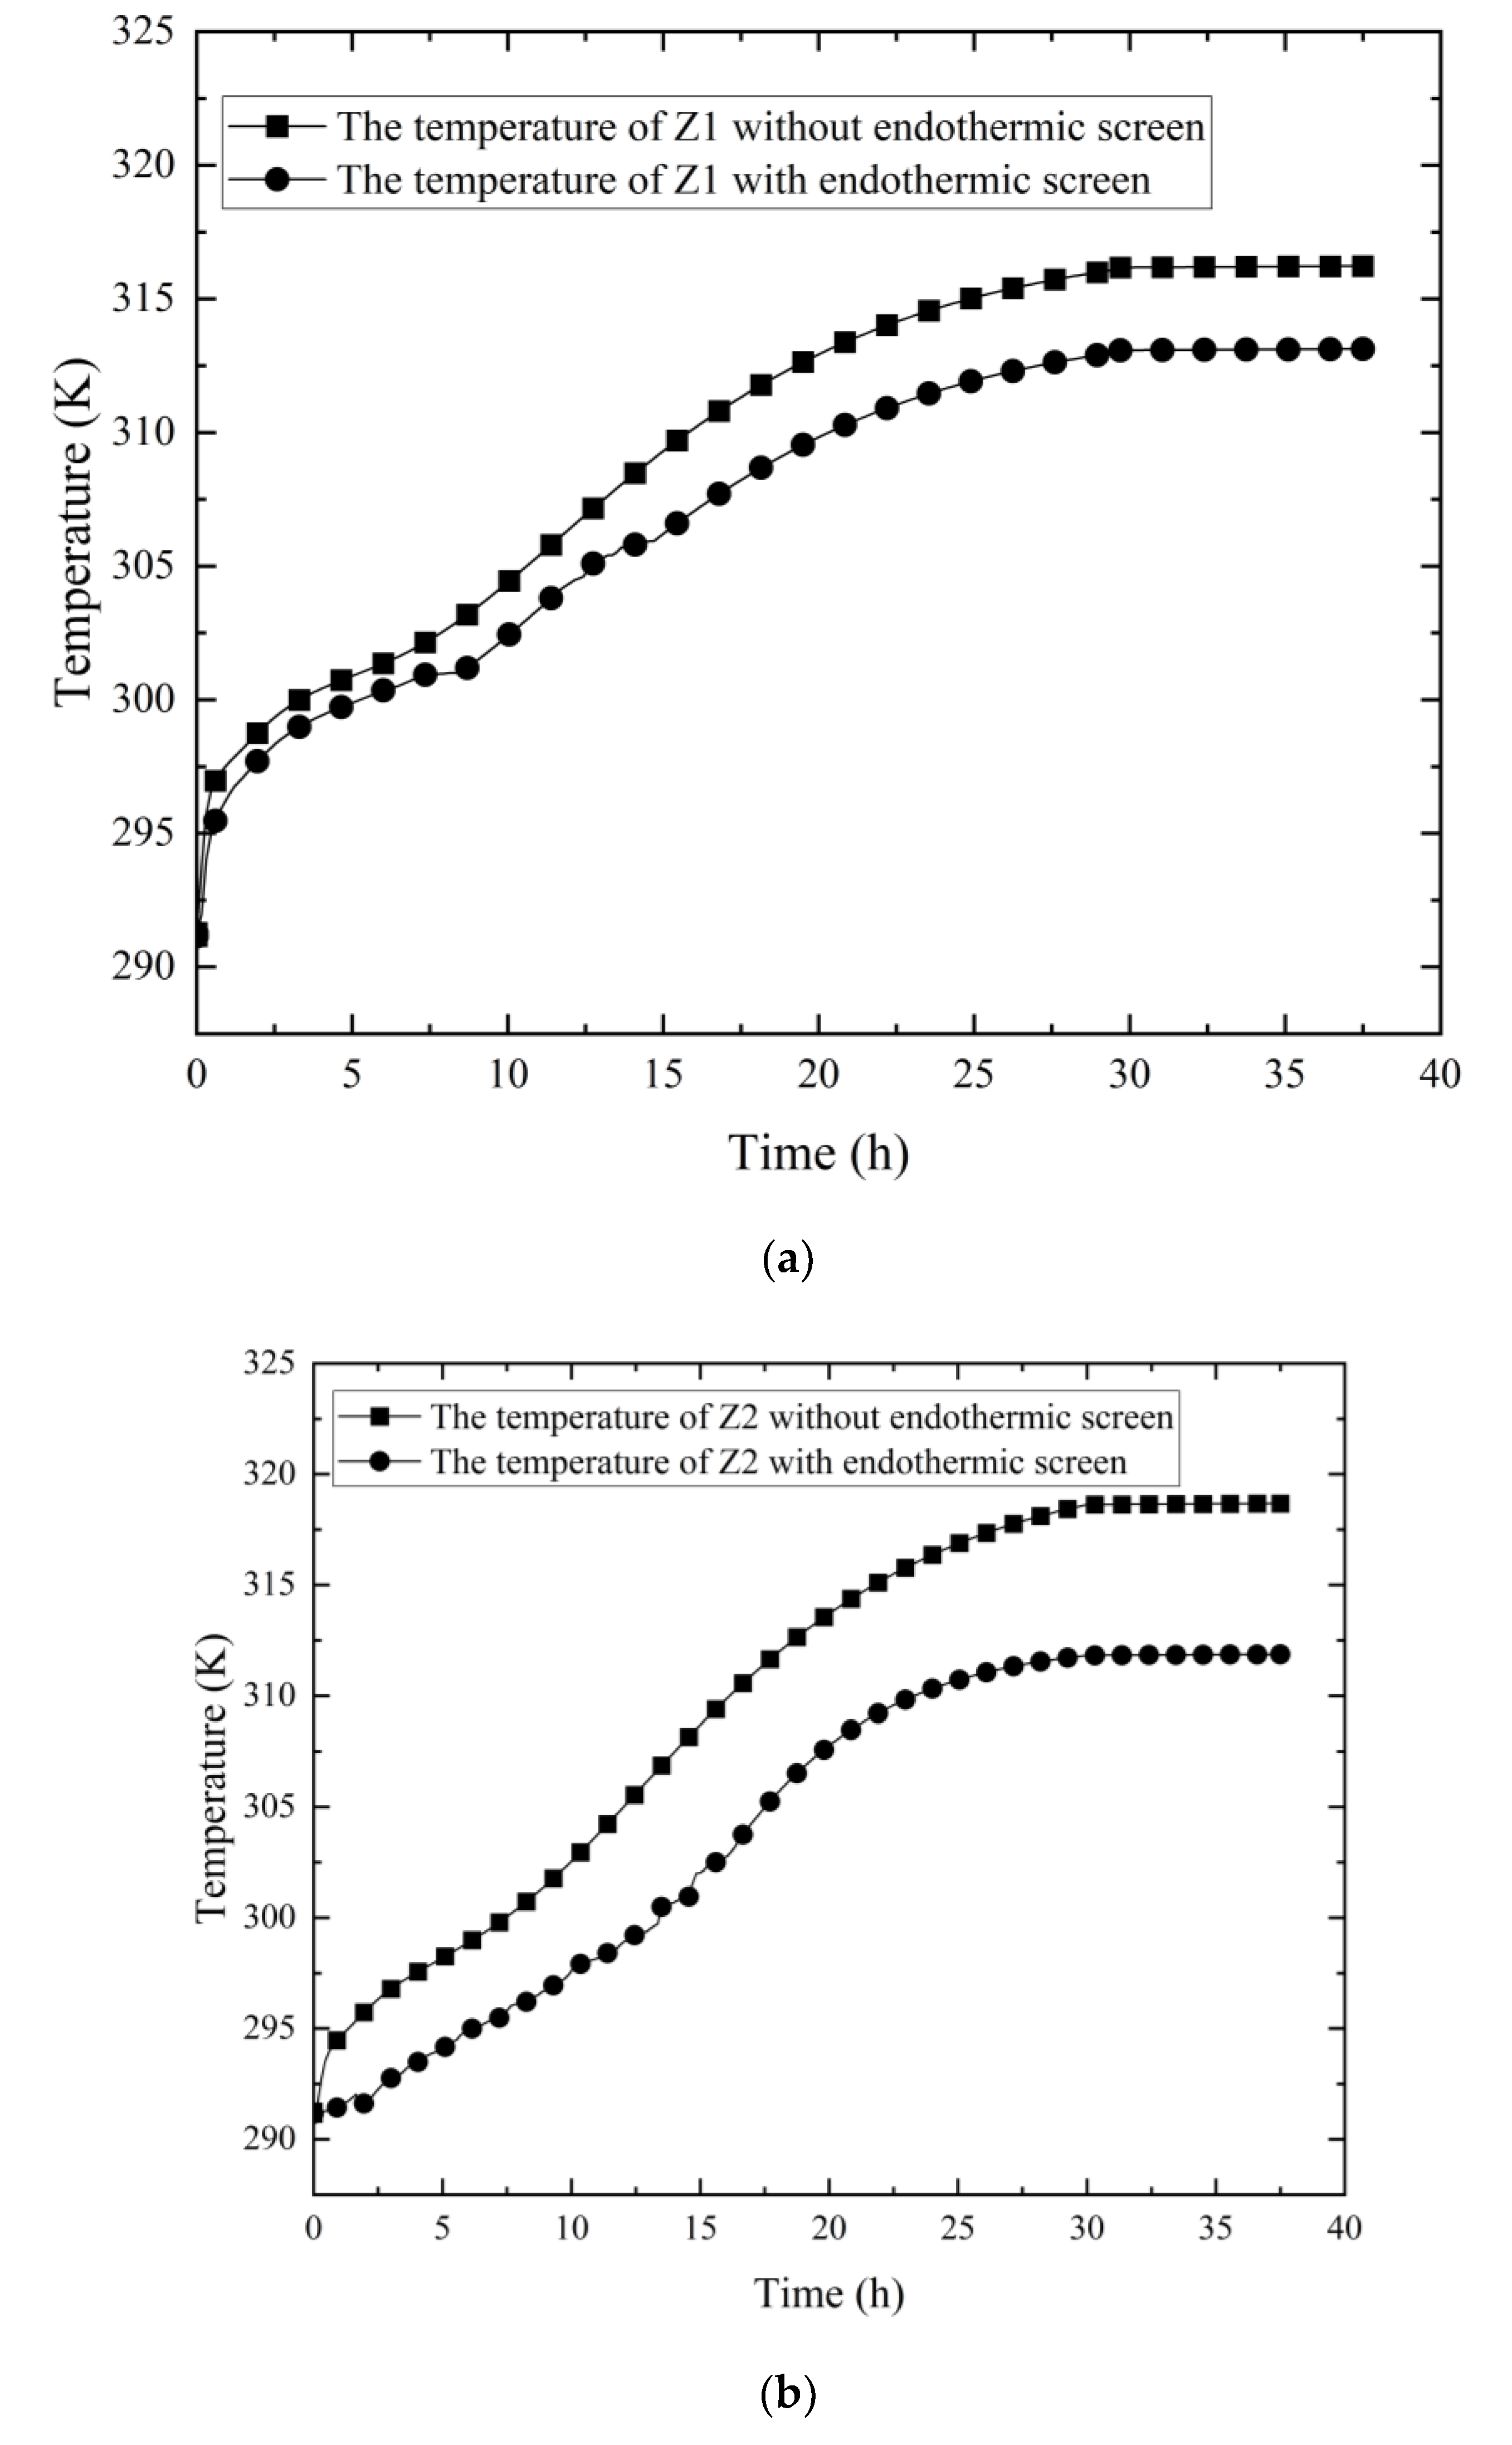
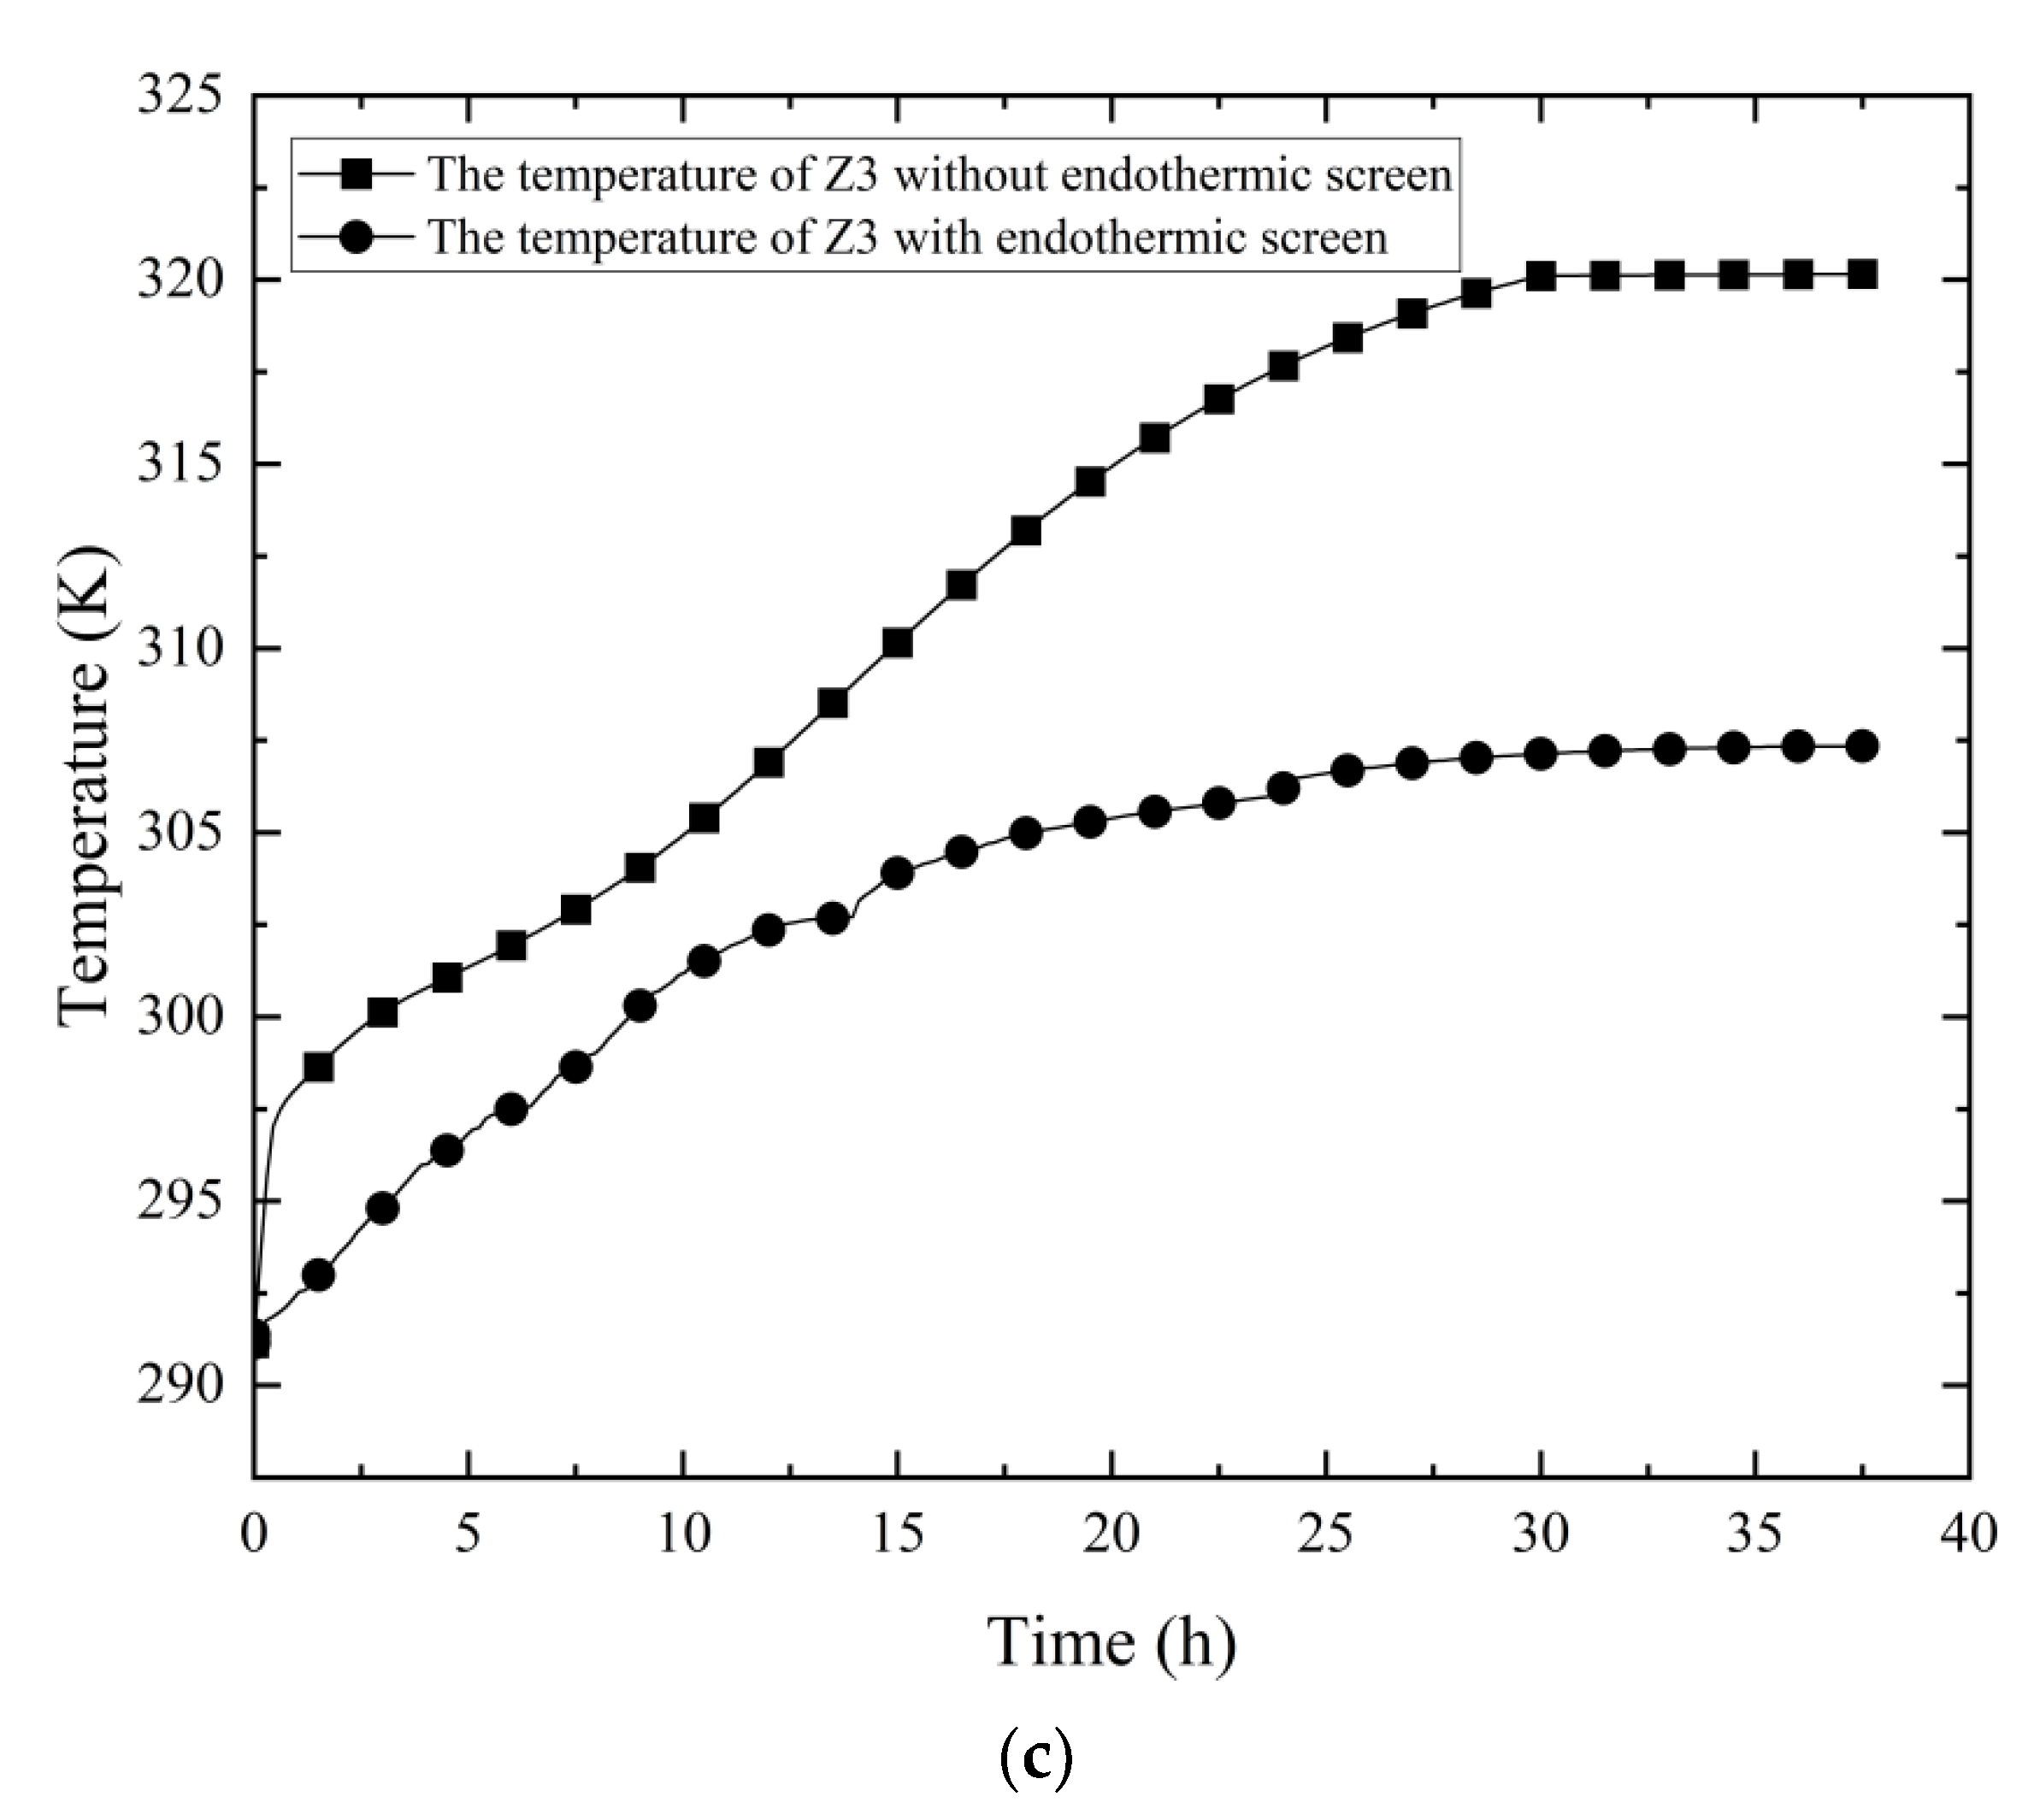
3.2. Analysis of Indoor Monitoring Point

From Figure 7, it can be seen that the temperature of the three temperature measurement points of the plant with an endothermic screen is significantly lower than the temperature of the plate without an endothermic screen. In the absence of an endothermic screen, the temperature of the three temperature measurement points Z1, Z2 and Z3 is finally 316.2 K, 318.6 K and 320.1 K, respectively. The temperature rises higher in the vertical direction of the plant building, because the density of the air below decreases when it is exposed to the radiant heat emitted by the heat source, and the hot air will float to the upper floors of the room, resulting in stratification of the indoor temperature. After placing the endothermic screen, the temperature of the three temperature measurement points was finally 313.2 K, 311.8 K and 307.3 K, respectively. The radiant heat emitted from the heat source can be absorbed by the endothermic screen, and the heat is transferred to the heat transfer fluid through the screen and finally flows out of the room. The closer the endothermic screen is in the vertical direction, the better the cooling effect and the greater the temperature difference.

3.3. Analysis of Average Indoor Temperature

It can be seen from Figure 8 that when there is no endothermic screen in the plant, the temperature rise trend is obviously faster. After 34 h, the room temperature stabilized and finally remained at 313.2 K. When the endothermic screen works, the indoor temperature rise trend is obviously slow. The radiant heat emitted by the high-temperature heat source can be absorbed by the endothermic screen and transferred to the heat exchange fluid to flow out of the room. After 24 h, the temperature stabilized and finally remained at 305.6 K. In summary, the endothermic screen can significantly reduce the indoor temperature, and the cooling range is 7.67 K.

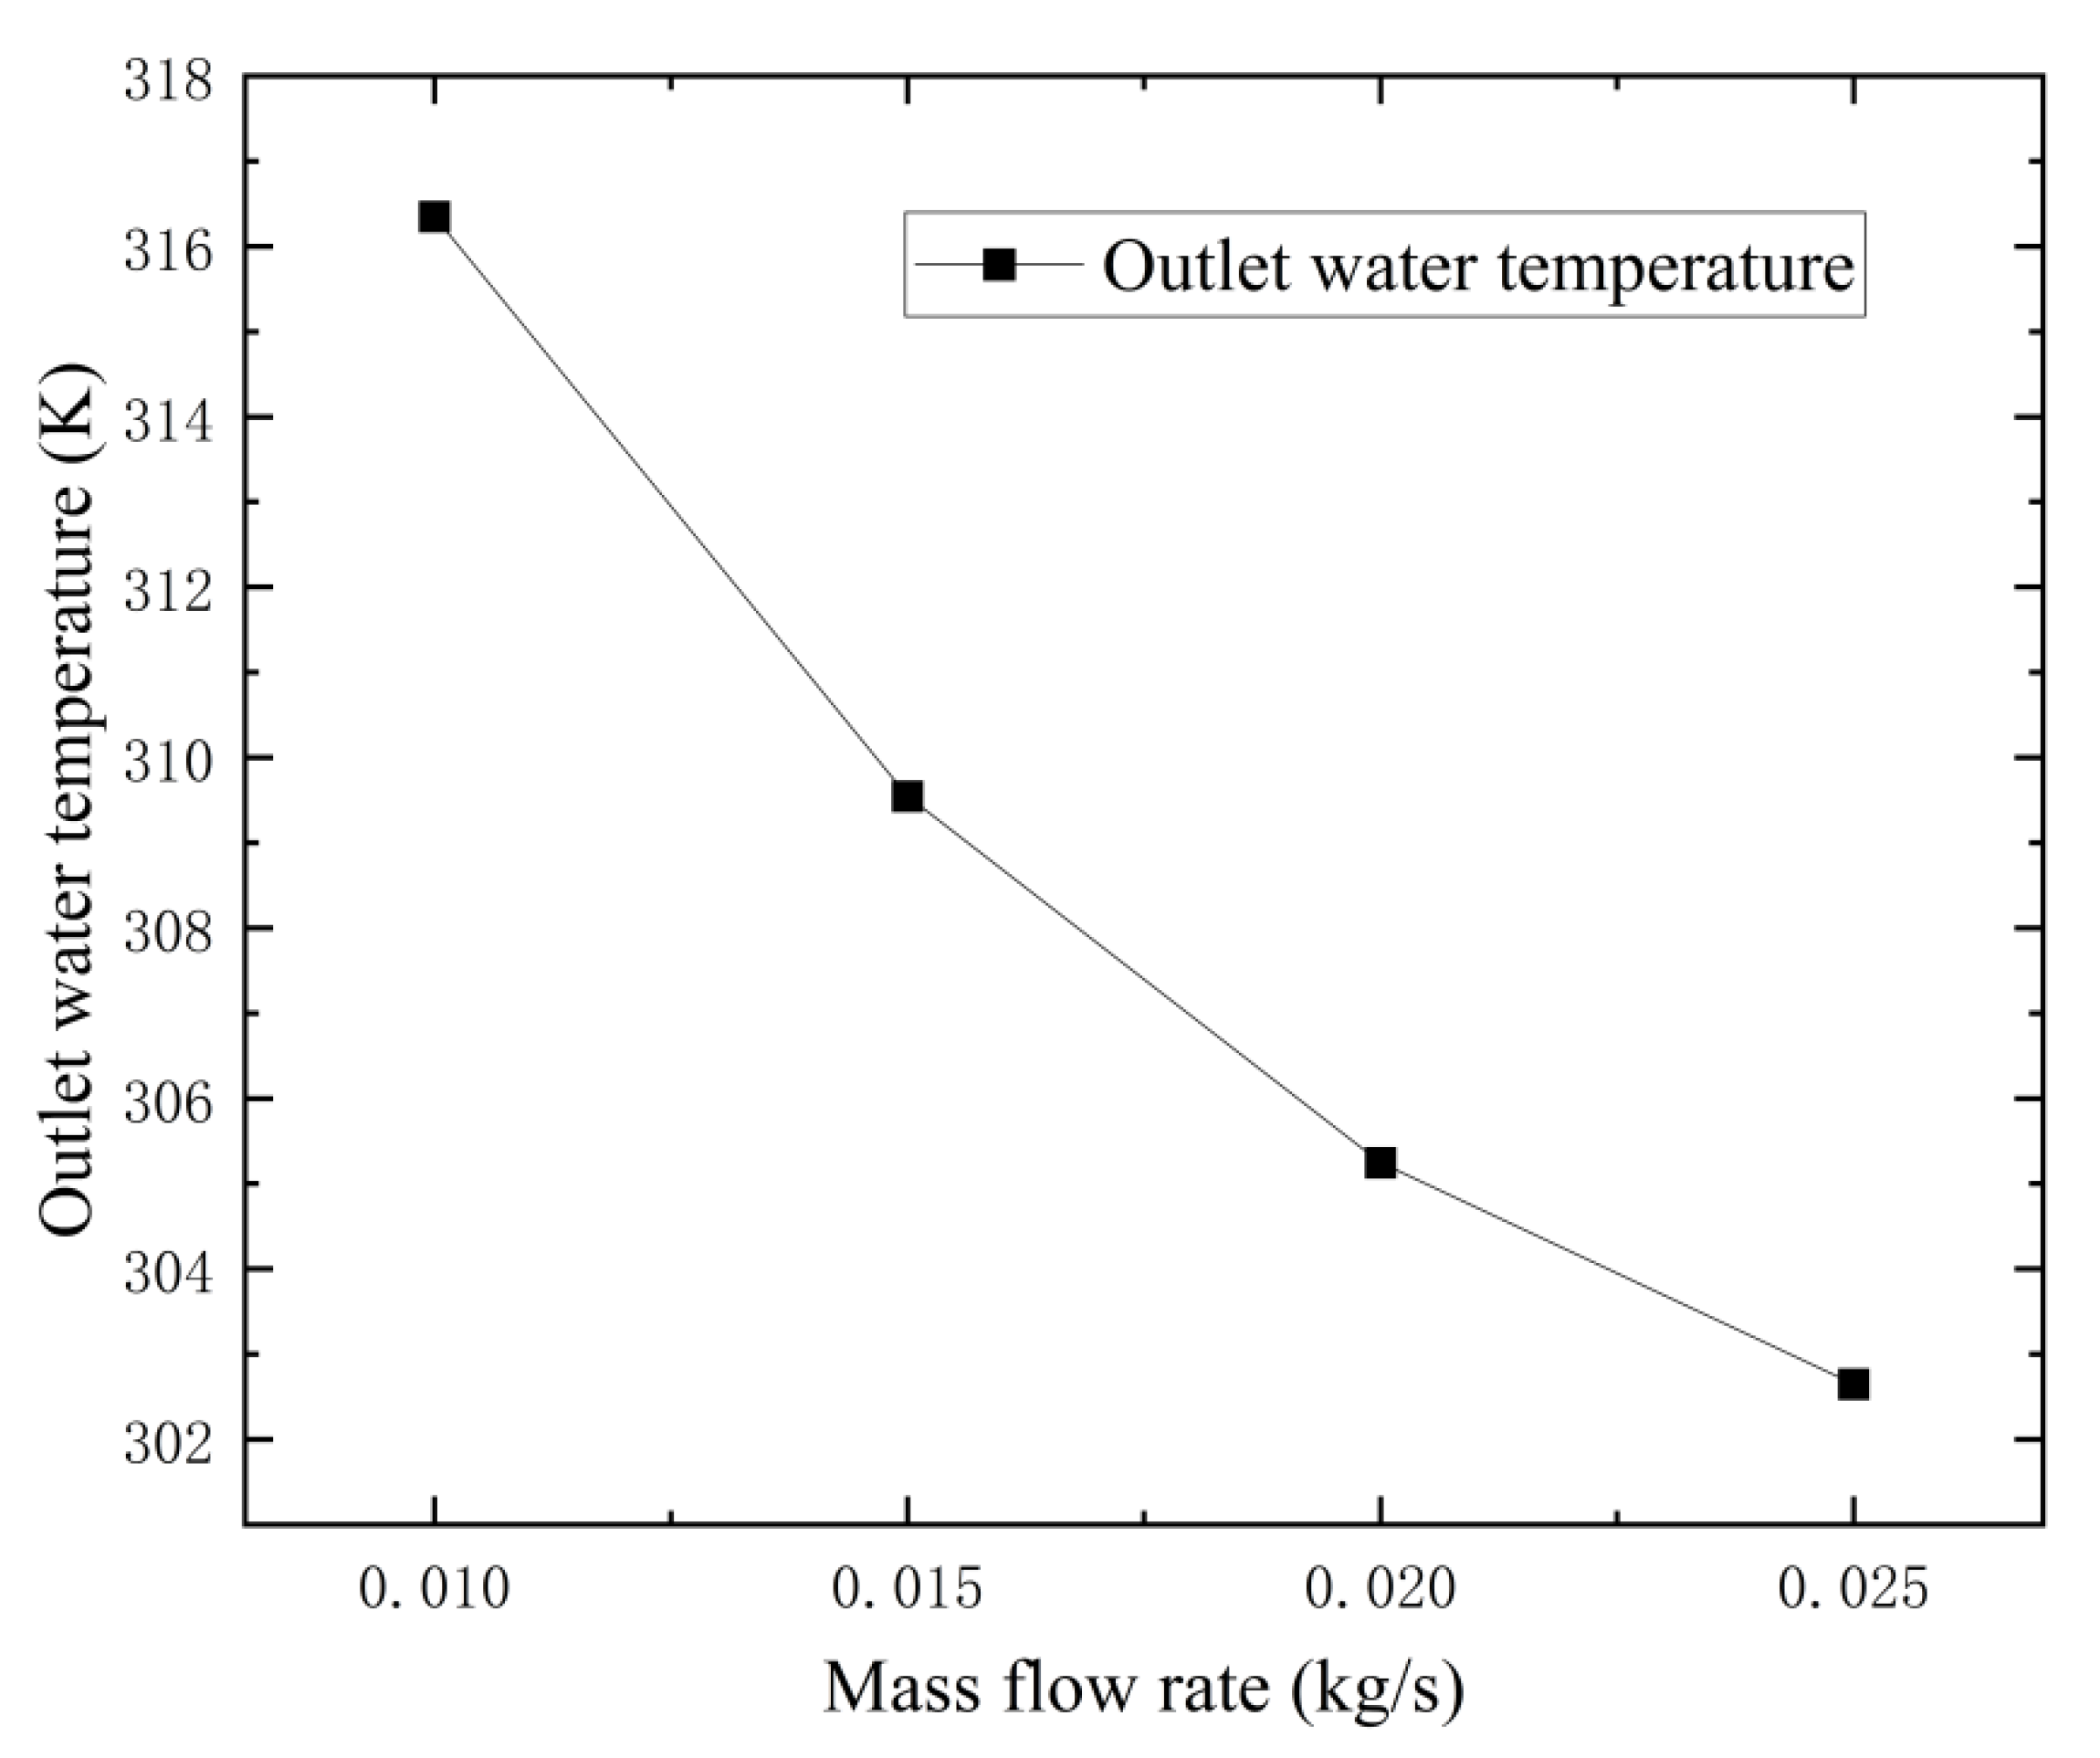
3.4. Analysis of Endothermic Screen Outlet Water Temperature

It can be seen from Figure 9 that when the mass flow rate of water at the inlet of the endothermic screen is 0.01, 0.015, 0.02 and 0.025 kg/s, the water temperature at the outlet of the endothermic screen is 317.3 K, 309.5 K, 305.3 K and 302.7 K, respectively. When the mass flow rate of water decreases, the temperature of the outlet water of the heat-absorbing screen increases. When the outlet water temperature of the endothermic screen is 317.3 K, it can be used for domestic hot water for plant workers. It not only saves energy, but also recovers the indoor waste heat and reduces the indoor temperature. In addition, a better working environment is created for factory workers and equipment.
As can be seen from Figure 10, the main high-temperature area of the room is near the heat source. When the endothermic screen is arranged above the high-temperature heat source, the temperature near the heat source is significantly reduced. There is also a certain decrease in temperature in other areas of the room. The radiation heat can be absorbed by the endothermic screen, the heat is transferred to the heat transfer fluid and the heat transfer fluid finally flows to the outdoors. A large amount of radiant heat in the plant will be continuously lost to the outside through the flow of heat transfer fluid. Obviously, the arrangement of the endothermic screen plays a key role in the cooling of the plant.

3.5. Waste Heat Recovery Efficiency

In this paper, we use FLUENT software for simulation. The inlet conditions of the endothermic screen were set to 0.01, 0.015, 0.02 and 0.025 kg/s, respectively, and the inlet water temperature remained constant at 18 °C. The radiant heat transfer between the surface of the high radiant heat equipment and the indoor environment is calculated according to Equation (2):
The heat absorbed by the cooling water in the endothermic screen tube can be calculated according to Equation (10).
Q w = q w c w ( T 2 T 1 )
In the formula: Q w is the absorption of heat from cooling water in the endothermic screen tube, W; q w is mass flow rate of cooling water in the endothermic screen tube, kg/s; c w is specific heat capacity of cooling water, J/(kg K); T 2 is temperature of cooling water outlet, T; T 1 is temperature of cooling water inlet, T.
The relationship between waste heat recovery rate and water mass flow is shown in Figure 11.
When the mass flow rate of water is 0.01, 0.015, 0.02 and 0.025 kg/s, the waste heat recovery efficiency is 50.8%, 53.8%, 54.9% and 56.0%, respectively, and the waste heat recovery effect is obvious. When the mass flow rate of water increases, the endothermic screen can absorb more radiant heat. As a result, more radiant heat in the plant is transferred to the outside. The waste heat recovery efficiency of the heat-absorbing screen is thus increased.

4. Conclusions

In this paper, simulation software is used to place three endothermic screens directly above the heat source. The role of an endothermic screen in waste heat recovery and reducing plant temperature was studied. The measurement point temperature, indoor temperature and inlet and outlet water temperature were analyzed by FLUENT simulation, and the following conclusions were obtained:
(1)
In this paper, it is derived that radiant heat transfer dominates the heat dissipation of a high radiant heat source, and the convective heat transfer with air is negligible.
(2)
The endothermic screen can significantly reduce the indoor temperature when working, and the cooling range is 7.67 K, which has a cooling effect.
(3)
The waste heat recovery efficiency of the endothermic screen is about 56%, which can absorb most of the high radiant heat emitted by the heat source. The high-temperature environment in the plant is optimized. The endothermic screen can be used in high radiant heat plants such as metallurgical and thermal power plants.
The results of this research can provide a new method for indoor cooling and waste heat recovery in high radiant heat plants. For example, it can be applied to industrial plants such as ironmaking plants, coal-fired power plants, etc. It can achieve the purpose of saving energy and using waste heat at the same time. Subsequently, the structure of the endothermic screen can be optimized to improve the efficiency of waste heat recovery. Endothermic screens can also be combined with natural ventilation. We are currently building an experimental platform. Finally, we will compare the experimental results with the simulation results.

Author Contributions

Writing—original draft, J.Z.; Writing—review & editing, H.W. All authors have read and agreed to the published version of the manuscript.

Funding

The authors gratefully acknowledge the financial support for this work provided by Anhui Provincial Key Research and Development Planning Foundation (202004a07020019, 202004a07020049).

Data Availability Statement

The data presented in this study are available on request from the corresponding author.

Conflicts of Interest

The authors declare no conflict of interest. The authors declare that they have no known competing financial interests or personal relationships that could have appeared to influence the work reported in this paper.

Nomenclature

Symbol Description
Q heat dissipation of High radiant heat source, W
Q r a d high radiant heat source and indoor air radiation heat transfer, W
Q con convective heat transfer between the surface of a high radiant heat source and indoor air, W
A b high radiant heat source surface area, m2
ε b high radiant heat source surface emissivity, dimensionless
σ Stephen–Boltzmann constant, σ = 5.67 × 10⁻⁸ W/(m2·K4)
T b high radiant heat source surface temperature, T
T a ambient air temperature, T
high convective heat transfer coefficient between radiant heat source and surrounding air, W/(m2·K)
C constant, dimensionless
n constant, dimensionless
λ a thermal conductivity of the air in the plant, W/(m·K)
l b high-radiation heat source characteristic length, m
GrGrashof number, dimensionless
PrPrandtl number, dimensionless
gacceleration of gravity, g = 9.8 m/s2
v volume expansion coefficient of air in the plant, 1/K
ν kinematic viscosity coefficient of air in the plant, m2/s
μ aerodynamic viscosity coefficient in the plate, N/(m2/s)
C p air constant pressure specific heat capacity of the plant, J/(kg·K)
Iratio of radiative heat dissipation to convective heat exchange for high radiant heat sources, dimensionless
η heat recovery efficiency, dimensionless
Q w absorption of heat from cooling water in the endothermic screen tube
Lower Corner
radradiation heat
conconvection heat
aair
pplant
wwater

References

  1. Johnson, I.; Choate, W.T.; Davidson, A. Waste Heat Recovery. Technology and Opportunities in U.S. Industry; BCS Inc.: Washington, DC, USA, 2008. [Google Scholar]
  2. Royo, P.; Acevedo, L.; Arnal, Á.J.; Diaz-Ramírez, M.; García-Armingol, T.; Ferreira, V.J.; Ferreira, G.; López-Sabirón, A.M. Decision support system of innovative high-temperature latent heat storage for waste heat recovery in the energy-intensive industry. Energies 2021, 14, 365. [Google Scholar] [CrossRef]
  3. Chen, W.H.; Chiou, Y.-B.; Chein, R.Y.; Uan, J.Y.; Wang, X.D. Power generation of thermoelectric generator with plate fins for recovering low-temperature waste heat. Appl. Energy 2022, 306, 118012. [Google Scholar] [CrossRef]
  4. Sidik, N.A.C.; Kean, T.H.; Chow, H.K.; Rajaandra, A.; Rahman, S.; Kaur, J. Performance enhancement of cold thermal energy storage system using nanofluid phase change materials: A review. Int. Commun. Heat Mass. Transf. 2018, 94, 85–95. [Google Scholar] [CrossRef]
  5. Meng, X.; Wang, Y.; Lv, Y.; Yang, H. Characteristics analysis of convection and radiatation in industrial plants with high temperature heat source. Heat. Vent. Air Cond. 2016, 46, 36–39. [Google Scholar]
  6. Hendricks, T.; Choate, W.T. Engineering Scoping Study of Thermoelectric Generator Systems for Industrial Waste Heat Recovery; US Department of Energy: Washington, DC, USA, 2006. [Google Scholar]
  7. Ammar, Y.; Joyce, S.; Norman, R.; Wang, Y.; Roskilly, A.P. Low grade thermal energy sources and uses from the process industry in the UK. Appl. Energy 2012, 89, 3–20. [Google Scholar] [CrossRef]
  8. Zhang, S.; Zhu, N.; Lu, S. Responses of human perception and skin temperature to directed thermal radiation in hot environments. Build. Environ. 2021, 197, 107857. [Google Scholar] [CrossRef]
  9. Li, X.; Chow, K.H.; Zhu, Y.; Lin, Y. Evaluating the impacts of high-temperature outdoor working environments on construction labor productivity in China: A case study of rebar workers. Build. Environ. 2016, 11, 42–52. [Google Scholar] [CrossRef]
  10. Piver, W.T.; Ando, M.; Ye, F.; Portier, C.J. Temperature and air pollution as risk factors for heat stroke in Tokyo, July and August 1980–1995, Environment. Health Perspect. 1999, 107, 911–916. [Google Scholar] [CrossRef] [PubMed]
  11. Arifwidodo, S.D.; Chandrasiri, O. Urban heat stress and human health in Bangkok, Thailand. Environ. Res. 2020, 185, 109398. [Google Scholar] [CrossRef]
  12. Jing, Z.; Zhu, N.; Lu, S. Productivity model in hot and humid environment based on heat tolerance time analysis. Build Environ. 2009, 44, 2202–2207. [Google Scholar]
  13. Gay, L.; Gracia, R.; Mongruel, S.; Wizenne, E. Effects of cable fire smoke on electronic boards. Fire Saf. Sci. 2014, 11, 1035–1048. [Google Scholar] [CrossRef]
  14. Zhu, C.; Deng, X.; Zhang, R.; Lu, J.; Meng, Q.; Li, S.; Jiang, H. Numerical Analysis of Spray Cooling on the Roof Surface of Industrial Factory—Based on the Humidity and Temperature Environment. Ind. Technol. Innov. 2018, 5, 83–88. [Google Scholar]
  15. Nayak, A.K.; Hagishima, A.; Tanimoto, J. A simplified numerical model for evaporative cooling by water spray over roof surfaces. Appl. Therm. Eng. 2020, 165, 114514. [Google Scholar] [CrossRef]
  16. Yang, Y.; Cai, Y.; Huang, Y.; Liu, Z.; Xu, F. Fuzzy Optimization Research on Thermal Comfort of Atrium Space in Ofice Buildings under the Natural Ventilation Environment. J. Hum. Settl. West China 2022, 37, 119–125. [Google Scholar]
  17. Zhao, Y.; Shi, F.; Jiang, D. Numerical simulation and analysis of air conditioning cooling effect at working face. China Coal 2011, 37, 108–111. [Google Scholar]
  18. Wang, X.; Zhang, H.; Yang, H.L.; Chen, H.K.; Hu, Z.J. High Temperature Resistant Heat Insulating Material Simulation and Experimental Verification. Aerosp. Mater. Technol. 2014, 44, 92–96. [Google Scholar]
  19. She, X.; Cong, L.; Nie, B.; Leng, G.; Peng, H.; Chen, Y.; Zhang, X.; Wen, T.; Yang, H.; Luo, Y. Energy-efficient and -economic technologies for air conditioning with vapor compression refrigeration: A comprehensive review. Appl. Energy 2018, 232, 157–186. [Google Scholar] [CrossRef]
  20. Walker, R.; Pavía, S. Thermal performance of a selection of insulation materials suitable for historic buildings. Build. Environ. 2015, 94, 155–165. [Google Scholar] [CrossRef]
  21. Zhao, Z.; Luo, L.; Qiu, D.; Wang, Z.; Sundén, B. On the solar air heater thermal enhancement and flow topology using differently shaped ribs combined with delta-winglet vortex generators. Energy 2021, 224, 119944. [Google Scholar] [CrossRef]
  22. Zäll, E.; Nordenström, A.; Järn, M.; Mossegård, J.; Wågberg, T. Environmentally sustainable electroplating of selective cobalt-chromium coating on stainless steel for efficient solar collectors. Sol. Energy Mater. Sol. Cells 2022, 245, 111821. [Google Scholar] [CrossRef]
  23. Kim, J.; Lee, J.-H.; Song, T.-H. Vacuum insulation properties of phenolic foam. Int. J. Heat Mass Transf. 2012, 55, 5343–5349. [Google Scholar] [CrossRef]
Figure 1. Endothermic screen model.
Energies 16 04196 g001
Figure 2. Model picture: (a) Model picture of plant without endothermic screen; (b) Model picture of plant with endothermic screen.
Energies 16 04196 g002
Figure 3. (a) Mesh map of plant without endothermic screen; (b) X cross-sectional map; (c) Y cross-sectional map; (d) Z cross-sectional map.
Energies 16 04196 g003
Figure 4. (a) Mesh map of plant with endothermic screen; (b) X cross-sectional map; (c) Y cross-sectional map; (d) Z cross-sectional map.
Energies 16 04196 g004
Figure 5. Schematic diagram of the monitoring point.
Energies 16 04196 g005
Figure 6. Temperature profile of heat source.
Energies 16 04196 g006
Figure 7. Comparison of temperature variation curves of indoor monitoring points: (a) Curve of Z1; (b) Curve of Z2; (c) Curve of Z3.
Energies 16 04196 g007aEnergies 16 04196 g007b
Figure 8. Comparison of average indoor temperature.
Energies 16 04196 g008
Figure 9. Analysis of temperature map.
Energies 16 04196 g009
Figure 10. Maps: (a) Temperature map of plant without endothermic screen (X cross-section); (b) Temperature map of plant with endothermic screen (X cross-section); (c) Temperature map of plant without endothermic screen (Y cross-section); (d) Temperature map of plant with endothermic screen (Y cross-section); (e) Temperature map of plant without endothermic screen (Z cross-section); (f) Temperature map of plant with endothermic screen (Z cross-section).
Energies 16 04196 g010
Figure 11. Graph of waste heat recovery efficiency with mass flow rate.
Energies 16 04196 g011
Table 1. Model parameters.
TitleParametersTitleParameters
length, width and height of the room (mm)6000, 3500, 3800Thickness of shell, endothermic board and insulation layer (mm)1.5, 1, 40
length, width and thickness of the door (mm)2000, 800, 50diameter of Serpentine tube (mm)25
length, width and thickness of the window (mm)900, 900, 5distance of Serpentine tube (mm)20
length, width and thickness of the endothermic screens (mm) 1600, 700, 92.5
Table 2. Material parameters.
Name of MaterialDensity Ρ (kg/m3)Specific Heat Capacity cp (J/kg·K)Thermal
Conductivity
Λ (W/m·K)
Viscosity
μ (kg/m·s)
water998.6242000.5991.81 × 10−5
air1.20510040.02670.001003
wood71017200.15/
glass25008371.09/
stainless steel502.48792016.27/
copper8960390387/
aluminum alloy2700880155/
phenolic foam5027300.023/
brick wall185010000.4/
Table 3. Boundary condition parameters.
Boundary NameParameter Settings
Wallhybrid boundaries, surface emissivity: 0.9, convective heat transfer coefficient: 8 W/(m2 K)
Windowhybrid boundaries, surface emissivity: 0.93, convective heat transfer coefficient: 4 W/(m2 K)
Doorhybrid boundaries, surface emissivity: 0.85, convective heat transfer coefficient: 1.75 W/(m2·K)
Endothermic platefluid–structure interaction boundary, opaque media, absorptivity: 0.96
Serpentine tubefluid–structure interaction boundary, opaque media
Shellhybrid boundaries, surface emissivity: 0.55, convective heat transfer coefficient: 0.45 W/(m2·K)
Endothermic screen fluid inletspeed inlet, inlet temperature: 18 °C; mass flow: 0.01 kg/s, 0.015 kg/s, 0.02 kg/s, 0.025 kg/s
Endothermic screen fluid outletpressure outlet
Table 4. Control parameters.
TypeOptionsParameters
Discrete itemsDiscrete OrdinatesFirst Order Upwind
EnergyFirst Order Upwind
MomentumSecond Order Upwind
PressBody Force Weighted
GradientLeast Squares Cell Based
Relaxation factorsPress0.3
Density1
Body Forces1
Momentum0.7
Turbulent Kinetic Energy0.8
Discrete1
ResidualsContinuity0.001
X Velocity0.001
Y Velocity0.001
Z Velocity0.001
Energy1 × 10−6
InitializationK0.001
Epsilon0.001
Initialization MethodsStandard Initialization
Temperature©18
Disclaimer/Publisher’s Note: The statements, opinions and data contained in all publications are solely those of the individual author(s) and contributor(s) and not of MDPI and/or the editor(s). MDPI and/or the editor(s) disclaim responsibility for any injury to people or property resulting from any ideas, methods, instructions or products referred to in the content.

