Article

A Mass Balance-Based Method for the Anaerobic Digestion of Rice Straw

by
Maurizio Bressan
1,
Elena Campagnoli
1,*,
Carlo Giovanni Ferro
2 and
Valter Giaretto
1
1
Department of Energy, Politecnico di Torino, C.so Duca degli Abruzzi 24, 10129 Torino, Italy
2
Department of Mechanical and Aerospace Engineering, Politecnico di Torino, C.so Duca degli Abruzzi 24, 10129 Torino, Italy
*
Author to whom correspondence should be addressed.
Energies 2023, 16(11), 4334; https://doi.org/10.3390/en16114334
Submission received: 19 April 2023 / Revised: 17 May 2023 / Accepted: 24 May 2023 / Published: 25 May 2023
(This article belongs to the Special Issue Advances in Bioenergy)

Abstract

:
Current rice straw disposal practices have serious repercussions on the environment and, in addition, do not consider its energy potential. On the contrary, the anaerobic digestion of rice straw makes it possible to produce renewable energy and to reintroduce into the soil the nutrients present in the digestate, at the same time, reducing greenhouse gas emissions from paddies. For rice straw of different geographical origin, by applying a mass balance method to the digester, the minimum requirements in terms of conditioners (nitrogen, phosphorus and potassium) and water, which allow obtaining the maximum production of methane, were calculated. The results obtained show that after the first 30 days (hydraulic retention time) for each ton of rice straw digested, the daily water consumption varies considerably from one country to another, from a minimum value of 1.5 m3/d to a maximum of 4.3 m3/d. After the same time, the addition of nitrogen and phosphorus is only required for the optimal anaerobic digestion of Indian rice straw. The low presence of these elements in Indian straw requires an addition of 3 kg/d of urea and 1.5 kg/d of superphosphate to compensate for the lack of nitrogen and phosphorus, respectively. In all the examined cases, the concentration of potassium, even if higher than the optimal value, does not reach levels that can significantly affect the methane production.

1. Introduction

The availability of fossil fuels closely linked to geopolitical aspects, together with their progressive depletion and their harmful impact on the environment, requires growing attention to renewable energy sources. Among all the options available, biomasses, especially those of agricultural origin, represent a source of great interest. The advantage linked to the use of agricultural waste is particularly evident considering that the two most important objectives to be achieved in the current century are the increase in the availability of food and energy.
In the case of rice, which, albeit to varying degrees, is grown all over the world [1], production in 2017 was estimated at over 750 million tons [2] with a mass of residual straw which, depending on the variety of rice, is from 0.41 to 3.96 times the rice produced [2,3]. The management of this agricultural residue currently takes place through open field burning ( O F B ) or soil incorporation ( S I ) [4,5,6,7] practices which, although advantageous, have a strong environmental impact. The first method sterilizes the soil but causes the production of particulate matter and greenhouse gases. The second method prevents the organic de-pauperization of the soil [8,9,10] but causes C H 4 emissions [11,12,13] whose extent depends, among other factors, on the flooding methods [14,15,16,17,18,19], on the F e content in the water used for irrigation [20,21,22,23] and on the conditioners used [24,25,26,27]. The IPCC [28] estimates C H 4 emissions from paddies on average at 1.82 kg/d/ha and forecasts an increase in the coming years due to global warming [29].
Following previous research [30] which suggested the collection and baling ( C B ) of rice straw ( R S ), this study proposes the energy enhancement of R S through anaerobic digestion ( A D ), a practice already followed in several countries including India [31,32] and China [33]. The choice of A D is linked to the fact that this method applied to R S has fewer limitations than pyrolysis and gasification which are, currently, applications still under study, to overcome problems such as the low production of syngas and the high presence of tar in the latter [34]. Anaerobic digestion compared to combustion [35,36], which is currently considered the best methodology from an economic point of view for the energy enhancement of R S [34], has the important advantage of also producing compost, which is a useful conditioner since it is rich in nutrients ( N , P , K , S i , etc.) and is also able to counteract soil depletion due to its high carbon content.
Figure 1 shows a typical scheme of a digester for biogas production. In the plant, the R S is first reduced in size in the milling unit and then introduced into the blender together with water and organic and inorganic substances. The resulting mixture is then fed into the digester where the biogas (mainly C H 4 and C O 2 ) is produced. The extracted digestate is sent to the dewatering unit, which separates it into two fractions: the compost, mainly solid, and the sludge which is mainly liquid and which can be totally or partially (in case of drainage) recirculated.
Many studies on the A D of R S are reported in the literature. Some of these address aspects related to both physical and chemical pre-treatments [32,37,38,39,40] which, together with the amount of volatile solids ( V S ) contained in the biomass [41], influence methane production. The temperature (20–45 °C for mesophilic A D and 46–60 °C for thermophilic A D ), pH (5.5–6.5) and mixture homogeneity are basic variables for the process as reported in [42,43,44,45]. The dependence of the biogas yield on the bacterial population and the growth rate of the latter, both strongly correlated to the amount of nutrients ( N , P and K ), are examined in [42,46,47,48]. The effect of the carbon to nitrogen ratio ( C / N ) in the digester affecting bacterial growth is reported in [49,50,51,52,53,54,55,56,57,58,59] and an optimal range of 20 to 30 is suggested. For R S showing C / N values higher than optimal, several studies reported examples of co-digestion with animal manure [60,61,62] which is useful for correcting the nutrient ratios and for supplying the initial bacterial load [32].
Conversely, in the current literature there is no evidence of analytical studies based on mass balances, which aim to optimize the anaerobic digestion process of R S . Although mass balances are proposed in [63], the methods and objectives are different. Firstly, the authors in [63] carried out an experimental activity while the study proposed here is numerical. In addition, in study [63], the mass balances aim to evaluate the quantities of C and nutrients in the digestate as well as in the compost and sludge while in the present work, the main aim is to minimize the consumption of both chemical additives and water.
In this work, the proposed method has been applied to rice straw of different geographical origins and a method has been suggested for the daily control of the digester, which is valid for both the start-up phase and for the steady-state management.

2. Materials and Methods

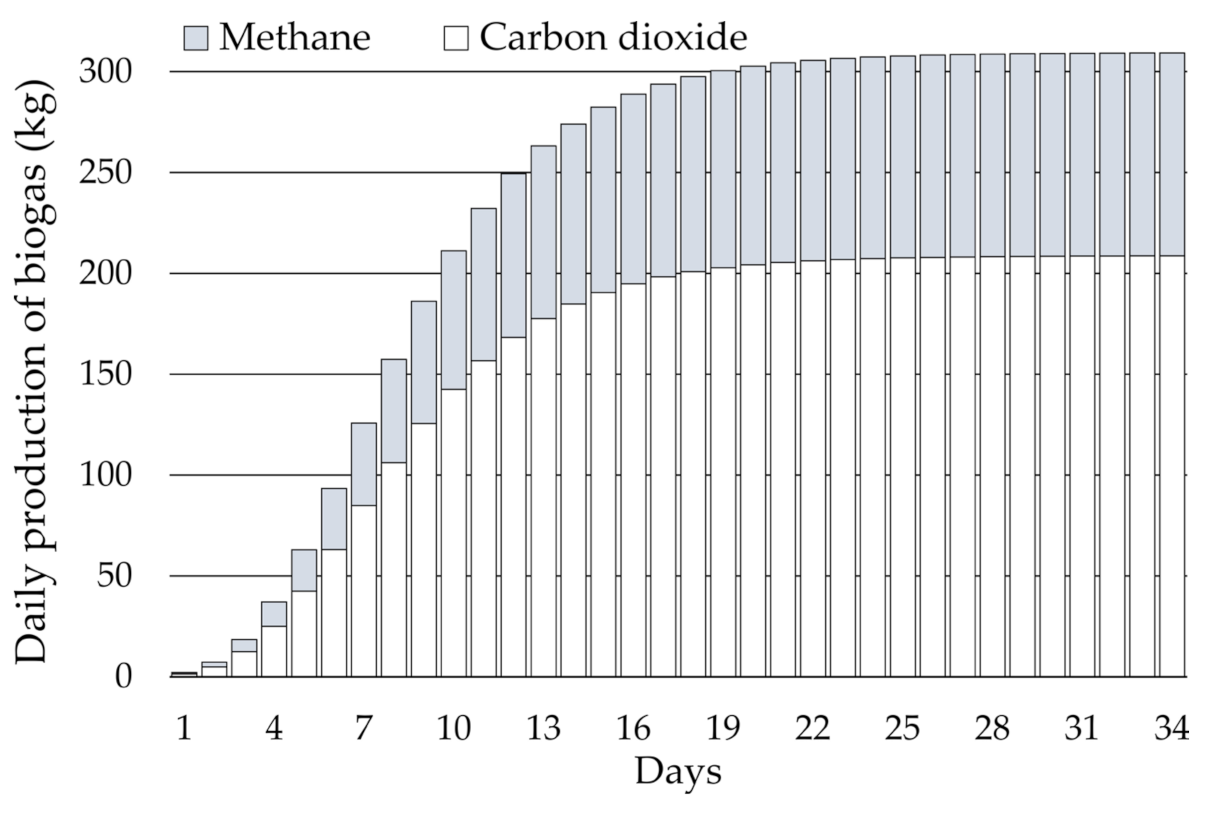
2.1. Rice Straw Characteristics and Biogas Production

The chemical composition of RS changes according to the rice variety [64], soil characteristics [65] and fertilization methods [66]. Conversely, moisture content simply depends on how long the straw is left on the field. The results of a literature review on the characteristics of RS in different countries are shown in Table 1. The values used for the following calculations are written in bold and refer to a specific analysis among those considered. Table 1 reports the mass fraction percentages for C and for nutrients ( N , P and K ) and the C / y ratios ( y = N ,   P ,   K ). The mass fraction of C in the table is not split in two parts (cellulosic and lignin) because only the cellulosic fraction produces methane but both fractions are used to evaluate C / y . In the table, all the other elements contained in the rice straw are lumped in the term Others ( O t h ). The water ( W ) content was assumed equal to 20% (W) because for the CB, a higher humidity could cause spontaneous fermentations. In Table 1, as in the following tables and figures, the names of the countries examined are reported using the country code abbreviations based on ISO 3166-1 alpha3.
The attitude of an organic waste to produce biogas (biogas potential— B P ) depends on its content in volatile solids ( V S ) which are a fraction of the total solids ( T S ). The amount of V S and the B P are variable as is the chemical composition of the R S [32,60]. Table 2 reports the values used in this study. Starting from the reported data (Table 2), for each ton of RS, a biogas yield of 270 m3 at room condition (25 °C, 1 atm) can be expected [60,81].
During AD, in addition to biogas, negligible quantities of other chemical substances ( N 2 O , H 2 S , N H 3 ) and water can be produced which will not be considered in the calculations [84]. Moreover, it has been assumed that the biogas production rate, closely related to the growth of bacteria, is described by the Gompertz function [85] as better explained later.

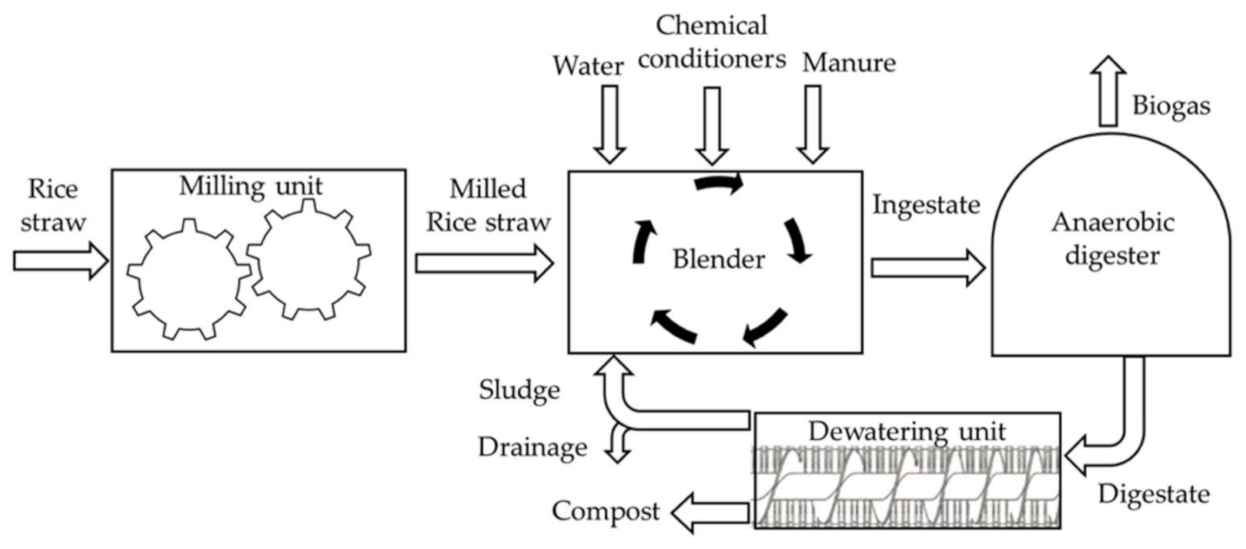
2.2. Plant Features: Anaerobic Digester and Dewatering Unit

The system assumed as reference for this study is a single-stage low solids anaerobic digester ( L S A D ) with a dry matter ( D M ) content lower than 15% [86].
In the digester, the production of biogas requires a period of time, called Hydraulic Retention Time (HRT). The HRT depends on both chemical (i.e., VS content) and physical (i.e., dimensions of the incoming biomass) factors and it affects the size of the digester. In this study, a HRT of 30 days [31,87] was assumed as reference.
After the HRT, the biomass residues are extracted from the digester and a new fresh charge of ingestate is introduced. The characteristics of the digestate change according to the variety of rice while the composition of both the solid fraction (e.g., compost) and the liquid one (e.g., sludge) depends not only on the digestate but also on the characteristics of the dewatering unit [88] sketched in Figure 1.
The dewatering unit considered in this study is a typical screw press separator. Inside the separator, the digestate flows along a cylindrical screen and it is partially drained. At the end of the screw axle, digestate is pressed against a steel filter completing the dewatering process. The dimensions of the particles contained in the digestate and the size of the pores of the filter determine the separation factor of the device [89].
Equation (1) reports the separation factor ( S f ) which is the ratio between the mass of compost ( M c o m ) and the mass of digestate ( M d i g ):
S f = M c o m M d i g .
In this study, the numerical value for S f was determined referring to [90], using Equation (2), which is valid for a percentage content of dry matter (DM%) in the range of 4.5%–10%:
S f = D M % 4.618 13.428 .
Equation (2) reports that, for a specific dewatering unit, S f depends on the quantity of DM in the digestate—the higher the DM content in the digestate, the higher the percentage of compost. The distribution between compost and sludge of the i _ t h constituent of the digestate (DM, C, N, P, K) is reported in Table 3 [90].
To obtain a digestate with DM% = 7.3 [90], at each charge of R S , the amount of water to be added must be evaluated based on the DM already present in the digester. The DM% contained in the substrate of a stirred digester is the same found in the digestate (ideal condition).

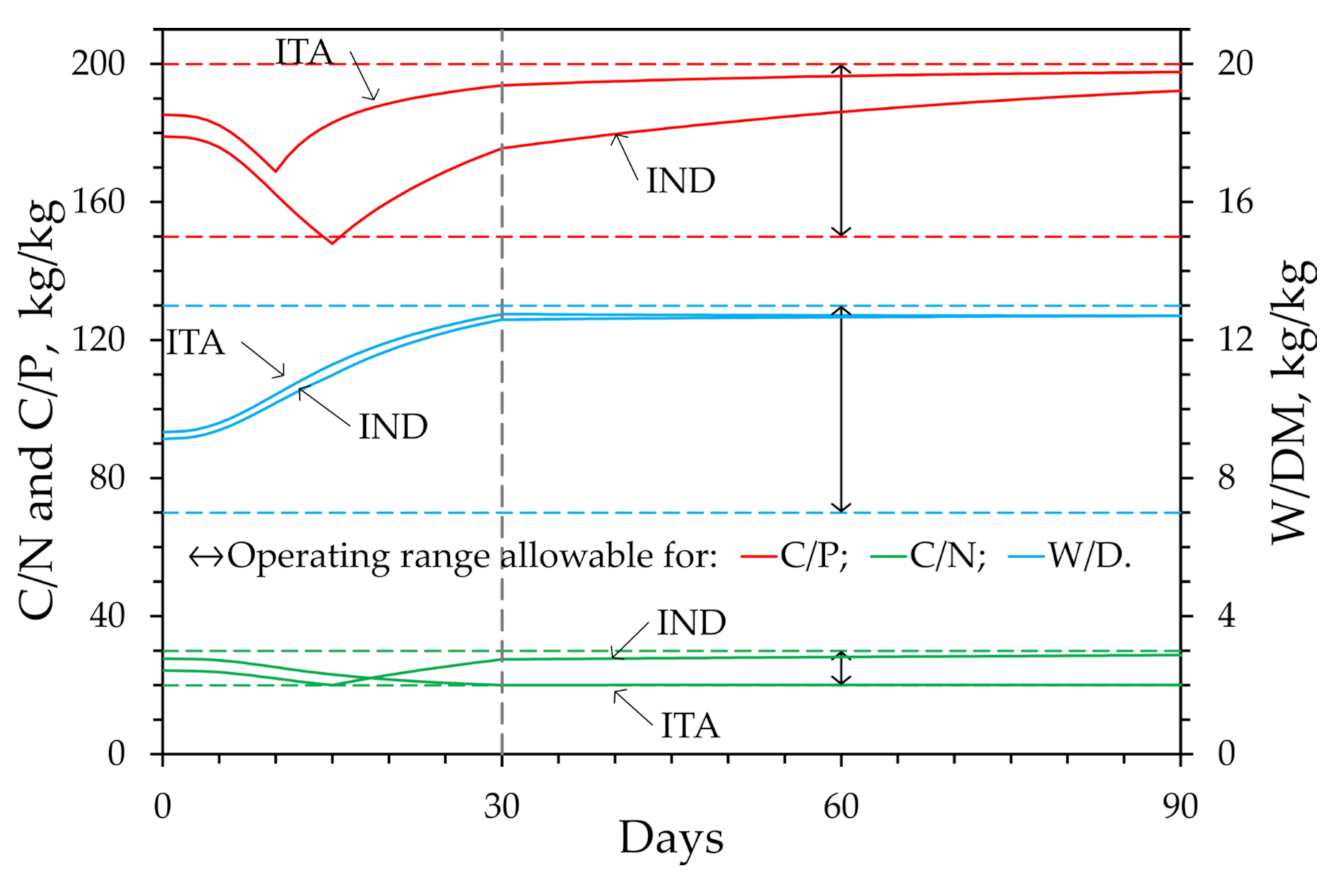
2.3. Carbon to Nutrients Ratios

As written above, the growth of bacteria and the biogas yield depend on the amount of nutrients. In the literature [47,49,50,51,52,53,54,55,56,57,58,59], the optimal quantities of nutrients are related to the C content into the digester (Table 4).
The comparison between the ratios reported in Table 4 and those of Table 1 highlights the need for an addition of N and P whose quantities must be determined taking into account that a fraction of the C contained in R S leaves the reaction environment as biogas (about 40% of the total amount). On the contrary, the comparison between the C / K ratios warns against an excessive accumulation of K into the digester that could reduce the production rate of biogas.

2.4. Chemical and Natural Conditioners: Characteristics
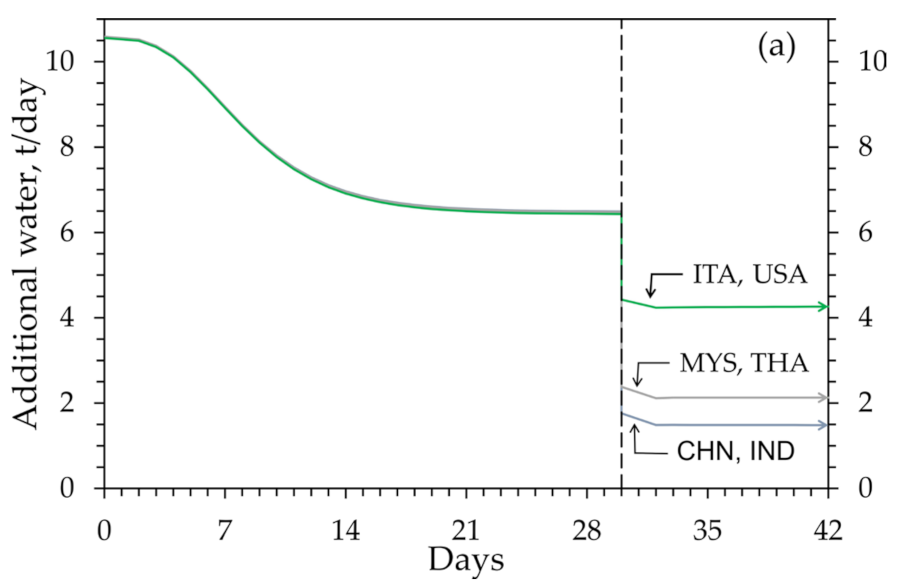
Usually, to regulate the C / y too high, an addition of chemical conditioners is recommended: urea (46% N), superphosphate (20% P) and potash (63% K). Furthermore, as written above, the use of manure (e.g., pig, cattle, chicken) is useful to increase the quantity of N and the initial bacteria population [32,60,61,62].
Table 5 highlights the ultimate analysis and the moisture content W for the chemical and natural conditioners selected for this study.

2.5. Methods

Based on the literature [49,50,51,52,53,54,55,56,57,58,59], the C / y ratios reported in Table 4 are assumed as technical factors to be respected to maximize the biogas production in an L S A D .
Figure 2 provides a schematic of the system with all the masses used to perform the balance on the digester.
The mass balances were performed by imposing the conservation of W and of the chemical species, in particular C , N , P and K .
In this study, each wet mass M j (e.g., M r s t , M u r e , M c o m , M d i g , etc.) was divided into two normalized fractions: one of water and one of dry matter. The latter was further subdivided into its constituents as shown in the following equation:
x W , j + x D M , j = x W , j + x C , j + x N , j + x P , j + x K , j + x O t h , j = 1 ,
where x W , j is the water content; x D M , j is the dry matter which is the sum of the fractions of C x C , j , N x N , j , P x P , j , K x K , j and O t h x O t h , j .
These fractions (Table 6) for both rice straw and organic/inorganic conditioners are known because they can be determined from the data reported in Table 1 and Table 5 by recalculating the percentages based on the wet mass of the substance instead of the dry mass.
The proposed model considers that during the H R T ( t R = 30 days), neither the digestate ( M d i g ) nor the recycled sludge ( M r s l ) are available. During this lapse of time, the composition of the ingestate ( M i n g ) changes continuously because at the beginning of each day, the mass inside the digester ( M D ) must respect the C / y ratios shown in Table 4. Additional water ( M a d w ) must be added to the wet masses of substances to obtain inside the digester a DM of 7.3%. After HRT, the mass balance must also take into account M r s l which affects both M a d w and the addition of nutrients.
During t R , the methane production follows the growth of methanogenic microorganisms described by the Gompertz distribution [85]. Based on this distribution, the volume V t of biogas produced and the volumetric rate of production d V t / d t are:
V t = V e x p l n V 0 V e x p t t C ,
d V t d t = V t t C ln V t V t = 0     d V t d t = V 0 t C l n V V 0 ;               t         d V t d t = 0 ,
where V 0 and V are the initial t = 0 and the maximum t volume of biogas produced. In the previous equations, t C is a characteristic time dependent on the initial microbial population whose value determines the latency time ( t L ) at which the production rate reaches its maximum value. Figure 3 reports a typical distribution of the rate of biogas production with t L = 7 days. During the production of biogas, the carbon content in M D proportionally decreases.
From the point of view of the mass balances, the digester, if accurately managed, reaches the steady state after t R = 30 days. Over a generic time interval Δ t = t k t k 1 , the mass balance on the digester is described by the following equation:
M i n g k M d i g k M b i o k = M D k M D k 1 Δ t ,
where M D k M D k 1 is the mass change inside the digester during a day.
At the end of the generic day k , Equation (6) becomes:
M D k = M D k 1 + M i n g k M d i g k M b i o k ,
where on the first day ( k = 1 ) M D k 1 = 0 . Table 7 shows the values used in Equations (6) and (7) on each of the k days.
The D M in the digester changes day by day because of both the biogas production ( M b i o k ) and D M contained in the ingestate ( M D M , i n g k ):
M D M , D k = M D M , D k 1 + M D M , i n g k M D M , d i g k M b i o k ,
where M D M , i n g k is:
M D M , i n g k = x D M , r s t M r s t k + x D M , m a n M m a n k + x D M , u r e M u r e k + x D M , s p h M s p h k + x D M , r s l M r s l k .
The terms in Equation (9) can assume different values based on k according to Table 7. At the beginning of each day, to obtain inside the digester the desired C / N and C / P (Table 4), the quantities of inorganic additives ( M u r e k and M s p h k ) must be determined starting from the equations:
C N = x C , r s t M r s t k + x C , m a n M m a n k + x C , u r e M u r e k + x C , D k 1 M D k 1 x C , D k 1 M d i g k + x C , s l d k 1 M r s l k x N , r s t M r s t k + x N , m a n M m a n k + x N , u r e M u r e k + x N , D k 1 M D k 1 x N , D k 1 M d i g k + x N , s l d k 1 M r s l k ,
C P = x C , r s t M r s t k + x C , m a n M m a n k + x C , u r e M u r e k + x C , D k 1 M D k 1 x C , D k 1 M d i g k + x C , s l d k 1 M r s l k x P , r s t M r s t k + x P , m a n M m a n k + x P , s p h M s p h k + x P , D k 1 M D k 1 x P , D k 1 M d i g k + x P , s l d k 1 M r s l k ,
where the mass fractions for the different substances in the ingestate are those reported in Table 6 and the mass   M D k 1 is known because it was determined on the previous day. The mass fractions of carbon and of the i t h constituent ( i = N ,   P ,   K , O t h ) already present inside the digester, and so in the digestate, on a generic k day are:
x C , D k = x C , r s t M r s t k + x C , m a n M m a n k + x C , u r e M u r e k x C , b i o M b i o k + x C , D k 1 M D k 1 x C , D k 1 M d i g k + x C , s l d k 1 M r s l k M D k ,
x i , D k = x i , r s t M r s t k + x i , m a n M m a n k + x i , u r e M u r e k + x i , s p h M s p h k + x i , D k 1 M D k 1 x i , D k 1 M d i g k + x i , s l d k 1 M r s l k M D k .
In the four previous equations, from Equations (10) to (13), the mass fractions for the sludge can be determined starting from the characteristic of the digestate and applying the coefficients reported in Table 3. Positive values for M u r e k and M s p h k in Equations (10) and (11) mean that an addition of conditioners is required while negative values highlight an excess of N and P inside the digester.
On the same day, the mass fractions of D M and W in the digester are:
x D M , D k = x D M , r s t M r s t k + x D M , m a n M m a n k + x D M , u r e M u r e k + x D M , s p h M s p h k M b i o k + x D M , D k 1 M D k 1 x D M , D k 1 M d i g k + x D M , s l d k 1 M r s l k M D k ,
x W , D k = x W , r s t M r s t k + x W , m a n M m a n k + x W , u r e M u r e k + x W , s p h M s p h k + x W , D k 1 M D k 1 x W , D k 1 M d i g k + x W , s l d k 1 M r s l k M D k .
In the considered L S A D , the ratio ( W / D M ) between water and dry matter is 12.7 (DM% = 7.3). Once the M D M , D k has been determined, through Equation (8), the total mass of water ( M W , D k ) is:
M W , D k = M D M , D k · W D M .
Consequently, on the same day, the mass of water to be added ( M a d w k ) is:
M a d w k = M W , D k M W , D k 1 + x W , D k 1 M d i g k x W , r s t M r s t k + x W , m a n M m a n k + x W , u r e M u r e k + x W , s p h M s p h k + x W , s l d k 1 M r s l k ,
and the total mass in the digester ( M D k ) is:
M D k = M D M , D k + M W , D k .
When k = 30 , M D k reaches its maximum allowed value with reference to the digester capacity. Starting from k > 30 , M d i g k 0 (Figure 2 and Table 7) and M s l u k (Table 3) is available. The recycled sludge ( M r s l k ) is useful to adjust the C / y in the digester and allows for no further addition of manure ( M m a n k = 0 ) because of its bacterial charge.
The proposed model, through an iterative calculation of M d i g k , aims to obtain in the digester a steady-state condition ( M D k M D k 1 ) paying attention to the C / y ratios. Since, among the C / y ratios, the one that has the greatest influence on biogas production is C / N , its value was assumed as a reference for the whole process. The iterative process was repeated for all the integer values of C / N in the range 20–30 looking for the value, which allows minimizing both the addition of chemical conditioners and water. After, the C / P and C / K ratio were calculated to highlight the need for conditioning.
The main steps of the iterative procedure can be summarized as follows:
  • A value for M d i g k is chosen and M s l u k is calculated;
  • The mass of recycled sludge ( M r s l k ) required to obtain the desired C / N ratio is evaluated using Equation (10), initially setting M u r e k = 0 ;
  • If   M r s l k > M s l u k , a mass M u r e k must be added. M u r e k is determined using again Equation (10);
  • The dry mass inside the digester M D M , D k is calculated using Equation (8) where M D M , i n g k is obtained applying Equation (9), setting M m a n k = 0 and M s p h k =0;
  • The mass of water M W , D k and of additional water M a d w k are determined using Equations (16) and (17), respectively;
  • A check is performed to verify if the steady state is reached:
M A D k M A D k 1 < ε ,
where ε is the maximum accepted deviation set at 0.01 kg. If this tolerance is not respected, a new value for M d i g k is chosen.
The most critical aspect of this method concerns the management of the digester when k 30 because the required amounts of water and nutrient change day by day. For this reason, using the previous results, another approach was also investigated in which, during the first 30 days, the daily quantities of inorganic additives and additional water are freely chosen, postponing the verification of C / N , C / P and W / D M . Furthermore, when k > 30 , the M d i g k value was fixed to the value previously calculated at the end of day k = 30 .
When M d i g k is fixed, the masses of compost ( M c o m k ) and sludge ( M s l u k ) are:
M c o m k = S f M d i g k ,
M s l u k = 1 S f M d i g k .
If the steady-state condition is imposed for the digester, the outgoing masses (   M c o m k ,   M d s l k ,   M b i o k ) will be equal to the incoming masses (   M r s t k ,   M u r e k ,   M s p h k , M a d w k ):
M c o m k + M d s l k + M b i o k = M r s t k + M u r e k + M s p h k + M a d w k .
The discharged sludge ( M d s l k ) is a fraction of M s l u k which is not recirculated and which, can be calculated using Equation (22) while M r s l k is:
M r s l k = M d i g k M c o m k + M d s l k .

3. Results and Discussion

The assumptions reported in Table 1, Table 2, Table 3, Table 4, Table 5, Table 6 and Table 7 were applied to the method proposed in this study and the results discussed in this paragraph are strictly related to these assumptions.
The daily trend of biogas production calculated using Equation (4) ( V = 270 m3, about 310 kg of biogas) is shown in Figure 4.
Figure 4 shows that the mass of C O 2 produced is significantly higher than the mass of C H 4 but this is not worrying for some different reasons. First, if reference is made to Table 2, it is possible to note that the volumetric production of C H 4 and C O 2 is approximately the same. Furthermore, A D as an alternative to SI reduces the emission of C H 4 , which has a global warming potential 28 times higher than C O 2 [92]. In addition, the amount of C O 2 produced during A D is lower than that which the plant has absorbed during its growth cycle [28].
Table 8 reports the quantities of by-products and of conditioners used to obtain the indicated C / N and C / P . The results for k 30 represent the total quantities accumulated in the digester over the entire period, while for k > 30 , the values refer to the daily requirement. Examining Table 8, it is possible to observe that during the first 30 days, the quantity of M u r e is in the range 350 kg–390 kg except for ITA and the USA, for which the need of urea is close to 250 kg due to the fact the initial C / N is lower.
For all the countries, up to k 30 , the total mass of water ( M a d w ) to be added to the digester is approximately the same because the same initial water content (20%) is assumed for all straws. When k > 30 , a mass of sludge rich in water is available and consequently, the daily water requirements change based on the fraction of sludge recirculated.
The nutrients carried by the sludge if returned to the digester can decrease the amount of conditioners needed. For the straw of Chinese and Indian origin, the sludge can be totally recirculated because of the low content in N and P of the straw (Table 1). Recirculating the sludge for IND, the daily amounts of urea and superphosphate reduce to 3 kg/d and 1.6 kg/d, respectively, while for CHI, no addition of conditioners is needed. At the same time, for these two countries, the daily requirement of M a d w is only 1.5 m3/d.
For THA and MYS, even if a fraction of sludge lower than 10% is discharged, increasing the need for additional water to about 2 m3/d, the addition of conditioners is not required. In the case of ITA and the USA, to avoid an excess of nutrients in the digester, M d s l is about 50% of M s l u and consequently, the additional water is about three times greater than for IND and CHI.
The mass of compost, which is determined by the separator (Table 3), varies up to 23% if the minimum (ITA, USA) and maximum (CHI, IND) amounts are compared.
Figure 5 shows how M a d w , M u r e and M s p h change over time. In the figure, it is possible to observe how the trends of these needs are, as long as k 30 , closely correlated to the decrease of C in the digester due to the increase in biogas production (Figure 4). The area below the different curves for the first 30 days represents the total amounts of M a d w , M u r e and M s p h reported in Table 8 for k 30 .
After, these aforementioned needs stabilize, sometimes becoming zero, as the daily biogas production becomes constant. In Figure 5, the trends for M a d w , M u r e and M s p h show how the steady-state condition is reached shortly after the retention time. When the quantities of M a d w , M u r e and M s p h become constant, M d i g , M c o m and M r s l also stabilize, because they are strictly correlated to the previous three masses.
During the first 30 days, M a d w shows the same trend (Figure 5a) for all the examined countries while when k > 30 , the trends become different due to the different amounts of M r s l . The lower the quantity of N and P in the R S (Table 1), the higher the amount of recycled sludge (Table 8) and the lower the M a d w required.
Figure 5b shows the different needs of M u r e for the different countries, which vary up to 37% if CHI is compared with ITA. When k > 30 , it is no longer required to add urea except for IND. As written above for USA, MYS and CHN, a mass of superphosphate is never required. Figure 5c shows that for IND and ITA, a mass of superphosphate is always required but when the steady state is reached, the need is reduced by 50% (IND) and 80% (ITA) compared to the average value of the first 30 days. A particular trend is shown for THA for which the superphosphate is required only during the first 10 days.
As previously mentioned, one of the advantages of AD compared to other uses of rice straw is the availability of compost and sometimes of a drained fraction of sludge, which can be used in rice cultivation as soil amendments due to the nutrients contained. For both of them, the ratio of water to dry matter is determined by the separator (Table 3) and is approximately 28 for sludge and 3.4 for compost.
Table 9 shows the mass fractions of the chemical elements of interest in the sludge and compost evaluated referring to the D M , while Table 10 shows the carbon to nutrient ratios of both the by-products. Table 9 shows that the sludge has a higher content of nutrients than the compost while the compost is richer in C than the sludge. For this reason, the discharged sludge, if available ( M d s l 0 in Table 8), favors soil fertilization while the compost reintroduces chemically stabilized C into the soil which will not be converted into methane.
To simplify the management of the digester, the second approach described above was applied to the scenarios related to IND and ITA, which are to be considered the most complex, as they require the addition of inorganic additives also when k > 30 . Table 11 shows a possible pattern for the feeding mixture ( M a d w , M u r e and M s p h ), the constant value for M d i g evaluated with the previous model at the end of the day k = 30 , the values for both M r s l and M d s l that minimize the addition of water and conditioners and the mass M c o m determined using Equation (20).
Figure 6 elucidates the time progression of the C/N, C/P and W/DM ratios over a 90-day span that is obtained using the data in Table 11. The figure shows that the C/N and C/P ratios vary daily but remain consistently within the allowable limits and stabilize by day 90 at the latest. The implemented water supply methodology ensures that the water to dry matter ratio in the digestate remains within the applicability range of Equation (2).
Figure 7 and Figure 8 reveal that the resulting dry matter composition in both sludge and compost is practically in line with the previous analysis results reported in Table 9.
The results obtained, although not general because they are strictly related to the assumptions introduced, show that by adopting a forecasting method, it is possible to manage the digester which allows minimizing the consumption of water and chemical additives. The benefits of such an approach are measurable both in terms of biogas produced and in terms of chemical additives saved. There is also evidence that using an analytical approach to digester management allows steady state to be achieved in a short time.

4. Conclusions

This research provides an exploration into the anaerobic digestion of rice straw originating from disparate geographical regions, underscoring the necessity of enhancing methane production via judicious water resource management and appropriate conditioning. The mass conservation-oriented method proposed herein offers precision in predicting and minimizing the requisite volumes of water and conditioners. It is evident from our investigation that, during the digester’s initial phase, water usage remains relatively consistent across all scrutinized countries, yet presents substantial variations in subsequent stages. The requirement for nitrogen supplementation was observed as a consistent factor, while the necessity of phosphorus supplementation was determined to be context specific. Importantly, our study establishes that despite exceeding the ideal values, potassium concentrations do not appreciably impact methane production.
The quantifiable results of this research bolster the progress towards devising efficient, sustainable strategies for the management of rice straw in a multitude of global contexts. This furthers the potential of this prolific agricultural by-product as a significant resource for renewable energy generation.
In conclusion, the effective transformation of rice straw into renewable energy via anaerobic digestion not only addresses the disposal predicament but also propounds an environmentally conscious pathway towards a sustainable future in the agricultural industry. The broader implications of these findings could greatly impact our understanding of waste management and energy production, driving a shift towards more sustainable practices worldwide.

Author Contributions

Conceptualization, M.B., E.C., C.G.F. and V.G.; methodology, M.B., E.C., C.G.F. and V.G.; software, V.G.; analysis, M.B., E.C., C.G.F. and V.G.; writing—original draft preparation, M.B., E.C., C.G.F. and V.G.; writing—review and editing, M.B., E.C., C.G.F. and V.G. All authors have read and agreed to the published version of the manuscript.

Funding

This research received no external funding.

Conflicts of Interest

The authors declare no conflict of interest.

References

  1. Lim, J.S.; Manan, Z.A.; Alwi, S.R.W.; Hashim, H. A review on utilisation of biomass from rice industry as a source of renewable energy. Renew. Sustain. Energy Rev. 2012, 16, 3084–3094. [Google Scholar] [CrossRef]
  2. Mofijur, M.; Mahlia, T.M.I.; Logeswaran, J.; Anwar, M.; Silitonga, A.S.; Rahman, S.M.A.; Shamsuddin, A.H. Potential of Rice Industry Biomass as a Renewable Energy Source. Energies 2019, 12, 4116. [Google Scholar] [CrossRef]
  3. Grisolia, G.; Fino, D.; Lucia, U. Biomethanation of Rice Straw: A Sustainable Perspective for the Valorisation of a Field Residue in the Energy Sector. Sustainability 2022, 14, 5679. [Google Scholar] [CrossRef]
  4. Torregrosa, A.; Giner, J.M.; Velázquez-Martí, B. Equipment Performance, Costs and Constraints of Packaging and Transporting Rice Straw for Alternative Uses to Burning in the “Parc Natural l’Albufera de València” (Spain). Agriculture 2021, 11, 570. [Google Scholar] [CrossRef]
  5. Gadde, B.; Bonnet, S.; Menke, C.; Garivait, S. Air pollutant emissions from rice straw open field burning in India, Thailand and the Philippines. Environ. Pollut. 2009, 157, 1554–1558. [Google Scholar] [CrossRef] [PubMed]
  6. Romasanta, R.R.; Sander, B.O.; Gaihre, Y.K.; Alberto, M.C.; Gummert, M.; Quilty, J.; Nguyen, V.H.; Castalone, A.G.; Balingbing, C.; Sandro, J.; et al. How does burning of rice straw affect CH4 and N2O emissions? A comparative experiment of different on-field straw management practices. Agric. Ecosyst. Environ. 2017, 239, 143–153. [Google Scholar] [CrossRef]
  7. Yodkhum, S.; Sampattagul, S.; Gheewala, S.H. Energy and environmental impact analysis of rice cultivation and straw management in northern Thailand. Environ. Sci. Pollut. Res. 2018, 25, 17654–17664. [Google Scholar] [CrossRef]
  8. Gomez, I.; Thivant, L. Training Manual for Organic Agriculture. Edited by Nadia Scialabba. 2015. Available online: https://www.fao.org/fileadmin/templates/nr/sustainability_pathways/docs/Compilation_techniques_organic_agriculture_rev.pdf (accessed on 18 April 2023).
  9. Giardini, R. Coltivazioni Erbacee; Pàtron Editore: Bologna, Italy, 2010. [Google Scholar]
  10. Ma, J.F.; Miyake, Y.; Takahashi, E. Silicon as a beneficial element for crop plants. Stud. Plant. Sci. 2001, 8, 17–39. [Google Scholar] [CrossRef]
  11. Schutz, H.; Holzapfelpschorn, A.; Conrad, R.; Rennenberg, H.; Seiler, W. A 3-year continuous record on the influence of daytime, season, and fertilizer treatment on methane emission rates from an italian rice paddy. J. Geophys. Res. Atmos. 1989, 94, 16405–16416. [Google Scholar] [CrossRef]
  12. Yagi, K.; Minami, K. Effect of organic matter application on methane emission from some Japanese paddy fields. Soil Sci. Plant Nutr. 1990, 36, 599–610. [Google Scholar] [CrossRef]
  13. Sass, R.L.; Fisher, F.M.; Turner, F.T.; Jund, M.F. Methane emission from rice fields as influenced by solar radiation, temperature, and straw incorporation. Glob. Biogeochem. Cycles 1991, 5, 335–350. [Google Scholar] [CrossRef]
  14. Islam, S.M.M.; Gaihre, Y.K.; Islam, R.; Akter, M.; Al Mahmud, A.; Singh, U.; Sander, B.O. Effects of water management on greenhouse gas emissions from farmers’ rice fields in Bangladesh. Sci. Total Environ. 2020, 734, 139382. [Google Scholar] [CrossRef] [PubMed]
  15. Zoli, M.; Paleari, L.; Confalonieri, R.; Bacenetti, J. Setting-up of different water managements as mitigation strategy of the environmental impact of paddy rice. Sci. Total Environ. 2021, 799, 149365. [Google Scholar] [CrossRef] [PubMed]
  16. Adhya, T.K.; Linquist, B.; Searchinger, T.; Wassmann, R.; Yan, Y. Wetting and Drying: Reducing Greenhouse Gas Emissions and Saving Water from Rice Production. In Working Paper, Installment 8 of Creating a Sustainable Food Future; World Resources: Washington, DC, USA, 2014; Available online: https://www.worldresourcesreport.org (accessed on 18 April 2023).
  17. Setyanto, P.; Pramono, A.; Adriany, T.A.; Susilawati, H.L.; Tokida, T.; Agnes, T.; Padre, A.T.; Minamikawa, K. Alternate wetting and drying reduces methane emission from a rice paddy in Central Java, Indonesia without yield loss. J. Soil. Sci. Plant. Nutr. 2018, 64, 23–30. [Google Scholar] [CrossRef]
  18. Runkle, B.R.K.; Suvočarev, K.; Reba, M.L.; Reavis, C.W.; Smith, S.F.; Chiu, Y.L.; Fong, B. Methane Emission Reductions from the Alternate Wetting and Drying of Rice Fields Detected Using the Eddy Covariance Method. Environ. Sci. Technol. 2019, 53, 671–681. [Google Scholar] [CrossRef]
  19. Yanga, J.; Zhoua, Q.; Zhang, J. Moderate wetting and drying increases rice yield and reduces water use, grain arsenic level, and methane emission. Crop. J. 2017, 5, 151–158. [Google Scholar] [CrossRef]
  20. Hu, J.; Wu, H.; Sun, Z.; Peng, Q.; Zhao, J.; Hu, R. Ferrous Iron Addition Decreases Methane Emissions Induced by Rice Straw in Flooded Paddy Soils. ACS Earth Space Chem. 2020, 4, 843–853. [Google Scholar] [CrossRef]
  21. Ali, M.A.; Oh, J.H.; Kim, P.J. Evaluation of silicate iron slag amendment on reducing methane emission from flood water rice farming. Agric. Ecosyst. Environ. 2008, 128, 21–26. [Google Scholar] [CrossRef]
  22. Ito, K. Suppression of Methane Gas Emission from Paddy FieldsNippon Steel & Sumitomo Metal Technical Report, July 2015; p. 109. Available online: https://www.nipponsteel.com/en/tech/report/nssmc/pdf/109-25.pdf (accessed on 18 April 2023).
  23. Bertora, C.; Moretti, B.; Peyron, M.; Pelissetti, S.; Lerda, C.; Said-Pullicino, D.; Milan, M.; Fogliatto, S.; Vidotto, F.; Celi, L.; et al. Carbon input management in temperate rice paddies: Implications for methane emissions and crop response. Ital. J. Agron. 2020, 15, 1607. [Google Scholar] [CrossRef]
  24. Liu, G.; Ma, J.; Yang, Y.; Yu, H.; Zhang, G.; Xu, H. Effects of Straw Incorporation Methods on Nitrous Oxide and Methane Emissions from a Wheat-Rice Rotation System. Pedosphere 2019, 29, 204–215. [Google Scholar] [CrossRef]
  25. Song, H.J.; Lee, J.H.; Jeong, H.-C.; Choi, E.-J.; Oh, T.-K.; Hong, C.-O.; Kim, P.J. Effect of straw incorporation on methane emission in rice paddy: Conversion factor and smart straw management. Appl. Biol. Chem. 2019, 62, 70. [Google Scholar] [CrossRef]
  26. Liou, R.M.; Huang, S.N.; Lin, C.W.; Chen, S.H. Methane Emission from Fields with Three Various Rice Straw Treatments in Taiwan Paddy Soils. J. Environ. Sci. Health Part B 2003, 38, 511–527. [Google Scholar] [CrossRef] [PubMed]
  27. Gaihre, Y.K.; Wassmann, R.; Villegas-Pangga, G.; Sanabria, J.; Aquino, E.; Cruz, P.C.S.; Paningbatan, E.P. Effects of increased temperatures and rice straw incorporation on methane and nitrous oxide emissions in a greenhouse experiment with rice. Eur. J. Soil. Sci. 2016, 67, 868–880. [Google Scholar] [CrossRef]
  28. IPCC. Guidelines for National Greenhouse Gas Inventories, Chapter 5: Cropland. Available online: https://www.ipcc-nggip.iges.or.jp/public/2006gl/pdf/4_Volume4/V4_05_Ch5_Cropland.pdf (accessed on 1 July 2006).
  29. IPCC. Report Ars5 Climate Change 2013: The Physical Science Basis. Chapter 6: Carbon and Other Biogeochemical Cycles. Available online: https://www.ipcc.ch/report/ar5/wg1/carbon-and-other-biogeochemical-cycles/ (accessed on 18 April 2023).
  30. Bressan, M.; Campagnoli, E.; Ferro, C.G.; Giaretto, V. Rice Straw: A Waste with a Remarkable Green Energy Potential. Energies 2022, 15, 1355. [Google Scholar] [CrossRef]
  31. Chandra, R.; Vijay, V.K.; Subbarao, P.M.V.; Nagpal, S.; Trivedi, A.; Jha, B.; Vijay, V. Paddy straw-based power generation from biogas: Fazilka District in Punjab Leading the Way. Energy Future—The Complete Energy Magazine 2016, 2106, 52–56. Available online: https://www.researchgate.net/publication/305444675 (accessed on 18 April 2023).
  32. Ngan, N.V.C.; Chan, F.M.S.; Nam, T.S.; Thao, H.; Maguyon-Detras, M.C.; Hung, D.V.; Cuong, D.M.; Hung, N.V. Anaerobic Digestion of Rice Straw for Biogas Production. In Sustainable Rice Straw Management; Chapter 5; Gummert, M., Hung, N.V., Chivenge, P., Douthwaite, B., Eds.; Springer: Cham, Switzerland, 2020; pp. 65–93. [Google Scholar] [CrossRef]
  33. Huai’an, China: Highly Advanced Biogas Plant. Available online: https://www.host.nl/en/case/hauian-china/ (accessed on 18 April 2023).
  34. Singh, R.; Patel, M. Effective utilization of rice straw in value-added by-products: A systematic review of state of art and future perspectives. Biomass Bioenergy 2022, 159, 106411. [Google Scholar] [CrossRef]
  35. Briviesca Biomass Plant. Available online: https://www.acciona.com/projects/briviesca-biomass-plant/?_adin=02021864894 (accessed on 18 April 2023).
  36. Power Plant Profile: Sanguesa Biomass Plant, Spain. Available online: https://www.power-technology.com/marketdata/sanguesa-biomass-plant-spain (accessed on 18 April 2023).
  37. Mothe, S.; Polisetty, V.R. Review on anaerobic digestion of rice straw for biogas production. Environ.Sci. Pollut. Res. 2021, 28, 24455–24469. [Google Scholar] [CrossRef]
  38. Abraham, A.; Mathew, A.K.; Park, H.; Choi, O.; Sindhu, R.; Parameswaran, B.; Pandey, A.; Park, J.H.; Sang, B.-I. Pretreatment strategies for enhanced biogas production from lignocellulosic biomass. Bioresour. Technol. 2020, 301, 122725. [Google Scholar] [CrossRef]
  39. González, L.M.L.; Heiermann, M. Effect of Liquid Hot Water Pretreatment on Hydrolysates Composition and Methane Yield of Rice Processing Residue. Energies 2021, 14, 3254. [Google Scholar] [CrossRef]
  40. Luo, L.; Qu, Y.; Gong, W.; Qin, L.; Li, W.; Sun, Y. Effect of Particle Size on the Aerobic and Anaerobic Digestion Characteristics of Whole Rice Straw. Energies 2021, 14, 3960. [Google Scholar] [CrossRef]
  41. Schievano, A.; Pognani, M.; D’Imporzano, G.; Adani, F. Predicting anaerobic biogasification potential of ingestates and digestates of a full-scale biogas plant using chemical and biological parameters. Bioresour. Technol. 2008, 99, 8112–8117. [Google Scholar] [CrossRef] [PubMed]
  42. Uddin, M.; Wright, M. Anaerobic digestion fundamentals, challenges, and technological advances. Phys. Sci. Rev. 2022. [Google Scholar] [CrossRef]
  43. Zealand, A.M.; Roskilly, A.P.; Graham, D.W. Effect of feeding frequency and organic loading rate on biomethane production in the anaerobic digestion of rice straw. Appl. Energy 2017, 207, 156–165. [Google Scholar] [CrossRef]
  44. Kim, M.S.; Kim, D.H.; Yun, Y.M. Effect of operation temperature on anaerobic digestion of food waste: Performance and microbial analysis. Fuel 2017, 209, 598–605. [Google Scholar] [CrossRef]
  45. Latif, M.A.; Mehta, C.M.; Batstone, D.J. Influence of low pH on continuous anaerobic digestion of waste activated sludge. Water Res. 2017, 113, 42–49. [Google Scholar] [CrossRef] [PubMed]
  46. Zeikus, J.G. The biology of methanogenic bacteria. Bacteriol. Rev. 1977, 41, 514–541. [Google Scholar] [CrossRef] [PubMed]
  47. Chen, Y.; Jay, J.; Cheng, J.J.; Creamer, K.S. Inhibition of anaerobic digestion process: A review. Bioresour. Technol. 2008, 99, 4044–4064. [Google Scholar] [CrossRef]
  48. Hussain, A.; Kumar, P.; Mehrotra, I. Nitrogen and phosphorus requirement in anaerobic process: A review. Environ. Eng. Manag. J. 2015, 14, 769–780. [Google Scholar] [CrossRef]
  49. Wang, X.; Lu, X.; Li, F.; Yang, G. Effects of temperature and carbon-nitrogen (C/N) ratio on the performance of anaerobic co-digestion of dairy manure, chicken manure and rice straw: Focusing on ammonia inhibition. PLoS ONE 2014, 9, e97265. [Google Scholar] [CrossRef]
  50. Gil, A.; Siles, J.A.; Serrano, A.; Chica, A.F.; Martín, A. Effect of variation in the C/[N+P] ratio on anaerobic digestion. Environ. Prog. Sustain. Energy 2019, 38, 228–236. [Google Scholar] [CrossRef]
  51. Hassan, M.; Ding, W.; Umar, M.; Rasool, G. Batch and semi-continuous anaerobic co-digestion of goose manure with alkali solubilized wheat straw: A case of carbon to nitrogen ratio and organic loading rate regression optimization. Bioresour. Technol. 2017, 230, 24–32. [Google Scholar] [CrossRef]
  52. Jain, S.; Jain, S.; Wolf, I.T.; Lee, J.; Tong, Y.W. A comprehensive review on operating parameters and different pretreatment methodologies for anaerobic digestion of municipal solid waste. Renew. Energy Rev. 2015, 52, 142–154. [Google Scholar] [CrossRef]
  53. Xu, R.; Zhang, K.; Liu, P.; Khan, A.; Xiong, J.; Tian, F.; Li, X. A critical review on the interaction of substrate nutrient balance and microbial community structure and function in anaerobic co-digestion. Bioresour. Technol. 2018, 247, 1119–1127. [Google Scholar] [CrossRef] [PubMed]
  54. Aiyuk, S.; Amoako, J.; Raskin, L.; van Haandel, A.; Verstraete, W. Removal of carbon and nutrients from domestic wastewater using a low investment, integrated treatment concept. Water Res. 2004, 38, 3031–3042. [Google Scholar] [CrossRef]
  55. Mazzini, S.; Borgonovo, G.; Scaglioni, L.; Bedussi, F.; D’Imporzano, G.; Tambone, F.; Adani, F. Phosphorus speciation during anaerobic digestion and subsequent solid/liquid separation. Sci. Total Environ. 2020, 734, 139284. [Google Scholar] [CrossRef] [PubMed]
  56. Mao, C.; Wang, Y.; Wang, X.; Ren, G.; Yuan, L.; Feng, Y. Correlations between microbial community and C:N:P stoichiometry during the anaerobic digestion process. Energy 2019, 174, 687–695. [Google Scholar] [CrossRef]
  57. Jayasinghe, G.Y.; Weerasinghe, K.D.N. Consequence of C:N and C:P Adjustments of Rice Straw on Biomethanation in an Anaerobic Digester. Academic Sessions of University of Ruhuna. 1st Academic Session 2003. Available online: http://ir.lib.ruh.ac.lk/xmlui/handle/iruor/262 (accessed on 18 April 2023).
  58. Kayhanian, M.; Rich, D. Pilot-scale high solids thermophilic anaerobic digestion of municipal solid waste with an emphasis on nutrient requirements. Biomass Bioenergy 1995, 8, 433–444. [Google Scholar] [CrossRef]
  59. Kugelman, I.J.; McCarty, P.L. Cation Toxicity and Stimulation in Anaerobic Waste Treatment. Water Pollut. Control. Fed. 1965, 37, 97–116. Available online: https://www.jstor.org/stable/25035219 (accessed on 18 April 2023).
  60. Haryanto, A.; Sugara, B.P.; Telaumbanua, M.; Rosadi, R.A.B. Anaerobic Co-digestion of Cow Dung and Rice Straw to Produce Biogas using Semi-Continuous Flow Digester: Effect of Urea Addition. IOP Conf. Ser. Earth Environ. Sci. 2018, 147, 012032. [Google Scholar] [CrossRef]
  61. Ye, J.; Li, D.; Sun, Y.; Wang, G.; Yuan, Z.; Zhen, F.; Wang, Y. Improved biogas production from rice straw by co-digestion with kitchen waste and pig manure. Waste Manag. 2013, 33, 2653–2658. [Google Scholar] [CrossRef]
  62. Tian, P.; Gong, B.; Bi, K.; Liu, Y.; Ma, J.; Wang, X.; Ouyang, Z.; Cui, X. Anaerobic Co-Digestion of Pig Manure and Rice Straw: Optimization of Process Parameters for Enhancing Biogas Production and System Stability. Int. J. Environ. Res. Public Health 2023, 20, 804. [Google Scholar] [CrossRef]
  63. Muhayodin, F.; Fritze, A.; Rotter, V.S. Mass Balance of C, Nutrients, and Mineralization of Nitrogen during Anaerobic Co-Digestion of Rice Straw with Cow Manure. Sustainability 2021, 13, 11568. [Google Scholar] [CrossRef]
  64. Chen, C.; Deng, X.; Kong, W.; Qaseem, M.F.; Zhao, S.; Li, Y.; Wu, A.M. Rice Straws With Different Cell Wall Components Differ on Abilities of Saccharification. Front. Bioeng. Biotechnol. 2021, 8, 624314. [Google Scholar] [CrossRef] [PubMed]
  65. Diyabalanage, S.; Navarathna, T.; Abeysundara, H.T.; Rajapakse, S.; Chandrajith, R. Trace elements in native and improved paddy rice from different climatic regions of Sri Lanka: Implications for public health. Springerplus 2016, 5, 1864. [Google Scholar] [CrossRef]
  66. Iqbal, A.; He, L.; Ali, I.; Ullah, S.; Khan, A.; Khan, A.; Akhtar, K.; Wei, S.; Zhao, Q.; Zhang, J.; et al. Manure combined with chemical fertilizer increases rice productivity by improving soil health, post-anthesis biomass yield, and nitrogen metabolism. PLoS ONE 2020, 15, e0238934. [Google Scholar] [CrossRef] [PubMed]
  67. Jenkins, B.M.; Baxter, L.L.; Miles, T.R., Jr.; Miles, T.R. Combustion properties of biomass. Fuel Process. Technol. 1998, 54, 17–46. [Google Scholar] [CrossRef]
  68. Summers, M.D.; Jenkins, B.M.; Hyde, P.R.; Williams, J.F.; Scardacci, S.C.; Mutters, R.G. Properties of Rice Straw as Influenced by Variety, Season and Location. In Proceedings of the 2001 ASAE Annual Meeting. American Society of Agricultural and Biological Engineers, Sacramento, CA, USA, 30 July–1 August 2001; p. 016078. [Google Scholar] [CrossRef]
  69. Saothongnoi, V.; Amkha, S.; Inubushi, K.; Smakgahn, K. Effect of rice straw incorporation on soil properties and rice yield. Thai J. Agric. Sci. 2014, 47, 7–12. [Google Scholar]
  70. Hoer, D.; Phillips, B.; Wang, A.; Woodside, R. Feasibility of Rice Straw Utilization for Small Scale Power Production. King Mongkut’s University of Technology Thonburi, Thailand 2016. Available online: https://ie.unc.edu/wp-content/uploads/sites/277/2016/03/rice_straw_to_energy.pdf (accessed on 18 April 2023).
  71. Jittabut, P. Physical and Thermal Properties of Briquette Fuels from Rice Straw and Sugarcane Leaves by Mixing Molasses. Energy Procedia 2015, 79, 2–9. [Google Scholar] [CrossRef]
  72. Ahmad, R.; Hamidin, N.; Ali, U.F. Effect of Dolomite on Pyrolysis of Rice Straw. Adv. Mater. Res. 2013, 795, 170–173. [Google Scholar] [CrossRef]
  73. Zakaria, A. Soil-enhancing technologies for improving crop productivity in Malaysia and considerations for their use. In Proceedings of the International Workshop on Sustained Management of the Soil-Rhizosphere System for Efficient Crop Production and Fertilizer Use, Bangkok, Thailand, 16–20 October 2006. [Google Scholar]
  74. Luo, J.; Li, J.; Zhang, L.; Li, N.; Wachemo, A.C.; Liu, C.; Yuan, H.; Li, X. Effects of different potassium and nitrogen pretreatment strategies on anaerobic digestion performance of rice straw. RSC Adv. 2020, 10, 25547–25556. [Google Scholar] [CrossRef]
  75. Wu, D.; Xiao, L.; Ba, Y.; Wang, H.; Zhang, A.; Wu, X.; Niu, M.; Fang, K. The Recovery of Energy, Nitrogen and Phosphorous from Three Agricultural Wastes by Pyrolysis. Energy Procedia 2017, 105, 1263–1269. [Google Scholar] [CrossRef]
  76. Liu, Z.; Xu, A.; Long, B. Energy from Combustion of Rice Straw: Status and Challenges to China. Energy Power Eng. 2011, 3, 325–331. [Google Scholar] [CrossRef]
  77. Singh, R.B.; Saha, R.C.; Singh, M.; Chandra, D.; Shukla, S.G.; Walli, T.K.; Pradhan, P.K.; Kessels, H.P.P.; Singh, K. Handbook for Straw feeding Systems in Livestock Production; Singh, K., Schiere, J.B., Eds.; ICAR: New Delhi, India, 1995; pp. 325–339. Available online: https://edepot.wur.nl/333859 (accessed on 18 April 2023).
  78. Raj, T.; Kapoor, M.; Gaur, R.; Christopher, J.; Lamba, B.; Tuli, D.K.; Kumar, R. Physical and Chemical Characterization of Various Indian Agriculture Residues for Biofuels Production. Energy Fuels 2015, 29, 3111–3118. [Google Scholar] [CrossRef]
  79. Pisano, I.; Gottumukkala, L.; Hayes, D.J.; Leahy, J.J. Characterisation of Italian and Dutch forestry and agricultural residues for the applicability in the bio-based sector. Ind. Crops Prod. 2021, 171, 113857. [Google Scholar] [CrossRef]
  80. Mussoline, W.; Esposito, G.; Lens, P.; Garuti, G.; Giordano, A. Electrical energy production and operational strategies from a farm-scale anaerobic batch reactor loaded with rice straw and piggery wastewater. Renew. Energy 2014, 62, 399–406. [Google Scholar] [CrossRef]
  81. Contreras, L.M.; Schelle, H.; Sebrango, C.R.; Pereda, I. Methane potential and biodegradability of rice straw, rice husk and rice residues from the drying process. Water Sci. Technol. 2012, 65, 1142–1149. [Google Scholar] [CrossRef] [PubMed]
  82. Gunaseelan, V.N. Anaerobic digestion of biomass for methane production: A review. Biomass Bioenergy 1997, 13, 83–114. [Google Scholar] [CrossRef]
  83. Deublein, D.; Syeinhauser, A. Biogas from Waste and Renewable Resources: An Introduction, 2nd ed.; Deublein, D., Steinhauser, A., Eds.; WILEY-VCH Verlag GmbH & Co. KGaA: Weinheim, Germany, 2008; ISBN 978-3-527-31841-4. [Google Scholar]
  84. Sari, L.N.; Prayitno, H.; Farhan, M.; Syaichurrozi, I. Review: Biogas Production from Rice Straw. World Chem. Eng. J. 2022, 6, 44–49. [Google Scholar] [CrossRef]
  85. Zwietering, M.H.; Jongenburger, I.; Rombouts, F.M.; Van ’t Riet, K. Modeling of the Bacterial Growth Curve. Appl. Environ. Microbiol. 1990, 56, 1875–1881. [Google Scholar] [CrossRef]
  86. Liu, X.; Coutu, A.; Mottelet, S.; Pauss, A.; Ribeiro, T. Overview of Numerical Simulation of Solid-State Anaerobic Digestion Considering Hydrodynamic Behaviors, Phenomena of Transfer, Biochemical Kinetics and Statistical Approaches. Energies 2023, 16, 1108. [Google Scholar] [CrossRef]
  87. Bolzonella, D.; Pavan, P.; Battistoni, P.; Cecchi, F. Mesophilic anaerobic digestion of waste activated sludge: Influence of the solid retention time in the wastewater treatment process. Process. Biochem. 2005, 40, 1453–1460. [Google Scholar] [CrossRef]
  88. Lyons, G.A.; Cathcart, A.; Frost, J.P.; Wills, M.; Johnston, C.; Ramsey, R.; Smyth, B. Review of Two Mechanical Separation Technologies for the Sustainable Management of Agricultural Phosphorus in Nutrient-Vulnerable Zones. Agronomy 2021, 11, 836. [Google Scholar] [CrossRef]
  89. Hjorth, M.; Christensen, K.V.; Christensen, M.L.; Sommer, S.G. Solid–liquid separation of animal slurry in theory and practice. A review. Agron. Sustain. Dev. 2010, 30, 153–180. [Google Scholar] [CrossRef]
  90. Bauer, A.; Mayr, H.; Hopfner-Sixt, K.; Amon, T. Detailed monitoring of two biogas plants and mechanical solid–liquid separation of fermentation residues. J. Biotechnol. 2009, 142, 56–63. [Google Scholar] [CrossRef] [PubMed]
  91. Sánchez, M.; González, J.L. The fertilizer value of pig slurry. I. Values depending on the type of operation. Bioresour. Technol. 2005, 96, 1117–1123. [Google Scholar] [CrossRef] [PubMed]
  92. IPCC. Climate Change 2014: Synthesis Report. Contribution of Working Groups I, II and III to the Fifth Assessment Report of the Intergovernmental Panel on Climate Change; Core Writing Team, Pachauri, R.K., Meyer, L.A., Eds.; IPCC: Geneva, Switzerland, 2014; p. 151. [Google Scholar]
Figure 1. Schematic of a biogas plant.
Energies 16 04334 g001
Figure 2. Schematic of the system with the different wet masses.
Energies 16 04334 g002
Figure 3. Daily rate of biogas produced per each ton of rice straw ( V = 270   m 3 , V 0 = 0.35   m 3 , t C = 3.5 days and retention time t R = 30 days).
Energies 16 04334 g003
Figure 4. Daily biogas production.
Energies 16 04334 g004
Figure 5. Time trends for additional water (a), urea (b) and superphosphate (c).
Energies 16 04334 g005aEnergies 16 04334 g005b
Figure 6. Carbon to nutrient ratios and water to dry matter ratios in the digester versus time shown by solid lines. Dashed lines define the allowed ranges for these ratios.
Energies 16 04334 g006
Figure 7. Mass fractions of main components in the dry matter of the sludge: IND (left) and ITA (right).
Energies 16 04334 g007
Figure 8. Mass fractions of main components in the dry matter of the compost: IND (left) and ITA (right).
Energies 16 04334 g008
Table 1. Ultimate analysis of rice straw (mass fraction percentages) and C / y .
State𝑪𝑵𝑷𝑲𝑶𝒕𝒉 C / N C / P C / K
%   d b   a
USA [67,68]38.24–41.000.70–0.870.611.70–2.09
38.240.870.612.0958.1943.9562.6918.30
THA [69,70,71]35.95–38.70.34–1.190.141.94 []
38.300.620.141.9459.0061.77273.5719.74
MYS [72,73]35.51–39.980.53–4.430.271.70
35.510.530.271.7061.9967.0131.5220.89
CHN [74,75,76]38.14–520.20–1.230.12–0.290.01–1.04
38.140.510.291.0460.0274.78131.5236.67
IND [77,78]38.800.200.051.0259.93194.0776.038.04
ITA [79,80]41.201.000.110.9656.7341.2374.5542.92
a db: dry basis.
Table 2. Biogas production: parameters.
ParametersValue
TS89% wet basis [60]
VS71% T S [60]
BP 0.43   m 3 kg VS 1 [81]
C H 4 55% [31,81,82,83]
C O 2 45% [31]
Table 3. Percentages of digestate constituents in compost ( i _ t h , c o m ) and sludge   i _ t h , c o m valid when DM% = 7.3 [90].
Digestate i _ t h Constituent i _ t h , c o m   % i _ t h , s l u   %
D M 61.838.2
C 64.235.8
N 31.468.6
P 51.548.5
K 28.271.8
Table 4. L S A D suggested C / y   ratios .
y C / y   k g   ·   k g 1
N 20–30 [49,50,51,52,53]
P 150–320 [50,57]
K 16–77 [59]
Table 5. Conditioners ultimate analysis and moisture content: mass fraction percentages.
Conditioner C N P K O t h W
%   d b   a %   w b   b
Urea—CH4N2O20.0046.70--33.302.00
Superphosphate—Ca3(PO4)2--19.50-80.501.00
Potash—KOH---63.0037.008.00
Pig manure [91]1.150.320.080.1098.3567.60
a db dry basis; b wb wet basis.
Table 6. Mass fractions evaluated on a wet basis.
State x W , j x D M , j x C , j x N , j x P , j x K , j x O t h , j
%   w b   a
R S USA20.0080.0030.590.700.491.6745.55
THA30.640.500.111.5547.20
MYS28.410.420.221.3649.59
CHN30.510.410.230.8348.02
IND31.040.160.040.8247.94
ITA32.460.800.090.7745.38
Urea2.0098.0019.6045.77--32.63
Superphosphate1.0099.00--19.30-79.70
Potash8.0092.00---57.9634.04
Pig manure67.6032.400.370.100.030.0331.87
a wb: wet basis.
Table 7. Numerical values and ranges for the masses entering and exiting the digester.
M r s t M m a n M u r e M s p h M d i g M r s l
k 30 1000 100 0 0 0 0
k > 30 1000 0 0 0 > 0 0 M r s l M s l d
Table 8. Main incoming/outgoing digester masses reported by country.
USATHAMYSCHIINDITA
C / N 202020213020
C / P 200 200 200 200 200 200
M a d w k 30 226.3 t226.7 t226.7 t228.2 t228.8 t226.9 t
k > 30 4.2 t/d2.1 t/d2.0 t/d1.5 t/d1.5 t/d4.3 t/d
M u r e k 30 252.0 kg353.6 kg380.2 kg388.8 kg371.8 kg244.5 kg
k > 30 n.r. an.r.n.r.n.r.3.0 kg/dn.r.
M s p h k 30 n.r.13.4 kgn.r.n.r.101.8 kg46.0 kg
k > 30 n.r.n.r.n.r.n.r.1.6 kg/d0.3 kg/d
M d i g k > 30 8.4 t/d10.3 t/d10.4 t/d10.9 t/d11.0 t/d8.3 t/d
M r s l k > 30 3.6 t/d7.5 t/d7.7 t/d8.7 t/d8.8 t/d3.3 t/d
M d s l k > 30 3.2 t/d0.8 t/d0.6 t/d0 t/d0 t/d3.3 t/d
M c o m k > 30 1.7 t/d2.0 t/d2.1 t/d2.2 t/d2.2 t/d1.7 t/d
a n.r.: not required.
Table 9. Mass fractions (dry basis) of the chemical elements of interest in the sludge and compost.
                  D M Composition USATHAMYSCHIINDITA
M s l u   M c o m
[%]
C cellulose 15.4–17.015.2–16.812.3–13.614.9–16.515.5–17.118.6–20.6
C lignine 17.3–19.117.0–18.815.7–17.416.8–18.717.1–18.918.7–20.7
N 8.2–2.03.1–0.92.7–0.83.0–0.82.1–0.63.6–1.0
P 1.3–0.90.3–0.20.7–0.40.7–0.50.2–0.10.3–0.2
K 3.3–0.911.1–2.710.0–2.46.9–1.76.7–1.63.7–0.9
O t h 54.5–60.053.3–60.058.6–65.457.7–61.858.4–61.755.1–56.6
Table 10. Carbon to nutrients ratios for sludge and compost.
C / y USATHAMYSCHIINDITA
M s l u   M c o m
k g / k g
C / N 10.2–40.110.2–40.110.2–40.010.7–42.115.4–60.210.3–40.2
C / P 24.2–40.995.1–160.642.7–72.244.7–75.5144.8–244.5145.1–245.1
C / K 4.0–18.12.9–13.22.8–12.84.6–21.04.8–22.110.0–45.6
Table 11. Data used for IND and ITA scenarios.
I N D I T A
k 15 15 < k 30 k > 30 k 10 10 < k 30 k > 30
M a d w   (t/d)7.67.61.57.67.64.3
M u r e (kg/d)24.83.03.08.48.4n.r.
M s p h (kg/d)6.81.61.64.60.30.3
M d i g (t/d)--11.0--8.3
M r s l (t/d)--8.8--3.3
M d s l (t/d)-----3.3
M c o m (t/d)--2.2--1.7
Disclaimer/Publisher’s Note: The statements, opinions and data contained in all publications are solely those of the individual author(s) and contributor(s) and not of MDPI and/or the editor(s). MDPI and/or the editor(s) disclaim responsibility for any injury to people or property resulting from any ideas, methods, instructions or products referred to in the content.

