
Forecasting Development of Green Hydrogen Production Technologies Using Component-Based Learning Curves


Abstract
:1. Introduction
2. Literature Review
3. Methodology and Data
3.1. Meta-Analysis of Data
3.2. Data and Assumptions
3.3. Learning Curves
- C0—initial unit costs (costs per unit of output);
- C(Xt)—unit costs at time t;
- Xt—cumulative (for the entire period) volume of production;
- LR—estimated rate of learning-by-doing in the manufacturing process.
4. Results
4.1. Green Hydrogen Production Technologies
4.2. Estimating Learning Rates Using Component-Based Learning Curves
5. Discussion
6. Conclusions
Author Contributions
Funding
Data Availability Statement
Conflicts of Interest
Abbreviations
| AE, AEL | Alkaline Electrolyzer |
| AEM | Anion Exchange Membranes |
| CAPEX | Capital Expenditure |
| CCUS | Carbon Capture, Utilization and Storage |
| CPV | Concentration Photovoltaic Technology |
| LCOE | Levelized Cost of Electricity |
| LCOH | Levelized Cost of Hydrogen |
| LR | Learning Rate |
| PEM | Polymer Electrolyte Membrane |
| PV | Photovoltaic |
| PV-E | Photovoltaic Electrolysis |
| RES | Renewable Energy Sources |
| SMR | Steam Methane Reforming |
| SOEC W.H. | Solid Oxide Electrolysis Coupled with Waste Heat Sources |
| SOEC | Solid Oxide Electrolyzer |
| TRL | Technology Readiness Level |
References
- IEA. Global Hydrogen Review 2022; IEA: Paris, France, 2022; Available online: https://www.iea.org/reports/global-hydrogen-review-2022 (accessed on 5 March 2023).
- IEA. Global Hydrogen Review 2021; IEA: Paris, France, 2021; Available online: https://www.iea.org/reports/global-hydrogen-review-2021 (accessed on 25 February 2023).
- REVOLVE. Hydrogen, Enabling a Zero-Emission Society, REVOLVE and Hydrogen Europe. 2022. Available online: https://hydrogen.revolve.media/2022/# (accessed on 20 February 2023).
- Vartiainen, E.; Breyer, C.; Moser, D.; Román Medina, E.; Busto, C.; Masson, G.; Bosch, E.; Jäger-Waldau, A. True cost of solar hydrogen. Solar RRL 2021, 6, 2100487. [Google Scholar] [CrossRef]
- Manzotti, A.; Quattrocchi, E.; Curcio, A.; Kwok SC, T.; Santarelli, M.; Ciucci, F. Membraneless electrolyzers for the production of low-cost, high-purity green hydrogen: A techno-economic analysis. Energy Convers. Manag. 2022, 254, 115156. [Google Scholar] [CrossRef]
- Ceran, B. Multi-Criteria Comparative Analysis of Clean Hydrogen Production Scenarios. Energies 2020, 13, 4180. [Google Scholar] [CrossRef]
- Khan, M.A.; Al-Shankiti, I.; Ziani, A.; Idriss, H. Demonstration of green hydrogen production using solar energy at 28% efficiency and evaluation of its economic viability. Sustain. Energy Fuels 2021, 5, 1085–1094. [Google Scholar] [CrossRef]
- Singlitico, A.; Østergaard, J.; Chatzivasileiadis, S. Onshore, offshore or in-turbine electrolysis? techno-economic overview of alternative integration designs for green hydrogen production into offshore wind power hubs. Renew. Sustain. Energy Transit. 2021, 1, 100005. [Google Scholar] [CrossRef]
- Rubin, E.S.; Azevedo, I.M.L.; Jaramillo, P.; Yeh, S. A review of learning rates for electricity supply technologies. Energy Policy 2015, 86, 198–218. [Google Scholar] [CrossRef]
- Williams, E.; Hittinger, E.; Carvalho, R.; Williams, R. Wind power costs expected to decrease due to technological progress. Energy Policy 2017, 106, 427–435. [Google Scholar] [CrossRef]
- Yu, Y.; Li, H.; Che, Y.; Zheng, Q. The price evolution of wind turbines in China: A study based on the modified multi-factor learning curve. Renew. Energy 2017, 103, 522–536. [Google Scholar] [CrossRef]
- Zhou, Y.; Li, R.; Lv, Z.; Liu, J.; Zhou, H.; Xu, C. Green hydrogen: A promising way to the carbon-free society. Chin. J. Chem. Eng. 2022, 43, 2–13. [Google Scholar] [CrossRef]
- Nikolaidis, P.; Poullikkas, A. A comparative overview of Hydrogen Production Processes. Renew. Sustain. Energy Rev. 2017, 67, 597–611. [Google Scholar] [CrossRef]
- Proost, J. Critical assessment of the production scale required for fossil parity of green electrolytic hydrogen. Int. J. Hydrogen Energy 2020, 45, 17067–17075. [Google Scholar] [CrossRef]
- Longden, T.; Jotzo, F.; Prasad, M.; Andrews, R. Green Hydrogen Production Costs in Australia: Implications of Renewable Energy and Electrolyzer Costs; CCEP Working Paper; Centre for Climate & Energy Policy: Canberra, Australia, 2020; Volume 2. [Google Scholar]
- Galitskaya, E.; Zhdaneev, O. Development of electrolysis technologies for hydrogen production: A case study of green steel manufacturing in the Russian Federation. Environ. Technol. Innov. 2022, 27, 102517. [Google Scholar] [CrossRef]
- Brynolf, S.; Taljegard, M.; Grahn, M.; Hansson, J. Electrofuels for the Transport Sector: A review of production costs. Renew. Sustain. Energy Rev. 2018, 81, 1887–1905. [Google Scholar] [CrossRef]
- Shiva Kumar, S.; Himabindu, V. Hydrogen production by PEM water electrolysis—A review. Mater. Sci. Energy Technol. 2019, 2, 442–454. [Google Scholar] [CrossRef]
- Ahshan, R. Potential and economic analysis of solar-to-hydrogen production in the sultanate of Oman. Sustainability 2021, 13, 9516. [Google Scholar] [CrossRef]
- Tenhumberg, N.; Büker, K. Ecological and Economic Evaluation of Hydrogen Production by Different Water Electrolysis Technologies. Chem. Ing. Tech. 2020, 92, 1586–1595. [Google Scholar] [CrossRef]
- d’Amore-Domenech, R.; Santiago, Ó.; Leo, T.J. Multicriteria analysis of seawater electrolysis technologies for green hydrogen production at sea. Renew. Sustain. Energy Rev. 2020, 133, 110166. [Google Scholar] [CrossRef]
- Jang, D.; Kim, J.; Kim, D.; Han, W.B.; Kang, S. Techno-economic analysis and Monte Carlo simulation of green hydrogen production technology through various water electrolysis technologies. Energy Convers. Manag. 2022, 258, 115499. [Google Scholar] [CrossRef]
- Hosseini, S.E.; Wahid, M.A. Hydrogen from solar energy, a clean energy carrier from a sustainable source of energy. Int. J. Energy Res. 2020, 44, 4110–4131. [Google Scholar] [CrossRef]
- Armijo, J.; Philibert, C. Flexible production of green hydrogen and ammonia from variable solar and wind energy: Case study of Chile and Argentina. Int. J. Hydrogen Energy 2020, 45, 1541–1558. [Google Scholar] [CrossRef]
- Tang, O.; Rehme, J.; Cerin, P. Levelized cost of hydrogen for refueling stations with solar PV and wind in Sweden: On-grid or off-grid? Energy 2022, 241, 122906. [Google Scholar] [CrossRef]
- Mazumder, G.C.; Ibrahim AS, M.; Rahman, M.H.; Huque, S. Solar PV and Wind Powered Green Hydrogen Production Cost for Selected Locations. Int. J. Renew. Energy Res. 2021, 11, 1748–1759. [Google Scholar] [CrossRef]
- Wolf, A.; Zander, N. Green Hydrogen in Europe: Do Strategies Meet Expectations? Intereconomics 2021, 56, 316–323. [Google Scholar] [CrossRef]
- Huang, Y.-S.; Liu, S.-J. Chinese green hydrogen production potential development: A provincial case study. IEEE Access 2020, 8, 171968–171976. [Google Scholar] [CrossRef]
- Manna, J.; Jha, P.; Sarkhel, R.; Banerjee, C.; Tripathi, A.K.; Nouni, M.R. Opportunities for green hydrogen production in petroleum refining and ammonia synthesis industries in India. Int. J. Hydrogen Energy 2021, 46, 38212–38231. [Google Scholar] [CrossRef]
- Sontakke, U.; Jaju, S. Green Hydrogen Economy and opportunities for India. IOP Conf. Ser. Mater. Sci. Eng. 2021, 1206, 012005. [Google Scholar] [CrossRef]
- Rahman, M.N.; Wahid, M.A. Renewable-based zero-carbon fuels for the use of power generation: A case study in Malaysia supported by updated developments worldwide. Energy Rep. 2021, 7, 1986–2020. [Google Scholar] [CrossRef]
- Collera, A.A.; Agaton, C.B. Opportunities for production and utilization of Green Hydrogen in the Philippines. Int. J. Energy Econ. Policy 2021, 11, 37–41. [Google Scholar] [CrossRef]
- Karayel, G.K.; Javani, N.; Dincer, I. Green hydrogen production potential for Turkey with Solar Energy. Int. J. Hydrogen Energy 2022, 47, 19354–19364. [Google Scholar] [CrossRef]
- Ringsgwandl, L.M.; Schaffert, J.; Brücken, N.; Albus, R.; Görner, K. Current legislative framework for green hydrogen production by electrolysis plants in Germany. Energies 2022, 15, 1786. [Google Scholar] [CrossRef]
- Kelman, R.; Gaspar, L.D.S.; Geyer, F.S.; Barroso, L.A.N.; Pereira, M.V.F. Can Brazil Become a Green Hydrogen Powerhouse? J. Power Energy Eng. 2020, 8, 21–32. [Google Scholar] [CrossRef]
- Potashnikov, V.; Golub, A.; Brody, M.; Lugovoy, O. Decarbonizing Russia: Leapfrogging from Fossil Fuel to Hydrogen. Energies 2022, 15, 683. [Google Scholar] [CrossRef]
- Okonkwo, E.C.; Al-Breiki, M.; Bicer, Y.; Al-Ansari, T. Sustainable hydrogen roadmap: A holistic review and decision-making methodology for production, utilisation and exportation using Qatar as a case study. Int. J. Hydrogen Energy 2021, 46, 35525–35549. [Google Scholar] [CrossRef]
- Glenk, G.; Reichelstein, S. Economics of converting renewable power to hydrogen. Nat. Energy 2019, 4, 216–222. [Google Scholar] [CrossRef]
- Kakoulaki, G.; Kougias, I.; Taylor, N.; Dolci, F.; Moya, J.; Jäger-Waldau, A. Green hydrogen in Europe—A regional assessment: Substituting existing production with electrolysis powered by Renewables. Energy Convers. Manag. 2021, 228, 113649. [Google Scholar] [CrossRef]
- Patonia, A.; Poudineh, R. Cost-Competitive Green Hydrogen: How to Lower the Cost of Electrolyzers? The Oxford Institute for Energy Studies: Oxford, UK, 2022. [Google Scholar]
- Schoots, K.; Ferioli, F.; Kramer, G.J.; van der Zwaan BC, C. Learning curves for hydrogen production technology: An assessment of observed cost reductions. Int. J. Hydrogen Energy 2008, 33, 2630–2645. [Google Scholar] [CrossRef]
- Lane, B.; Reed, J.; Shaffer, B.; Samuelsen, S. Forecasting renewable hydrogen production technology shares under cost uncertainty. Int. J. Hydrogen Energy 2021, 46, 27293–27306. [Google Scholar] [CrossRef]
- Detz, R.J.; Reek JN, H.; Van Der Zwaan BC, C. The future of solar fuels: When could they become competitive? Energy Environ. Sci. 2018, 11, 1653–1669. [Google Scholar] [CrossRef]
- Krishnan, S.; Fairlie, M.; Andres, P.; De Groot, T.; Kramer, G.J. Power to gas (H2): Alkaline electrolysis. In Technological Learning in the Transition to a Low-Carbon Energy System: Conceptual Issues, Empirical Findings, and Use, in Energy Modeling; Academic Press: Cambridge, MA, USA, 2019. [Google Scholar] [CrossRef]
- Chapman, A.; Itaoka, K.; Farabi-Asl, H.; Fujii, Y.; Nakahara, M. Societal penetration of hydrogen into the future energy system: Impacts of policy, technology and carbon targets. Int. J. Hydrogen Energy 2020, 45, 3883–3898. [Google Scholar] [CrossRef]
- Noussan, M.; Raimondi, P.P.; Scita, R.; Hafner, M. The role of green and blue hydrogen in the energy transition—A technological and geopolitical perspective. Sustainability 2020, 13, 298. [Google Scholar] [CrossRef]
- Trattner, A.; Klell, M.; Radner, F. Sustainable Hydrogen Society—Vision, findings and development of a hydrogen economy using the example of Austria. Int. J. Hydrogen Energy 2022, 47, 2059–2079. [Google Scholar] [CrossRef]
- Sejkora, C.; Lindorfer, J.; Kühberger, L.; Kienberger, T. Interlinking the renewable electricity and gas sectors: A techno-economic case study for Austria. Energies 2021, 14, 6289. [Google Scholar] [CrossRef]
- Christensen, A. Assessment of Hydrogen Production Costs from Electrolysis: United States and Europe. 2020. Available online: https://theicct.org/sites/default/files/publications/final_icct2020_assessment_of%20_hydrogen_production_costs%20v2.pdf (accessed on 8 February 2023).
- IEA. Global Installed Electrolysis Capacity by Technology, 2015–2020; IEA: Paris, France, 2022; Available online: https://www.iea.org/data-and-statistics/charts/global-installed-electrolysis-capacity-by-technology-2015-2020 (accessed on 20 February 2023).
- Fraunhofer Ise. Photovoltaics Report; Fraunhofer Institute for Solar Energy Systems ISE: Freiburg, Germany, 2023; Available online: https://www.ise.fraunhofer.de/en/publications/studies/photovoltaics-report.html (accessed on 5 March 2023).
- IRENA. Solar Energy; IRENA: Masdar City, Abu Dhabi, 2023; Available online: https://www.irena.org/Energy-Transition/Technology/Solar-energy (accessed on 20 February 2023).
- IRENA. Wind Energy; IRENA: Masdar City, Abu Dhabi, 2023; Available online: https://www.irena.org/Energy-Transition/Technology/Wind-energy (accessed on 20 February 2023).
- Lazard. Levelized Cost of Energy, Levelized Cost of Storage, and Levelized Cost of Hydrogen 2020; Lazard: New York, NY, USA, 2020; Available online: https://www.lazard.com/research-insights/levelized-cost-of-energy-levelized-cost-of-storage-and-levelized-cost-of-hydrogen-2020/ (accessed on 5 February 2023).
- Ferioli, F.; Schoots, K.; van der Zwaan BC, C. Use and limitations of learning curves for energy technology policy: A component-learning hypothesis. Energy Policy 2009, 37, 2525–2535. [Google Scholar] [CrossRef]
- Böhm, H.; Goers, S.; Zauner, A. Estimating future costs of power-to-gas—A component-based approach for technological learning. Int. J. Hydrogen Energy 2019, 33, 30789–30805. [Google Scholar] [CrossRef]
- ETC. Making the Hydrogen Economy Possible—Accelerating Clean Hydrogen in an Electrified Economy; The Energy Transitions Commission (ETC): London, UK, 2021; Available online: https://www.energy-transitions.org/publications/making-clean-hydrogen-possible/ (accessed on 7 February 2023).
- ETC. Bioresources within a Net-Zero Emissions Economy: Making a Sustainable Approach Possible; The Energy Transitions Commission (ETC): London, UK, 2021; Available online: https://www.energy-transitions.org/publications/bioresources-within-a-net-zero-economy/ (accessed on 7 February 2023).
- IEA. ETP Clean Energy Technology Guide—Data Tools; IEA: Paris, France, 2022; Available online: https://www.iea.org/data-and-statistics/data-tools/etp-clean-energy-technology-guide?selectedVCStep=Production&selectedSector=Hydrogen (accessed on 5 April 2023).
- IEA. Hydrogen Projects Database; IEA: Paris, France, 2021; Available online: https://www.iea.org/reports/hydrogen-projects-database. (accessed on 5 April 2023).
- IEA. Electrolyzers; IEA: Paris, France, 2022; Available online: https://www.iea.org/reports/electrolyzers (accessed on 10 March 2023).
- IRENA. Hydrogen: A Renewable Energy Perspective; International Renewable Energy Agency: Masdar City, Abu Dhabi, 2019. [Google Scholar]
- Dentos The Prospect for Hydrogen, December 2020. 2023. Available online: https://www.dentons.com/en/insights/articles/2020/december/29/the-prospect-for-hydrogen (accessed on 5 April 2023).
- Recharge. Average Cost of Green Hydrogen to Fall to $1.50/kg by 2030 as Electrolyzer Capacity Ramps up 50-Fold: Analyst; Recharge: Santa Monica, CA, USA, 2023; Available online: https://www.rechargenews.com/energy-transition/average-cost-of-green-hydrogen-to-fall-to-1-50-kg-by-2030-as-electrolyzer-capacity-ramps-up-50-fold-analyst/2-1-1287093 (accessed on 15 February 2023).
- IEA. Low-Carbon Hydrogen Production, 2010–2030, Historical, Announced and in the Sustainable Development Scenario, 2030–Data & Statistics; IEA: Paris, France, 2022; Available online: https://www.iea.org/data-and-statistics/charts/low-carbon-hydrogen-production-2010-2030-historical-announced-and-in-the-sustainable-development-scenario-2030 (accessed on 15 March 2023).
- Bloomberg. BNEF Hydrogen Economy Outlook—Data.bloomberglp.com. Available online: https://data.bloomberglp.com/professional/sites/24/BNEF-Hydrogen-Economy-Outlook-Key-Messages-30-Mar-2020.pdf (accessed on 15 March 2023).
- Hydrogen Council Report. Hydrogen Insights A Perspective on Hydrogen Investment, Market Development and Cost Competitiveness. Available online: https://hydrogencouncil.com/en/hydrogen-insights-2021/ (accessed on 15 March 2023).
- World Energy Council. International Aspects of a Power-to-X Roadmap; A Report Prepared for the World Energy Council Germany; Frontier Economics Ltd.: London, UK, 2018; Available online: https://fsr.eui.eu/wp-content/uploads/5INTERNATIONAL-ASPECTS-OF-A.pdf (accessed on 15 March 2023).
- Lazanyuk, I.; Ratner, S.; Revinova, S.; Gomonov, K.; Modi, S. Diffusion of renewable microgeneration on the side of end-user: Multiple case study. Energies 2023, 16, 2857. [Google Scholar] [CrossRef]


| Data | Year | Units | Original Source |
|---|---|---|---|
| Installed electrolysis capacity | 2015–2020 | MW | [50] |
| Electrolyzer CAPEX Costs | 2015–2020 | (USD 2020/kW) | [38,49,51] |
| Electricity Generation Solar PV | 2011–2020 | GWh | [52] |
| Electricity Generation Wind Total (Onshore, Offshore) | 2011–2020 | GWh | [53] |
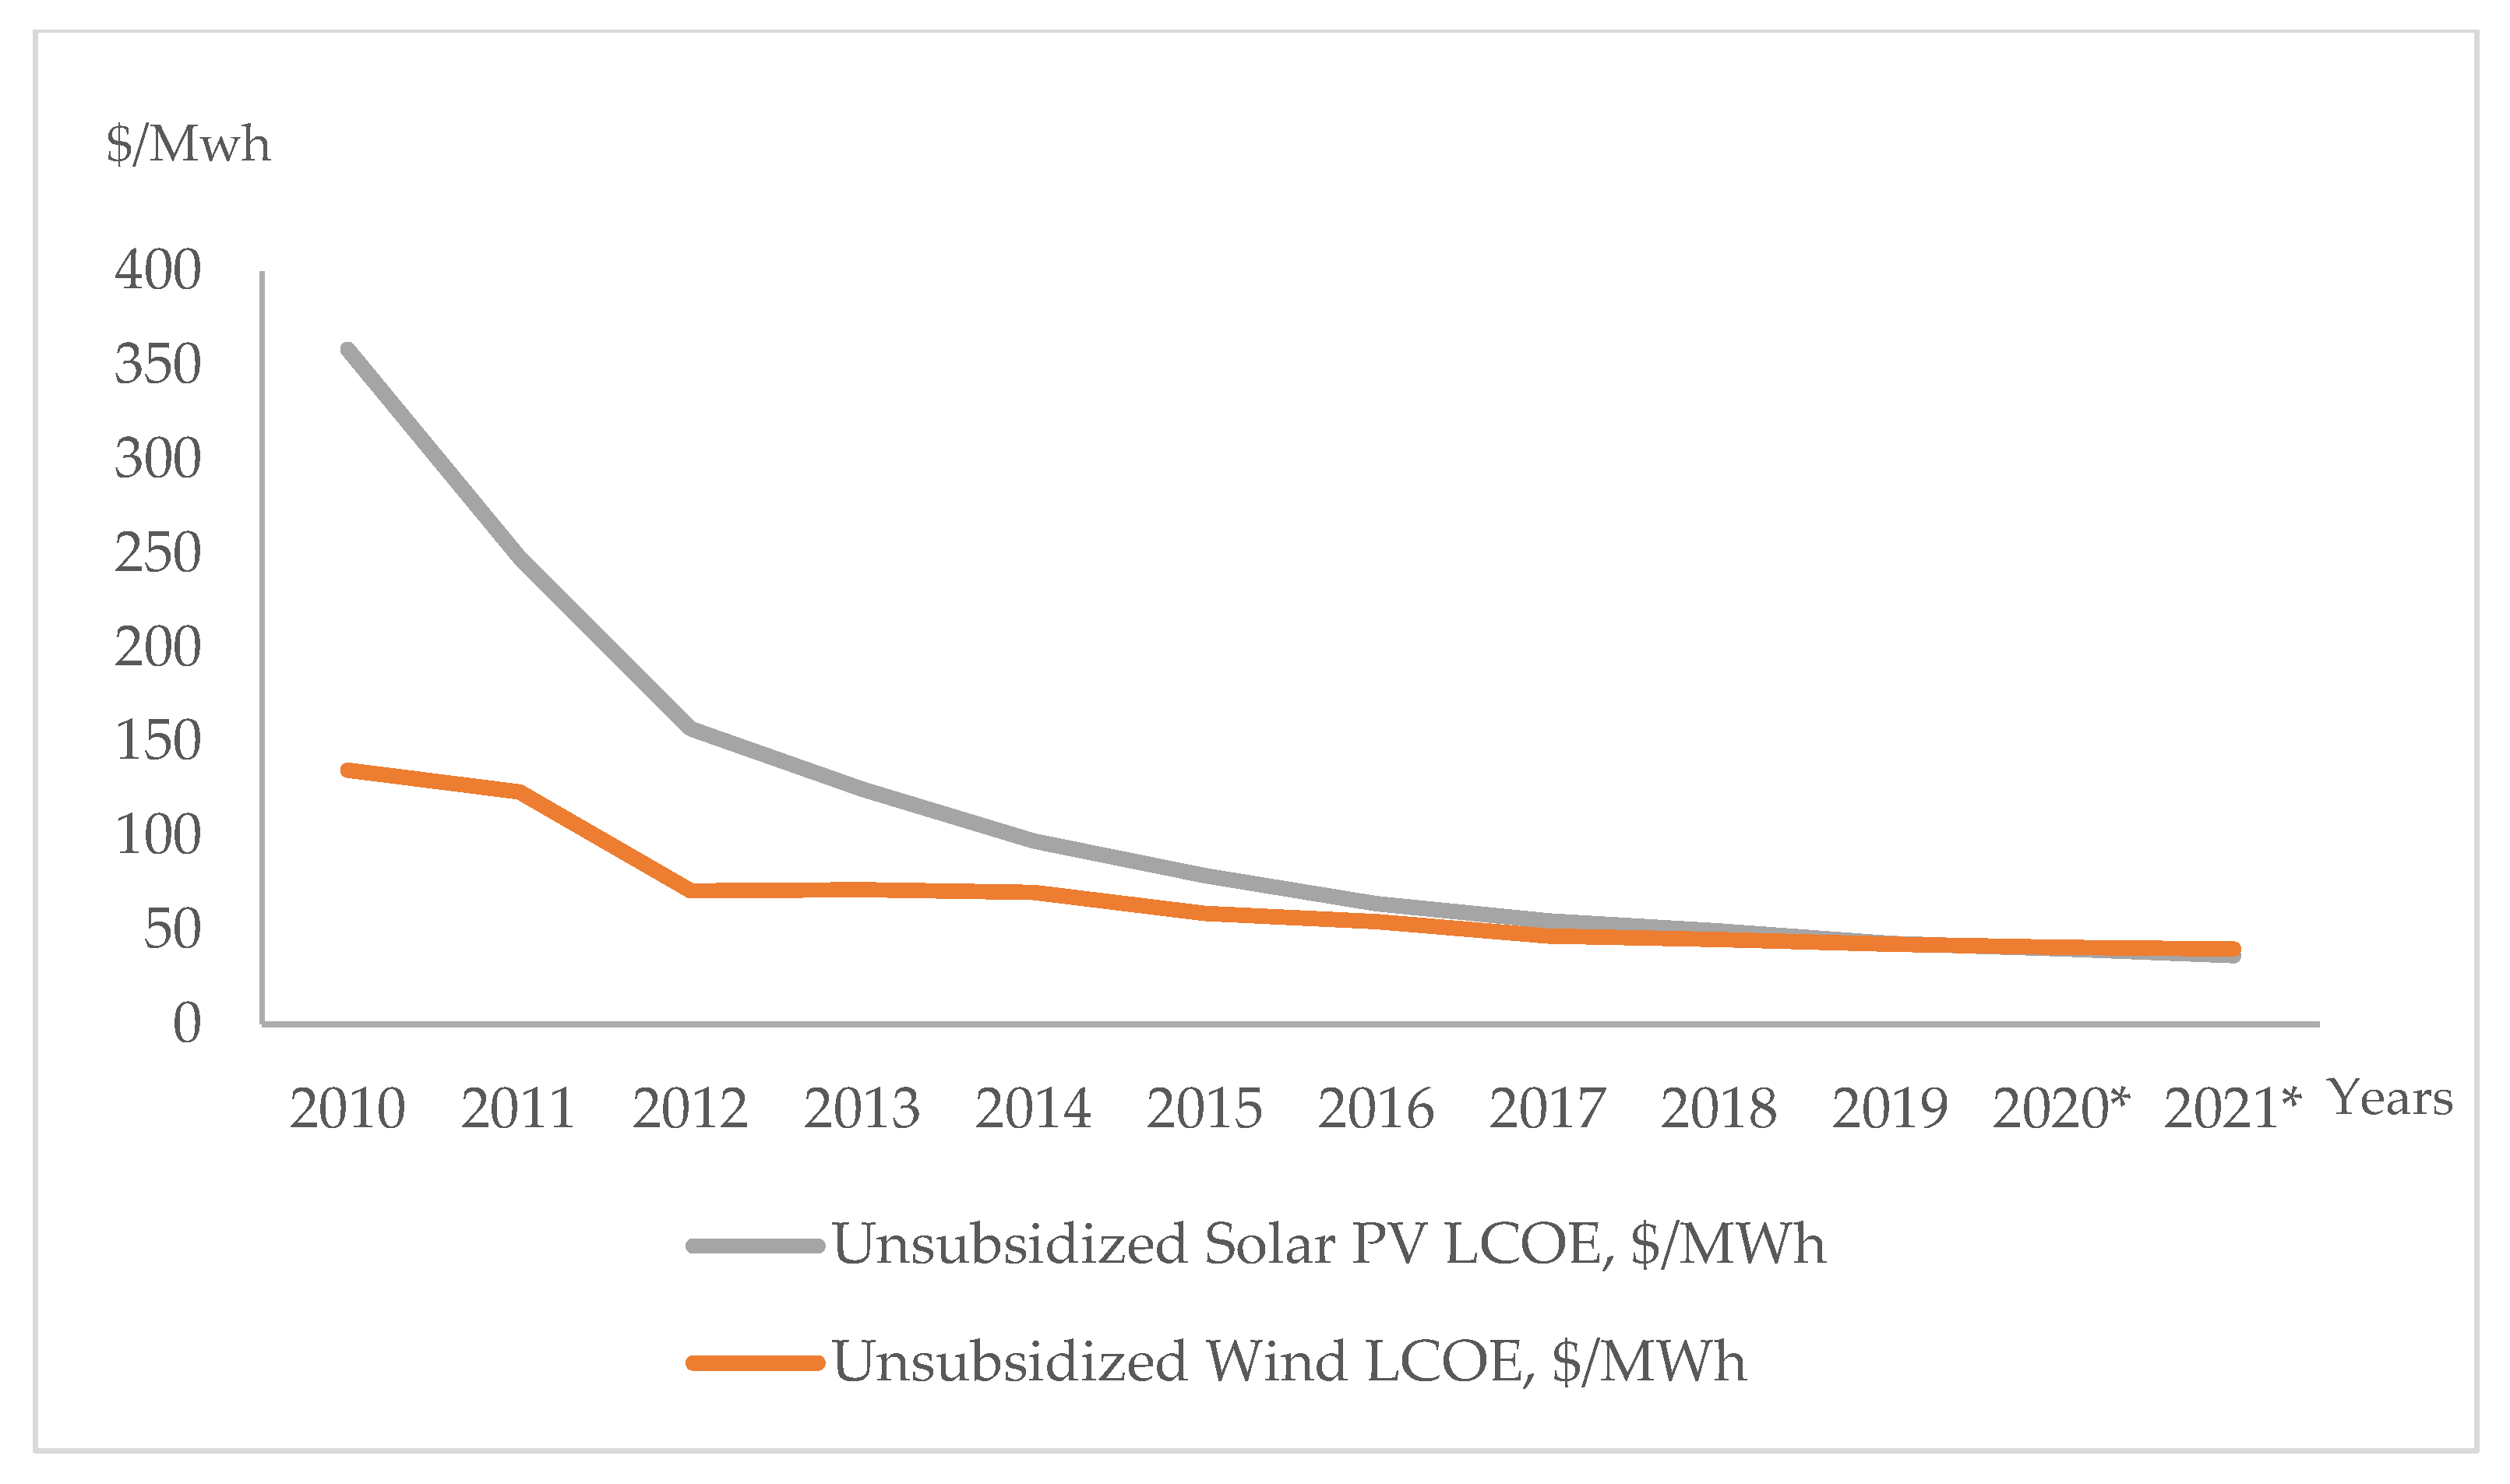
| Unsubsidized Solar PV LCOE | 2011–2020 | USD/MWh | [54] |
| Unsubsidized Wind LCOE | 2011–2020 | USD/MWh | [54] |
| Production Technology | Importance for Net-Zero Emissions | Readiness Level (TRL) |
|---|---|---|
| Electrolysis > Electrolyzer design > Polymer electrolyte membrane | Very high | 9 |
| Electrolysis > Electrolyzer design > Alkaline | Very high | 9 |
| Partial oxidation with CCUS | High | 6 |
| Methane reforming > Autothermal reforming with CCUS > With gas heat-reformed | High | 5 |
| Methane reforming > Autothermal reforming with CCUS > Single reformer | High | 5 |
| Methane reforming > Steam reforming with CCUS > High capture rates | High | 5 |
| Thermochemical water splitting > Nuclear | Moderate | 3 |
| Electrolysis > Seawater electrolysis | Moderate | 3 |
| Electrolysis > Electrolyzer design > Anion exchange membrane electrolyzer | Moderate | 6 |
| Electrolysis > Electrolyzer design > Solid oxide electrolyzer cell | Moderate | 7 |
| Electrolyzer Type | Number of Projects |
|---|---|
| Alkaline electrolyzer | 192 |
| PEM | 290 |
| SOEK | 38 |
| Other Electrolysis | 790 |
| Total | 1310 |
| Wind Energy | Solar Energy | ||||
|---|---|---|---|---|---|
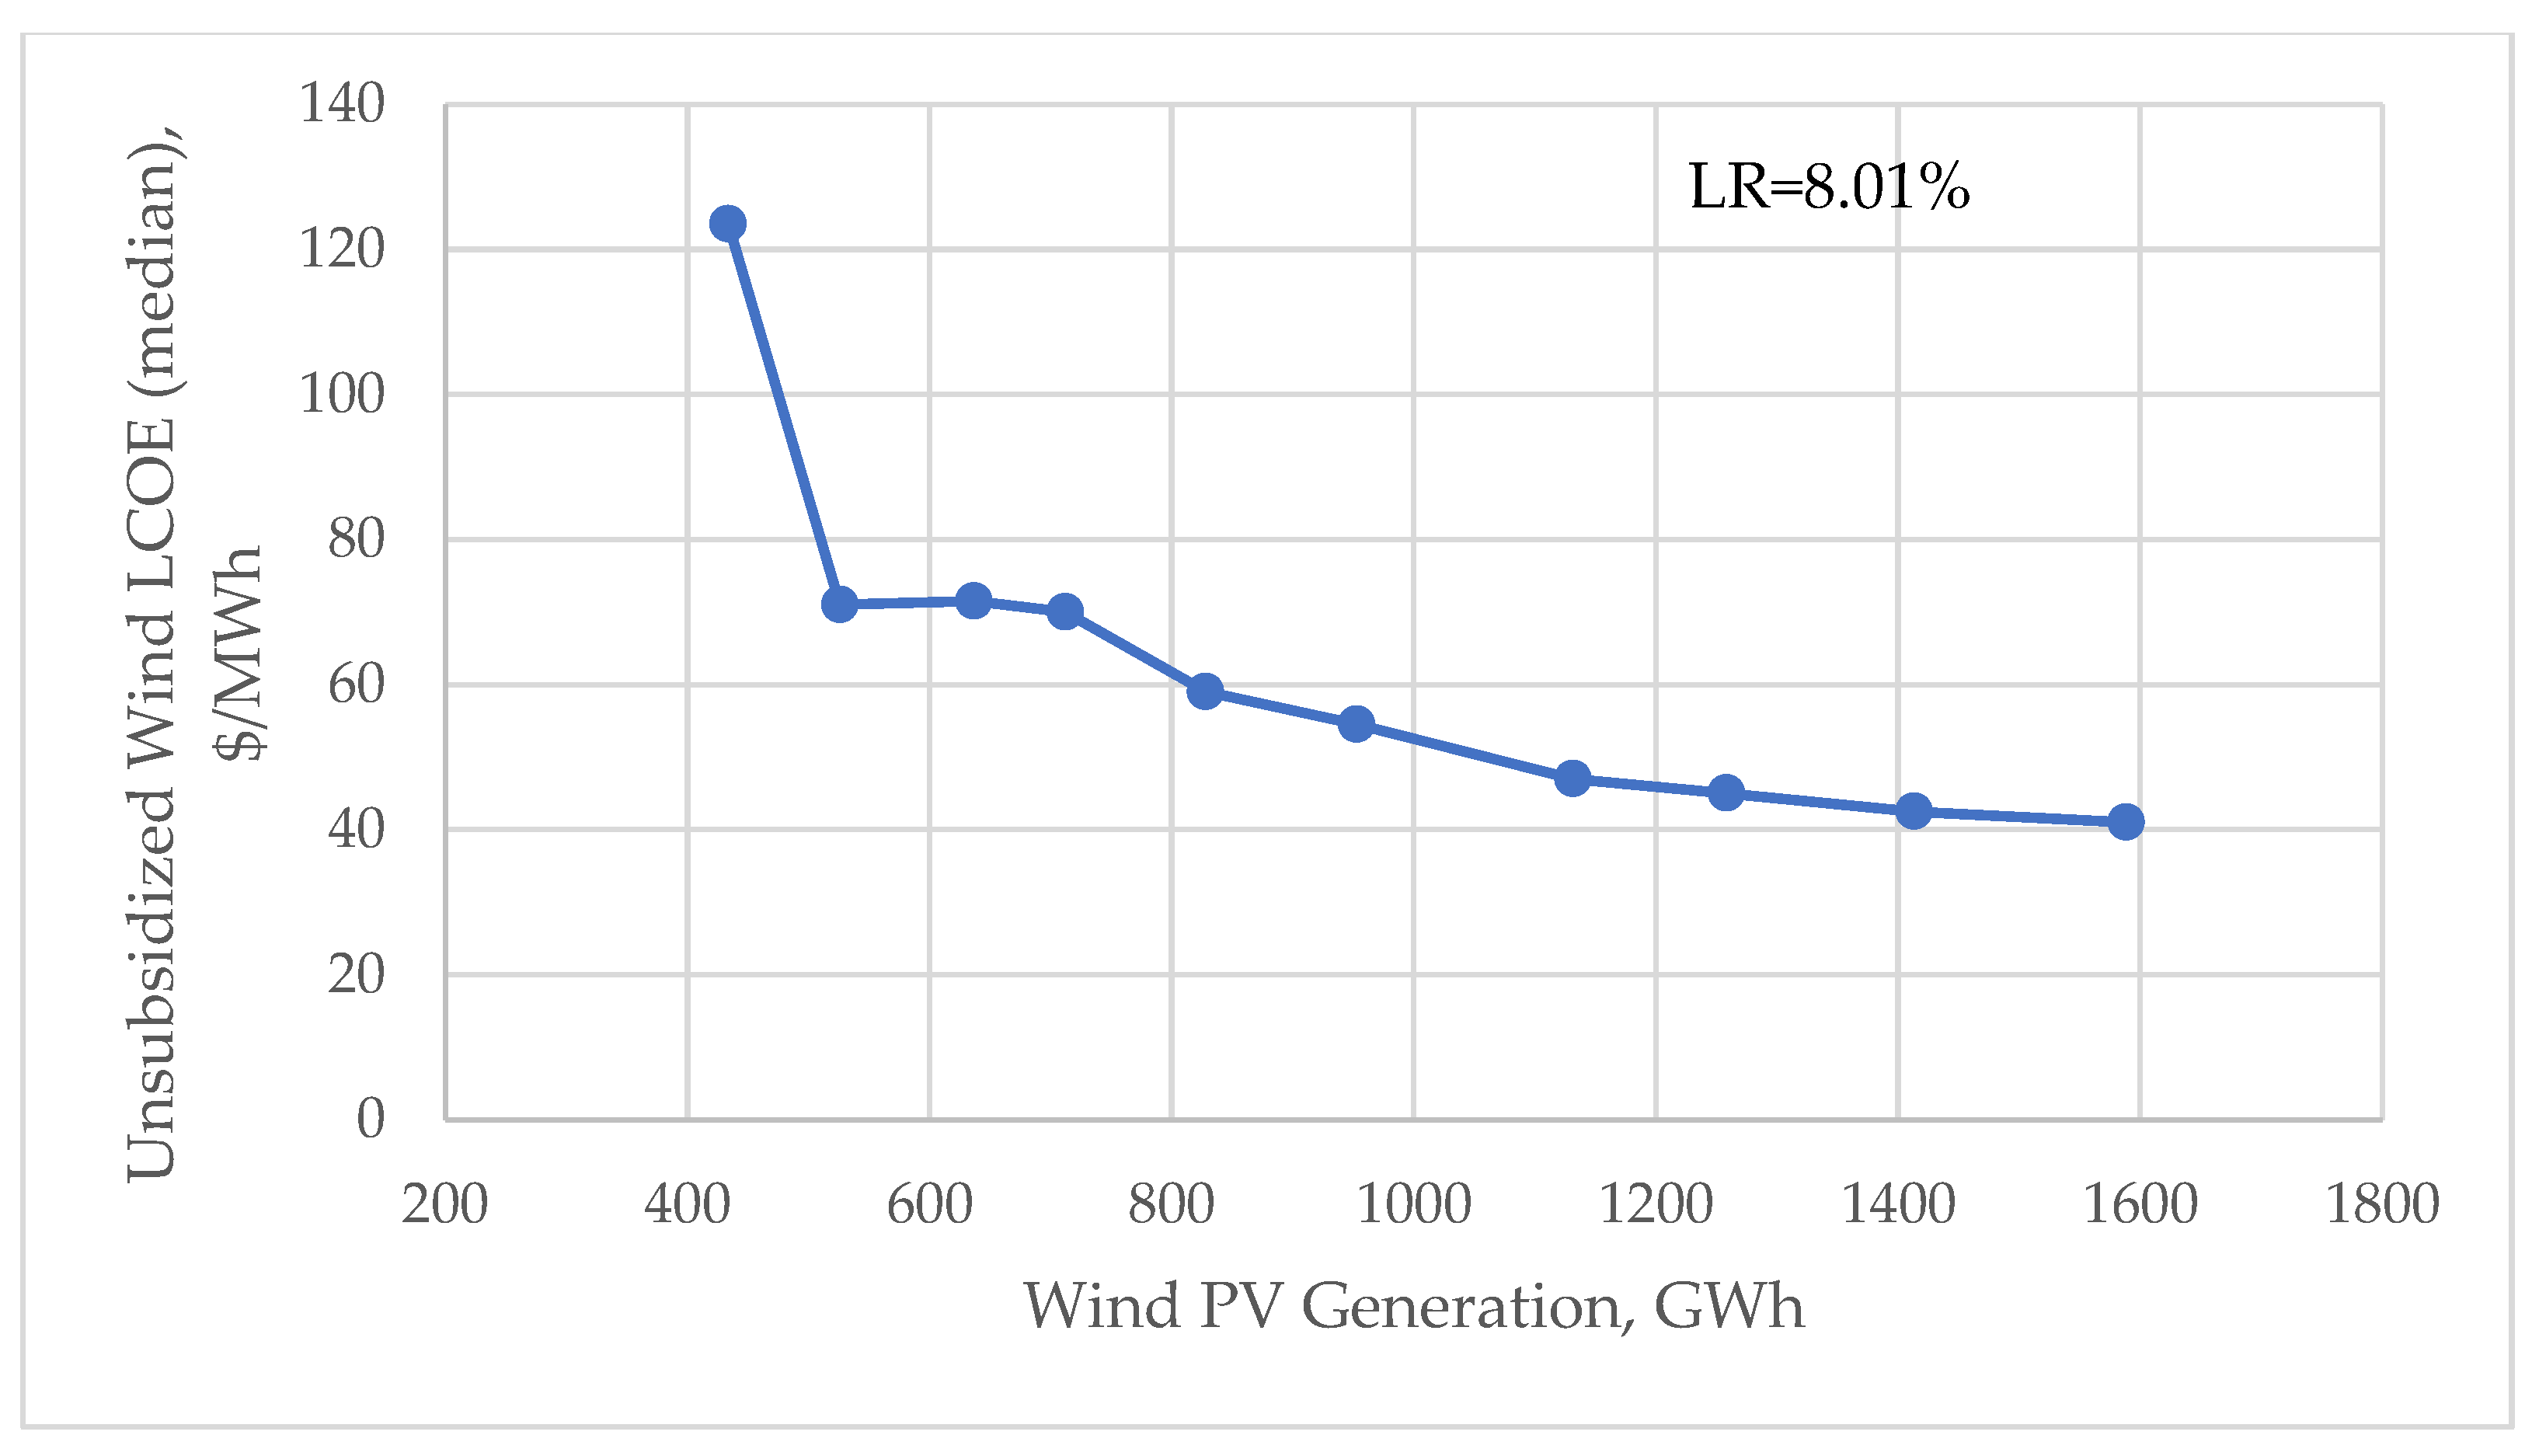
| Lower Limit | Median | Upper Limit | Lower Limit | Median | Upper Limit |
| 7.35% | 8.01% | 9.63% | 14.28% | 14.35% | 14.44% |
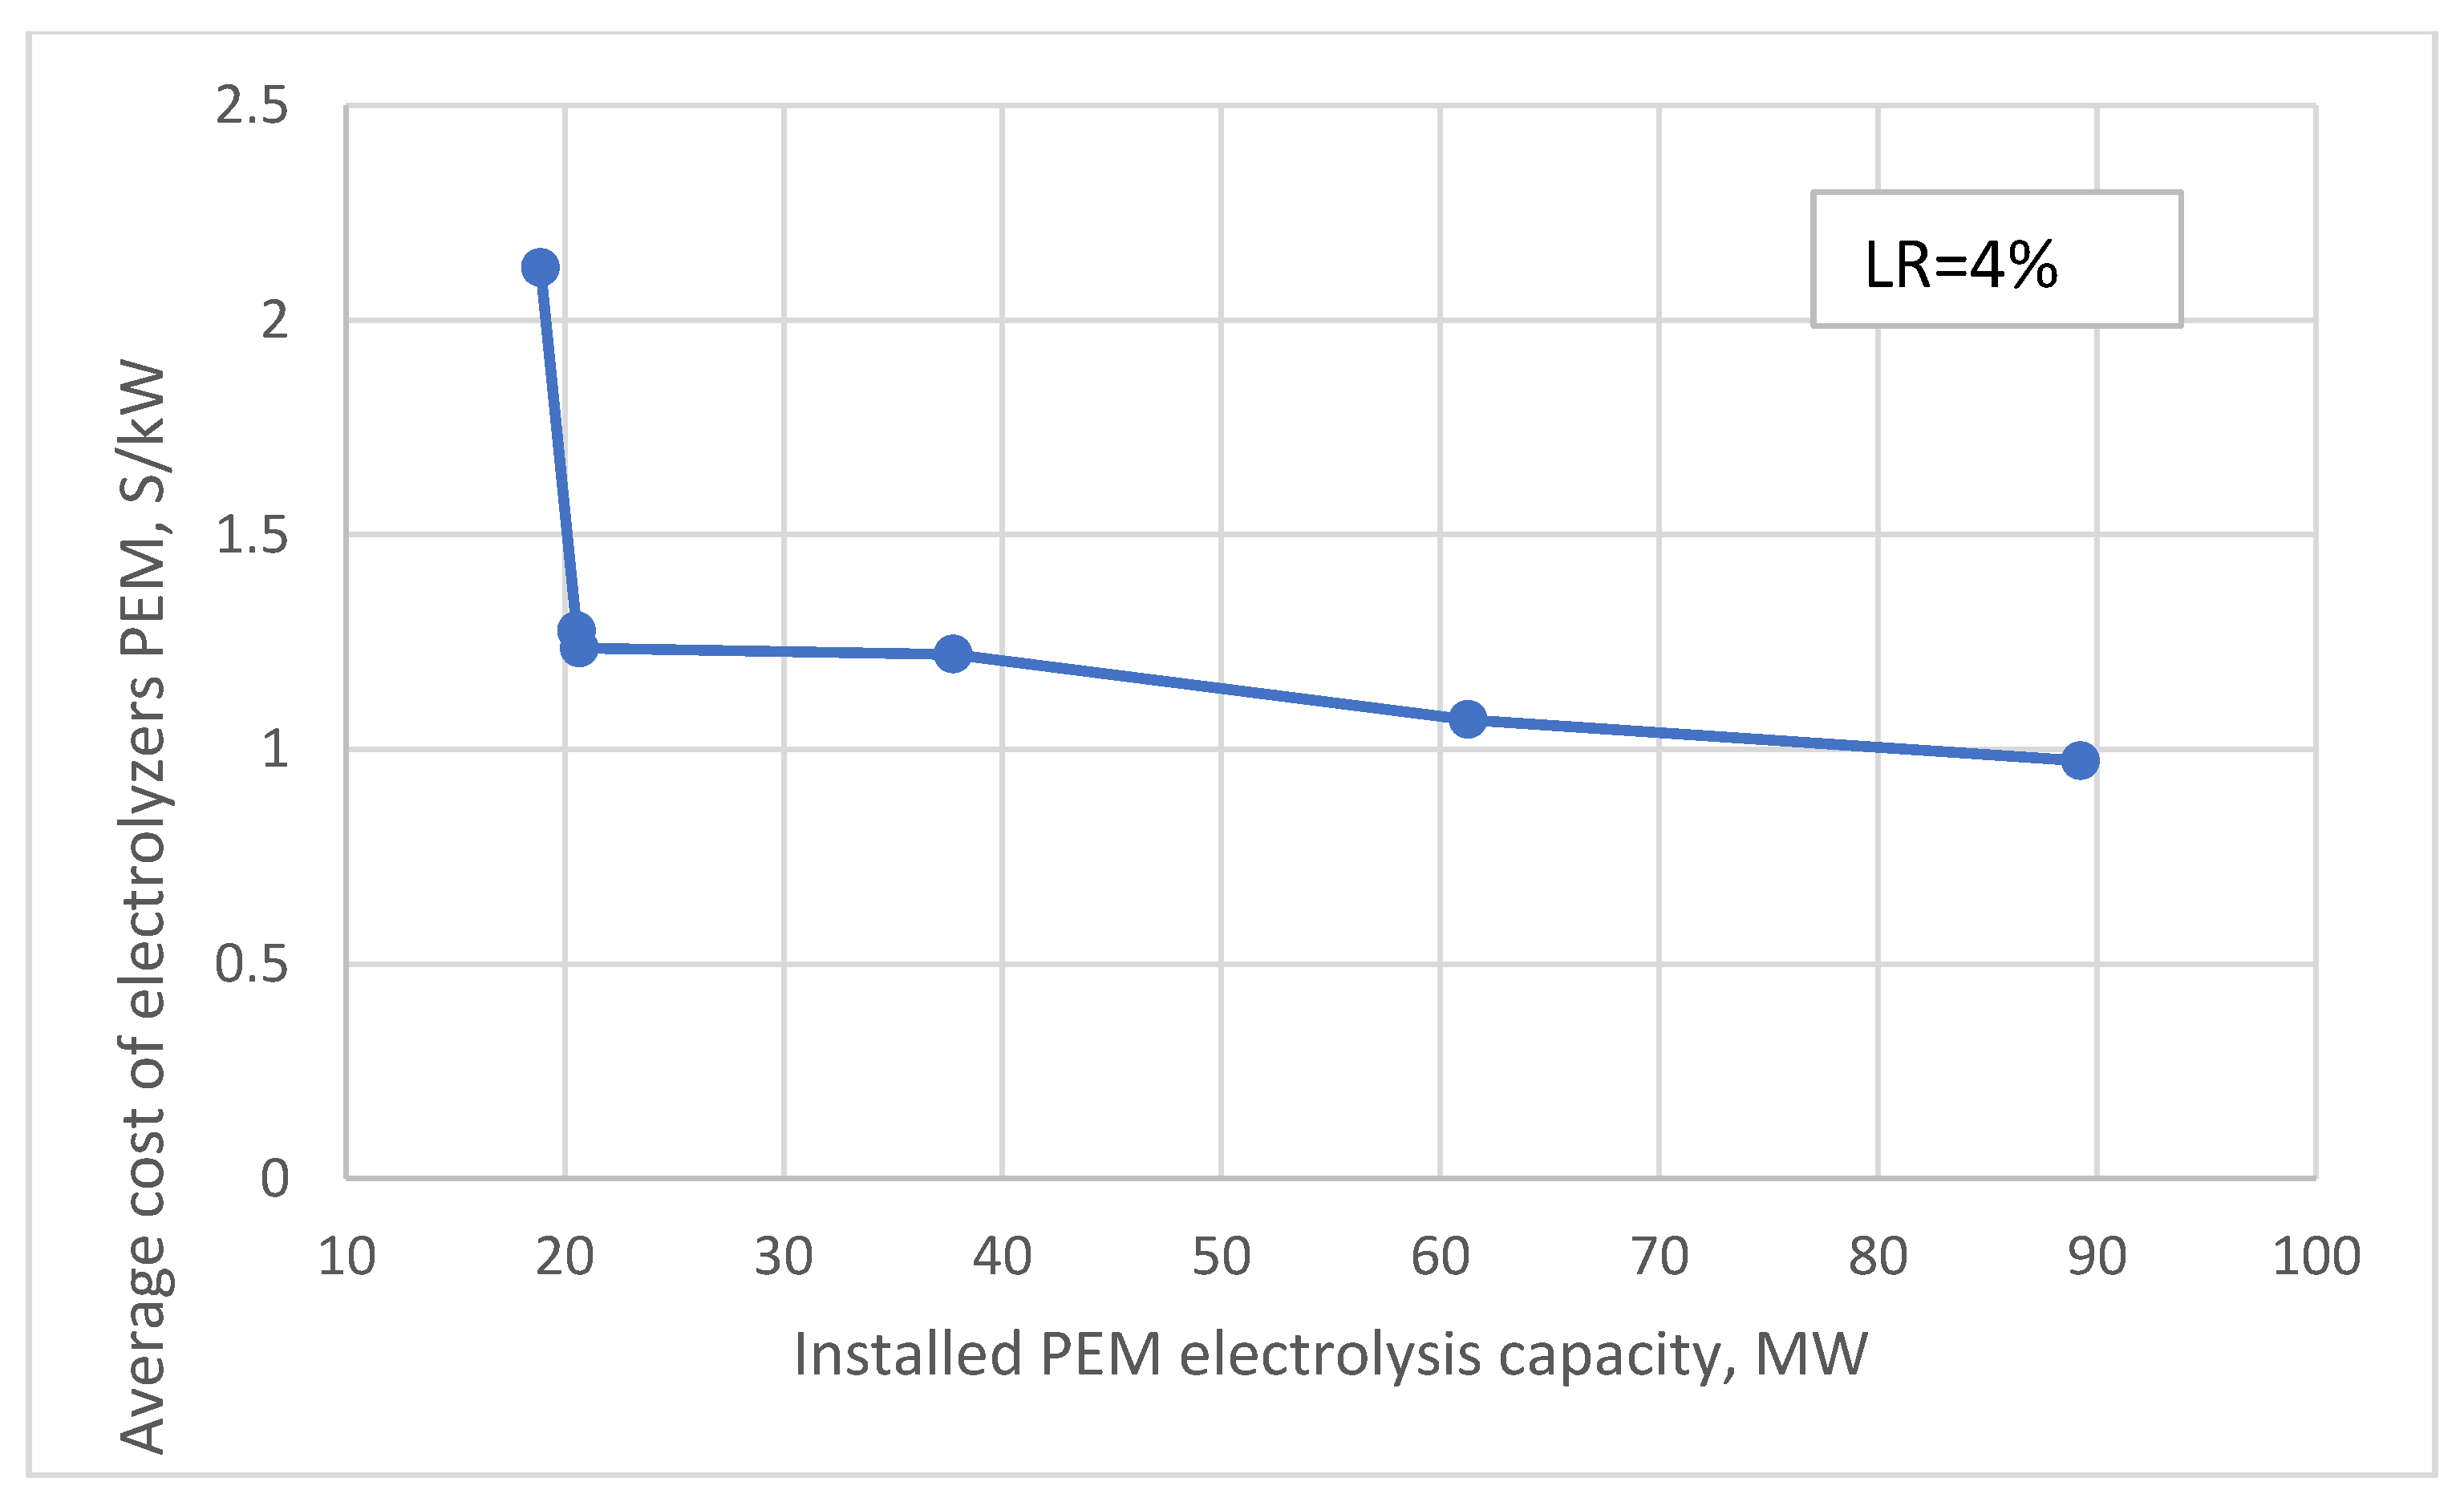
| Electrolyzer AE | Electrolyzer PEM |
|---|---|
| 4% | 4% |
| Share of Energy by Type | Low Limit | Median | Upper Limit | |
|---|---|---|---|---|
| Share of energy 30% | Wind Solar | 4% 7% | 5% 7% | 5% 8% |
| Share of energy 60% | Wind Solar | 6% 10% | 6% 10.1% | 7% 10.2% |
Disclaimer/Publisher’s Note: The statements, opinions and data contained in all publications are solely those of the individual author(s) and contributor(s) and not of MDPI and/or the editor(s). MDPI and/or the editor(s) disclaim responsibility for any injury to people or property resulting from any ideas, methods, instructions or products referred to in the content. |
© 2023 by the authors. Licensee MDPI, Basel, Switzerland. This article is an open access article distributed under the terms and conditions of the Creative Commons Attribution (CC BY) license (https://creativecommons.org/licenses/by/4.0/).
Share and Cite
Revinova, S.; Lazanyuk, I.; Ratner, S.; Gomonov, K. Forecasting Development of Green Hydrogen Production Technologies Using Component-Based Learning Curves. Energies 2023, 16, 4338. https://doi.org/10.3390/en16114338
Revinova S, Lazanyuk I, Ratner S, Gomonov K. Forecasting Development of Green Hydrogen Production Technologies Using Component-Based Learning Curves. Energies. 2023; 16(11):4338. https://doi.org/10.3390/en16114338
Chicago/Turabian StyleRevinova, Svetlana, Inna Lazanyuk, Svetlana Ratner, and Konstantin Gomonov. 2023. "Forecasting Development of Green Hydrogen Production Technologies Using Component-Based Learning Curves" Energies 16, no. 11: 4338. https://doi.org/10.3390/en16114338