Article

A Power Evolution Game Model and Its Application Contained in Virtual Power Plants

1
Beijing Key Laboratory of Demand Side Multi-Energy Carriers Optimization and Interaction Technique (China Electric Power Research Institute), Beijing 100192, China
2
School of Electrical Engineering and Information Technology, Changchun Institute of Technology, Changchun 130012, China
*
Author to whom correspondence should be addressed.
Energies 2023, 16(11), 4373; https://doi.org/10.3390/en16114373
Submission received: 20 April 2023 / Revised: 14 May 2023 / Accepted: 16 May 2023 / Published: 27 May 2023
(This article belongs to the Section C: Energy Economics and Policy)

Abstract

:
Demand response is an effective way to alleviate the pressure on power systems and improve energy utilisation efficiency. This study constructs a tripartite evolutionary game model on government, power companies and virtual power plants (VPPs), and analyses the dynamic behavioural selection mechanism of the three parties under demand-response mode. The results show that: (1) government guidance and management are effective means to promote the stability and equilibrium of the power system; (2) an increase in government subsidy, a reduction in the demand-response cost and an increase in opportunity cost will increase the enthusiasm for changes in demand-response behaviour in power companies; (3) government subsidies will improve the demand-response behaviour of VPPs. This study effectively provides theoretical support for the demand response of power systems, and realises the goal of power energy saving through the optimal choice of behaviour strategies for all parties in the power system.

1. Introduction

In response to the consequences of climate warming [1,2], various countries around the world have begun to pay attention to ways of achieving sustainable energy [3]. As a result, the installed capacity of wind power, solar power and other energy systems has increased significantly in recent years [4,5]. The direction of energy generation and consumption system development is currently towards the building of a new, clean and renewable energy supply system [6,7,8]. New energy power generation, such as solar and stroke power, will steadily be expanded in the power system, and peak regulation and frequency modulation resources will become increasingly rare [9,10]. In addition to the construction of flexible resources on the supply side, the development of flexible resources on the power demand side has great potential, and the investment cost is relatively low, which makes it among the most important ways to solve the problem of peak regulation in the power system [11,12]. China began its urban comprehensive power demand-side management pilot program in 2012, and has made it apparent that one of the pilot’s key objectives is to promote the power demand response. The power demand response was formally adopted for the first time in China in 2013, and has steadily developed in comprehensive city pilots and associated provinces, with Shanghai chosen as the pilot city [13,14]. The “14th Five-Year Plan for Modern Energy System” suggests that in order to reach 3% to 5% of the maximum load by 2025, the elasticity of the power load needs to be significantly improved, demand-side response capacity needs to be increased, etc.
The current flexibility of the power system is flawed, mainly because there are more wind and solar units on the power generation side of the general power system, and their power generation (output) is random, leading to difficulties in peak regulation (power regulation) by power companies, and the use of power users in grid regulation can improve power companies’ ability to consume new energy [15,16]. Demand response is a way to guide users to actively adjust load demand by regulating energy prices or economic incentives, to achieve the effect of energy saving and load shaping and to improve the efficiency of electricity use through the comprehensive and optimal allocation of load resources [17,18]. Relying on modern advanced information and communication technology widely used in the power system, demand response has played an increasingly important role in improving the reliability of power, promoting the consumption of renewable energy and reducing energy costs [19,20].
Currently, the development of urban resident demand response has been widely concerning. It is, however, very difficult to ascertain the best approach for decision-making entities of resident users in the implementation of demand response due to the large base of resident users and the variety of load types, particularly the gradual popularisation of electric vehicles, coupled with the diversification of electricity-selling entities and trading modes in the electricity market. The traditional optimal theoretical system of single-agent decision making cannot meet strategy optimisation among multi-decision-making entities. Further investigation shows that the demand-side reform of the current power system is still difficult to carry out, and demand-side reform needs the cooperation of the government, power companies and VPPs [21]. The effective operation of the power system can not only effectively save resources and improve the efficiency of power use, but can also ensure the stability of the power system and promote the harmonious development of enterprises and VPPs. As stakeholders pursue different interests, the government pays more attention to the sustainable progress of society and the benign development of the economy, and actively requires power companies and VPPs to save energy and protect the environment. However, power companies and VPPs are more concerned about their direct and indirect economic benefits. Therefore, game theory, as a solution to multi-decision-making agent optimisation problems, is expected to become a powerful tool to solve the optimisation problem of the power system demand response.
The strategic interaction among the government, power companies and VPPs plays a key role in solving the optimisation problem of VPP demand response. As a macro-manager, the government guides and manages the development trend of the power market, promulgates demand-side policies [22,23], implements regulatory measures and leads to the beneficial optimisation of the power industry through incentives and punishments for power companies and VPPs, promoting enthusiasm for demand-side reform in the power industry. Power companies, as operational enterprises that implement national policies, connect power generation enterprises with customers and play a bridging role, assuming a clear responsibility to promote the demand reform of the power industry. Power companies are responsible for adjusting power generation capacity [24] and load [25] at different peaks on the supply side, relying on their management authority and the advantages of power system scheduling. On the demand side of the market, measures should be taken to encourage VPPs to improve the efficiency of power interruption, save resources and increase the economic benefits of the power system [26]. The benefits for VPPs, facing changes in electricity market prices [27] and social responsibility issues [27,28], include reducing consumption expenditure by saving electricity, but this will affect production, etc. The government, power companies and VPPs have different goals. If the government only cares about the social benefits of energy conservation, forcing power companies and VPPs to use electricity, or relying on the power market to automatically adjust the price of electricity, it will often fail to reach the expected goals and even affect the harmonious development of society. If the power company cannot effectively adjust electricity prices and control the power consumption relationship between the power plant and VPPs, the peak–valley difference on the supply side will be too large, leading to high electricity prices, difficulties in dispatching, instability of the system and even social power outage and serious losses of the power grid company. Thus, effective cooperation between governments, power companies and VPPs is a key challenge for the effective and efficient operation of the power system.
To promote the reform and development of the power demand side, this study mainly studies the following questions: (1) What measures can the government take to effectively promote the reform of the power industry demand side? (2) What measures should power companies and VPPs take to actively cooperate with demand-side reform? (3) Under the cost pressure of high prices, do power companies and VPPs choose to be active or passive? This paper takes this as the starting point and actively produces the current tripartite strategy research of evolutionary games.
The current research is mainly from the perspectives of government power demand management, power energy-saving technology applications and the game between power companies and power plants [29]. As present, there are few types of research on multi-agent cooperation in power systems using the game theory method to solve the problem of power system efficiency under the conditions of considering government, power companies and VPPs. Most of the existing studies are from the perspective of two-party agents and static. However, in the actual power system, government, power companies and VPPs will dynamically adjust their behaviour according to other relevant parties’ behaviours. Evolutionary game considers the dynamic behaviour adjustment process of the group in the system and studies the actual dynamic process of the long-term bounded rationality of each subject, which is suitable for analysing the dynamic decision-making process of each participant in the power system [30]. To the authors’ best knowledge, this study firstly comprehensively considers the dynamic evolution behaviour of multiple subjects composed of government, power companies and VPPs based on a macro view for power response demand. Through the establishment of a dynamic evolution model among the government, power companies and VPPs, this study proposes a realistic dynamic decision-making process, which provides a theoretical basis for the promotion of the demand-side response of the power system.
The structure of this study is as follows: Section 1 introduces the research background. Section 2 presents a literature review of demand-side reforms and game research in power systems. Section 3 defines the research hypothesis and constructs the demand-side reform model of the power system. Section 4 analyses and verifies the model through simulation parameters. Section 5 summarises the research conclusions, puts forward suggestions and points out future research ideas.

2. Literature Review

2.1. Demand Response

In order to promote energy conservation and emission reduction, follow market-oriented development and secure the sustainability and stability of power systems, the Chinese government has implemented changes in the power industry. These entail loosening pricing controls on the energy industry, making orderly changes to the plans for power supply and consumption and controlling the power operating system [13,14]. Different points of research are primarily covered by the study of demand-side management of power systems. First, in terms of participating parties, it comprises studies on the interactions among various parties from government administration, power corporations, power operators and regulating systems for power resource aggregation. Second, the management process addresses technical concerns such as demand response, power generation, storage, electrical energy reserves, energy efficiency improvement and power conservation. Last but not least, the goals of power system management include guaranteeing energy security and stability, cutting back on energy use and decreasing emissions [31].
The power management authorities of several nations have taken notice of the demand response as a management strategy for demand-side reform that successfully relieves the burden on the power system and balances the price of electricity. It has been shown that demand-side reform of the power system, by regulating the demand-side consumption behaviour of VPPs, adjusts the peak of the power system in different periods, alleviates the energy crisis of power outages in special periods and ensures the stability and effectiveness of the power system [32]. On the supply side, it can reduce the demand for installed power plant equipment and the pressure on the transmission network, saving supply side investments; on the social level, it can achieve the goal of energy saving and emission reduction and improve public welfare [33]. Varavoca et al. [34] noted that the demand-side reform of the power system requires policy guidance and technical support, and plays the role of the market.
In the Chinese context, for the demand response problem of the power system, effective government participation and management are mainly needed to tap the potential of the demand side of the power system, and the role of the market is weak in the Chinese context [35]. Zeng et al. [36] classified China’s electricity market into the initial development stage, medium-term progressive stage and mature and stable stage, and the study points out that different demand-response policies need to be developed in terms of market conditions and the stage of the electricity system at different stages. Most studies point out that the demand-side response in the power system requires a combination of government incentive systems and market price guidance mechanisms to increase consumer participation and responsiveness from the demand side [37]. However, there are still a lot of barriers to demand-side response in the Chinese market, including the rigidity of the dynamic power price adjustment mechanism, the inadequacy of market support measures and the immaturity of the load aggregator platform. These issues still call for in-depth analysis and demand-side response promotion.
Right now, we can see that the demand-side management of the power systems is the main trend of current research. The research mainly discusses the behaviour of different agents in power systems, the technical problems of power system management and the energy efficiency goal of power systems. However, the in-depth analysis of the multi-agent interaction behaviour of power system demand responses is limited.

2.2. Game Research in Power Systems

Evolutionary game theory is based on limited information and considers the complexity and uncertainty of environment; it can effectively and dynamically reflect the real application of power systems [38,39,40].
Game theory has been widely used in various fields, and then gradually applied in the power systems [41]. In the early days, game theory was used to analyse the revenue distribution and sharing problem in power systems [42], the adaptive distribution of power transaction costs [43,44,45], the energy cost-saving problems in power systems [46], the planning and expansion of power transmission system in power systems [47,48,49] and preference analysis among different agents in power systems [50].
Numerous actors must work together for the demand-side reform of the electrical system to succeed [41]. At present, with the development of marketisation, the degree of freedom of the power system is gradually increasing, but in view of the complex relationship between many subjects, it is still necessary to use game theory to study the optimal balance problem. The current research of most scholars mainly focuses on the problem of two-party games with an emphasis on static analysis [51]. The study of game relationships in the power system has grown over time and has become increasingly involved in its planning, implementation, market operations and other facets.
In order to understand the power system, numerous academics have conducted research at different levels based on the relationship between non-cooperative games [52,53,54] and competitive cooperative game [55,56,57]. Based on game theory, Hobbes and Kelly built a non-cooperative Stackelberg game model with transmission capacity as the core variable. The study pointed out that price management and mandatory measures should be implemented in combination with incentive measures; otherwise, the enthusiasm for power purchase would be affected [58]. Du et al. [59] constructed potential cooperative relationships in the microgrid with the goal of profit maximisation, and showed that cost allocation in the cooperative game could ensure the fairness of cost-sharing among participants. Contreras, through the construction of a power system game relationship, analysed the cost transaction to transaction method and proposed that cooperation could solve the conflict relationship [60]. Geerli constructed a non-cooperative game market model and pointed out that effective competition means is an effective way of balancing the cost management of the power system [61]. Hariyanto analysed decentralised and centralised power generation transmission modes through the method of game theory, and pointed out that cooperative decision-making should be carried out in competition [62]. Serrano extends the cooperative game by considering hydrological scenarios based on a static game model, pointing to an extended system of agents and efferent that favour deregulation schemes [63].
In summary, there are more technical aspects of how to promote the development of power system technology, cost sharing [46], benefit sharing and planning of transmission systems in the past. Demand-side reform of the power system requires not only effective technical support but also effective collaboration among the main participants in the system to achieve the optimal goal of demand-side reform of the power system. However, at present, there is less research on multi-stakeholder subjects, and existing studies only consider cost-sharing and benefit-sharing between two parties. This study constructs a demand-side reform behavioural strategy among the government, power companies and VPPs in a dynamic and multi-faceted way. This study amplifies the power systems’ research, provides rich insights to promote the demand response of the power systems, and gives suggestions for the dynamic behavioural management of the various actors involved in the system.
Through the above problem analysis and research review, we find that game theory provides an effective solution to solve the power system demand response, and provides an effective basis for adjusting the government, power grid companies and the VPP dynamic demand response. However, there are still a series of problems, such as the partial participation of current research subjects, the static behaviour of most policies, and the lack of dynamic change response mechanism. In order to remedy these problems, this study takes dynamic games as the basis and comprehensively considers the dynamic response and feedback behaviour of government, power grid company and VPP multi-parties.

3. Modeling Approach

3.1. Basic Description and Modeling Settings

3.1.1. Basic Description

There are three parties involved in the power system reform focused on the demand side: government, power companies and VPPs. They are all logical decision-makers who operate in the economy within certain boundaries of reason. Due to the different interests of the participants, in the case of information asymmetry, all parties are pursuing the maximisation of personal interests, and they need to dynamically adjust their behavioural strategies according to the other side, to achieve long-term dynamic maximisation and balance of interests. Based on this, we constructed a tripartite game relationship for demand-side reform of the power system:
(1)
Government departments. In order to promote the demand-side reform of the power system, the government has active management and negative management strategies. To promote the demand-side reform, the government provides subsidies to the power companies actively participating in the demand-side reform and the participating VPPs who choose to dynamically adjust the electricity price, and at the same time spends relevant costs to supervise the power behaviour of the power companies and VPPs. Promoting power demand-side reform can save power resources, rationally adjust industrial structure, optimise resource allocation, improve and protect the environment, effectively raise social and environmental benefits and enhance the credibility of the government. The set of government’s behavioural strategies is {Active management G 1 , Negative management G 2 }, and their selection probabilities are { x and 1 x }, respectively.
(2)
Power companies. Positive participation in the demand-side reform can reduce the pressure on the power company, improve the stability of the power system, and ensure the stability of the market electricity price. The reform of the demand side can effectively reduce the pressure on the supply side of the grid company, transfer some risks to VPPs and obtain more power regulation autonomy and reduce the restrictions of the power generation company. Power grid companies actively participate in demand-side reform, and can dynamically adjust electricity consumption at any time, adjust different prices according to different periods of electricity use, and save power costs. The power companies’ actions include optimising electricity purchasing patterns, implementing different electricity prices and guiding and assisting VPPs to understand effective dynamic electricity consumption behaviours. The demand-side reform behaviour of power companies can obtain corporate reputation, reduce the risk of price fluctuation in the electricity market and obtain additional income utility. Take power companies’ behavioural strategies as {Positive participation P 1 , Passive participation P 2 } and their probabilities as { y and 1 y }.
(3)
VPPs. VPPs can choose to actively participate in or passively resist demand-side reform. If VPPs choose to actively participate and adjust their electricity consumption according to the peak electricity consumption in the electricity market, it will bring a certain impact on their personal lives and affect the convenience of VPPs. However, the active participation of VPPs will save VPP electricity costs, and bring more social benefits and economic value. Take VPP’s behavioural strategies as {Participation S 1 , Nonparticipation S 2 } with probabilities as { z and 1 z }.

3.1.2. Modeling Settings

Based on the above assumptions, in order to explore the benefits and costs of the three parties in the power system, we draw relationships between the participants’ behaviour in the power systems’ demand response in Figure 1 and set the relevant parameters of the model as shown in Table 1.
As shown in Figure 1, there are three stakeholders: the government, the power company and VPPs. The government’s behavioural strategies are {Active management, Negative management}, and their selection probabilities are { x and 1 x }, respectively. The government’s policy cost is C g and initial benefits are P g when the government chooses strategy and uses penalties ( F p ) and incentives ( R p ) for power companies, and uses subsidies ( R s ) for VPPs. Power companies’ behavioural strategies are {Positive participation P 1 , Passive participation P 2 } and their probabilities are { y and 1 y }. The initial benefits of power companies are P p and the initial costs are C p when choosing strategy ( P 2 ). VPP’s behavioural strategies are as {Participation S 1 , Nonparticipation S 2 } with probabilities as { z and 1 z }. VPP’s initial benefit is P s and initial cost strategies are C s when VPPs choose strategy ( S 2 ).
In order to ensure the improvement of the power systems’ demand side, for the active participation behaviour of the participants in the power system the subsidies are greater than the costs, and the benefits of the participation behaviour are greater than the benefits of the non-participation behaviour; for this, hypothesis R s > C s 1 ,   P p 2 > P p 1 ,   P s < P s 2 exists. According to the model variables, it is known that P s 1 C s 1 > 0 ,   P s 2 C s 1 > 0 , P p 1 C p 1 > 0 ,   P p 2 C p 1 > 0 exists. Table 2 shows the game matrix of the government, power companies and VPPs.
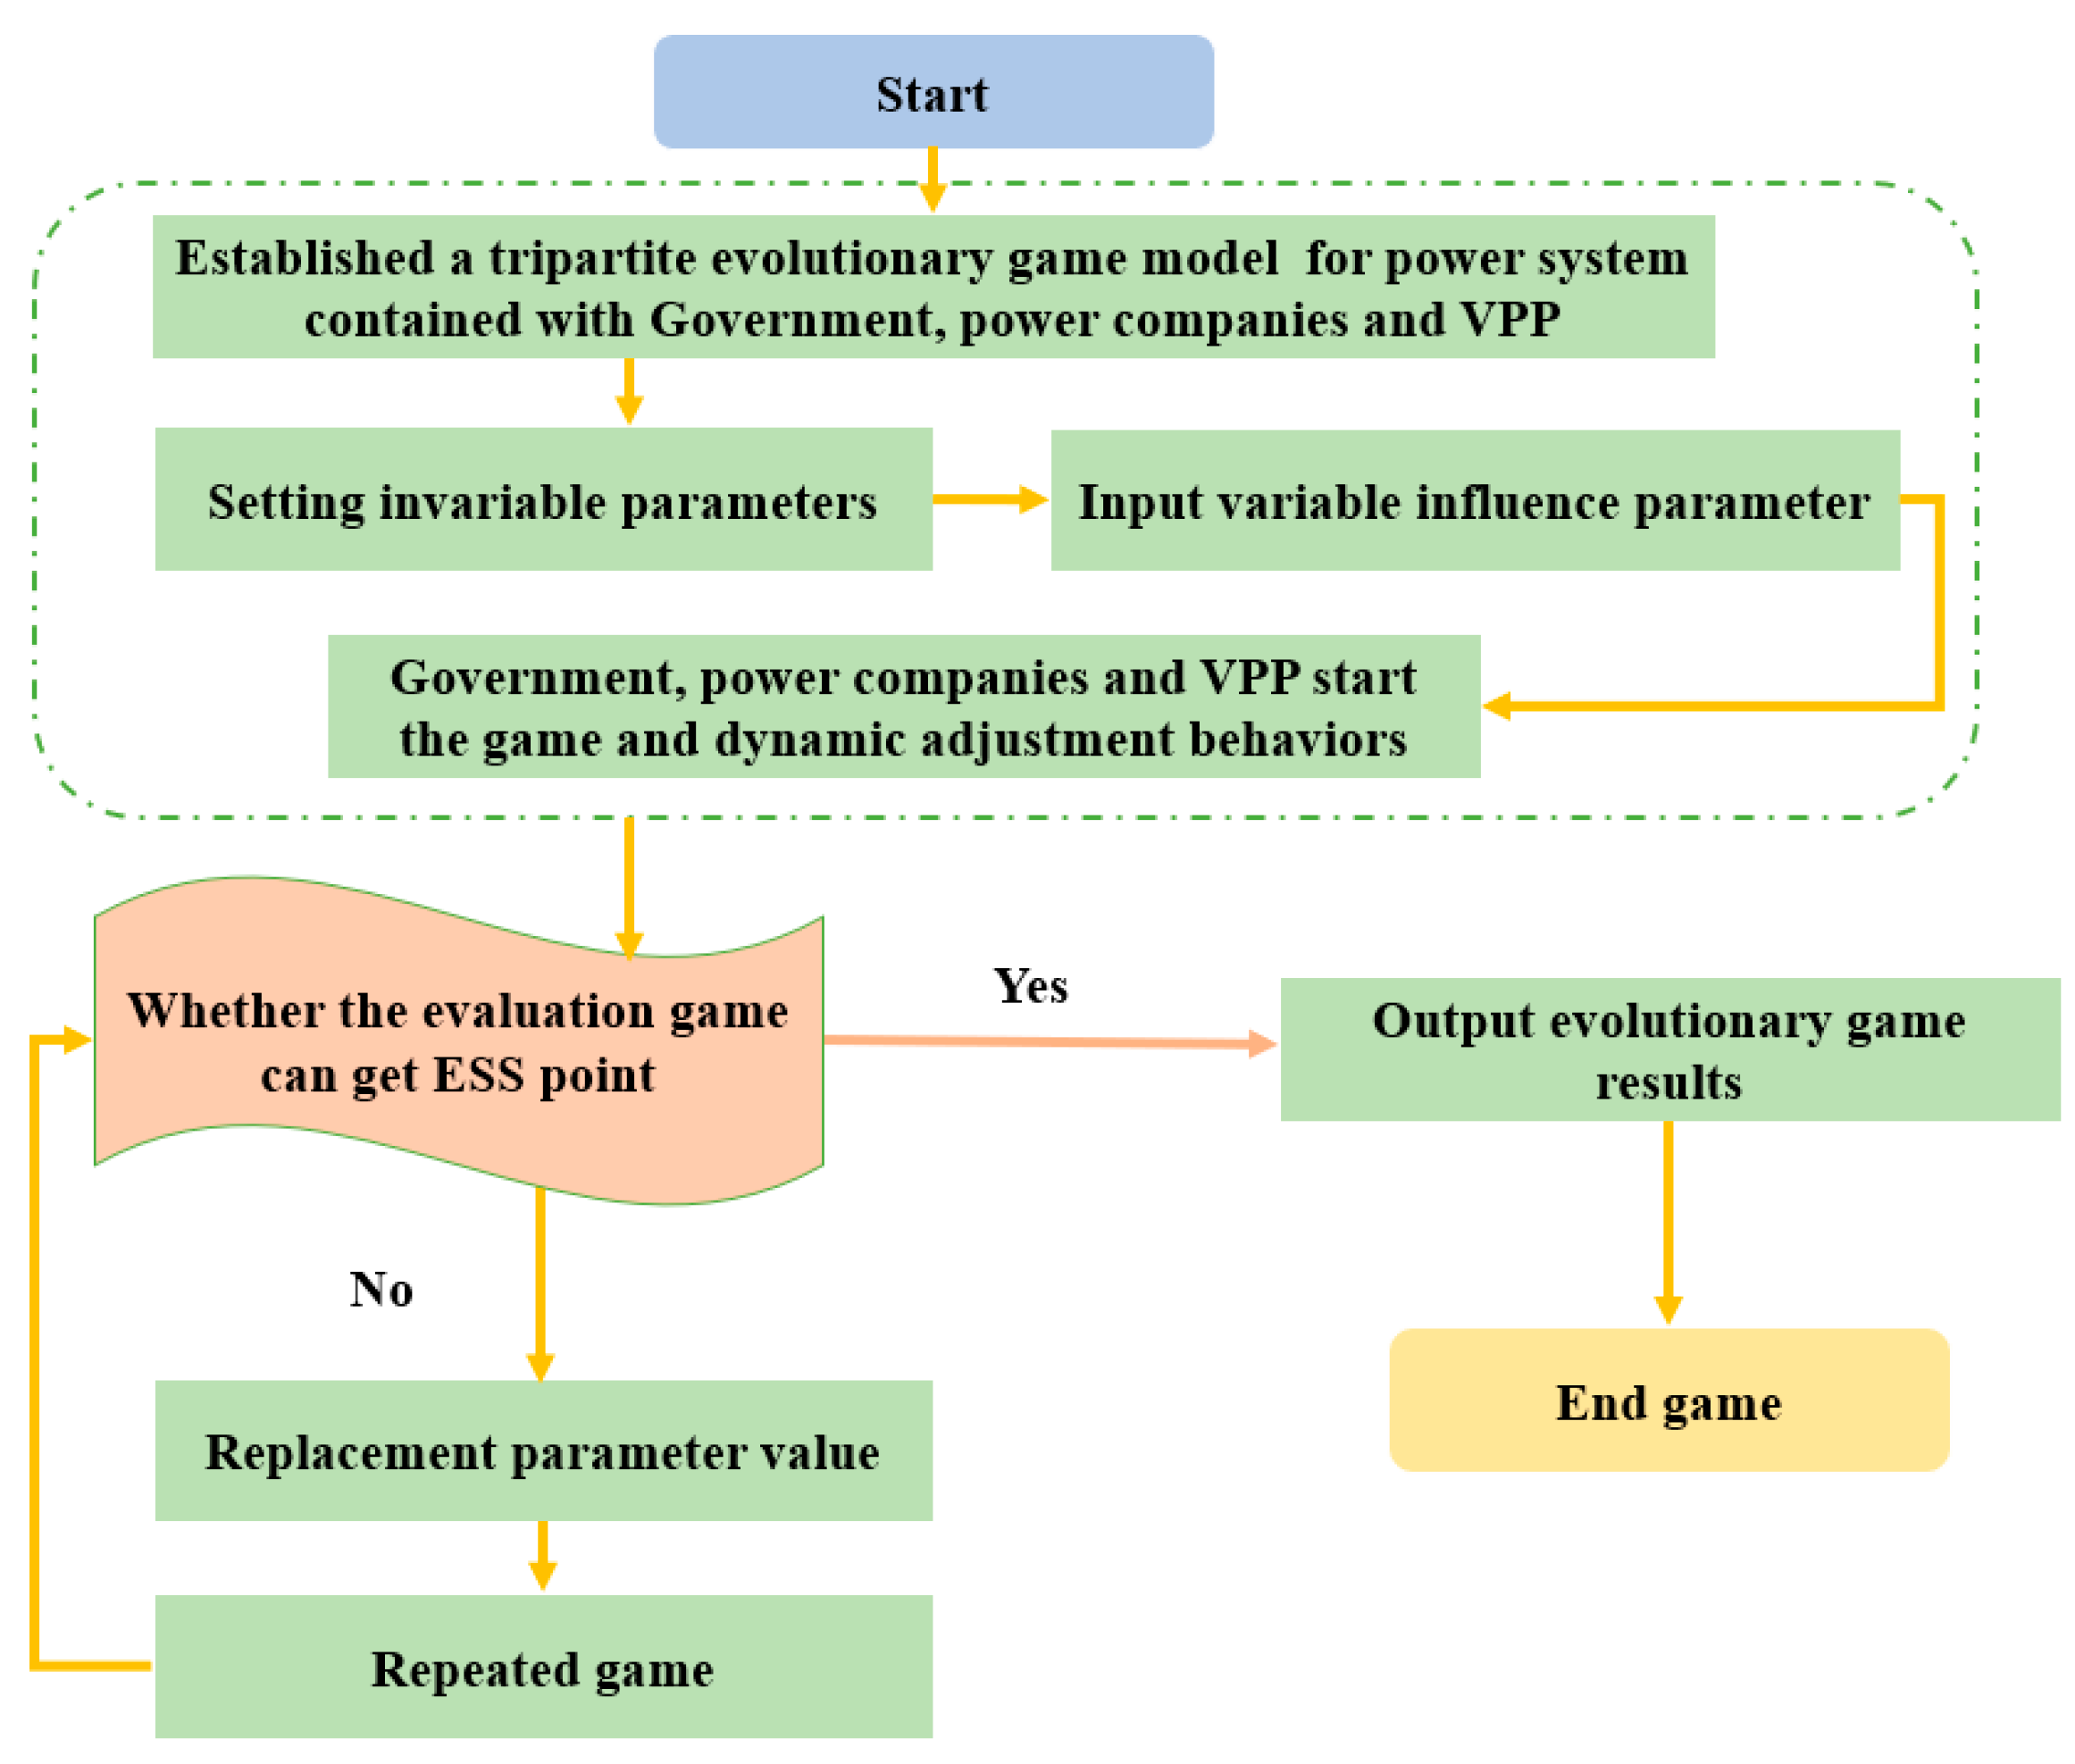
Accordng to evolutionary game theory [38,64], we followed the flowchart in Figure 2 to conduct the tripartite evolutionary game model for the power system contained with the government, power companies and VPPs.

3.2. A Dynamic Replication Equation for a Three-Part Evolutionary Game

U G 1 and U G 2 represent the government regulation of demand-side reform of electricity in the situation of active and negative behaviour; these are shown as:
U G 1 = [ y z ( P g + P g 1 + P g 2 C g C g 1 R p R s ) + ( 1 y ) z ( P g + F p C g C g 1 R s ) + y ( 1 z ) ( P g + P g 2 C g C g 1 R p ) + ( 1 y ) ( 1 z ) ( P g + F p C g C g 1 ) ]
U G 2 = [ y z ( P g + P g 1 C g R s ) + ( 1 y ) z ( P g C g R s ) + y ( 1 z ) ( P g + P g 2 C g ) + ( 1 y ) ( 1 z ) ( P s C g ) ]
The average utility of government is formed as:
U G ¯ = x U G 1 + ( 1 x ) U G 2
The dynamic replication equation for the choice of government demand-side reform behavioural strategy is:
F ( x ) = d x d t = x ( U G 1 U G ¯ ) = x ( 1 x ) ( U G 1 U G 2 ) = x ( 1 x ) [ y z ( P g 2 C g 1 R p ) + ( 1 y ) z ( F p C g 1 ) + y ( 1 z ) ( C g 1 R p ) + ( 1 y ) ( 1 z ) ( C g 1 ) ] = x ( 1 x ) ( y z P g 2 y R p y F p + F p C g 1 )
U P 1 and U P 2 are active and passive participation by the power companies, respectively, which are:
U p 1 = x z ( P p + P p 2 C p C p 1 + R p ) + ( 1 x ) z ( P p + P p 2 C p C p 1 ) + x ( 1 z ) ( P p + P p 1 C p C p 1 + R p ) + ( 1 x ) ( 1 z ) ( P p + P p 1 C p C p 1 )
U p 2 = x z ( P p C p F l F p ) + ( 1 x ) z ( P p C p F l ) + x ( 1 z ) ( P p C p F l F p ) + ( 1 x ) ( 1 z ) ( P p C p F l )
The average utility of the power companies is:
U p ¯ = x U p 1 + ( 1 x ) U p 2
The dynamic replication equation for power companies’ participation in demand-side reform strategies is:
F ( y ) = d y d t = y ( U P 1 U P ¯ = y ( 1 y ) ( U P 1 U P 2 ) = y ( 1 y ) [ x z ( P p 2 C p 1 + R p + F p + F l ) + ( 1 x ) z ( P p 2 C p 1 + F l ) + x ( 1 z ) ( P p 1 C p 1 + R p + F p + F l ) + ( 1 x ) ( 1 z ) ( P p 1 C p 1 + F l ) ] = y ( 1 y ) ( x R p + x F p + z P p 2 + P p 1 C p 1 + F l z P p 1 )
U S 1 and U S 2 are VPPs choosing to participate and nonparticipation, respectively, which are:
U s 1 = x y ( P s + R s C s C s 1 + P s 1 ) + ( 1 x ) y ( P s + R s C s C s 1 + P s 2 ) + x ( 1 y ) ( P s + R s C s C s 1 + P s 1 ) + ( 1 x ) ( 1 y ) ( P s + R s C s C s 1 + P s 2 )
The average VPP utility is:
U s ¯ = x U s 1 + ( 1 x ) U s 2
Replication equations for VPP participation in demand-side reform dynamics:
F ( z ) = d z d t = z ( U S 1 U S ¯ ) = z ( 1 z ) ( U S 1 U S 2 ) = z ( 1 z ) [ x y ( R s C s 1 + P s 1 ) + ( 1 x ) y ( R s C s 1 + P s 2 ) + x ( 1 y ) ( R s C s 1 + P s 1 ) + ( 1 x ) ( 1 y ) ( R s C s 1 + P s 2 ) ] = z ( 1 z ) ( x P s 1 + x P s 2 + R s C s 1 + P s 2 )
Based on the stability principle of differential equations, by combining Equations (1)–(3), we can obtain the replicator dynamic formulas:
{ F ( x ) = x ( 1 x ) ( y z P g 2 y R p y F p + F p C g 1 ) = 0 F ( y ) = y ( 1 y ) ( x R p + x F p + z P p 2 + P p 1 C p 1 + F l z P p 1 ) = 0 F ( z ) = z ( 1 z ) ( x P s 1 x P s 2 + R s C s 1 + P s 2 ) = 0

3.3. Evolutionary Games’ Stability Analysis

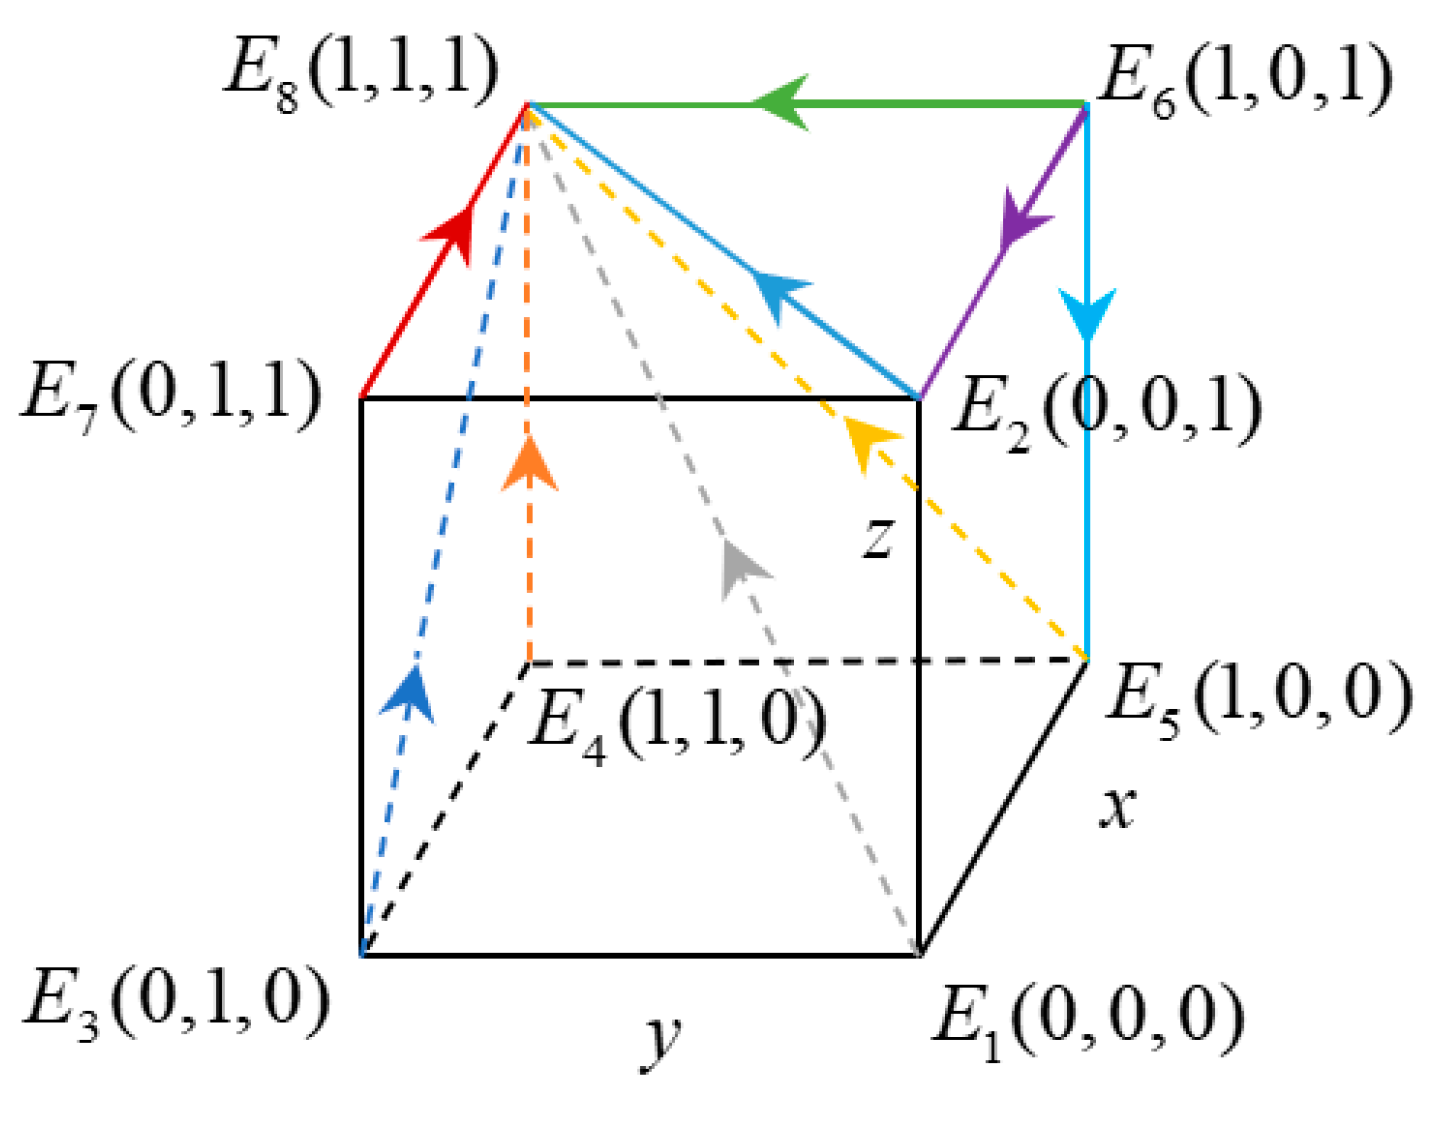
When F ( x ) = 0 ,   F ( y ) = 0 and F ( z ) = 0 , the equations can be solved together to give eight special equilibrium points: E 1 ( 0 , 0 , 0 ) , E 2 ( 1 , 0 , 0 ) , E 3 ( 0 , 1 , 0 ) , E 4 ( 1 , 1 , 0 ) , E 5 ( 1 , 1 , 0 ) , E 6 ( 1 , 0 , 1 ) , E 7 ( 0 , 1 , 1 ) and E 8 ( 1 , 1 , 1 ) . A mixed strategy equilibrium point that is E 9 ( x * , y * , z * ) also exists, where:
{ x * = C s 1 P s 2 P s ( P s 1 P s 2 ) y * = C g 1 F p z * P g 2 R p F p z * = ( P s 1 P s 2 ) ( C p 1 P p 1 F l ) ( C s 1 P s 2 R s ) ( R p + F p ) ( P s 1 P s 2 ) ( P p 2 P p 1 )

3.3.1. Government’s Stability Analysis

In this situation, we have F ( x ) = 0 and F ( x ) = F ( x ) / x < 0 .
Solve
{ F ( x ) = ( 1 2 x ) ( y z P g 2 y R p y F p C g 1 ) F ( x ) = 0 }
to obtain
x 1 = 0 ,   x 2 = 1 ,   y * = C g 1 F p z * P g 2 R p F p
(1)
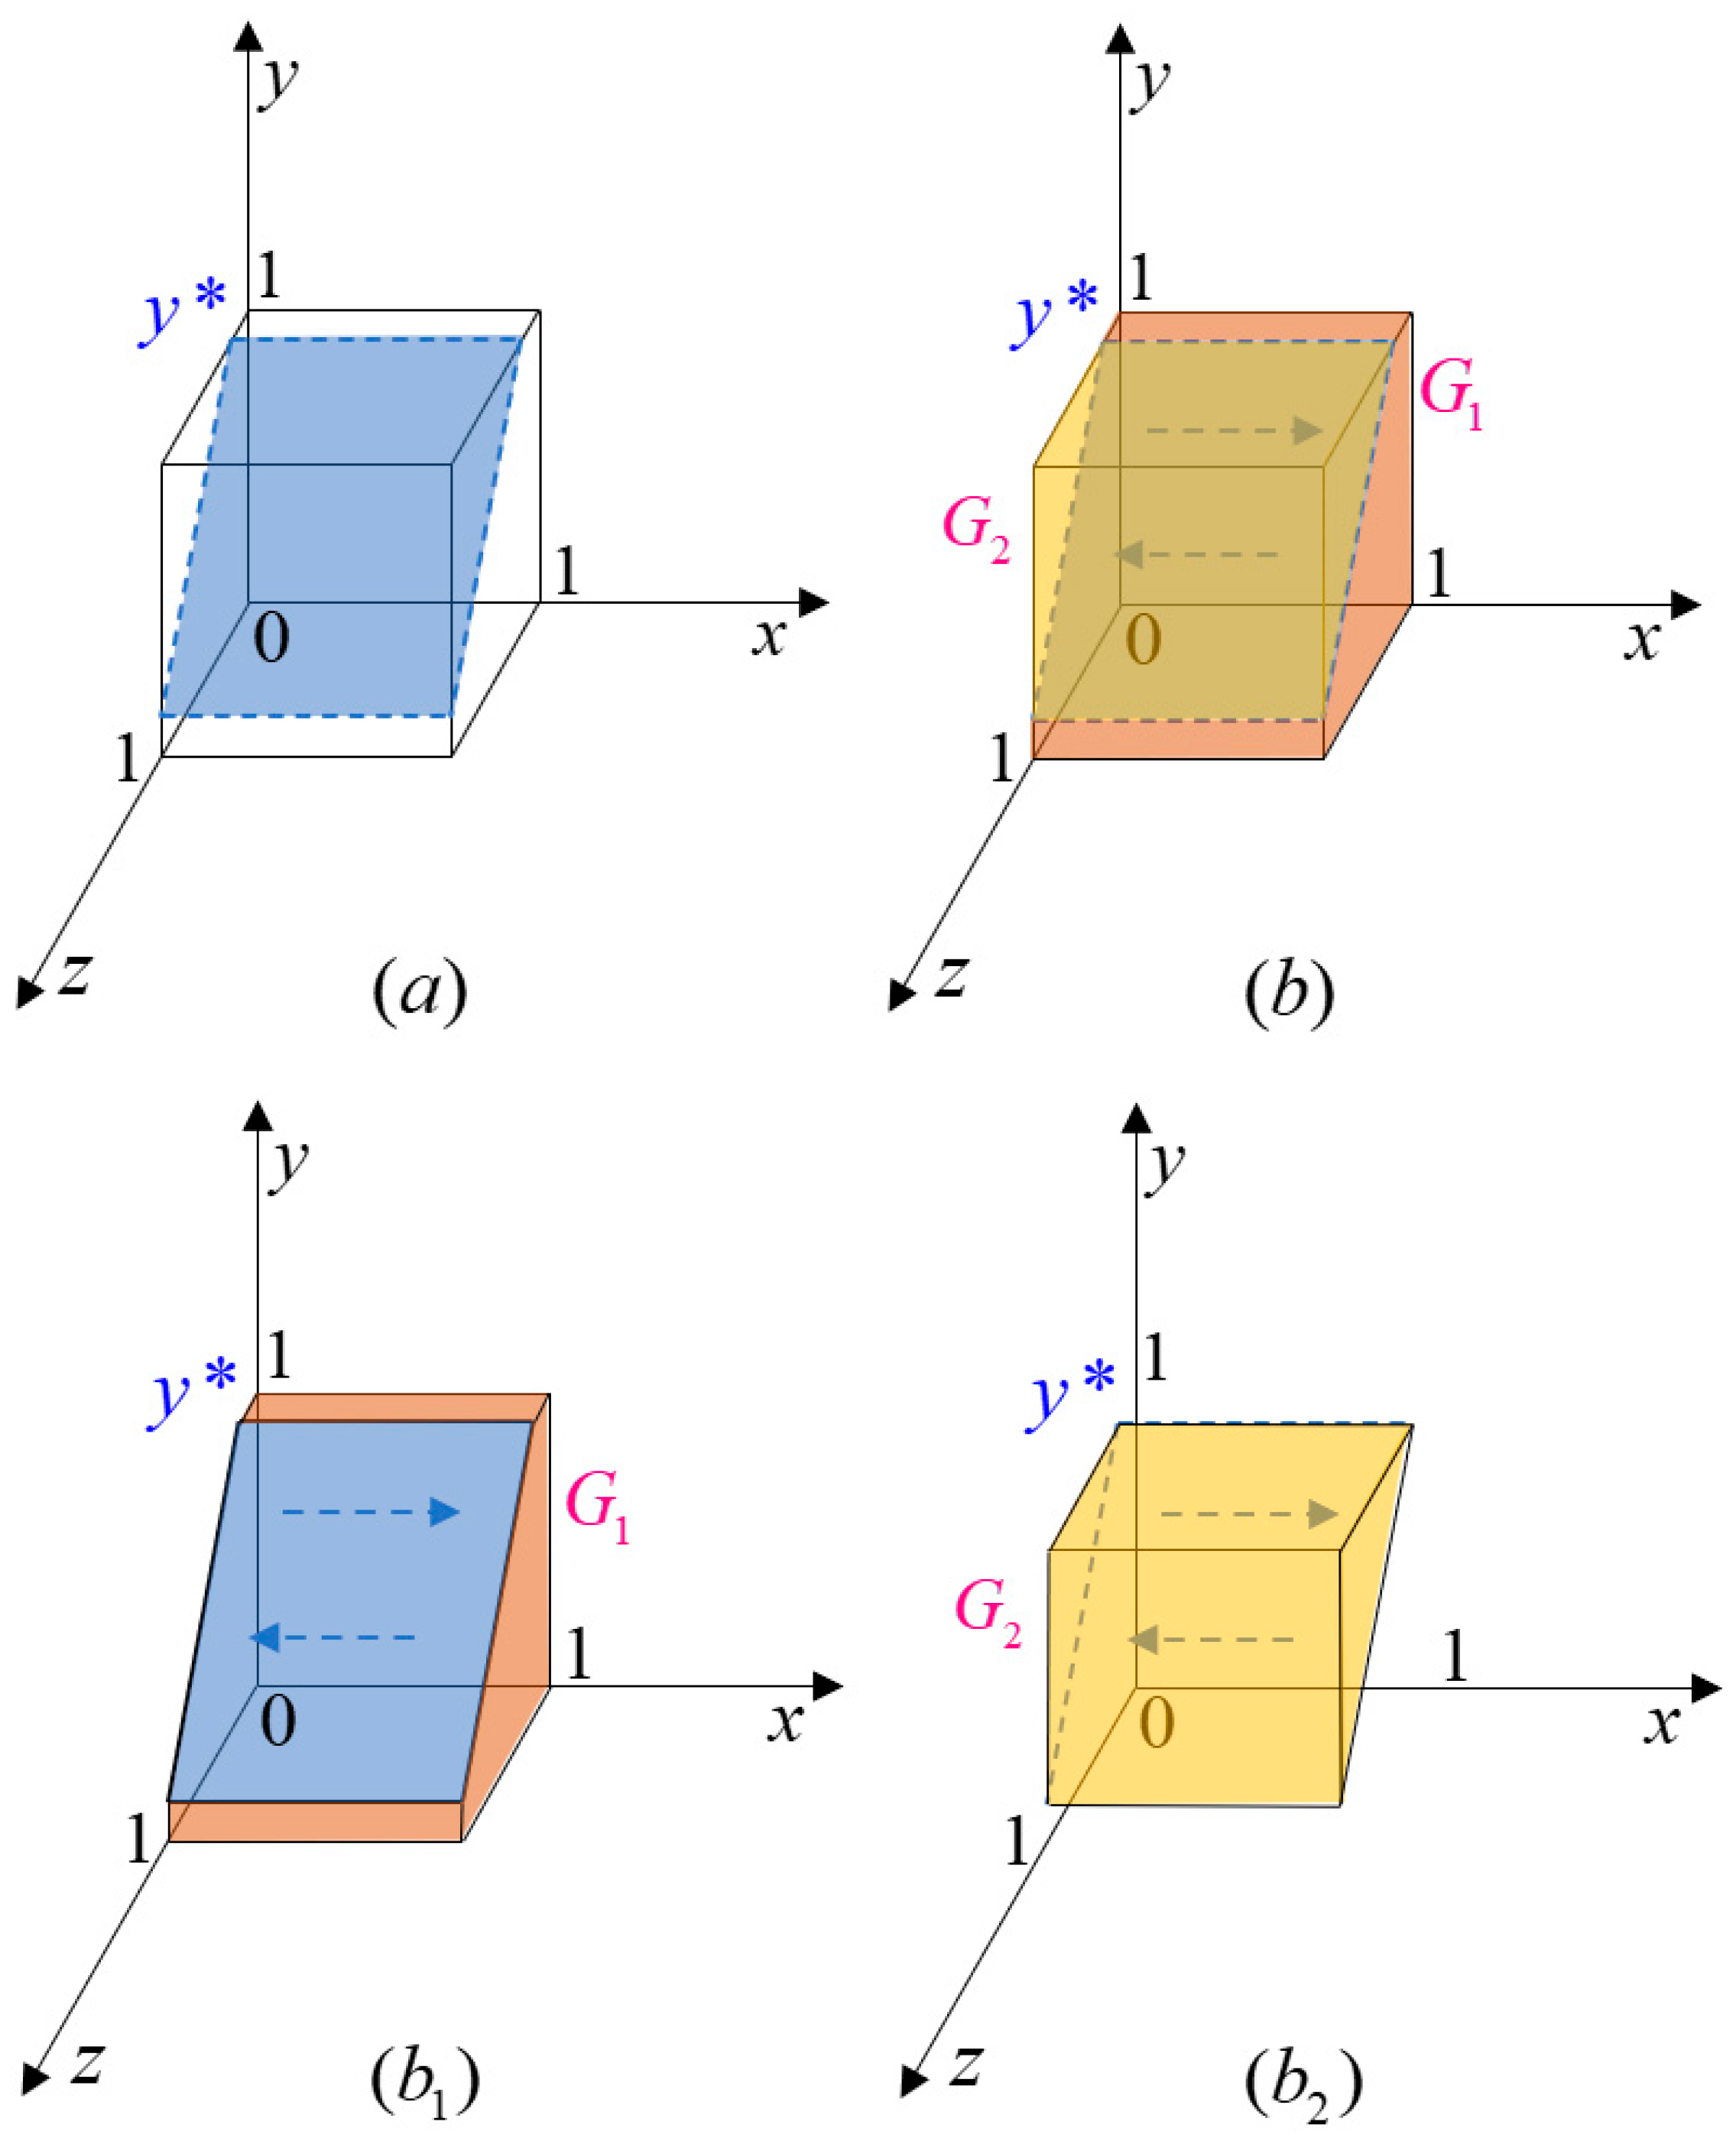
When y = y * , that is y z P g 2 y R p y F p + F p C g 1 = 0 , then y * = ( C g 1 F p ) / ( z * P g 2 R p F p ) , F ( x ) = 0 remains unchanged. As shown in Figure 3a, the government has been in a relatively stable strategic position.
(2)
When o < y < y * , that is y z P g 2 y R p y F p + F p C g 1 < 0 , we obtain y * < ( C g 1 F p ) / ( z * P g 2 R p F p ) . When F ( x ) = 0 , x , the presence of stability is x 1 = 0 and x 2 = 1 . If d ( F ( x ) ) / d x | x = 0 < 0 , d ( F ( x ) ) / d x | x = 1 > 0 . At this point, 1 is ESS, as shown in Figure 3b. At this point, the government will be inclined to take unregulated measures due to the high cost of managing electricity demand-side reforms.
(3)
When 1 > y > y * , y z P g 2 y R p y F p + F p C g 1 > 0 , that is y * > ( C g 1 F p ) / ( C g 1 F p ) . If F ( x ) = 0 , x 1 = 0 and x 2 = 1 are the two stable points. If d ( F ( x ) ) / d x | x = 0 > 0 , d ( F ( x ) ) / d x | x = 1 < 0 , at this point x 2 = 1 is ESS and the government takes an active management attitude in order to maximise the benefits. Since there exists y z P g 2 y R p y F p + F p C g 1 = 0 , that is y > y * z > z * , F ( x ) | x = 0 < 0 , F ( x ) = 0 , then x = 0 is ESS, and conversely, x = 1 is ESS. This indicates that, as y , z gradually increases government’s stabilisation strategy will shift from active to passive regulation.
(4)
The probability of positive government behaviour for demand-side reform in Figure 3(b1,b2) is V G 1 and negative management behaviour is V G 2 , where V G 2 = 1 V G 1 , V G 1 = 0 1 0 1 C g 1 F p z * P g 2 R p F p d z d x = C g 1 F p z * P g 2 R p F p and the presence of V G 1 C g 1 < 0 ,   V G 1 R p < 0 ,   V G 1 F p > 0 means that the probability of positive government behaviour for demand-side reform is negatively related to C g 1 and R p and positively related to F p . This suggests that the motivation of government departments to proactively engage in demand-side reform in the electricity sector can be promoted at this time by increasing the government’s cost of reducing government management efforts C g 1 , reducing the amount of subsidies to power companies R p and increasing the benefits of punitive measures F p .

3.3.2. Power Companies’ Stability Analysis

y is the point at which the evolution of the replication kinetic equations is stable at the conditions of F ( y ) = 0 , F ( y ) = F ( y ) / y < 0 .
When
{ F ( y ) = ( 1 2 y ) ( x R p + x F p + z P p 2 + P p 1 C p 1 + F l z P p 1 ) F ( y ) = 0 }
then
y 1 = 0 ,   y 2 = 1 ,   z * = ( P s 1 P s 2 ) ( C p 1 P p 1 F l ) ( C s 1 P s 2 R s ) ( R p + F p ) ( P s 1 P s 2 ) ( P p 2 P p 1 )
(1)
If x = x * , that is x R p + x F p + z P p 2 + P p 1 C p 1 + F l z P p 1 = 0 , and y = z * , F ( y ) = 0 remain constant. Figure 4a indicates that the power company is at a relatively stable state.
(2)
If x < x * < 0 , x R p + x F p + z P p 2 + P p 1 C p 1 + F l z P p 1 < 0 , there is y > z * . When F ( y ) = 0 , we can obtain y = 0 and y = 1 . If d ( F ( y ) ) / d y | x = 0 < 0 , d ( F ( y ) ) / d y | x = 1 > 0 , then y 1 = 0 is ESS. Figure 4b indicates that the benefits of demand-side reform by the power company are less than the costs, and tend to participate negatively.
(3)
If 1 > x > x * , x R p + x F p + z P p 2 + P p 1 C p 1 + F l z P p 1 > 0 , there is y < z * . When F ( y ) = 0 , we can obtain y = 0 and y = 1 . If d ( F ( y ) ) / d y | x = 0 > 0 , d ( F ( y ) ) / d y | x = 1 < 0 , then y 2 = 1 is ESS. Figure 4b indicates that the demand-side reform of the power company brings additional benefits, and the power company is in an active participation state. If x > x * , z > z * and F ( y ) | y = 0 < 0 , F ( y ) = 0 , the ESS are y = 0 and y = 1 . Therefore, with the gradual increase of 5, the behavioural strategy of grid company’s demand-side reform shifts from active to passive, and the probability of the power companies’ demand-side reform behaviour gradually decreases with the active government and consumer demand-side reform.
(4)
As can be seen in Figure 4(b1,b2), the probability of the grid companies’ active participation in demand-side reform can be expressed as V P 1 ; the probability of power companies’ negative participation in demand reform is V P 2 , where V p 2 = 1 V p 1 , V p 1 = 0 1 0 1 ( P s 1 P s 2 ) ( C p 1 P p 1 F l ) ( C s 1 P s 2 R s ) ( R p + F p ) ( P s 1 P s 2 ) ( P p 2 P p 1 ) d z d y = ( P s 1 P s 2 ) ( C p 1 P p 1 F l ) ( C s 1 P s 2 R s ) ( R p + F p ) ( P s 1 P s 2 ) ( P p 2 P p 1 ) , exists V p 1 C p 1 < 0 ,   V p 1 R s < 0 ,   V p 1 F l > 0 , which indicates that by reducing the cost of power companies choosing demand-side reform C P 1 , government incentives for power companies active demand-side reform R s , and the increase in opportunity cost F l all increase the power companies’ active demand-side-reform probability.

3.3.3. VPP’s Stability Analysis

If F ( z ) = 0 , F ( z ) = F ( z ) z < 0 ,
there are { F ( z ) = ( 1 2 z ) ( x P s 1 x P s 2 + R s C s 1 + P s 2 ) F ( z ) = 0 }
leads to z 1 = 0 ,   z 2 = 1 ,   x * = C s 1 P s 2 P s ( P s 1 P s 2 )
(1)
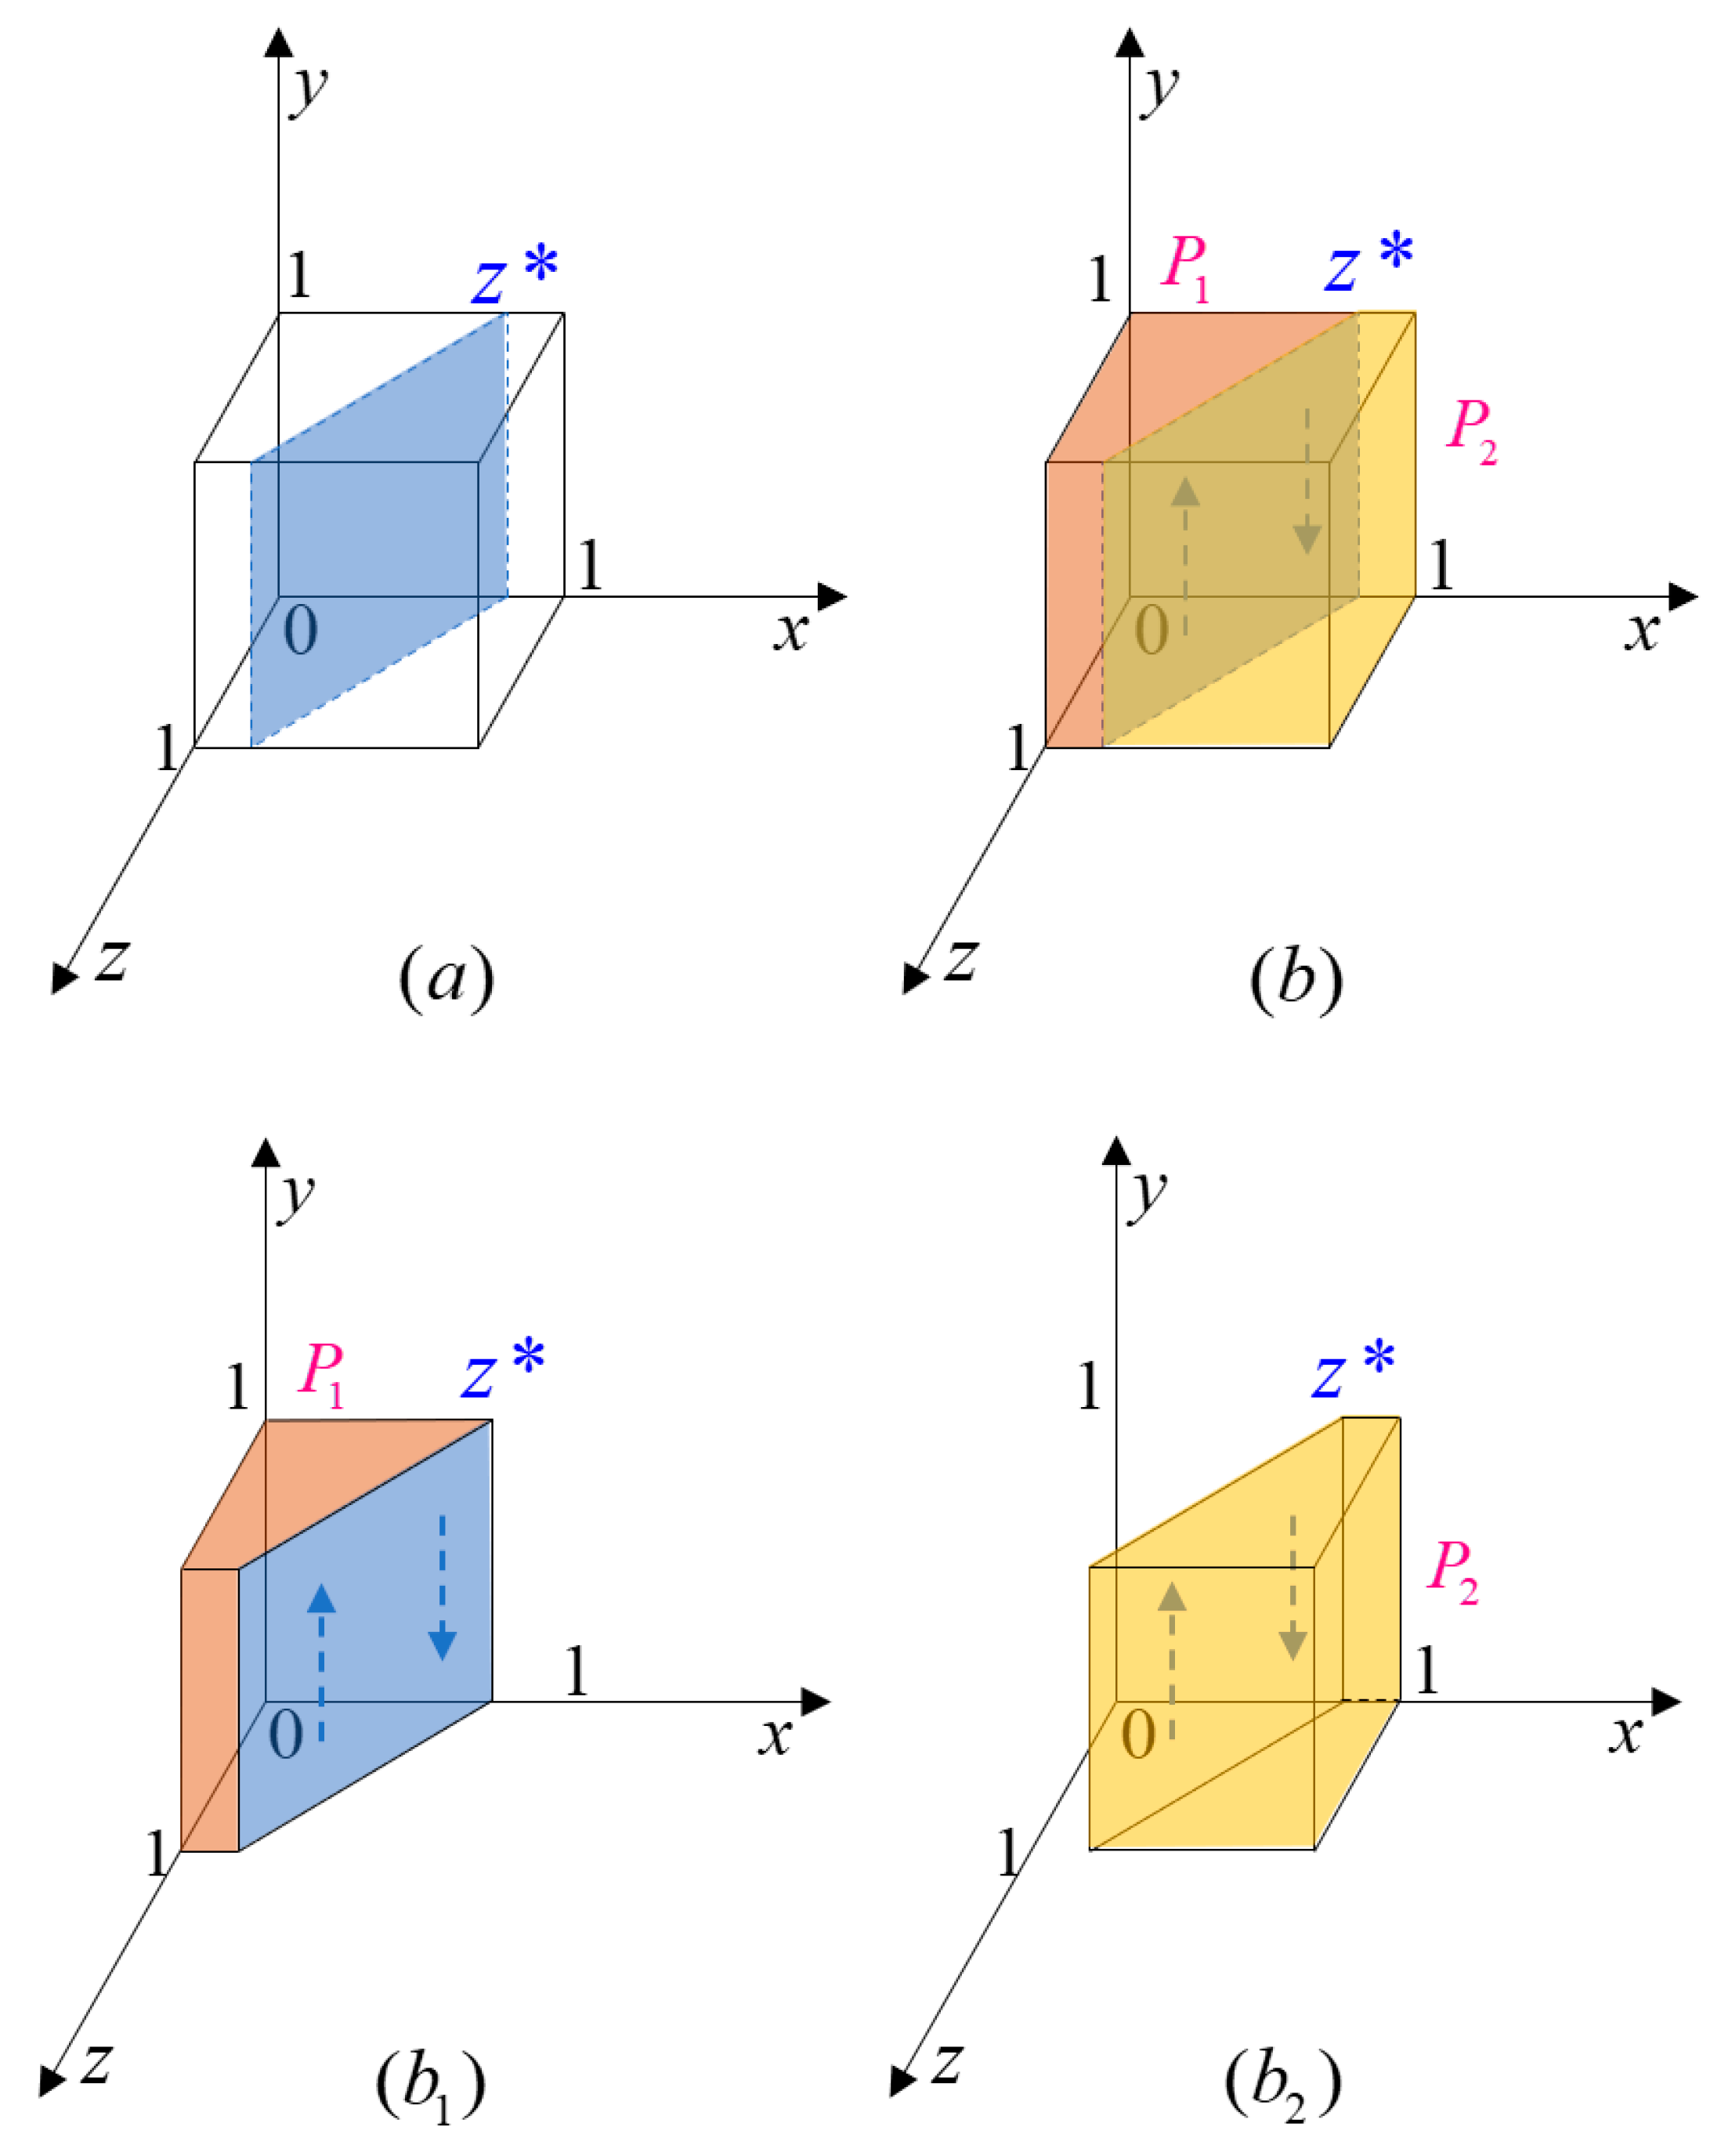
If x P s 1 x P s 2 + R s C s 1 + P s 2 = 0 , then z = x * , F ( z ) = 0 remains unchanged. Figure 5a indicates that the VPPs are in a stable situation.
(2)
If x P s 1 x P s 2 + R s C s 1 + P s 2 = 0 , then z > x * . If F ( z ) = 0 , then z 1 = 0 and z 2 = 1 . If d ( F ( z ) ) / d z | z = 0 < 0 , d ( F ( z ) ) / d z | z = 1 > 0 , then z 1 = 0 . Figure 5b indicates that, the benefits obtained by VPPs actively participating in the demand-side reform of electricity are smaller than the costs, and they are in a state of reluctance to participate in the electricity demand-side reform.
(3)
If x P s 1 x P s 2 + R s C s 1 + P s 2 > 0 , there is z < x * . If F ( z ) = 0 , there are z 1 = 0 and z 2 = 1 . If d ( F ( z ) ) / d z | z = 0 > 0 , d ( F ( z ) ) / d z | z = 1 < 0 , there is z 2 = 1 . Figure 5b indicates that VPPs gain additional benefits by participating in the electricity demand-side reform behaviour, and VPPs are in the state of active participation behaviour.
(4)
In Figure 5(b1,b2), the probability of VPP’s electricity demand-side reform is V S 1 , V S 2 , where V s 2 = 1 V s 1 , V s 1 = 0 1 0 1 C s 1 P s 2 P s ( P s 1 P s 2 ) d y d z = C s 1 P s 2 P s ( P s 1 P s 2 ) , and V s 1 C s 1 < 0 . VPP’s motivation can be increased by reducing the cost of participation in VPP’s electricity demand-side reform behaviour C s 1 .

3.3.4. Power Systems’ Stability Analysis

According to the basic theory of replicated dynamic equations, E 9 ( x * , y * , z * ) is a mixed solution of the power demand-response system, but not ESS [65,66]. Only eight pure strategy equilibrium points exist within the system [64]. Equations (4) and (5) can be calculated along with the system Jacobi matrix in order to obtain the eigenvalues shown in Table 3.
J = ( F ( x ) x F ( x ) y F ( x ) z F ( y ) x F ( y ) y F ( y ) z F ( z ) x F ( z ) y F ( z ) z ) = ( F 11 F 12 F 13 F 21 F 22 F 23 F 31 F 32 F 33 )
J = ( λ 1 0 0 0 λ 2 0 0 0 λ 3 )
The need for the system to remain stable when the interests of all parties are satisfied is analysed simply and without loss of generality. According to the equilibrium point analysis of the Jacobi matrix, it is difficult to determine the behavioural trends of the two scenarios E7 (0, 1, 1) and E8 (1, 1, 1). Due to the complexity of the model parameters, the stability of this evolutionary game is discussed below in two scenarios.
(1)
Scenario 1: P g 2 R p C g 1 < 0
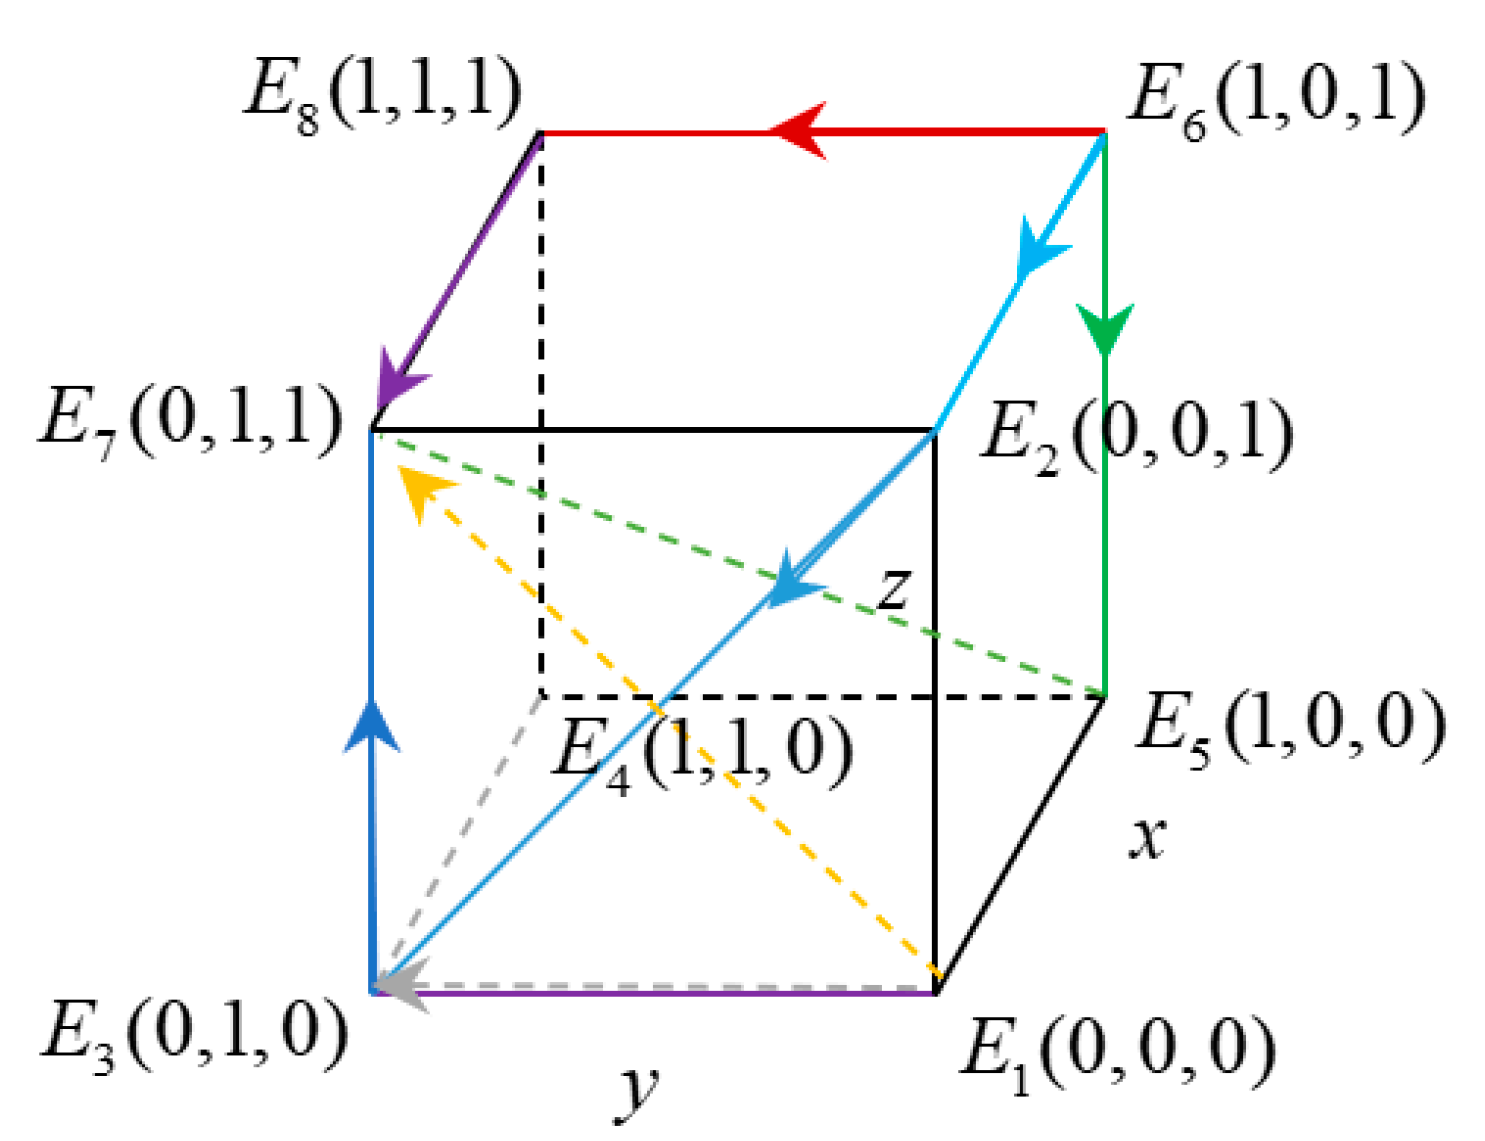
For power companies, P p 2 + C p 1 F l < 0 and P p 2 C p 1 > 0 exists when the opportunity cost of passive participation in demand-side reform decreases for power companies, and negative participation in demand-side reform leads to lower market shares and competitiveness. Power companies tend to actively participate in demand-side reform behaviour. For VPPs, R s + C s 1 P s 2 < 0 and P s 2 C s 1 > 0 exist when the government’s subsidy for VPPs to actively participate in demand-side reform behaviour is greater than the cost, and VPPs tend to actively participate in the state. For the government, P g 2 R p C g 1 < 0 exists. At this time, as both power companies and VPPs tend towards demand-side reform, whereas the government department is in a state where the cost of subsidies and regulation is too high, resulting in the government preferring to negatively promote the state, the system tends towards E 7 ( 0 , 1 , 1 ) , which can be seen in Figure 6. The situation {negative management, positive participation, participation} is the stable condition for the power demand-response system.
(2)
Scenario 2: P g 2 + R p + C g 1 < 0
For power companies, C p 1 R p F p P p 2 F l < 0 , R p > 0 ,   F p > 0 ,   F l > 0 , at this point P p 2 C p 1 > 0 , the cost of actively choosing demand-side reforms is less than the incremental benefit. For VPPs, P s 1 R s + C s 1 < 0 , R s > 0 , at this point P s 1 C s 1 > 0 , the cost of actively choosing demand-side reforms is less than the incremental benefit. The system tends to E 8 ( 1 , 1 , 1 ) in Figure 7. Situation {active management, positive participation, nonparticipation} is the stable condition of the power demand-response system. For the government, the revenue from active demand-side reform of power companies and VPPs is greater than the sum of subsidies and regulatory costs, and the government tends to actively manage the reform.

4. Numerical Simulation

In order to observe the three-party dynamic evolution path of power system intuitively, we assign the system parameters. The parameters are based on the basic assumptions and conditions of the model, and combined with the basic situation of China’s power industry, the subsidy policies of the power system are analysed, major expert managers such as the State Grid Power Company are investigated, the operation rules of the power auxiliary service market are queried and the relevant data of the power industry are combined. Finally, the basic data in Table 4 are obtained after interviews and consultations, data collection and repeated modification.

4.1. Initial Strategy Dynamic Evolutionary Trajectory

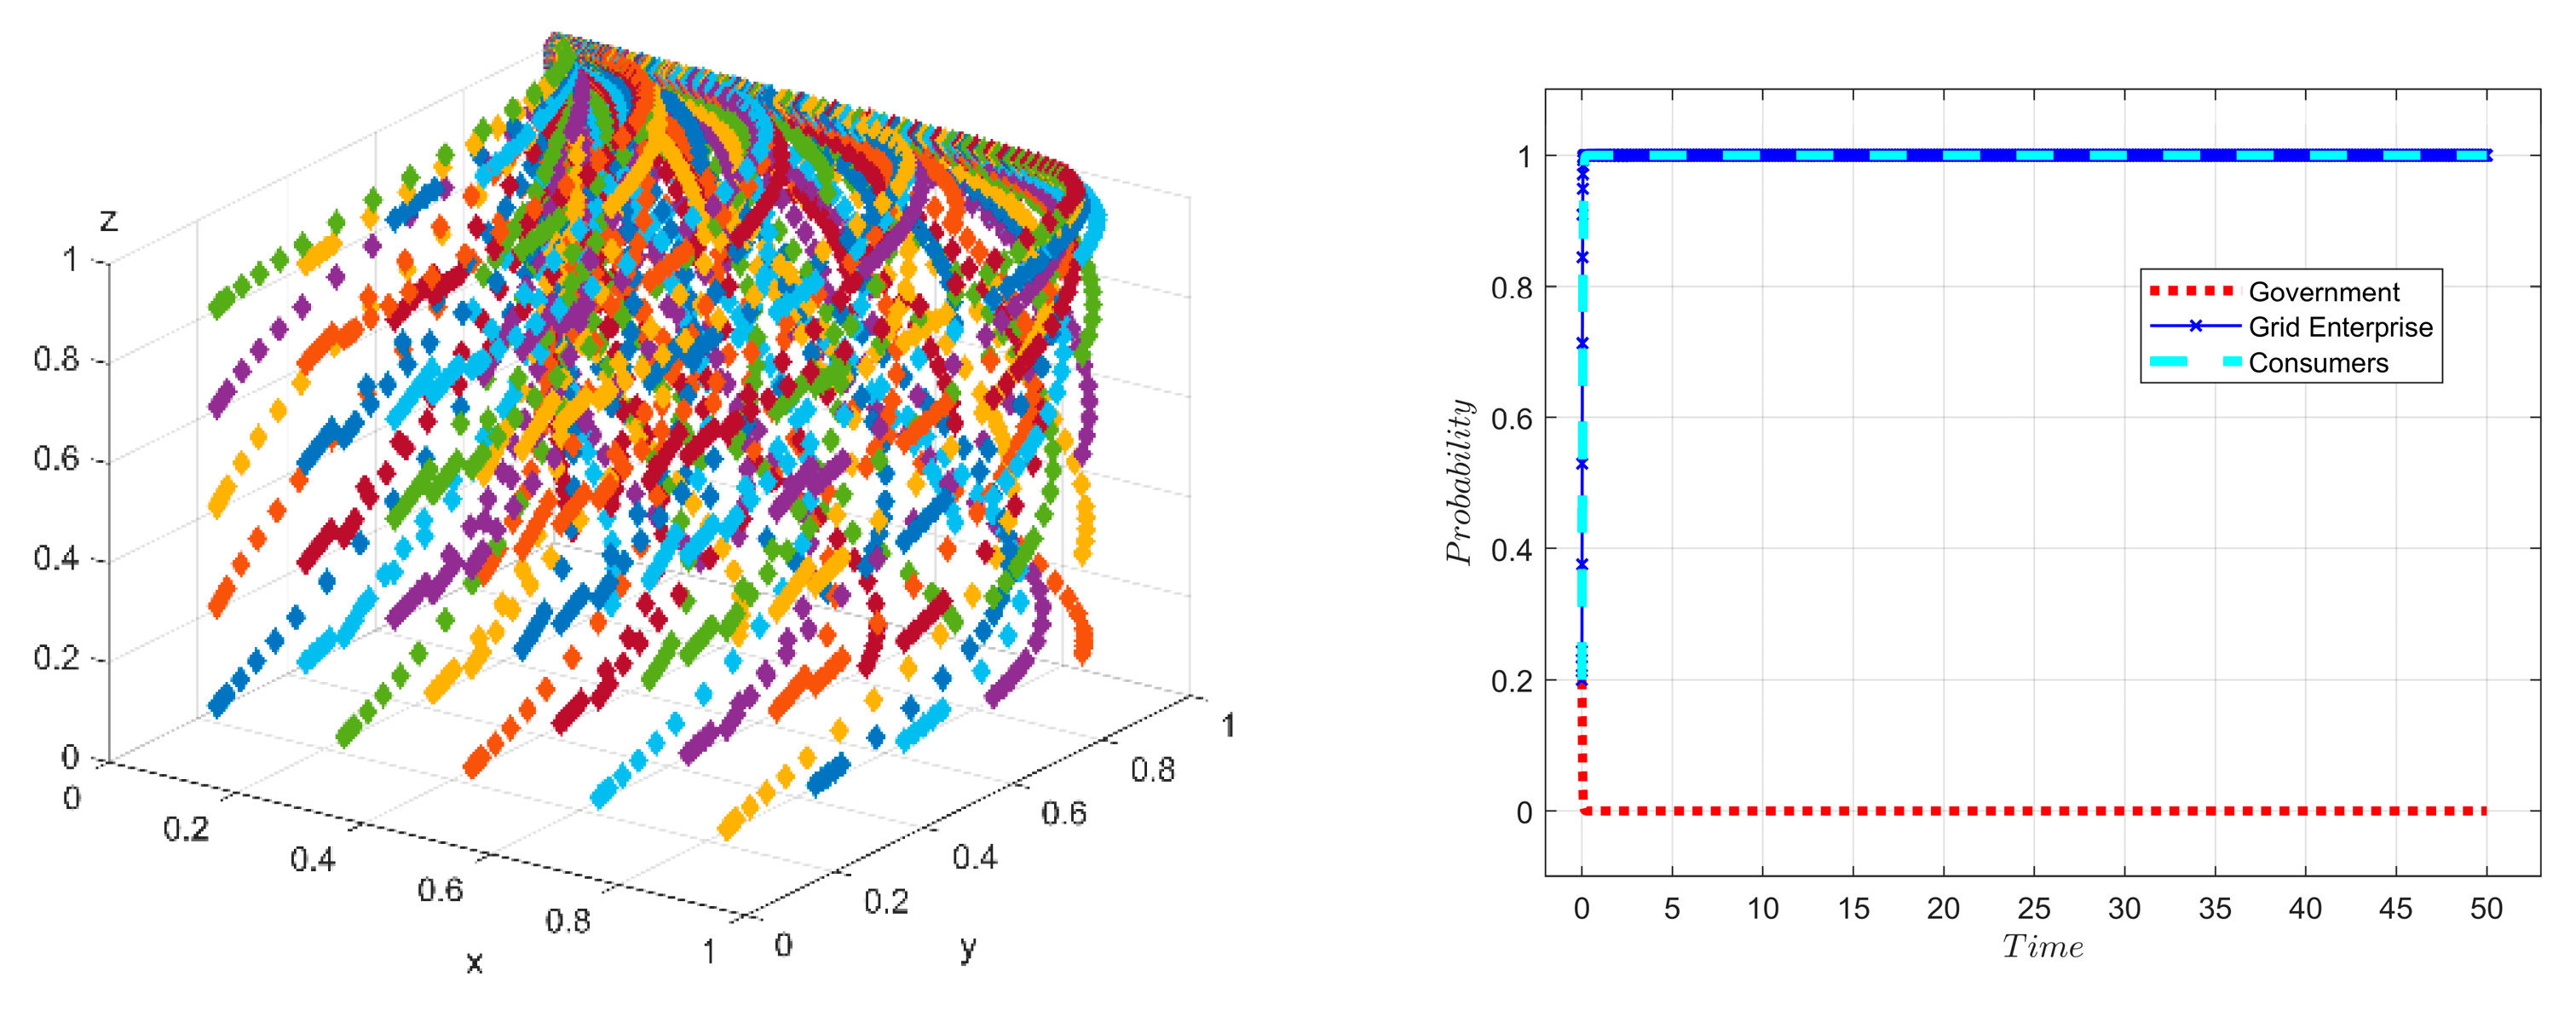
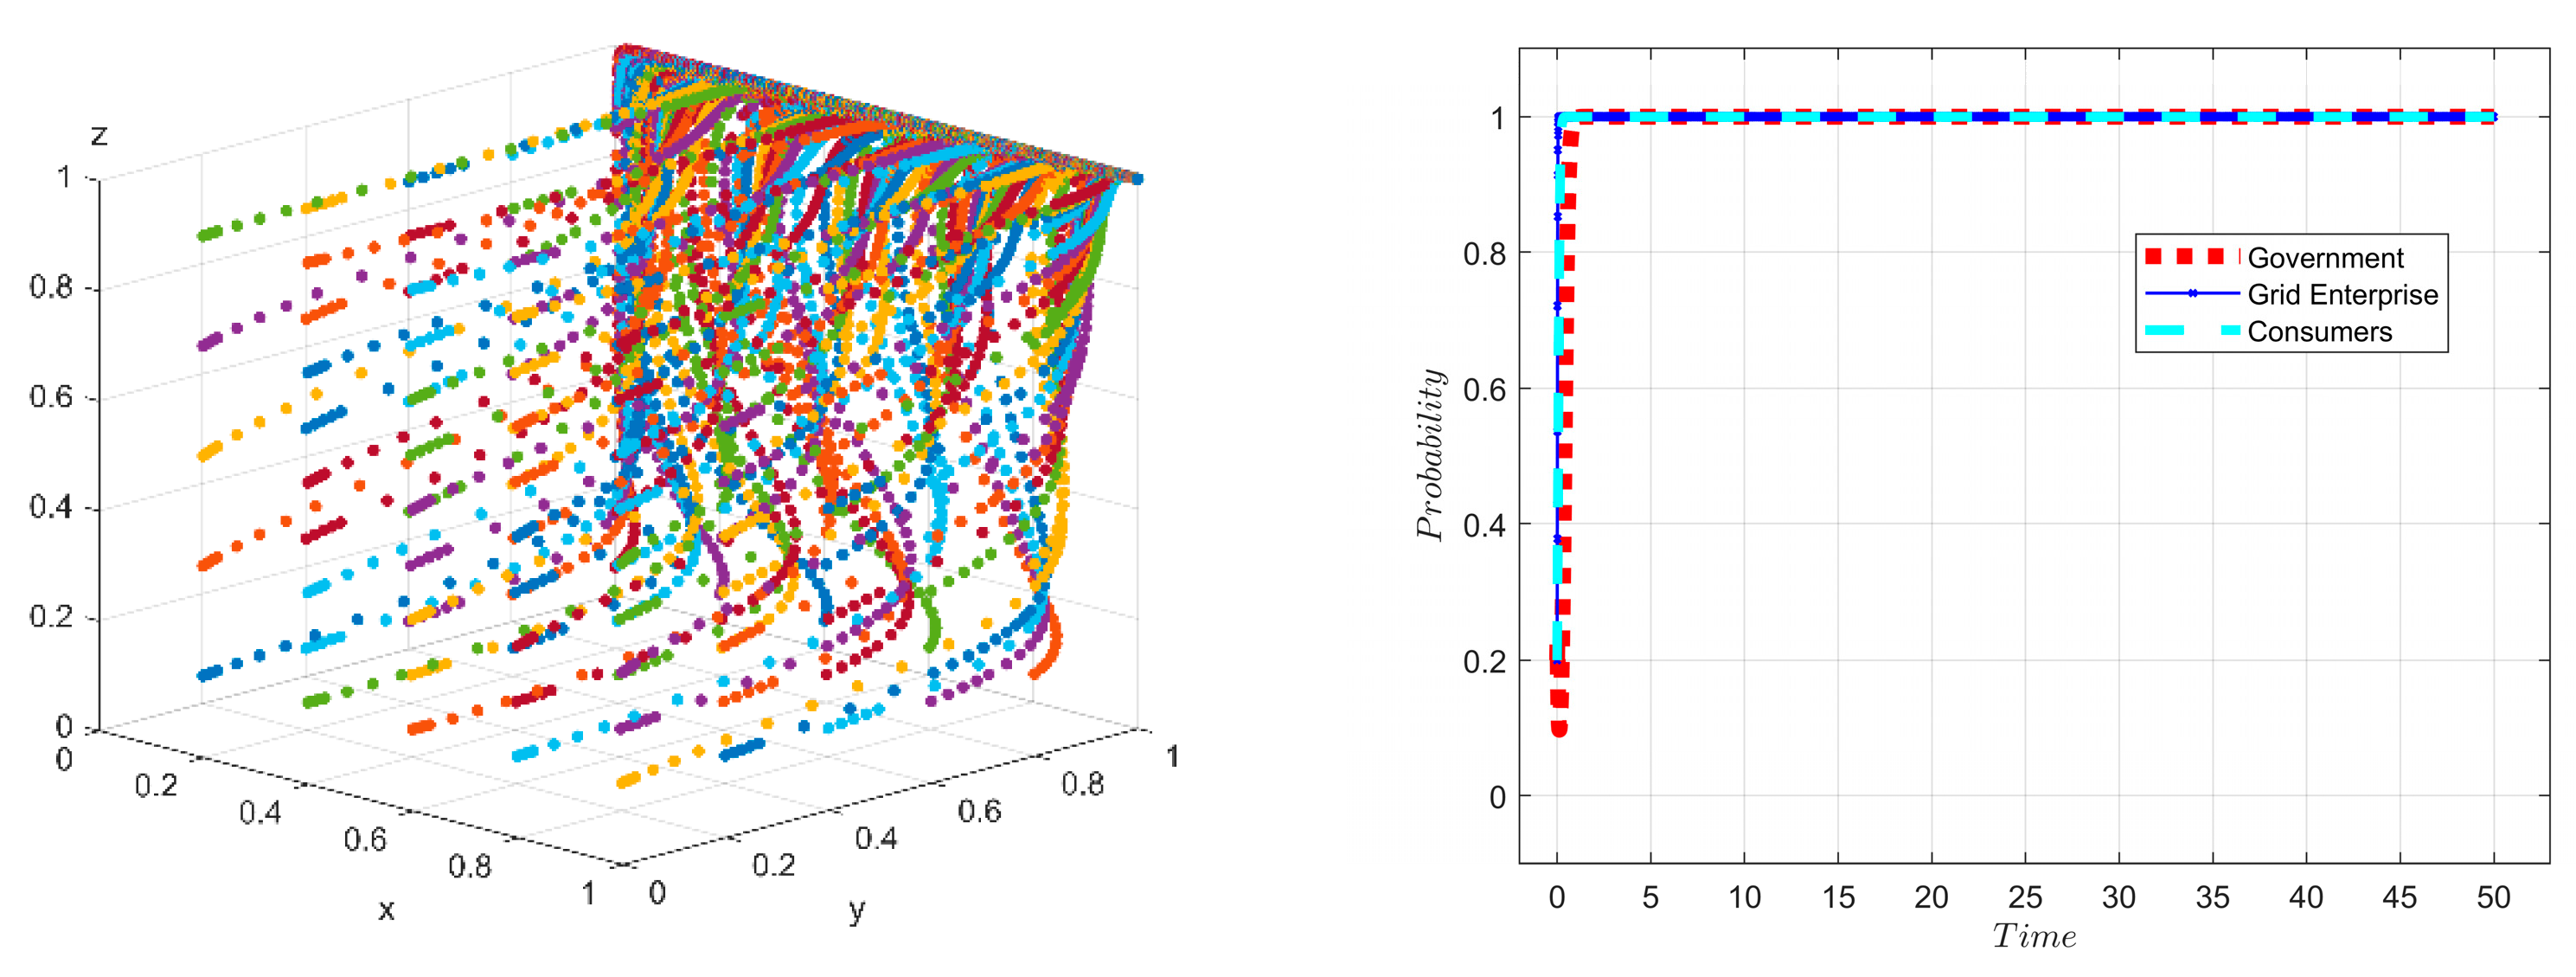
Let x , y , z = 0.2 , when P g 2 R p + C g 1 < 0 , the final evolution of the electricity demand-side reform system is shown in Figure 8, the system reaches equilibrium at E 7 ( 1 , 1 , 1 ) , the power companies and VPPs are in a state of active participation in demand-side reform, the government needs to spend higher subsidies, leading to low willingness to actively manage. When P g 2 + R p + C g 1 < 0 , the final evolution of the electricity demand-side reform system is shown in Figure 9 when the system reaches equilibrium at E 8 ( 1 , 1 , 1 ) , and the government, power companies and VPPs are all in a state of active participation in demand-side reform. This indicates that for the management of the electricity demand-side system, each participant actively adjusts its behavioural strategy and will reach the optimal equilibrium state of the system.

4.2. Effect Analyses of Different Parameters on Power System Dynamics

4.2.1. Impact of Parameter C g 1

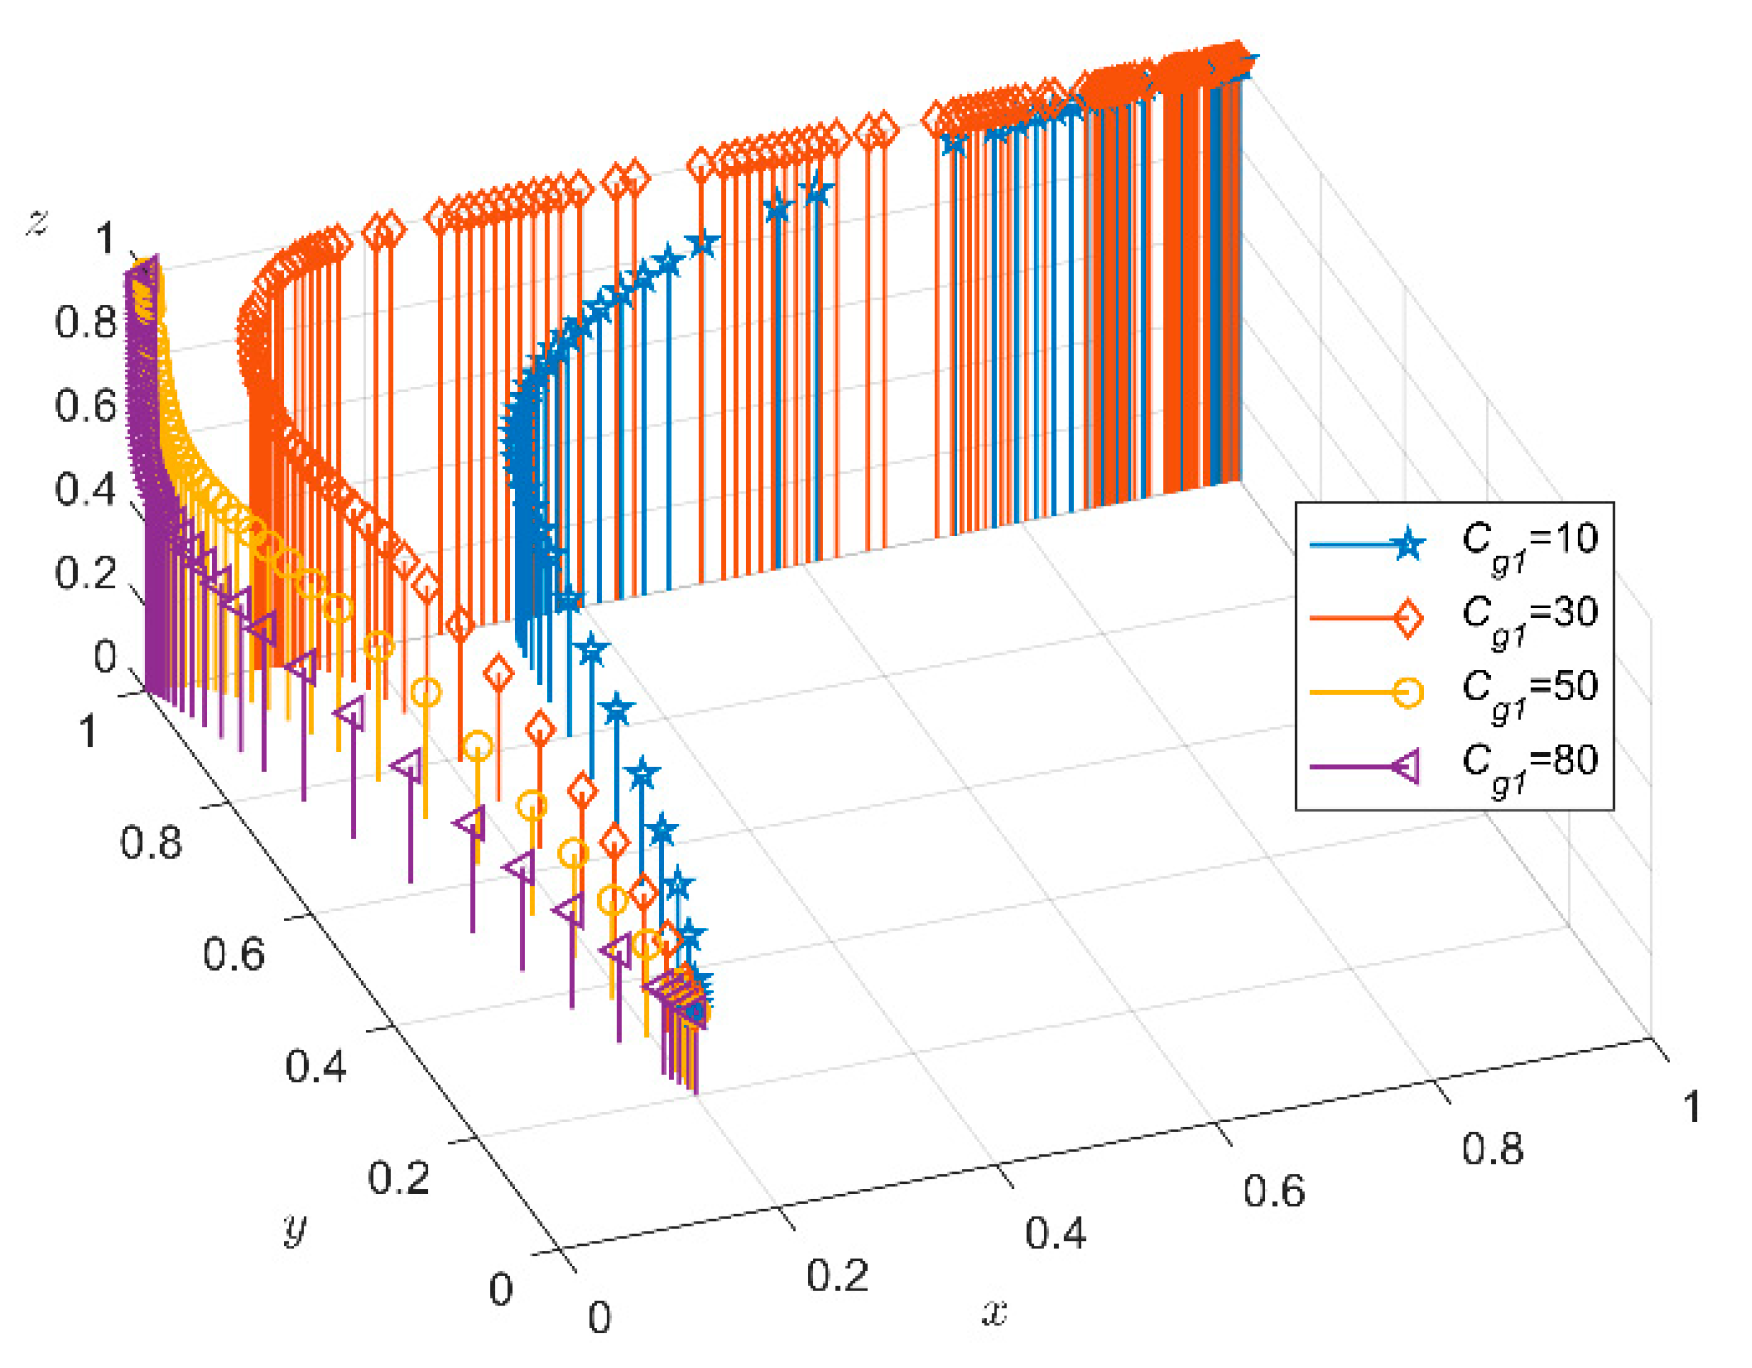
Take x , y , z = 0.2 , keeping the other parameters constant, choose C g 1 = 10 , 30 , 50 , 80 on different values, at this point the system of replicated dynamic equations follows as shown in Figure 10. When C g 1 > 30 , the government chooses to manage negatively due to the higher management costs of demand-side reform. The different values taken for C g 1 have an unknown impact on power companies and VPPs. The government’s negative behaviour, however, also leads to a slowness in their demand-side reform behaviour. When C g 1 30 , the government chooses to actively manage demand-side reform, but as the cost of management increases, higher government subsidies drive demand-side reform behaviour in both power companies and VPPs. Government incentives reduce the pressure on power companies to reform and lower the cost of electricity to VPPs, and drive the evolution of demand-side electricity reform.

4.2.2. Impact of Parameters R p and R s

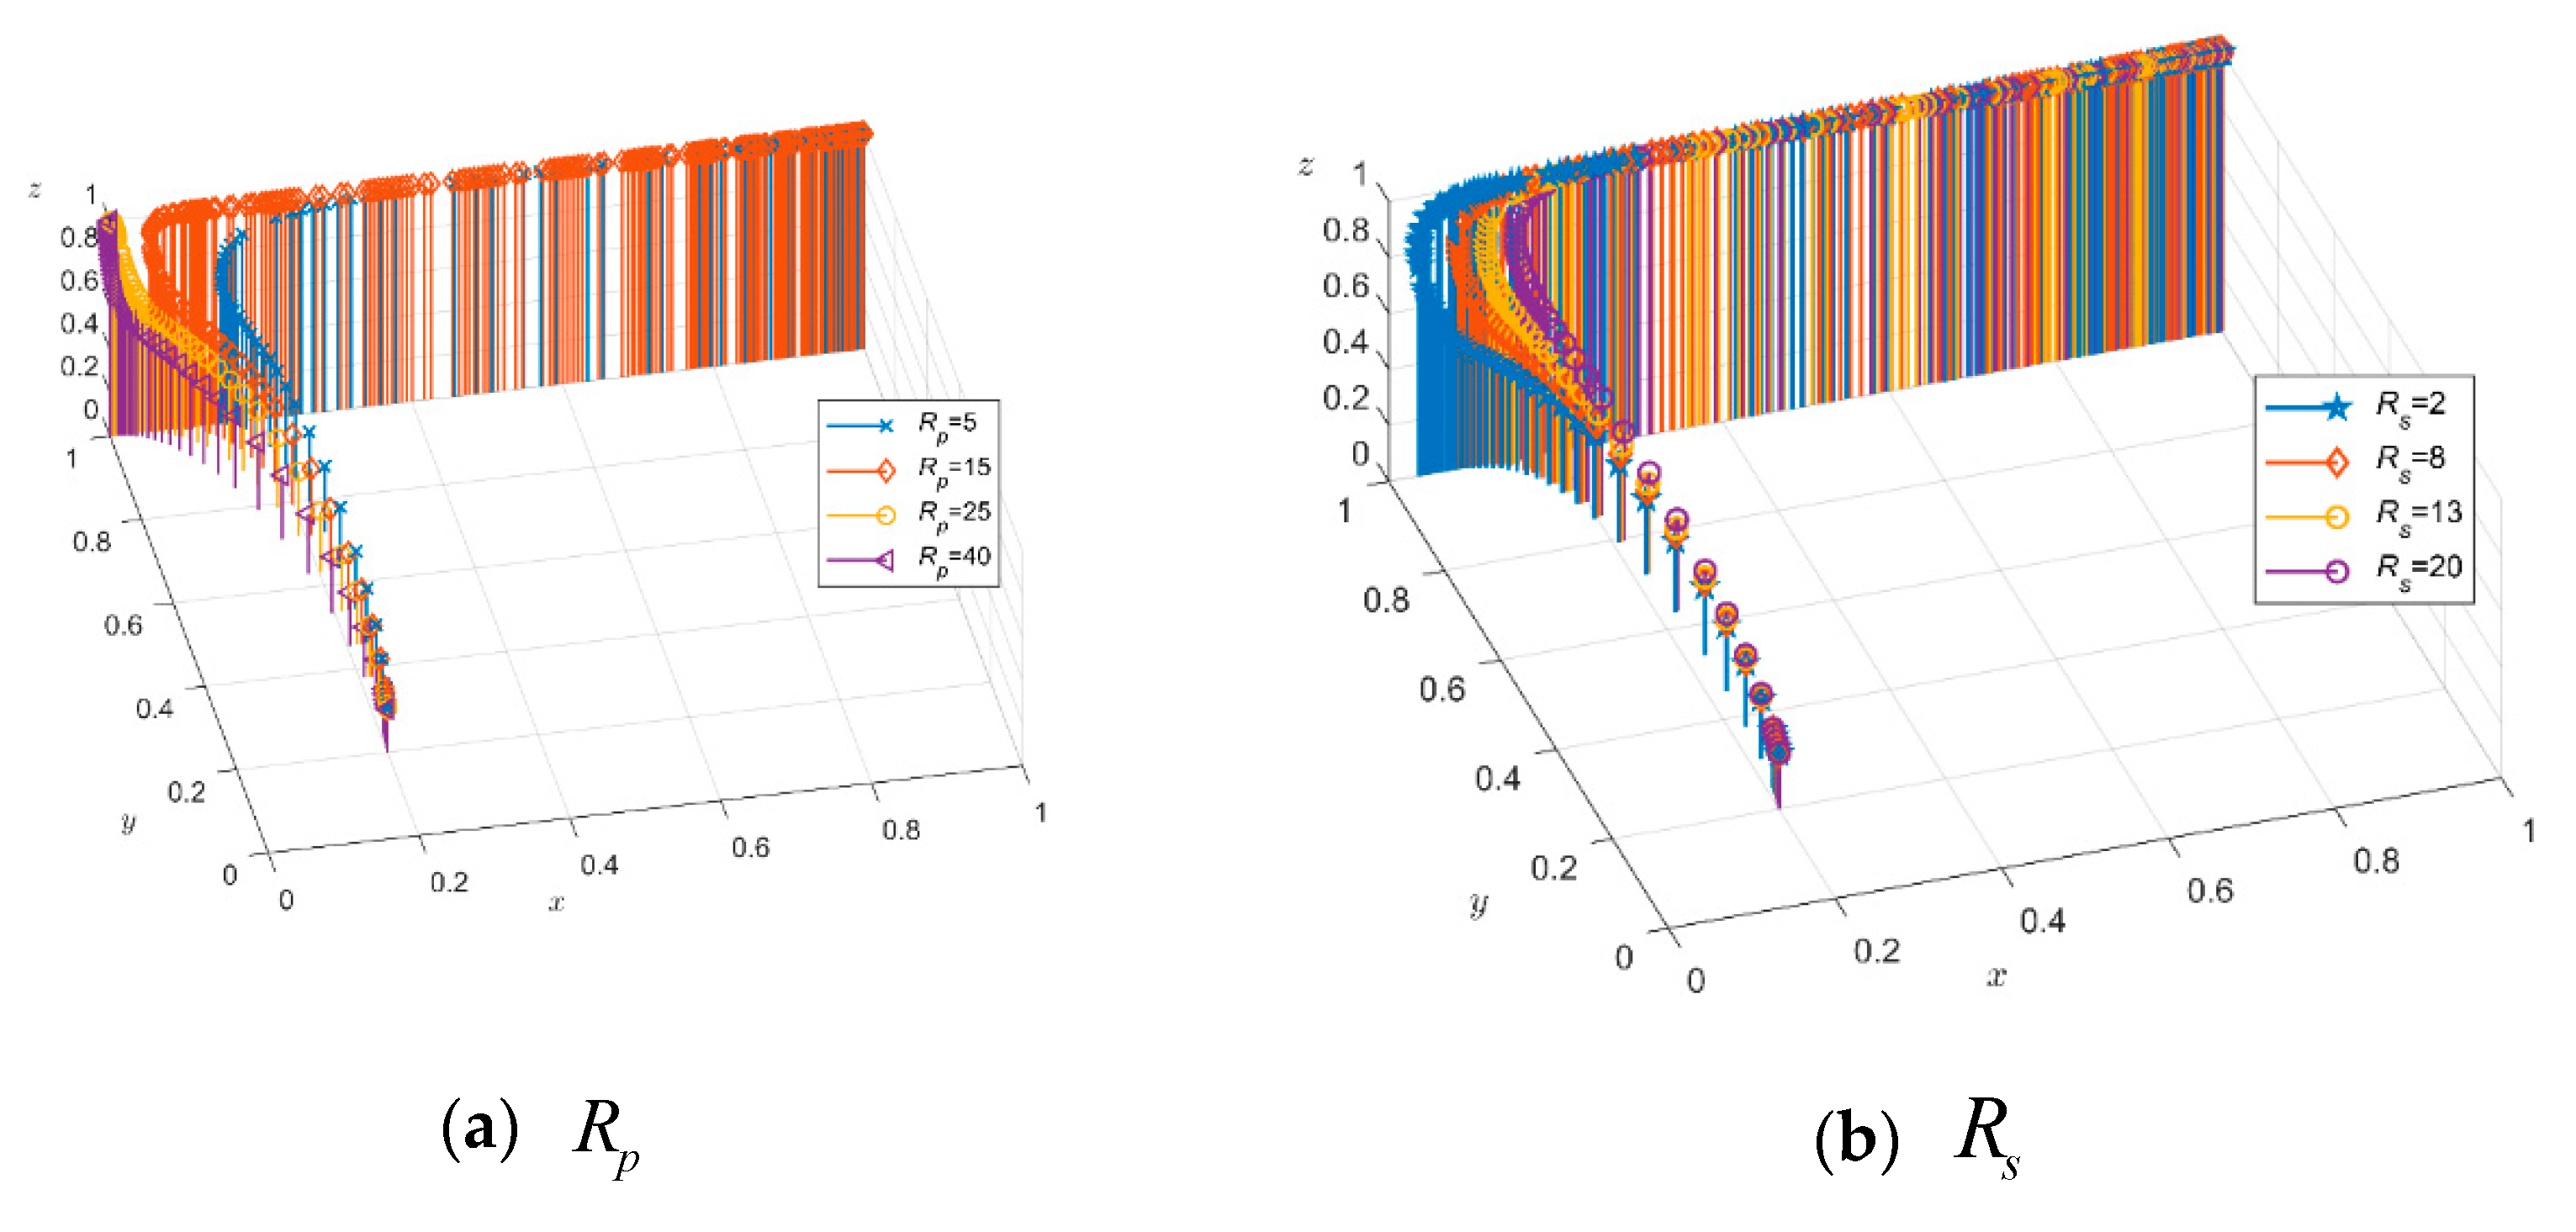
Take x , y , z = 0.2 and keeping other parameters constant, choose R p = 5 , 15 , 25 , 40 and R S = 2 , 8 , 13 , 20 on different values, at this point the system of replicated dynamic equations follows as shown in Figure 11. When R p 5 , R S 2 , government subsidies to power companies and VPPs are low, which does not alleviate the cost of their participation of demand-side reform, resulting in slow demand-side reform behaviour. When R p > 5 , R S > 2 , government subsidies for power companies and VPPs are greater than the planned amount at this time, and negative management is chosen. R p and R s have a positive influence on the behaviour of demand-side reform of power companies and VPPs. Government incentives will accelerate the active participation of power companies, which can be seen in Figure 11a and VPPs in the demand-side reform process, which can be seen in Figure 11b. However, increased government incentives for power companies and consumer demand-side reform strategies can sometimes slow down the demand-side reform process. This is due to the fact that, as with the too-quick electricity reform, power companies require significant investment and increase discomfort in VPPs, which leads to greater pressure on power companies and consumer resistance.

4.2.3. Impact of Power Company Costs C p 1

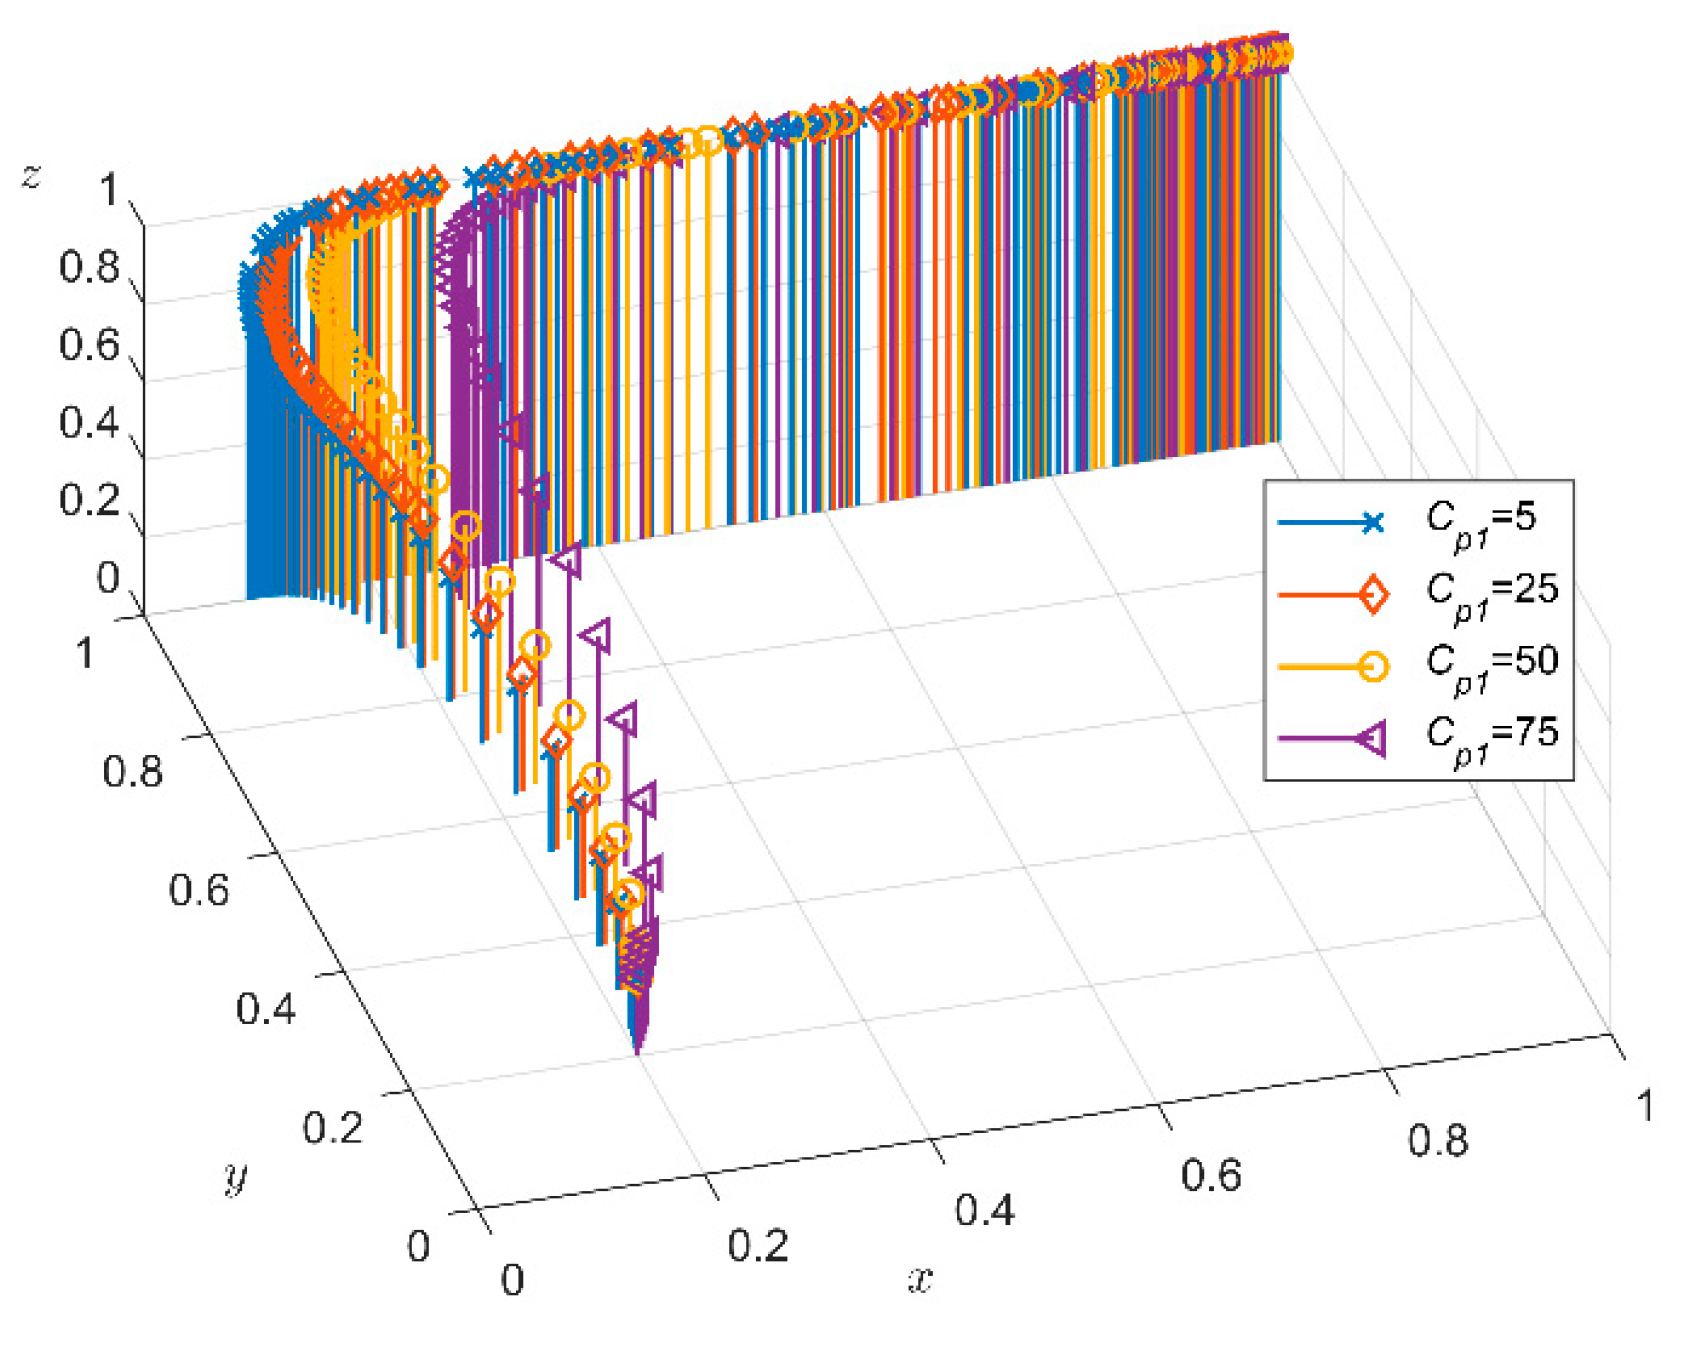
Take x , y , z = 0.2 , keeping the other parameters constant, choose C p 1 = 5 , 25 , 50 , 70 on different values, at this point the system of replicated dynamic equations follows as shown in Figure 12. The change in C p 1 has little effect on the government’s behaviour, but effectively affects the power companies’ demand-side reform behaviour. The increase in C p 1 slows down the process of demand-side reform behaviour of power companies. This is because power companies need to invest heavily in the construction of motor equipment upgrades, electricity-demand platform detection systems and the electricity-demand-response mechanisms. Additionally, power companies’ coordination and management of VPPs affects the motivation and speed of VPP participation in demand-side response.

4.2.4. Impact of VPP Costs C s 1

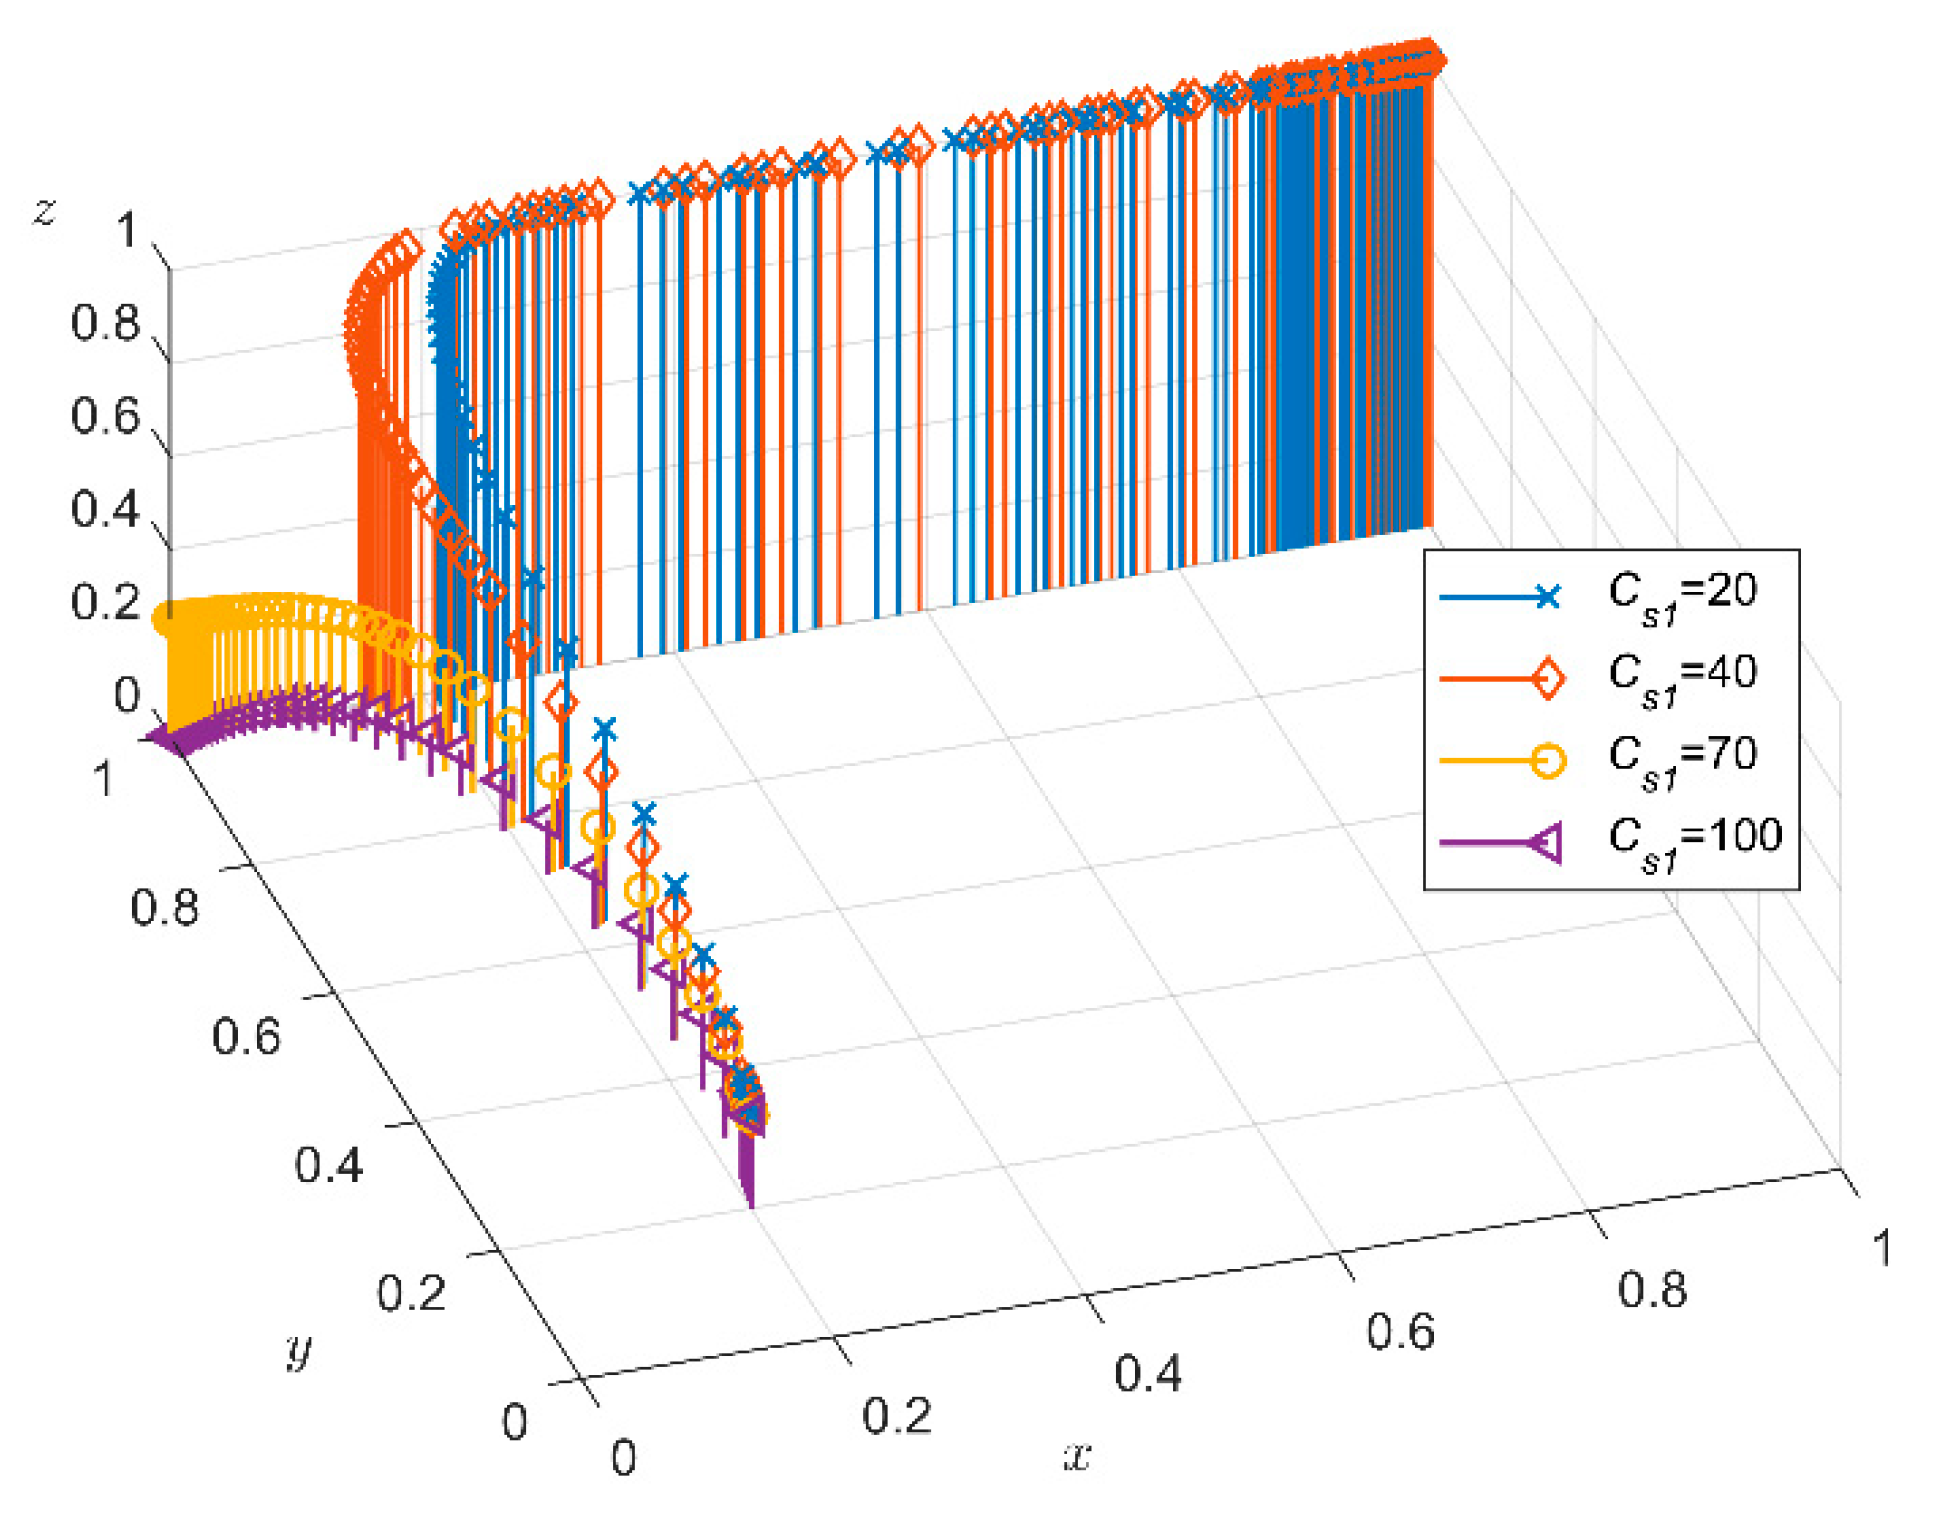
Take x , y , z = 0.2 , keep other parameters constant, choose C s 1 = 20 , 40 , 70 , 100 on different values, at this point replicate the system of dynamic equations with as shown in Figure 13. The change in C s 1 has a greater impact on the government’s behaviour when C s 1 > 70 , VPPs at this time need to invest a larger demand-side participation costs, consumer willingness to participate is low. As a result, the government can reduce the subsidy to VPPs. When C s 1 40 , there is a greater willingness of VPPs to participate in the demand-side reform at this time, and the government needs to take active measures to promote demand-side reform.
In this section, we set the initial strategy dynamic evolutionary trajectory and use five main parameters to investigate their effect on power system dynamics, including management costs C g 1 when the government chooses strategy, government penalties and incentives for power companies R p , as well as government subsidies for the VPP choice strategy R s , power company costs C p 1 and VPP costs C s 1 . The results and analyses presented indicate that, with the change in the five main parameters, the ultimate goal of the power system changes according to the dynamic behaviour of the three participants.

5. Conclusions and Recommendations

5.1. Conclusions

Demand-side response is an effective way to alleviate the pressure of power system and improve energy efficiency. At present, many scholars have carried out micro-level research from multiple perspectives such as power technology improvement and power load adjustment, but lack of comprehensive macro-interactive research of multi-dimensional participants. Therefore, from the perspective of macro-policy management, this study builds a multi-agent dynamic game model including government, power companies and VPPs, analyses the dynamic behaviour evolution process of each participant at different data, verifies the influence of different parameters and different combination conditions of strategies and draws the following conclusions:
(1)
As the leader of the industry development, government plays a key role for demand-side reform of power industry. Government, as a policy maker and executor, actively promotes the demand-side reform of power system, will encourage the initiative consciousness of power companies and VPPs. The management cost of government demand-side reform ( C g 1 ), subsidies to power companies ( R p ), punitive measures ( F p ) and subsidies to VPPs ( R s ) will all have a significant impact on the behavioural orientation of the power system. The government should give full play to the key role of policy makers and promoters, improve the supervision, reward and punishment and dynamic feedback mechanism of demand-side reform and promote the effective completion of demand-side reform.
(2)
Power companies and VPPs will influence and assist each other as a consortium of interests. When power companies actively implement demand-side response, it needs to fully consider the acceptance degree and convenience of VPPs, so as to cooperate with VPPs to complete the demand-side response with better information sharing. By cooperating with power companies, VPPs can achieve energy saving and environmental protection behaviours at a lower cost, relieve the inconvenience caused by electricity shortage and realise coordinated energy saving development.
(3)
The demand-side response behaviours of power companies and VPPs are mainly influenced by benefit and cost factors. Lower demand-side response costs ( C p 1 ) and increased opportunity costs F 1 will increase the incentive for power companies on demand-side response. A reduction in the cost of VPPs ( C s 1 ) and an increase in the government subsidies ( R s ) will increase the incentive for consumer demand-side response. Therefore, the government should reduce the costs of demand-side response for both utilities and VPPs in a multi-channel manner to help them gain more economic benefits.

5.2. Recommendations

The following policy recommendations are suggested in light of the aforementioned research findings in order to more effectively support demand-side reform of the power system:
(1)
Government’s active management measures can effectively promote the demand-side reform of power system. Starting with the long-term development objectives of energy conservation and environmental protection, the government should set up a solid legal and regulatory framework to actively support and promote the demand-side reform of the power system, and guarantee power conservation during various times of the day with various peaks. Government guidance can enhance the awareness of social responsibility of power companies and VPPs to a certain extent, and promote their enthusiasm to participate in the demand-side reform of power system. However, it is worth noting that government needs to pay attention and take measures to reduce supervision and management cost due to the limitation of fiscal revenue. Therefore, government can explore multi-channel financing methods, establish market trading platform for power system, introduce financial market regulation and other methods to control the cost and ensure the continuity and initiative of government regulation.
(2)
An efficient incentive and punishment system should be put into place. According to research findings, the government may successfully promote the demand-side reform by enacting reward and punishment policies. Lower fines or, simply, incentives will have an impact on the demand side of the power companies and VPPs. Therefore, government should improve the reward and punishment mechanism, establish a supervision and feedback mechanism and take cooperative measures in various ways to manage the behaviour of power companies and VPPs. The demand-side reform of the power system requires a large amount of construction costs, and there are some problems such as long construction cycle, slow benefit recovery that affect the normal pace of life of VPPs. Therefore, reform compensation should be given to ease the cost input of power companies and compensate VPPs for the convenience of life. In order to limit the behaviour of power companies and VPPs, punitive measures will be applied to those that break the rules, such as fines, suspension of activities, or platform notification. With the dynamic behaviour adjustment of all participants during the demand-side response, government needs to adjust the policy direction and change the electric price in the electricity price market timely. In this way, the demand-side reform of the power industry can be monitored dynamically in real time, the cost of government regulation can be reduced and the development direction of effective environmental protection of the power industry can be promoted.
(3)
The demand-side reform of the power industry needs the coordinated promotion of power companies and VPPs. Power companies must begin with the industrial layout, fully utilise the benefits of their power system platform and optimise the allocation of power resources based on peak power consumption and regional power consumption characteristics. Power companies should dynamically adjust equipment level load storage capacity, improve the flexibility of power load, adopt “unified control + flexible regulation” and other means to ensure the orderly storage and use of power. At the same time, power companies should rely on the response compensation policy, take measures such as the implementation of residential air conditioning push invitation, independent flexible adjustment, through the market mechanism to quickly complete the effective aggregation of resources and local balance, to realise the “peak error + drainage” regulation of charging load spatial and temporal distribution, to ensure that the “every degree of electricity should be controlled and adjusted”.
(4)
For VPPs, in order to avoid adverse effects on their lives brought by extreme weather and power supply shortage, they should actively cooperate with the demand-side reform of power companies, respond to national policy guidance, dynamically adjust the power consumption limit and actively respond and participate in the demand response such as peak regulation and frequency regulation of the system. Responding to the dynamic trend of marketisation can help VPPs save money on electricity costs while also enhancing their own reputation in society. On the one hand, through the compensation of electricity technology and the convenience of electricity technology, nations and businesses can entice consumers’ demand-side electricity behaviour. On the other hand, demand-response certificates, credit scores and the development of energy credit ratings can all be used to promote and accelerate VPP demand-side reform.
The results of the research not only aid in formulating and modifying strategies of various stakeholders in the demand-side reform of the power system, but also assist the government in anticipating the dynamic decision-making behaviour of power enterprises. In this study, however, there are still shortcomings and further studies required to examine the space: (1) Due to the limited parameters of payment matrix of evolutionary game, all influencing factors on demand-side reform, such as different risk preferences of participants and behavioural selective probability of participants, are not fully considered. The model can be expanded upon in the future, and the research variables can be improved. (2) There are other multi-party participants in the power system, such as power generation enterprises are also important participants in the power system, and financial institutions provide market support for the demand-side reform. In the future, multi-party and network system research involving other participants can be studied. (3) As we create a tripartite game model, it can become a benchmarking model. In the future, we will focus more on the method of statistical analysis [66], combined with the dynamic evolutionary game for in-depth research.

Author Contributions

Conceptualisation, J.Z. and W.W.; methodology, K.C.; software, J.Z.; validation, J.Z., W.W. and K.C.; formal analysis, J.Z.; investigation, K.C.; resources, K.C.; data curation, K.C.; writing—original draft preparation, J.Z.; writing—review and editing, J.Z. and W.W.; visualisation, J.Z. and W.W.; supervision, and W.W.; project administration, and W.W. and J.Z.; funding acquisition, J.Z., W.W. and K.C. All authors have read and agreed to the published version of the manuscript.

Funding

This research was supported by Open Fund of Beijing Key Laboratory of Demand Side Multi-Energy Carriers Optimization and Interaction Technique (China Electric Power Research Institute) (contract number: YDB51202201362).

Data Availability Statement

Information from this paper can be obtained from the writers.

Conflicts of Interest

The authors declare no conflict of interest.

References

  1. United Nations. Paris Agreement. Available online: https://unfccc.int/sites/default/files/english_paris_agreement.pdf (accessed on 15 July 2022).
  2. IRENA Global Energy Transformation: A Roadmap to 2050. Available online: https://www.irena.org/publications/2019/Apr/Global-energy-transformation-A-roadmap-to-2050-2019Edition (accessed on 26 November 2020).
  3. Commission, E. Climate & Energy Framework—Climate Action. 2030 Climate & Energy Framework. 2019. Available online: https://ec.europa.eu/clima/policies/strategies/2030_en (accessed on 10 July 2022).
  4. Escoffier, M.; Hache, E.; Mignon, V.; Paris, A. Determinants of solar photovoltaic deployment in the electricity mix: Do oil prices really matter? Energy Econ. 2021, 97, 105024. [Google Scholar] [CrossRef]
  5. Fragkos, P.; van Soest, H.L.; Schaeffer, R.; Reedman, L.; Köberle, A.C.; Macaluso, N.; Evangelopoulou, S.; De Vita, A.; Sha, F.; Qimin, C.; et al. Energy system transitions and low-carbon pathways in Australia, Brazil, Canada, China, EU-28, India, Indonesia, Japan, Republic of Korea, Russia and the United States. Energy 2021, 216, 119385. [Google Scholar] [CrossRef]
  6. Delucchi, M.A.; Jacobson, M.Z. Providing all global energy with wind, water, and solar power, Part II: Reliability, system and transmission costs, and policies. Energy Policy 2011, 39, 1170–1190. [Google Scholar] [CrossRef]
  7. Shakouri, H.G. The share of cooling electricity in global warming: Estimation of the loop gain for the positive feedback. Energy 2019, 179, 747–761. [Google Scholar] [CrossRef]
  8. Lacroix, K.; Gifford, R. Psychological Barriers to Energy Conservation Behavior: The Role of Worldviews and Climate Change Risk Perception. Environ. Behav. 2018, 50, 749–780. [Google Scholar] [CrossRef]
  9. Awasthi, A.; Shukla, A.K.; Manohar, M.S.R.; Dondariya, C.; Shukla, K.N.; Porwal, D.; Richhariya, G. Review on sun tracking technology in solar PV system. Energy Rep. 2020, 6, 392–405. [Google Scholar] [CrossRef]
  10. de Paulo, A.F.; Porto, G.S. Evolution of collaborative networks of solar energy applied technologies. J. Clean. Prod. 2018, 204, 310–320. [Google Scholar] [CrossRef]
  11. Bird, L.; Lew, D.; Milligan, M.; Carlini, E.M.; Estanqueiro, A.; Flynn, D.; Gomez-Lazaro, E.; Holttinen, H.; Menemenlis, N.; Orths, A.; et al. Wind and solar energy curtailment: A review of international experience. Renew. Sustain. Energy Rev. 2016, 65, 577–586. [Google Scholar] [CrossRef]
  12. Joos, M.; Staffell, I. Short-term integration costs of variable renewable energy: Wind curtailment and balancing in Britain and Germany. Renew. Sustain. Energy Rev. 2018, 86, 45–65. [Google Scholar] [CrossRef]
  13. CPC (the Central Committee of the Communist Party of China) and the State Council. Opinions Regarding Further Deepening of the Power Sector Reform. 2015. Available online: http://www.ne21.com/news/show-64828.html (accessed on 15 March 2015).
  14. NDRC (National Development and Reform Commission). Interpretation of Power Sector Reform; People’s Publishing House: Beijing, China; pp. 1–40. Available online: http://drc.gd.gov.cn/snyj/bmgl/content/post_3736970.html (accessed on 19 April 2023).
  15. Pozo, D.; Sauma, E.E.; Contreras, J. A Three-Level Static MILP Model for Generation and Transmission Expansion Planning. IEEE Trans Power Syst. 2013, 28, 202–210. [Google Scholar] [CrossRef]
  16. Guelpa, E.; Verda, V. Demand response and other demand side management techniques for district heating: A review. Energy 2021, 219, 119440. [Google Scholar] [CrossRef]
  17. Stanelyte, D.; Radziukyniene, N.; Radziukynas, V. Overview of Demand-Response Services: A Review. Energies 2022, 15, 1659. [Google Scholar] [CrossRef]
  18. Yu, J.; Liu, J.; Wen, Y.; Yu, X. Economic Optimal Coordinated Dispatch of Power for Community Users Considering Shared Energy Storage and Demand Response under Blockchain. Sustainability 2023, 15, 6620. [Google Scholar] [CrossRef]
  19. Gupta, P.; Verma, Y.P. Voltage profile improvement using demand side management in distribution networks under frequency linked pricing regime. Appl. Energy 2021, 295, 117053. [Google Scholar] [CrossRef]
  20. Soder, L.; Lund, P.D.; Koduvere, H.; Bolkesjo, T.F.; Rossebo, G.H.; Rosenlund-Soysal, E.; Skytte, K.; Katz, J.; Blumberga, D. A review of demand side flexibility potential in Northern Europe. Renew. Sustain. Energy Rev. 2018, 91, 654–664. [Google Scholar] [CrossRef]
  21. Hoicka, C.E.; Lowitzsch, J.; Brisbois, M.C.; Kumar, A.; Camargo, L.R. Implementing a just renewable energy transition: Policy advice for transposing the new European rules for renewable energy communities. Energy Policy 2021, 156, 112435. [Google Scholar] [CrossRef]
  22. Annala, S.; Lukkarinen, J.; Primmer, E.; Honkapuro, S.; Ollikka, K.; Sunila, K.; Ahonen, T. Regulation as an enabler of demand response in electricity markets and power systems. J. Clean. Prod. 2018, 195, 1139–1148. [Google Scholar] [CrossRef]
  23. Cardoso, C.A.; Torriti, J.; Lorincz, M. Making demand side response happen: A review of barriers in commercial and public organisations. Energy Res. Soc. Sci. 2020, 64, 101443. [Google Scholar] [CrossRef]
  24. Pozo, D.; Contreras, J.; Sauma, E. If you build it, he will come: Anticipative power transmission planning. Energy Econ. 2013, 36, 135–146. [Google Scholar] [CrossRef]
  25. Huppmann, D.; Egerer, J. National-strategic investment in European power transmission capacity. Eur. J. Oper. Res. 2015, 247, 191–203. [Google Scholar] [CrossRef]
  26. Bergaentzle, C.; Clastres, C.; Khalfallah, H. Demand-side management and European environmental and energy goals: An optimal complementary approach. Energy Policy 2014, 67, 858–869. [Google Scholar] [CrossRef]
  27. Algarvio, H.; Lopes, F. Bilateral Contracting and Price-Based Demand Response in Multi-Agent Electricity Markets: A Study on Time-of-Use Tariffs. Energies 2023, 16, 645. [Google Scholar] [CrossRef]
  28. Voulis, N.; van Etten, M.J.J.; Chappin, E.J.L.; Warnier, M.; Brazier, F.M.T. Rethinking European energy taxation to incentivise consumer demand response participation. Energy Policy 2019, 124, 156–168. [Google Scholar] [CrossRef]
  29. Chen, L.; Yang, Y.; Xu, Q. Retail dynamic pricing strategy design considering the fluctuations in day-ahead market using integrated demand response. Int. J. Electr. Power Energy Syst. 2021, 130, 106983. [Google Scholar] [CrossRef]
  30. Liu, J.; Sun, J.; Yuan, H.; Su, Y.; Feng, S.; Lu, C. Behavior analysis of photovoltaic-storage-use value chain game evolution in blockchain environment. Energy 2022, 260, 125182. [Google Scholar] [CrossRef]
  31. Warren, P. Demand-Side Policy: Mechanisms for Success and Failure. Econ. Energy Environ. Policy 2019, 8, 119–144. [Google Scholar] [CrossRef]
  32. Shen, B.; Ghatikar, G.; Lei, Z.; Li, J.; Wikler, G.; Martin, P. The role of regulatory reforms, market changes, and technology development to make demand response a viable resource in meeting energy challenges. Appl. Energy 2014, 130, 814–823. [Google Scholar] [CrossRef]
  33. Gils, H.C. Economic potential for future demand response in Germany—Modeling approach and case. Appl. Energy 2016, 162, 401–415. [Google Scholar] [CrossRef]
  34. Walawalkar, R.; Fernands, S.; Thakur, N.; Chevva, K.R. Evolution and current status of demand response (DR) in electricity markets: Insights from PJM and NYISO. Energy 2010, 35, 1553–1560. [Google Scholar] [CrossRef]
  35. Li, W.; Xu, P.; Lu, X.; Wang, H.; Pang, Z. Electricity demand response in China: Status, feasible market schemes and pilots. Energy 2016, 114, 981–994. [Google Scholar] [CrossRef]
  36. Zeng, M.; Li, C.; Chen, Y.J.; Xu, W.X. Implementation mode of power demand side response to large-scale wind power integrated grid in China. East China Electr. 2012, 40, 363–367. [Google Scholar]
  37. de Christo, T.M.; Perron, S.; Fardin, J.F.; Lyrio Simonetti, D.S.; de Alvarez, C.E. Demand-side energy management by cooperative combination of plans: A multi-objective method applicable to isolated communities. Appl. Energy 2019, 240, 453–472. [Google Scholar] [CrossRef]
  38. Churkin, A.; Bialek, J.; Pozo, D.; Sauma, E.; Korgin, N. Review of Cooperative Game Theory applications in power system expansion planning. Renew. Sustain. Energy Rev. 2021, 145, 111056. [Google Scholar] [CrossRef]
  39. Ganguly, S.; Sahoo, N.C.; Das, D. Mono- and multi-objective planning of electrical distribution networks using particle swarm optimization. Appl. Soft Comput. 2011, 11, 2391–2405. [Google Scholar] [CrossRef]
  40. Tsukamoto, Y.; Iyoda, I. Allocation of fixed transmission cost to wheeling transactions by cooperative game theory. IEEE Trans Power Syst. 1996, 11, 620–627. [Google Scholar] [CrossRef]
  41. Gately, D. Sharing the gains from regional cooperation: A game theoretic application to planning investment in electric power. Int. Econ. Rev. 1974, 15, 195–208. [Google Scholar] [CrossRef]
  42. Zolezzi, J.M.; Rudnick, H. Transmission cost allocation by cooperative games and coalition formation. IEEE Trans Power Syst. 2002, 17, 1008–1015. [Google Scholar] [CrossRef]
  43. Chattopadhyay, D. An energy brokerage system with emission trading and allocation of cost savings. IEEE Trans Power Syst. 1995, 10, 1939–1945. [Google Scholar] [CrossRef] [PubMed]
  44. Beltadze, G.N. Foundations of Lexicographic Cooperative Game Theory. IJMECS 2013, 5, 18–25. [Google Scholar] [CrossRef]
  45. Dey, S. Securing Majority-Attack in Blockchain Using Machine Learning and Algorithmic Game Theory: A Proof of Work. In Proceedings of the 2018 10th Computer Science and Electronic Engineering Conference (CEEC) 2018, Colchester, UK, 19–21 September 2018; pp. 7–10. [Google Scholar]
  46. Ogidiaka, E.; Ogwueleka, F.N.; Irhebhude, M.E. Game-Theoretic Resource Allocation Algorithms for Device-to-Device Communications in Fifth Generation Cellular Networks: A Review. Int. J. Inf. Eng. Electron. Bus. 2021, 3, 44–51. [Google Scholar] [CrossRef]
  47. Pitchai, A.; Reddy, A.V.; Savarimuthu, N. Quantum Walk Algorithm to Compute Subgame Perfect Equilibrium in Finite Two-player Sequential Games. Int. J. Math. Sci. Comput. 2016, 2, 32–40. [Google Scholar] [CrossRef]
  48. Dalkani, H.; Mojarad, M.; Arfaeinia, H. Modelling Electricity Consumption Forecasting Using the Markov Process and Hybrid Features Selection. Int. J. Intell. Syst. Appl. 2021, 13, 14–23. [Google Scholar] [CrossRef]
  49. Contreras, J.; Klusch, M.; Krawczyk, J.B. Numerical solutions to Nash-Cournot equilibria in coupled constraint electricity markets. IEEE Trans Power Syst. 2004, 19, 195–206. [Google Scholar] [CrossRef]
  50. Pozo, D.; Contreras, J. Finding Multiple Nash Equilibria in Pool-Based Markets: A Stochastic EPEC Approach. IEEE Trans Power Syst. 2011, 26, 1744–1752. [Google Scholar] [CrossRef]
  51. Huppmann, D.; Siddiqui, S. An exact solution method for binary equilibrium problems with compensation and the power market uplift problem. Eur. J. Oper. Res. 2018, 266, 622–638. [Google Scholar] [CrossRef]
  52. Sauma, E.E.; Oren, S.S. Proactive planning and valuation of transmission investments in restructured electricity markets. J. Regul. Econ. 2006, 30, 261–290. [Google Scholar] [CrossRef]
  53. Taheri, S.S.; Kazempour, J.; Seyedshenava, S. Transmission expansion in an oligopoly considering generation investment equilibrium. Energy Econ. 2017, 64, 55–62. [Google Scholar] [CrossRef]
  54. Kasina, S.; Hobbs, B.F. The value of cooperation in interregional transmission planning: A noncooperative equilibrium model approach. Eur. J. Oper. Res. 2020, 285, 740–752. [Google Scholar] [CrossRef]
  55. Hobbs, B.F.; Kelly, K.A. Using game theory to analyze electric transmission pricing policies in the United States. Eur. J. Oper. Res. 1992, 56, 154–171. [Google Scholar] [CrossRef]
  56. Du, Y.; Wang, Z.; Liu, G.; Chen, X.; Yuan, H.; Wei, Y.; Li, F. A cooperative game approach for coordinating multi-microgrid operation within distribution systems. Appl. Energy 2018, 222, 383–395. [Google Scholar] [CrossRef]
  57. Contreras, J. A Cooperative Game Theory Approach to Transmission Planning in Power Systems. Ph.D. Thesis, University of California, Berkeley, CA, USA, 1997. [Google Scholar]
  58. Geerli, L.; Chen, L.; Yokoyama, R. Pricing and operation in deregulated electricity market by noncooperative game. Electr. Power Syst. Res. 2001, 57, 133–139. [Google Scholar] [CrossRef]
  59. Hariyanto, N.; Nurdin, M.; Haroen, Y.; Machbub, C. Decentralized And Simultaneous Generation and Transmission Expansion Planning Through Cooperative Game Theory. Int. J. Electr. Eng. Inf. 2009, 1, 149–164. [Google Scholar] [CrossRef]
  60. Serrano, R.; Zolezzi, J.; Rudnick, H.; Araneda, J.C. Transmission expansion in the Chilean system via cooperative game theory. In Proceedings of the 2005 IEEE Russia Power Tech, St. Petersburg, Russia, 27–30 June 2005; pp. 1–6. [Google Scholar] [CrossRef]
  61. Hewitt, C.G.; Wainwright, J. A dynamical systems approach to Bianchi cosmologies: Orthogonal models of class B. Class. Quantum Gravity 1993, 10, 99. [Google Scholar] [CrossRef]
  62. Smith, M.C. The general problem of the stability of motion: Translated and Edited by A. T. Fuller. Taylor and Francis, 1992. Automatica 1995, 31, 353–354. [Google Scholar] [CrossRef]
  63. Friedman, D. Evolutionary Games in Economics. Econometrica 1991, 59, 637–666. [Google Scholar] [CrossRef]
  64. Smith, J.M. Evolution and the theory of games. Am. Sci. 1976, 64, 41–45. [Google Scholar] [PubMed]
  65. Allen, B.; Lippner, G.; Chen, Y.-T.; Fotouhi, B.; Momeni, N.; Yau, S.-T.; Nowak, M.A. Evolutionary dynamics on any population structure. Nature 2017, 544, 227. [Google Scholar] [CrossRef]
  66. Fan, G.-F.; Peng, L.-L.; Hong, W.-C. Short-term load forecasting based on empirical wavelet transform and random forest. Electr. Eng. 2022, 104, 4433–4449. [Google Scholar] [CrossRef]
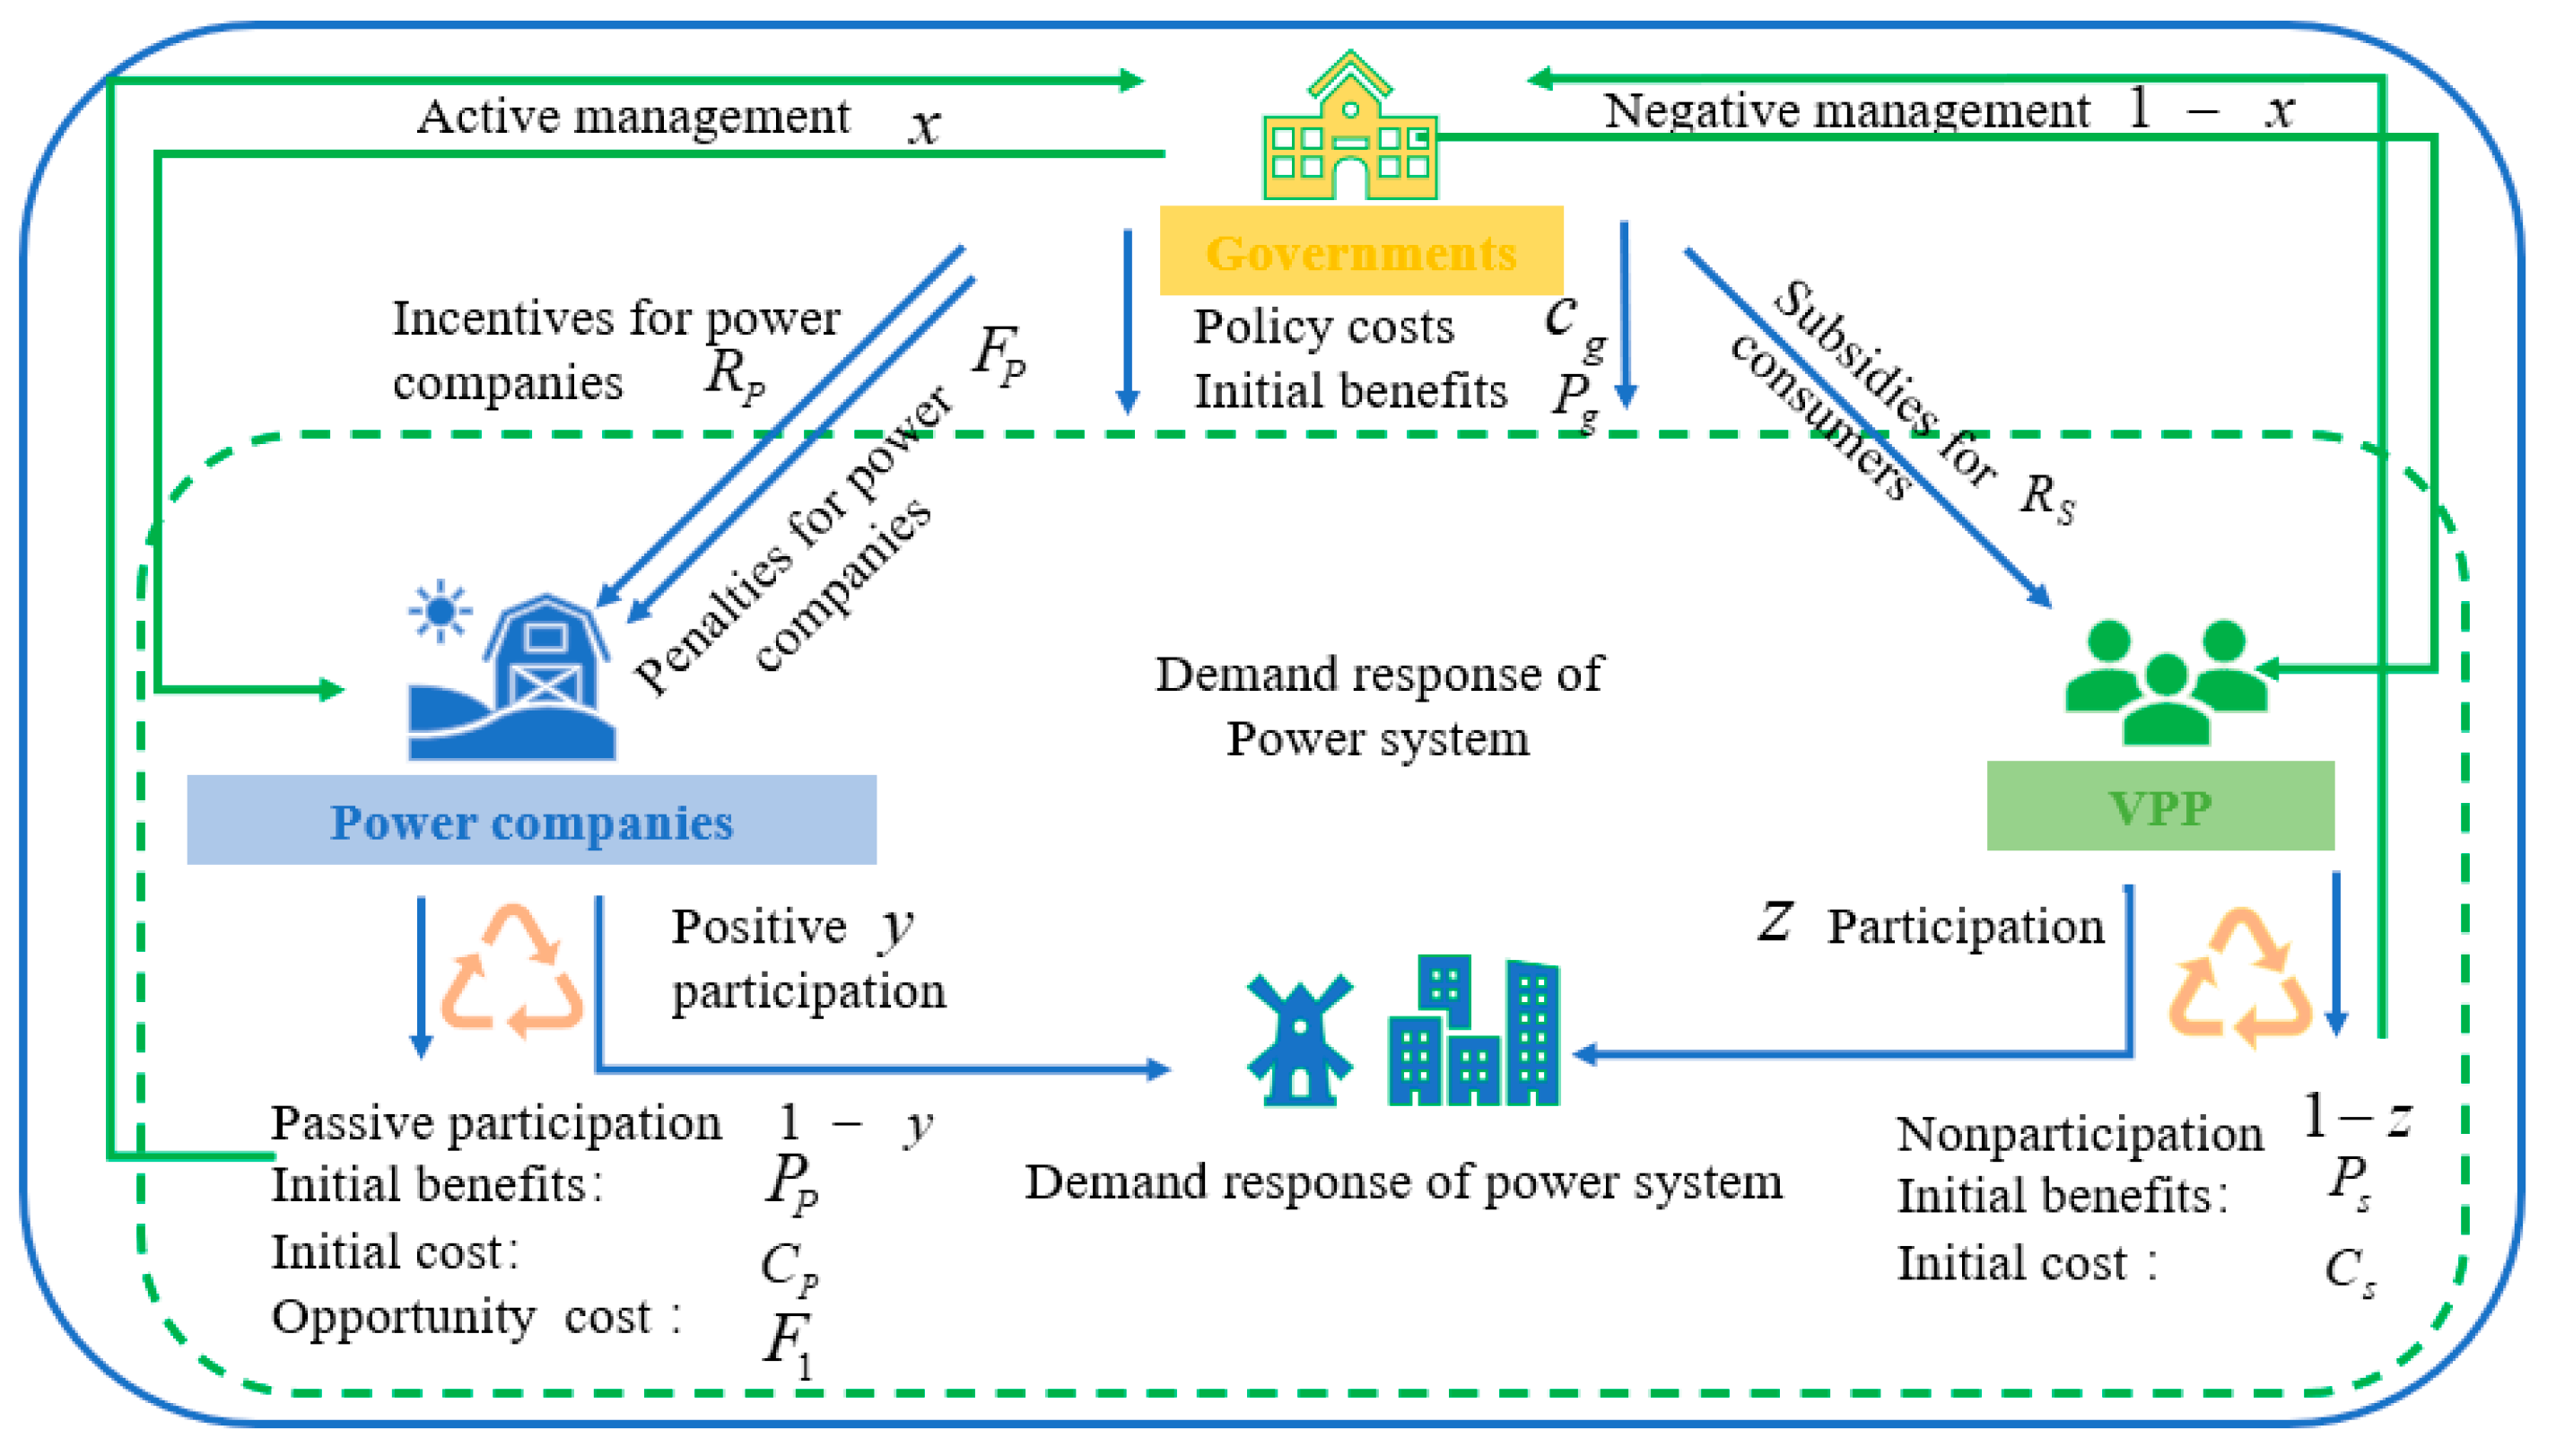
Figure 1. The behaviour relationship of the participants in the demand response of the power system.
Energies 16 04373 g001
Figure 2. A total research flowchart for each proposed algorithm of the demand response of the power system.
Energies 16 04373 g002
Figure 3. Evolutionary game path for the government’s electricity demand-side reform.
Energies 16 04373 g003
Figure 4. Evolutionary game path of power companies for electricity demand-side response.
Energies 16 04373 g004
Figure 5. Evolutionary game path of VPP’s behaviour for electricity demand-side response.
Energies 16 04373 g005
Figure 6. Evolutionary game path of electricity demand-side reform in Scenario 1.
Energies 16 04373 g006
Figure 7. Evolutionary game path of electricity demand-side reform in Scenario 2.
Energies 16 04373 g007
Figure 8. E 7 ( 0 , 1 , 1 ) .
Energies 16 04373 g008
Figure 9. E 8 ( 0 , 1 , 1 ) .
Energies 16 04373 g009
Figure 10. Trends in the impact of parameter C g 1 changes.
Energies 16 04373 g010
Figure 11. Trends in the impact of parameter R p and R s   changes.
Energies 16 04373 g011
Figure 12. Trends in the impact of parameter C p 1 changes.
Energies 16 04373 g012
Figure 13. Trends in the impact of parameter C s 1 changes.
Energies 16 04373 g013
Table 1. Model variables settings and explanations.
GovernmentPower Companies VPPs
C g Policy costs and initial benefits when the government chooses Strategy G 2 P p Initial benefits and initial costs when power companies choose strategy P 2 P s Initial benefit and initial cost strategies when VPPs choose strategy S 2
P g C p C s
C g 1 Management costs when the government chooses Strategy G 1 C p 1 Additional costs for power companies when choosing strategy P 2 C s 1 Additional costs when VPP chooses Strategy S 2
P g 1 Benefits when both power companies and VPPs are actively involved in choosing P 2 and S 1 P p 2 Incremental benefits when the power companies’ choice strategy P 1 and VPP choice strategy S 1 emerge P s 1 Incremental benefits when the power companies’ choice strategy P 1 and VPP choice strategy S 1 emerge
P g 2 Benefits when power companies choose P 1 and VPPs choose S 2 P p 1 Incremental benefits when power companies choose strategy P 1 and VPPs choose strategy S 2 P s 2 Incremental benefits when power companies’ choice strategy P 2 and VPP choice strategy S 1 emerge
F p Government penalties and incentives for power companies F l Opportunity costs for power companies when choosing strategy P 2 R s Government subsidies for VPP choice strategy S 1
R p
Table 2. Payment matrix for the government, power companies and VPPs.
GovernmentPower CompaniesVPP
S 1 ( z ) S 2 ( 1 z )
G 1 ( x ) P 1 y P g + P g 1 + P g 2 C g C g 1 R p R s P p + P p 2 C p C p 1 + R p P s + R s C s C s 1 + P s 1 P g + P g 2 C g C g 1 R p P p + P p 1 C p C p 1 + R p P s C s
P 2 ( 1 y ) P g + P g 2 C g C g 1 R p P p + P p 1 C p C p 1 + R p P s C s P g + P g 1 C g R s P p + P p 2 C p C p 1 P s + R s C s C s 1 + P s 1
G 2 ( 1 x ) P 1 y P g + F p C g C g 1 R s P p C p F l F p P s + R s C s C s 1 + P s 2 P g C g R s P p C p F l P s + R s C s C s 1 + P s 2
P 2 ( 1 y ) P g + F p C g C g 1 P p C p F l F p P s C s P g C g P p C p F l P s C s
Table 3. Eigenvalues of the power demand-response system.
Equilibrium PointsEigenvalue 1Eigenvalue 2Eigenvalue 3
E 1 ( 0 , 0 , 0 ) F p C g 1 P p 1 C p 1 + F l R s C s 1 + P s 2
E 2 ( 1 , 0 , 0 ) F p + C g 1 R p + F p + P p 1 C p 1 + F l P s 1 + R s C s 1
E 3 ( 0 , 1 , 0 ) R p C g 1 P p 1 + C p 1 F l R s C s 1 + P s 2
E 4 ( 0 , 0 , 1 ) F p C g 1 P p 2 C p 1 + F l R s + C s 1 P s 2
E 5 ( 1 , 1 , 0 ) R p + C g 1 R p F p P p 1 + C p 1 F l P s 1 + R s C s 1
E 6 ( 1 , 0 , 1 ) F p + C g 1 R p + F p + P p 2 C p 1 + F l P s 1 R s + C s 1
E 7 ( 0 , 1 , 1 ) P g 2 R p C g 1 P p 2 + C p 1 F l R s + C s 1 P s 2
E 8 ( 1 , 1 , 1 ) P g 2 + R p + C g 1 R p F p P p 2 + C p 1 F l P s 1 R s + C s 1
Table 4. Parameter assignment.
C g 1 F p P g 2 R p R s C p 1 P p 1 F l P p 2 P s 1 P s 2 C s 1
Scenario 1506050303030603080806050
Scenario 2306050101010603080806050
Disclaimer/Publisher’s Note: The statements, opinions and data contained in all publications are solely those of the individual author(s) and contributor(s) and not of MDPI and/or the editor(s). MDPI and/or the editor(s) disclaim responsibility for any injury to people or property resulting from any ideas, methods, instructions or products referred to in the content.