Article

Cluster Partition-Based Voltage Control Combined Day-Ahead Scheduling and Real-Time Control for Distribution Networks

State Key Laboratory of Operation and Control of Renewable Energy & Storage Systems, China Electric Power Research Institute, Beijing 100035, China
*
Author to whom correspondence should be addressed.
Energies 2023, 16(11), 4375; https://doi.org/10.3390/en16114375
Submission received: 9 April 2023 / Revised: 16 May 2023 / Accepted: 25 May 2023 / Published: 27 May 2023
(This article belongs to the Topic Distributed Energy Systems and Resources)

Abstract

:
Considering the possible overvoltage caused by high-penetration photovoltaics (PVs) connected to the distribution networks (DNs), a cluster partition-based voltage control combined day-ahead scheduling and real-time control for distribution networks is proposed. Firstly, a community detection algorithm utilizing a coupling quality function is introduced to divide the PVs into clusters. Based on the cluster partition, day-ahead scheduling (DAS) is proposed with the objective of minimizing the operating costs of PVs, as well as the on-load tap changer (OLTC). In the real-time control, a second-order cone programming (SOCP) model-based real-time voltage control (RTVC) strategy is drawn up in each cluster to regulate the PV inverters, and this strategy can correct the day-ahead scheduling by modifications. The proposed strategy realizes the combination of day-ahead scheduling and real-time voltage control, and the optimization of voltage control can be greatly simplified. Finally, the proposed method is applied to a practical 10 kV feeder to verify its effectiveness.

1. Introduction

With the rapid development of renewable energy industries, large-scale distributed PVs and energy storage are being integrated into distribution networks (DNs). The overvoltage of DNs caused by photovoltaics (PVs) is becoming more and more serious [1], which not only limits the hosting capacity of PVs, but also affects the stable operation of DNs [2].
To deal with the overvoltage of DNs, numerous studies have been performed on voltage control. Reference [3] proposes a model predictive-based voltage control strategy. This strategy utilizes the OLTC, static synchronous compensator, and PV inverters to maintain the nodal voltage within the operating limits. Additionally, the demand response and conservation voltage reduction are also explored under this strategy for voltage control. Based on the adaptive droop control method and the centralized control method, a voltage control strategy is proposed for DNs in [4]. In the centralized control strategy, bus injection power measurements are utilized to optimize the operation voltage source converters. The capacity margin constraint of voltage source converters is formed to deal with unexpected fluctuations, such as loads and renewable energies. Additionally, an adaptive droop control strategy is also proposed to deal with voltage fluctuation. To carry out voltage regulation, an effective volt/var control method is proposed in [5]. This method is implemented on a practical Australian feeder, and the effectiveness of the method is proved in regulating the voltage level. These above methods for voltage regulation mainly utilize a centralized method, which is suitable for DNs with small nodal numbers. However, when large-scale PVs connect to DNs, the number of controlled nodes increases massively, and the PV locations are also comparatively decentralized, and thus the control variables for the voltage regulation of DNs will be very large. If the voltage regulation is still controlled in a centralized way, the computing time of voltage control will not be satisfied due to the complicated control process.
To deal with the complicated voltage regulation, regional voltage control has become a useful method. In the regional voltage regulation, the cluster partition (or named network partition) should first be carried out. The reactive-voltage sensitivity matrix is utilized in [6] to describe the electrical coupling degree among nodes, which is used to carry out the cluster partition. The output characteristics, spatial location, and response mode of PVs, as a partition index system of virtual clusters, are provided in [7]. According to the state of tie switch, the optimal cluster partition by an improved genetic algorithm is proposed in [8]. The Tabu search algorithm is adopted to carry out the network partition in [9]. However, this algorithm may give an inaccurate result, because the algorithm cannot automatically form the optimal number of clusters. When the DN is divided into several clusters, the regional voltage regulation can be applied. The alternating direction method of multipliers (ADMM) is utilized to realize regional voltage regulation between downstream and upstream clusters in [10]. However, the coordination among different clusters is ignored. A regional voltage regulation strategy of “Firstly maximize reactive power control, and then minimize active power curtail” is proposed in [11]. The regulating process of the strategy is simplified, but the cooperation with other voltage-regulating equipment is ignored, such as OLTC. With large-scale PVs becoming connected to DNs, there is an urgent need to provide an effective regional voltage regulation strategy. Therefore, establishing how to realize cooperation with voltage-regulating equipment and the coordination among different clusters deserves in-depth research.
In light of the abovementioned findings, a cluster partition-based voltage control method is proposed for distribution networks, which combined day-ahead scheduling and real-time control. The main contributions of this paper are summarized as follows:
(1)
A coupling quality function is proposed as the cluster index of DNs, which can describe the electrical coupling degree among nodes. Additionally, based on the community-finding algorithm, a fast cluster partition algorithm is proposed to divide the PVs into a number of clusters.
(2)
Based on the cluster partition, a DAS strategy is proposed for the OLTC and PV inverters, which is optimized with the objective of minimizing the operation costs of each cluster.
(3)
Based on the cluster partition, an SOCP-based model for the RTVC strategy is drawn up in each cluster. Additionally, the RTVC strategy can correct the day-ahead scheduling with the objective of minimizing the output deviation of PVs from the day-ahead scheduling.
The remainder of this paper is organized as follows. A coupling quality function-based cluster partition strategy is proposed in Section 2. A cluster partition-based DAS strategy is introduced in Section 3. In Section 4, an RTVC strategy based on cluster partition is established. In Section 5, the case study is analyzed, and the conclusions are described in Section 6.

2. Coupling Quality Function-Based Cluster Partition Method

2.1. Coupling Quality Function of Cluster Partition

A community-finding algorithm provides a useful method for the partitioning of complex networks [12,13]. Different from other partition methods, a community-finding algorithm can automatically generate the optimal numbers of clusters without setting in advance. In order to realize the reasonable partition of DNs, a coupling quality function is proposed as the cluster partition index of DNs. The coupling quality function is composed of the inner density index and the outer density index. The inner density index Ki and the outer density index Ko are defined as follows, where Ki represents the coupling quality among nodes within a cluster, and Ko represents the coupling quality among nodes between different clusters.
(1)
Inner Density Index:
K i = α = 1 T ( i π α j π α A i j ) 2 ( i = 1 N j = 1 N A i j ) 2 · α = 1 T | N α | 2
where T is the total number of clusters. πα is the α-th cluster. N represents the number of nodes in the DN. Nα is the number of nodes in the α-th cluster. Aij is the power–voltage sensitivity weight between node i and node j. Aij can describe the coupling quality between node i and node j. Aij can be obtained as follows:
A i j = Z i j QU + Z j i QU + Z i j PU + Z j i PU 4
where Z i j QU , Z i j PU , Z j i QU and Z j i PU represent the ij-th and ji-th elements of matrix ZQU, respectively. ZQU can be obtained from the Jacobian matrix [14,15]:
[ Δ δ Δ U ] = [ Z P δ       Z Q δ Z PU       Z QU ] [ Δ P Δ Q ]
where Δδ is the matrix of variation in phase angle. ΔU is the matrix of variation in voltage magnitude. Z and Z represent the sensitivity matrix of the phase angle to active and reactive power injection, respectively. ZPU and ZQU represent the sensitivity matrix of the voltage magnitude to active and reactive power injection, respectively. ΔP and ΔQ represent the matrix of variation in active and reactive power injection.
The numerator in (1) is the sum of nodal coupling quality in the same cluster. The first item of the denominator in (1) is the sum of nodal coupling quality in the whole network. In addition, the second item of the denominator is utilized to balance the cluster size under current partitioning, which can generate a more reasonable cluster partitioning result. From (1), it can be seen that Ki ranges from 0 to 1, and the higher the value of Ki, the stronger the coupling quality.
(2)
Outer Density Index:
K o = { α = 1 T ( i π α j π α A i j ) 2 ( i = 1 N j = 1 N A i j ) 2 · α = 1 T | N α | · | N N α |             N α < N                                                 1                                                       N α = N          
The numerator in (4) is the sum of nodal coupling quality among different clusters. The second item of the denominator is also used to balance the cluster size. It should be noted that if the whole DN is treated as one cluster, then Ko is equal to 1. Therefore, it can be seen that Ko ranges from 0 to 1, and a smaller Ko means that nodes have a poor coupling quality with each other in the different clusters.
Based on the above inner density index and the outer density index, The coupling quality function KC is defined as follows:
K C = 1 2 ( K i + 1 K o )
KC takes values in the range of (0,1). As KC increases, the nodes belonging to the same clusters have a strong coupling quality, while the nodes belonging to different clusters have a poor coupling quality. This indicates that the higher the KC, the more reasonable the cluster partitioning result is.

2.2. Fast Cluster Partition Strategy

In a community-finding algorithm, the nodal aggregation is utilized to form the community structures according to social or physical relations [16]. To form a reasonable community (or a cluster), the nodes with a strong coupling quality should belong to a same cluster, while the nodes in different clusters should have a poor coupling quality with each other. The community (or cluster) should reflect the structural characteristics (e.g., the resistance and reactance of lines) of the DNs, and the nodal relations (e.g., power–voltage sensitivity) of the DNs should be revealed [17,18]. Based on the community-finding algorithm, a fast cluster partition algorithm is utilized to find the community structure and the DN to clusters. The steps of the fast cluster partition algorithm are as follows:
Step1: Each node in the DNs is treated as one cluster. The initial coupling quality function KC_0 is calculated according to (5).
Step2: A nodal pair (i,j) is chosen randomly to form a new cluster. The coupling quality function KC_1 is calculated. Additionally, ΔKC = KC_1KC_0 is also calculated.
Step3: Step 2 is carried out among all nodal pairs. The selected nodal pair with the highest ΔKC is defined as the final new cluster, and the nodal pair is regarded as a new node.
Step4: Repeat Steps 1–3. When the coupling quality function value of all nodal pairs does not increase, the partition process is stopped. The cluster partition with the highest KC is the final optimal partition result.
After the implementation of the cluster partition, the PVs then can be divided to different clusters. It should be noted that the proposed strategy is a dynamic partition scheme, and when the weather or the network changes, a new cluster partition will be performed by the proposed strategy.

3. The Model of the DAS Strategy

3.1. Objective Function

It is assumed that the DN is partitioned into T clusters by the fast cluster partition strategy. Due to the poor coupling quality in different clusters, the voltage control in each cluster can be carried out independently. In this paper, the voltage of the DN is regulated mainly by PV inverters, as well as OLTC. The objective functions of the DAS strategy in cluster α can be established as follows:
min     f α , t D = t = 0 24 h ( C α , t OLTC + C α , t LOSS + C α , t PV )
where
C α , t OLTC = M OLTC i = 1 N α OLTC | t a p i , t OLTC t a p i , t 1 OLTC | ,     i π α
C α , t LOSS = M GRID ( i , j ) π α I i j , t 2 r i j
C α , t PV = i = 1 N α PV ( M PV , P P i , t PV , c + M PV , Q Q i , t PV ) ,     i π α
where f α , t D is the total cost of voltage control in cluster α at time t. C α , t OLTC is the controlling cost of OLTC in cluster α at the i-th node at time t. C α , t LOSS is the grid loss cost in cluster α at time t. C α , t PV is the controlling cost of a PV inverter in cluster α at the i-th node at time t. MOLTC is the cost of maintenance for OLTC. MGRID is the cost coefficient in grid loss. MPV,P is the cost coefficient in regulating the active power of PVs. MPV,Q is the cost-coefficient in regulating the reactive power of inverters. N α OLTC is the number of OLTCs in cluster α. N α PV is the number of PVs in cluster α. t a p i , t OLTC and t a p i , t - 1 OLTC represent the OLTC tap position at node i at time t and time t−1, respectively. Iij,t represents the current magnitude at time t in line i–j. rij is the resistance in line i–j. P i , t PV , c represents the regulated active power of PVs at node i at time t. Q i , t PV represents the regulated reactive power of the PV inverter at node i at time t.

3.2. Constraints of the DAS Strategy

(1)
OLTC constraints:
1 24 h | t a p i , t OLTC t a p i , t 1 OLTC | T O max OLTC
t a p min OLTC t a p i , t OLTC t a p max OLTC
where Equation (10) denotes the limit of the number of tap changes for the OLTC. Equation (11) denotes the tap-position limits of the OLTC. T O max OLTC is the number of tap changes allowed in a day. t a p max OLTC and t a p min OLTC represent the minimum and maximum tap position of the OLTC, respectively.
(2)
PV constraints:
0 P i , t PV , c P i , t PV , f
Q i PV , max = tan ( acos ( 0.95 ) ) ( P i , t PV , f P i , t PV , c )
Q i PV , max Q i , t PV , max Q i PV , max
where Equation (12) denotes the PV output limits. Equation (13) denotes the power factor limits of PV inverters. Equation (14) denotes the regulated reactive power limits of PV inverters. P i , t PV is the predicted PV outputs at node j at time t. Q i PV , max represents the maximum allowable regulated reactive power of PV inverter at i-th node.
(3)
Network constraints:
P j , t PV , f P j , t PV , c P j , t L = l Φ ( j ) P j l , t i Λ ( j ) ( P i j , t r i j I i j , t 2 ) ,       i , j , l π α
Q j , t PV Q j , t L   = z Φ ( j ) Q j z , t i Λ ( j ) ( Q i j , t x i j I i j , t 2 )       i , j , z π α
U j , t 2 = U i , t 2 2 ( r i j P i j , t + x i j Q i j , t ) + ( r i j 2 + x i j 2 ) I i j , t 2       i , j π α
0.95 U i , t 1.05
where Equation (15) represents the active power balance constraints. Equation (16) is the reactive power balance constraints. Equation (17) is the nodal voltage relationship limits. Equation (18) is the nodal voltage magnitude limits. P j , t L and Q j , t L are the demands of active power and reactive power at node j at time t, respectively. Pij,t and Qij,t are the active power and reactive power through line i–j at time t, respectively. Ui,t is the voltage-magnitude at node j at time t. xij is the reactance in line i–j. Φ(j) is the child bus set of node j. Λ(j) is the parent bus set of node j. To solve the proposed model, the improved particle swarm optimization algorithm (IPSO) is utilized to carry out the optimization; the detailed introduction of IPSO can be found in [19].

4. DAS Combined RTVC Strategy

4.1. The Model of RTVC Strategy

With large-scale PVs connecting to DNs, the PV output variation will significantly influence the voltage profile of DNs. If the voltage regulation only relies on the DAS strategy, the forecast errors in PV output may lead to the overvoltage of DNs. However, if the DAS strategy is modified by a RTVC strategy, then the economic operation of the DNs can be maintained, and the negative influence of PV output variation can be avoided. It should be noted that the tap changes of OLTC cannot exceed the allowed number in a day, and OLTC cannot operate frequently in a short time, but the PV inverters do not have these problems. Then, the PV inverters are utilized to carry out the RTVC strategy. However, for DNs with high-penetration PVs, the scale of PVs is very large, and the PV locations are decentralized, and so the control variables in the traditional centralized method become very large, meaning that the optimization process becomes too complicated to implement, which cannot satisfy the RTVC requirements. To solve the above problems, this work proposed an SOCP-based RTVC strategy under cluster partition, and the objective function of the strategy in cluster α can be established as follows:
min     f α , t R = i = 1 N α P V ( M PV , P ( P i , t PV , f P i , t PV , real ) + M PV , Q Q i , t PV , real ) ,     i π α
where P i , t PV , real is the optimized PV output at the i-th node at time t. Q i , t PV , real is the optimized reactive power of PV inverters at the i-th node at time t. The objective function of the strategy is to minimize the controlling cost of PV inverter in cluster α. The model is subjected to the constraints (12)–(16), (20) and the following constraints:
{ P i j , t 2 + Q i j , t 2 = i i j , t u i , t U i , t 2 = u i , t I i j , t 2 = i i j , t 2 P i j , t 2 Q i j , t i i j , t u i , t 2 i i j , t + u i , t ,       i , j π α
P j , t PV , f - P j , t PV , c P j , t L = l Φ ( j ) P j l , t i Λ ( j ) ( P i j , t r i j i i j , t ) ,       i , j , l π α
Q j , t PV Q j , t L   = z Φ ( j ) Q j z , t i Λ ( j ) ( Q i j , t x i j i i j , t )       i , j , z π α
u j , t = u i , t 2 ( r i j P i j , t + x i j Q i j , t ) + ( r i j 2 + x i j 2 ) i i j , t       i , j π α
where Ui,t is the squared voltage-magnitude at node i at time t. iij,t is the squared current-magnitude in line i–j at time t. It is shown in the model that the objective function, as well as the constraints, are standard second-order cones or linear [16]. The PV output and the regulated reactive power of PV inverters are optimized in each cluster, and the model can be solved by the CPLEX solver.

4.2. Implement of the DAS Combined RTVC Strategy

As the installation of PVs continues to expand, voltage control will become more and more complicated due to the large-scale and decentralized installation of PVs. Taking the advantages of cluster partition-based voltage control into account, the DAS strategy is proposed to maintain the economic operation of DNs in this work. Additionally, an SOCP-based RTVC scheme is proposed to rapidly correct the DAS by optimizing the reactive power and the active power of PV inverters to prevent the overvoltage caused by PV output variation. The flowchart of the proposed DAS combined RTVC strategy for DNs is shown in Figure 1, and the steps of the strategy are as follows:
Step 1: The forecasted data are obtained, and the cluster partition is carried out using (5).
Step 2: The DAS is obtained.
Step 3: The control results under DAS are sent to the OLTC and PV inverters.
Step 4: In order to verify that the proposed method can deal with the overvoltage of DNs, data are collected by the remote terminal unit (RTU).
Step 5: When the nodal voltage at time t exceeds the normal range under the control command of RTVC, then Step 6 is carried out. Elsewise, the voltage control process is stopped.
Step 6: The cluster partition at time t is obtained from DAS, and the RTVC is carried out to modify the DAS.
Step 7: The control results of RTVC are sent to PV inverters, and the voltage control process is stopped.

5. Case Study

5.1. Case Study System

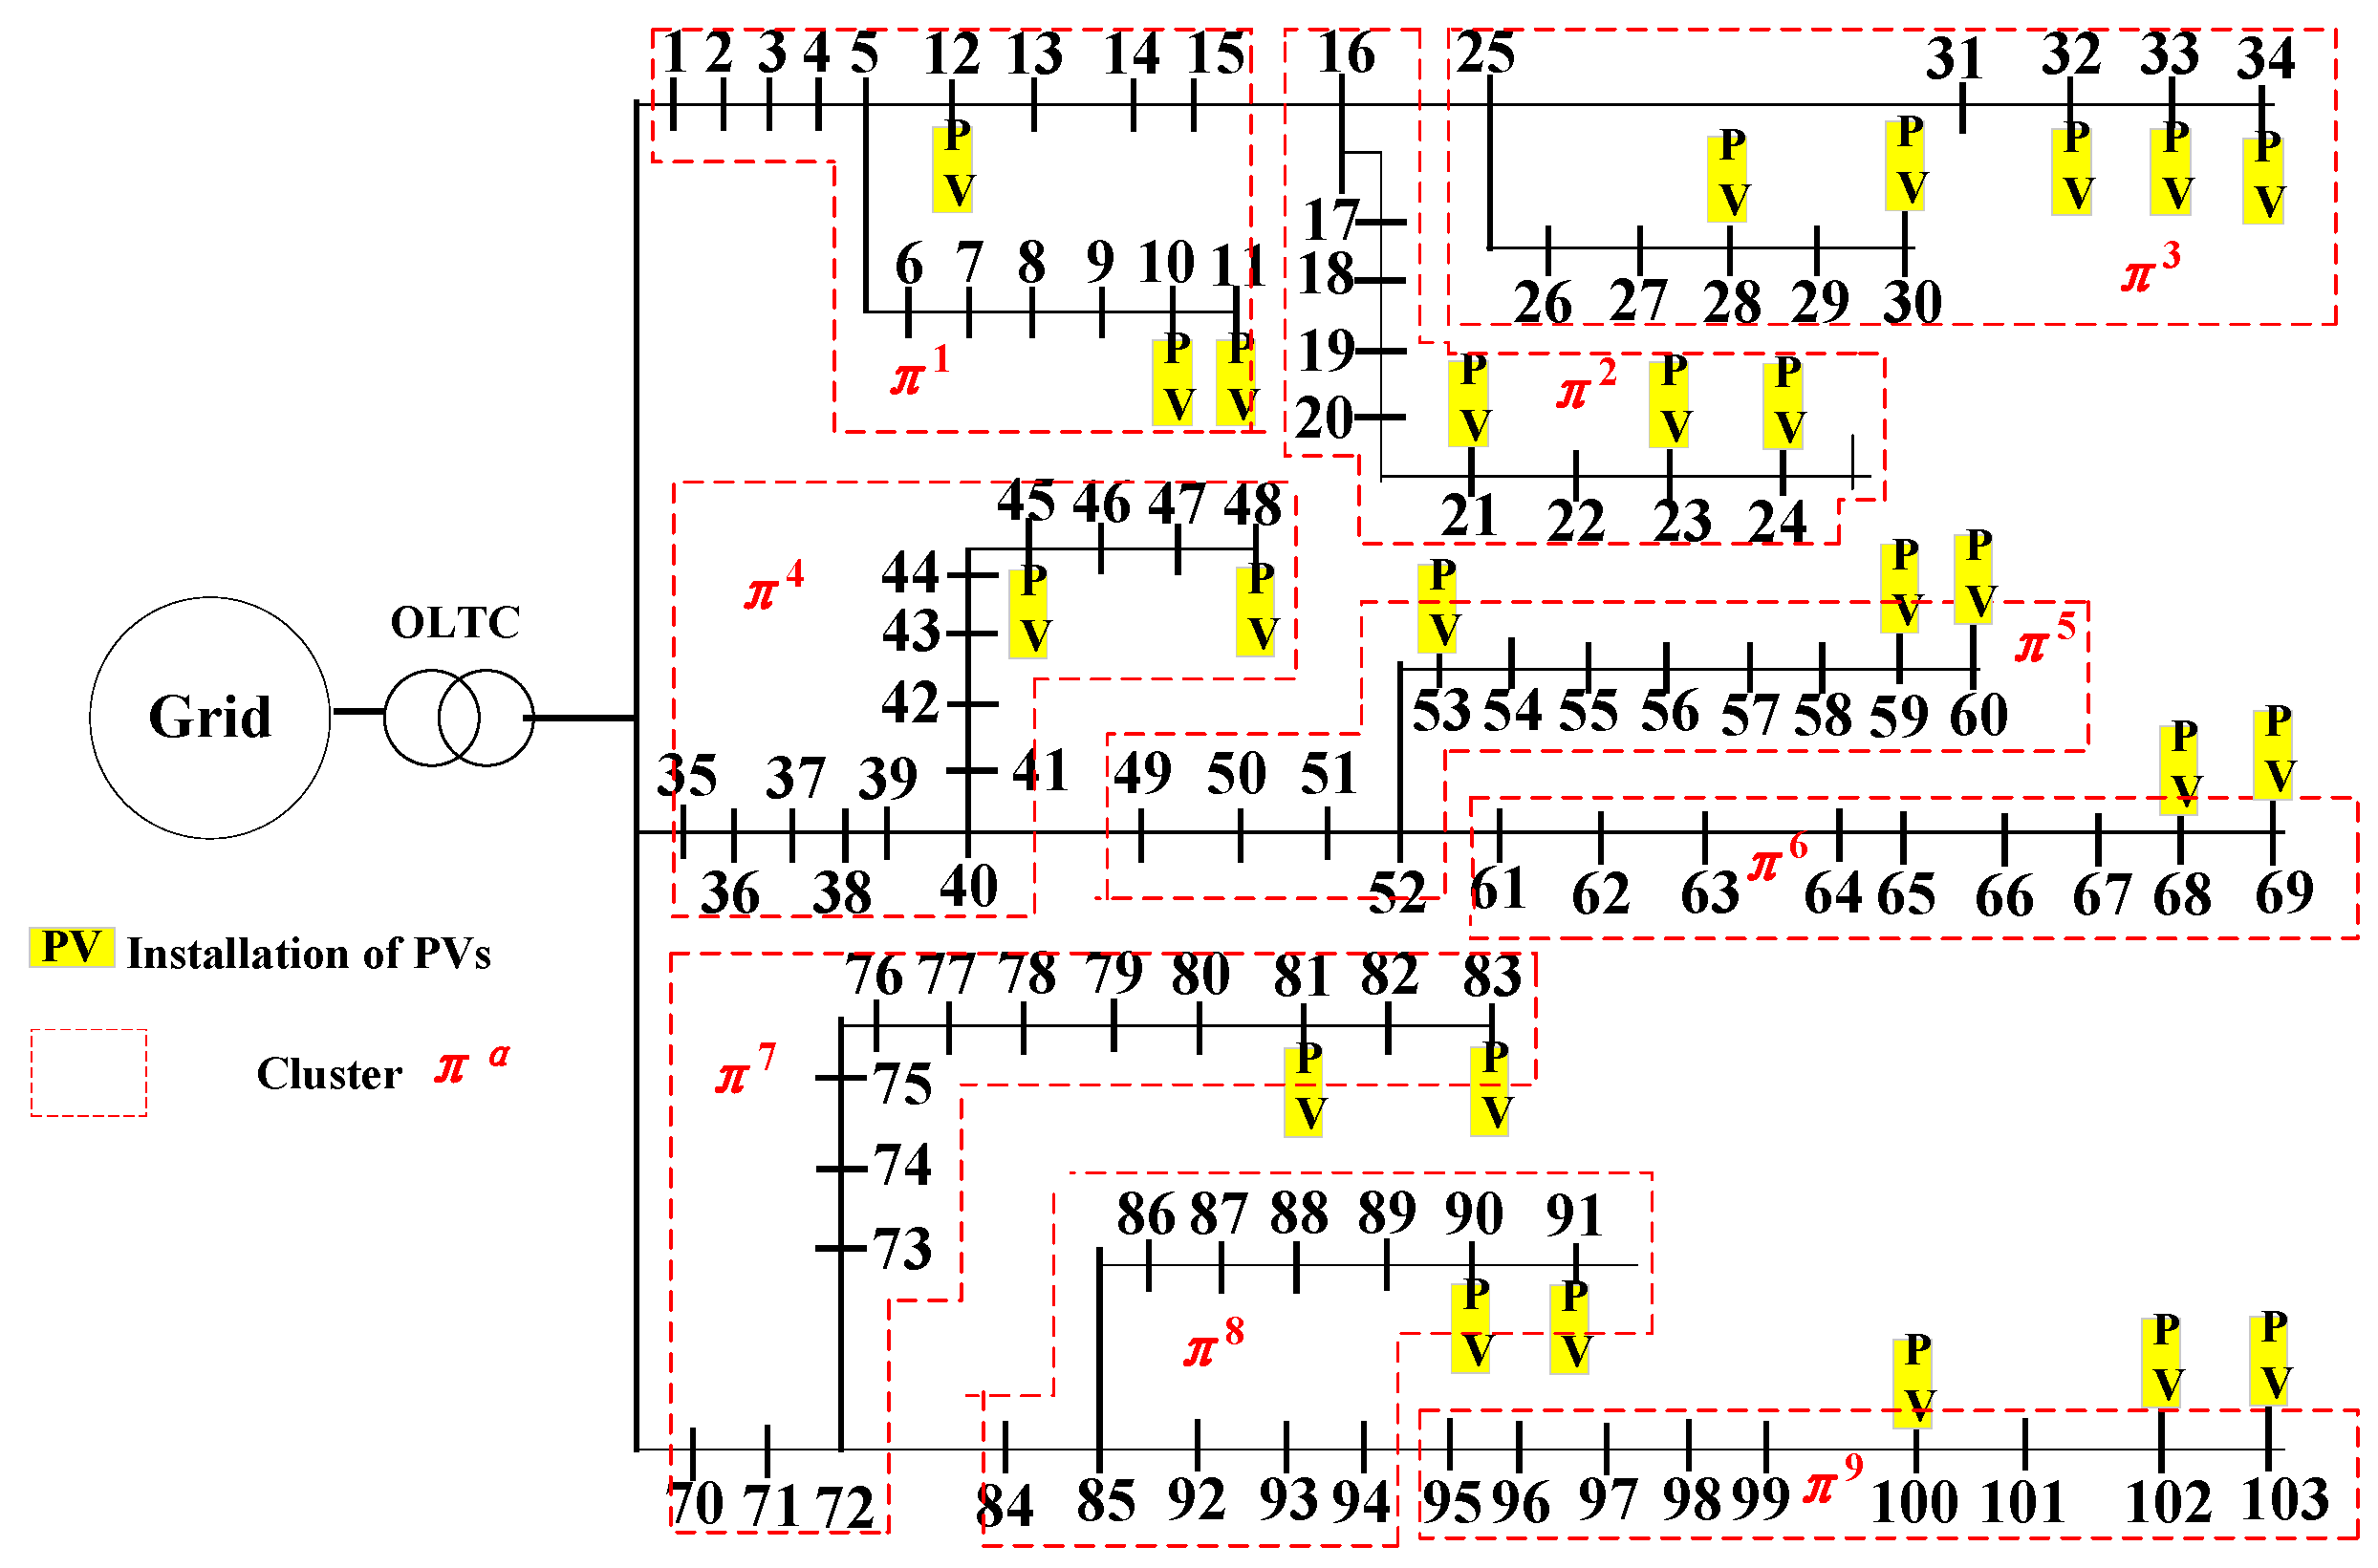
An actual radial 10 kV feeder in China is utilized to analyze the proposed method. The feeder is three-phase balanced, and there are 103 nodes in the feeder. In the feeder, the total load is 22.8 MVA, and the total voltage of the installed PVs is 13.2 MW. The safe nodal voltage ranges from 0.95 p.u. to 1.05 p.u. in the feeder. The grid structure of the feeder is displayed in Figure 2.
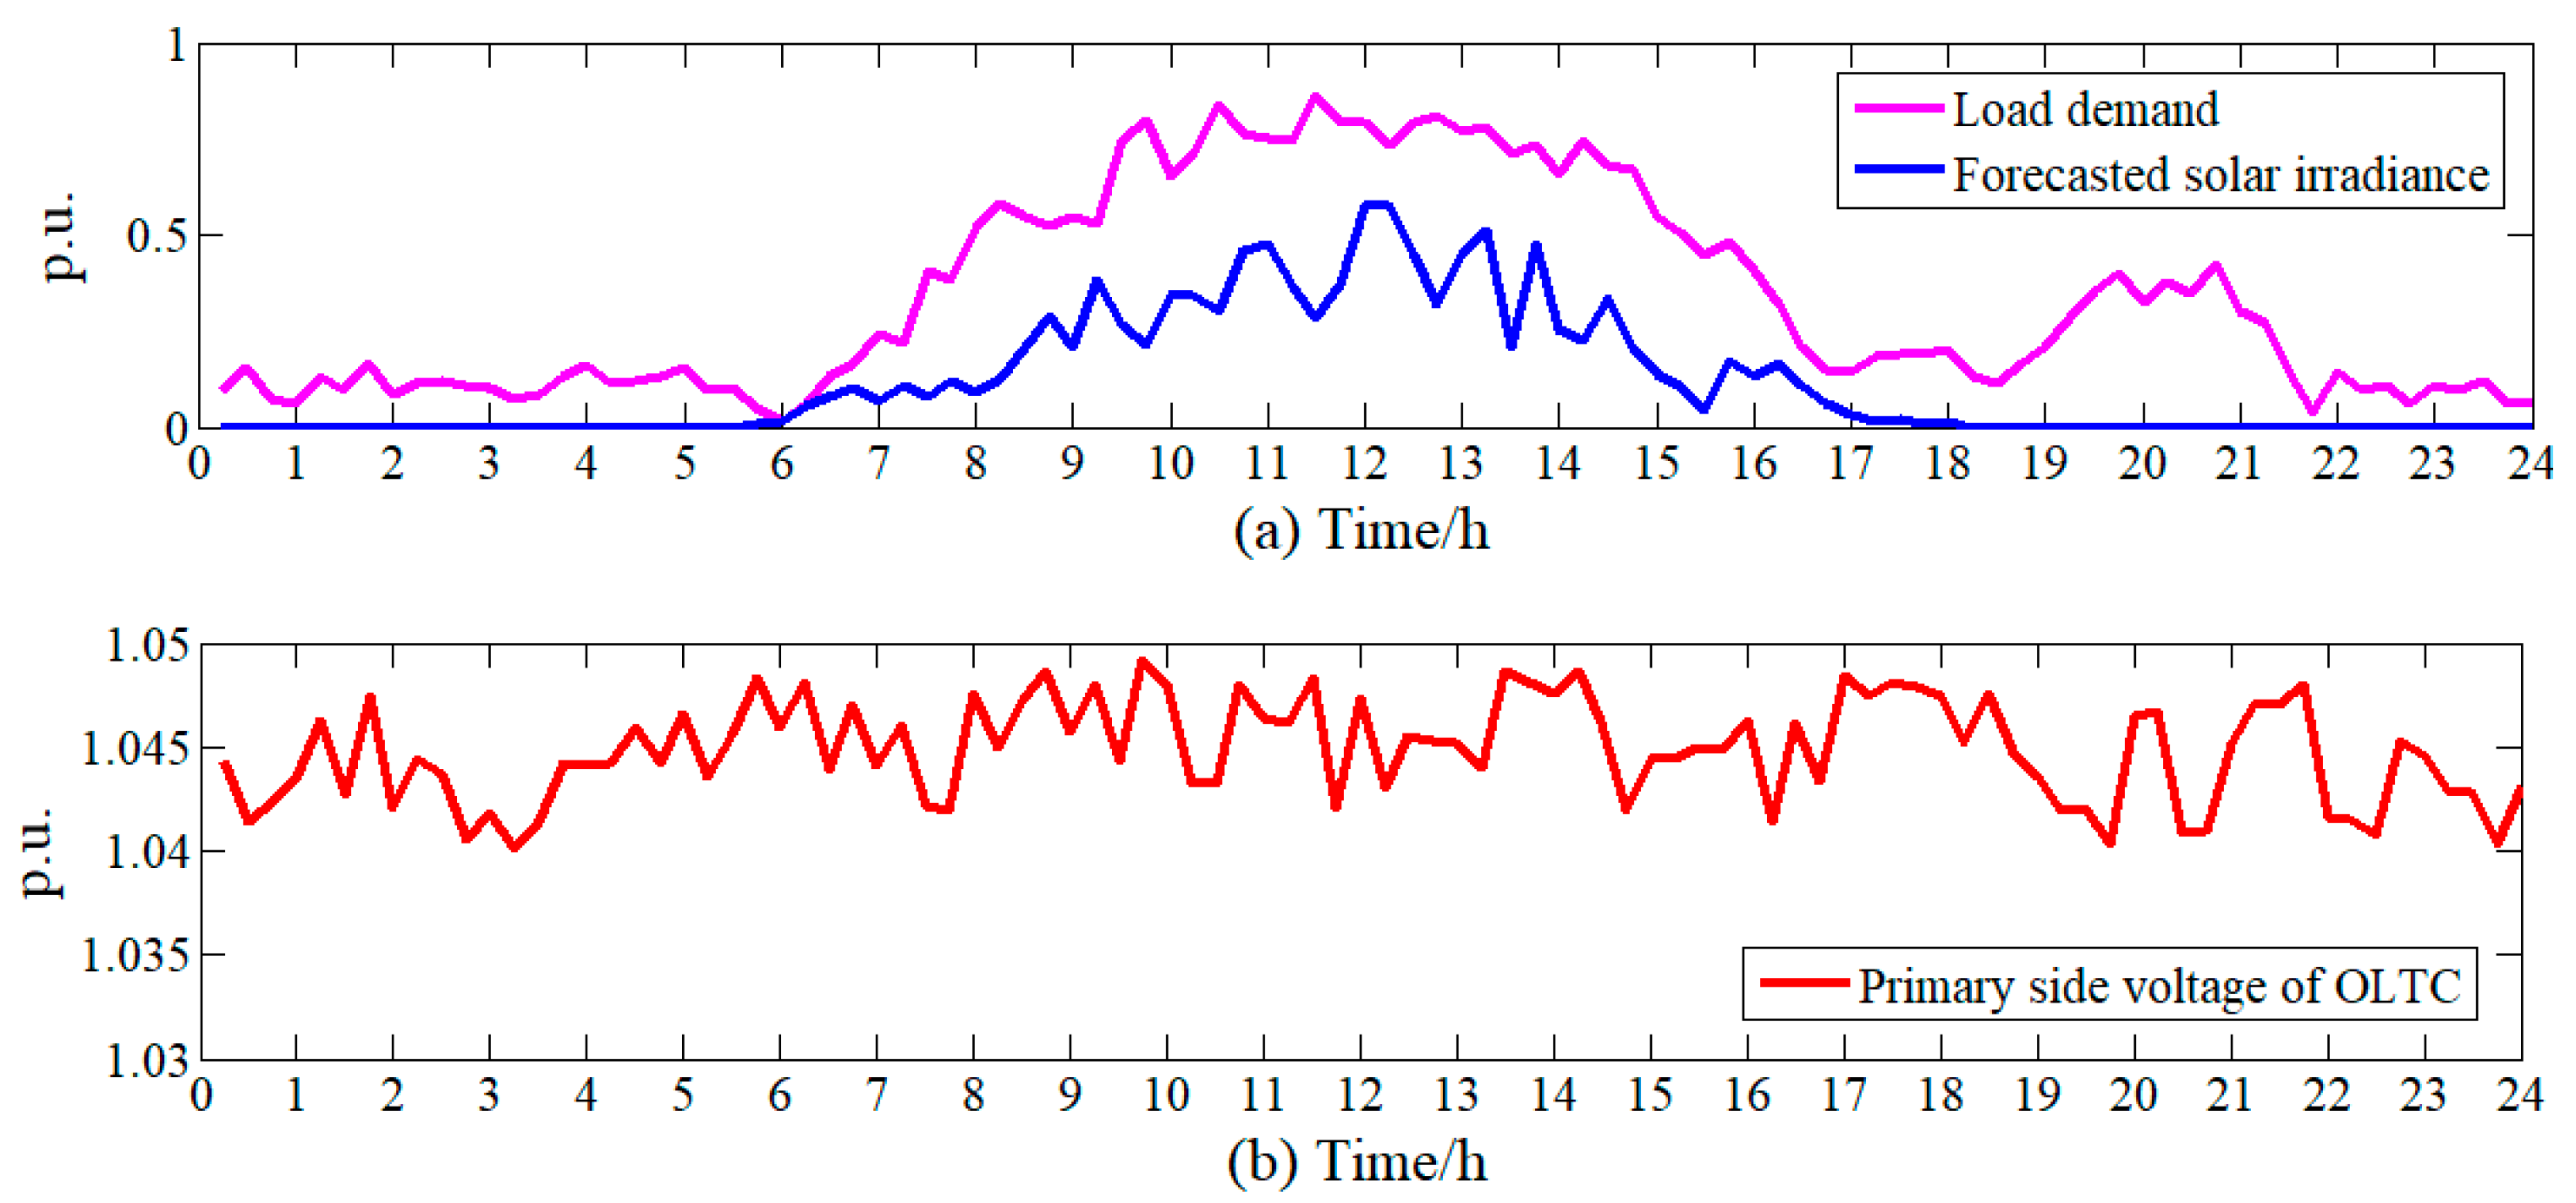
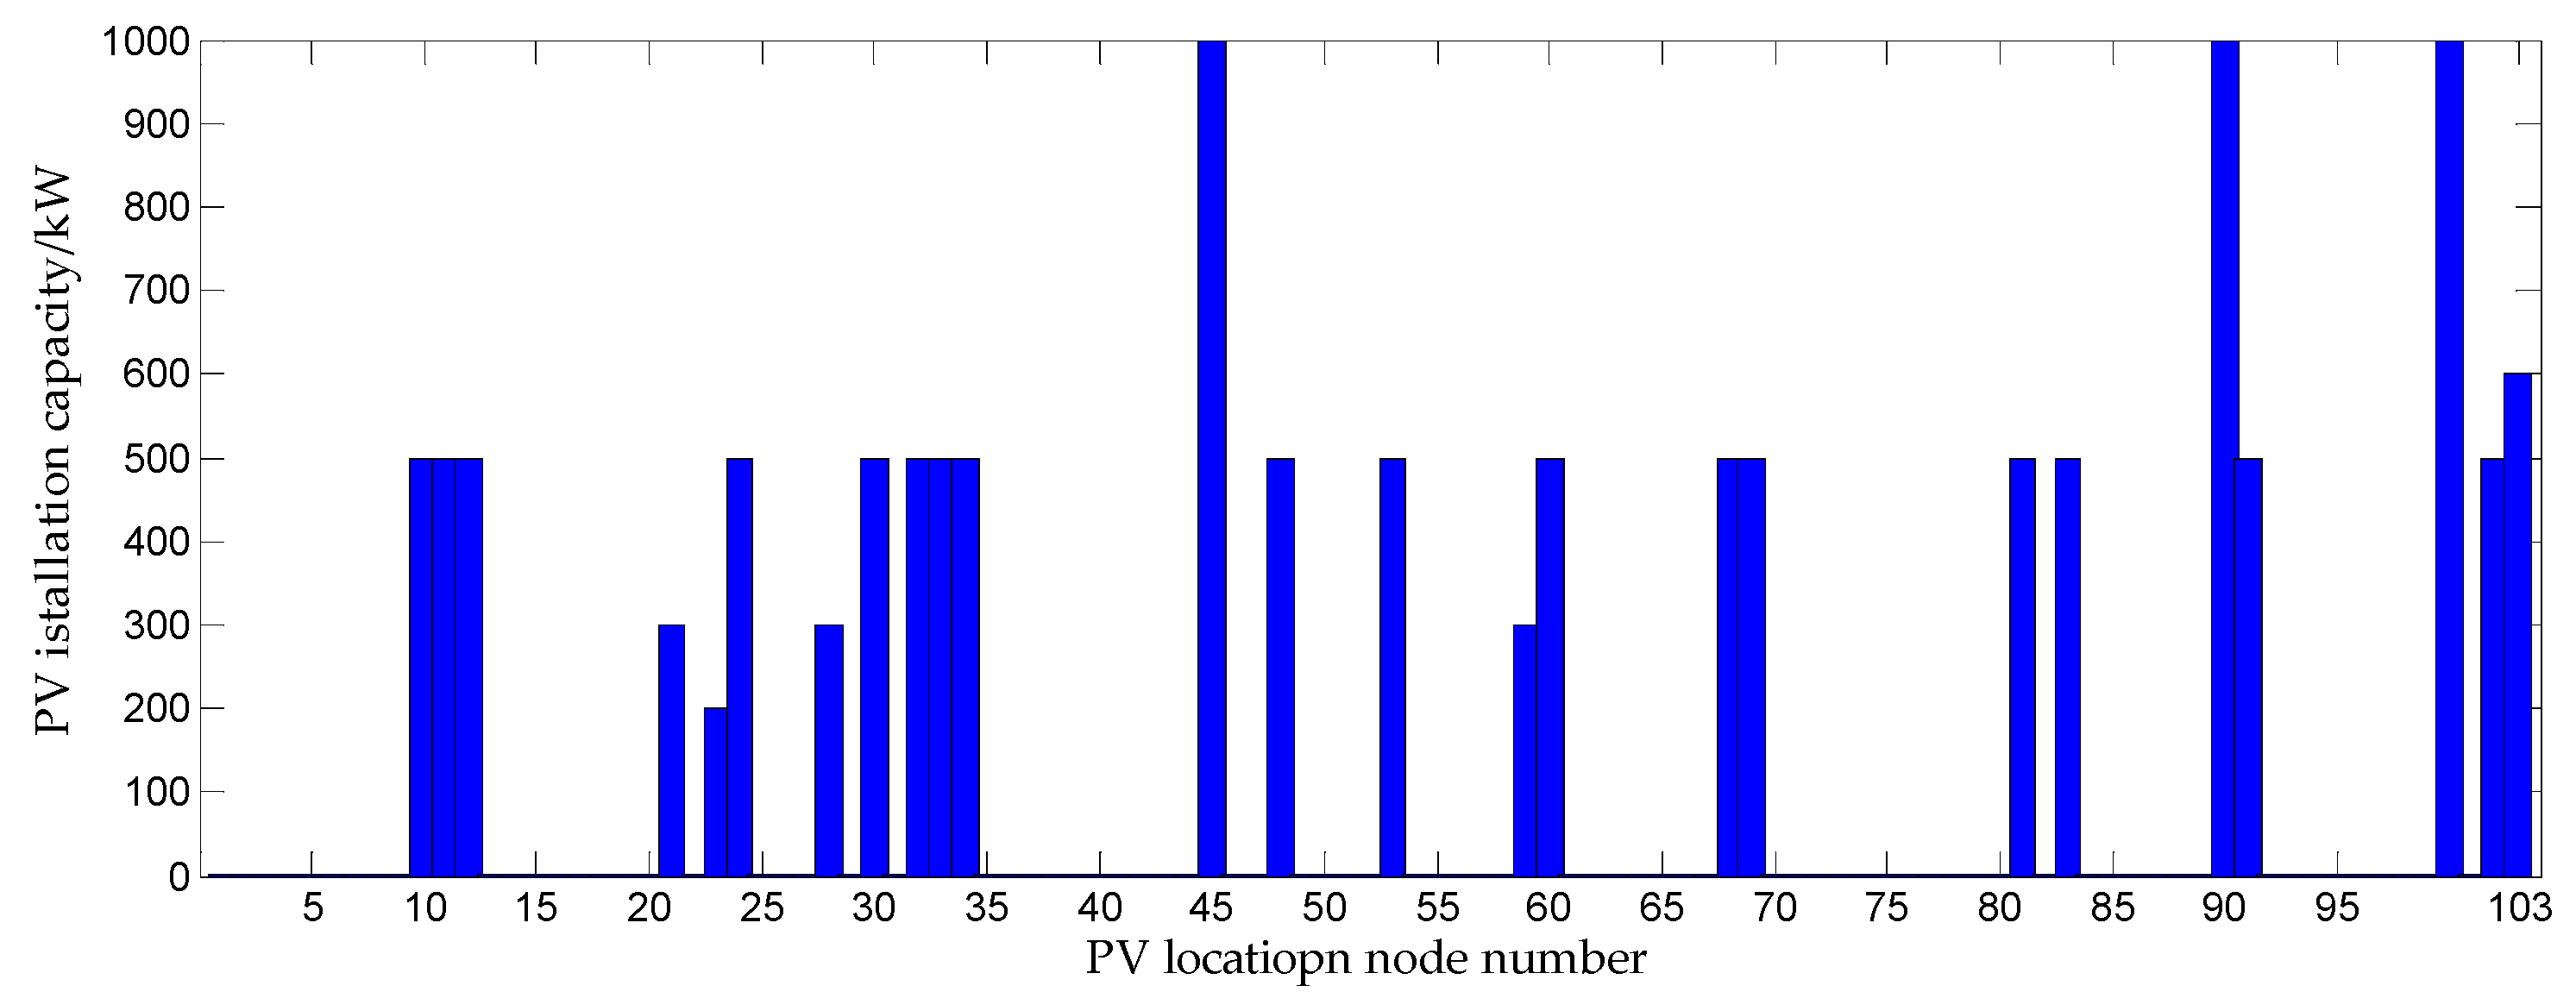
The load demand and the forecasted solar irradiance are shown in Figure 3a. The primary-side voltage in the OLTC is given in Figure 3b. Each installed PV capacity is shown in Figure 4.
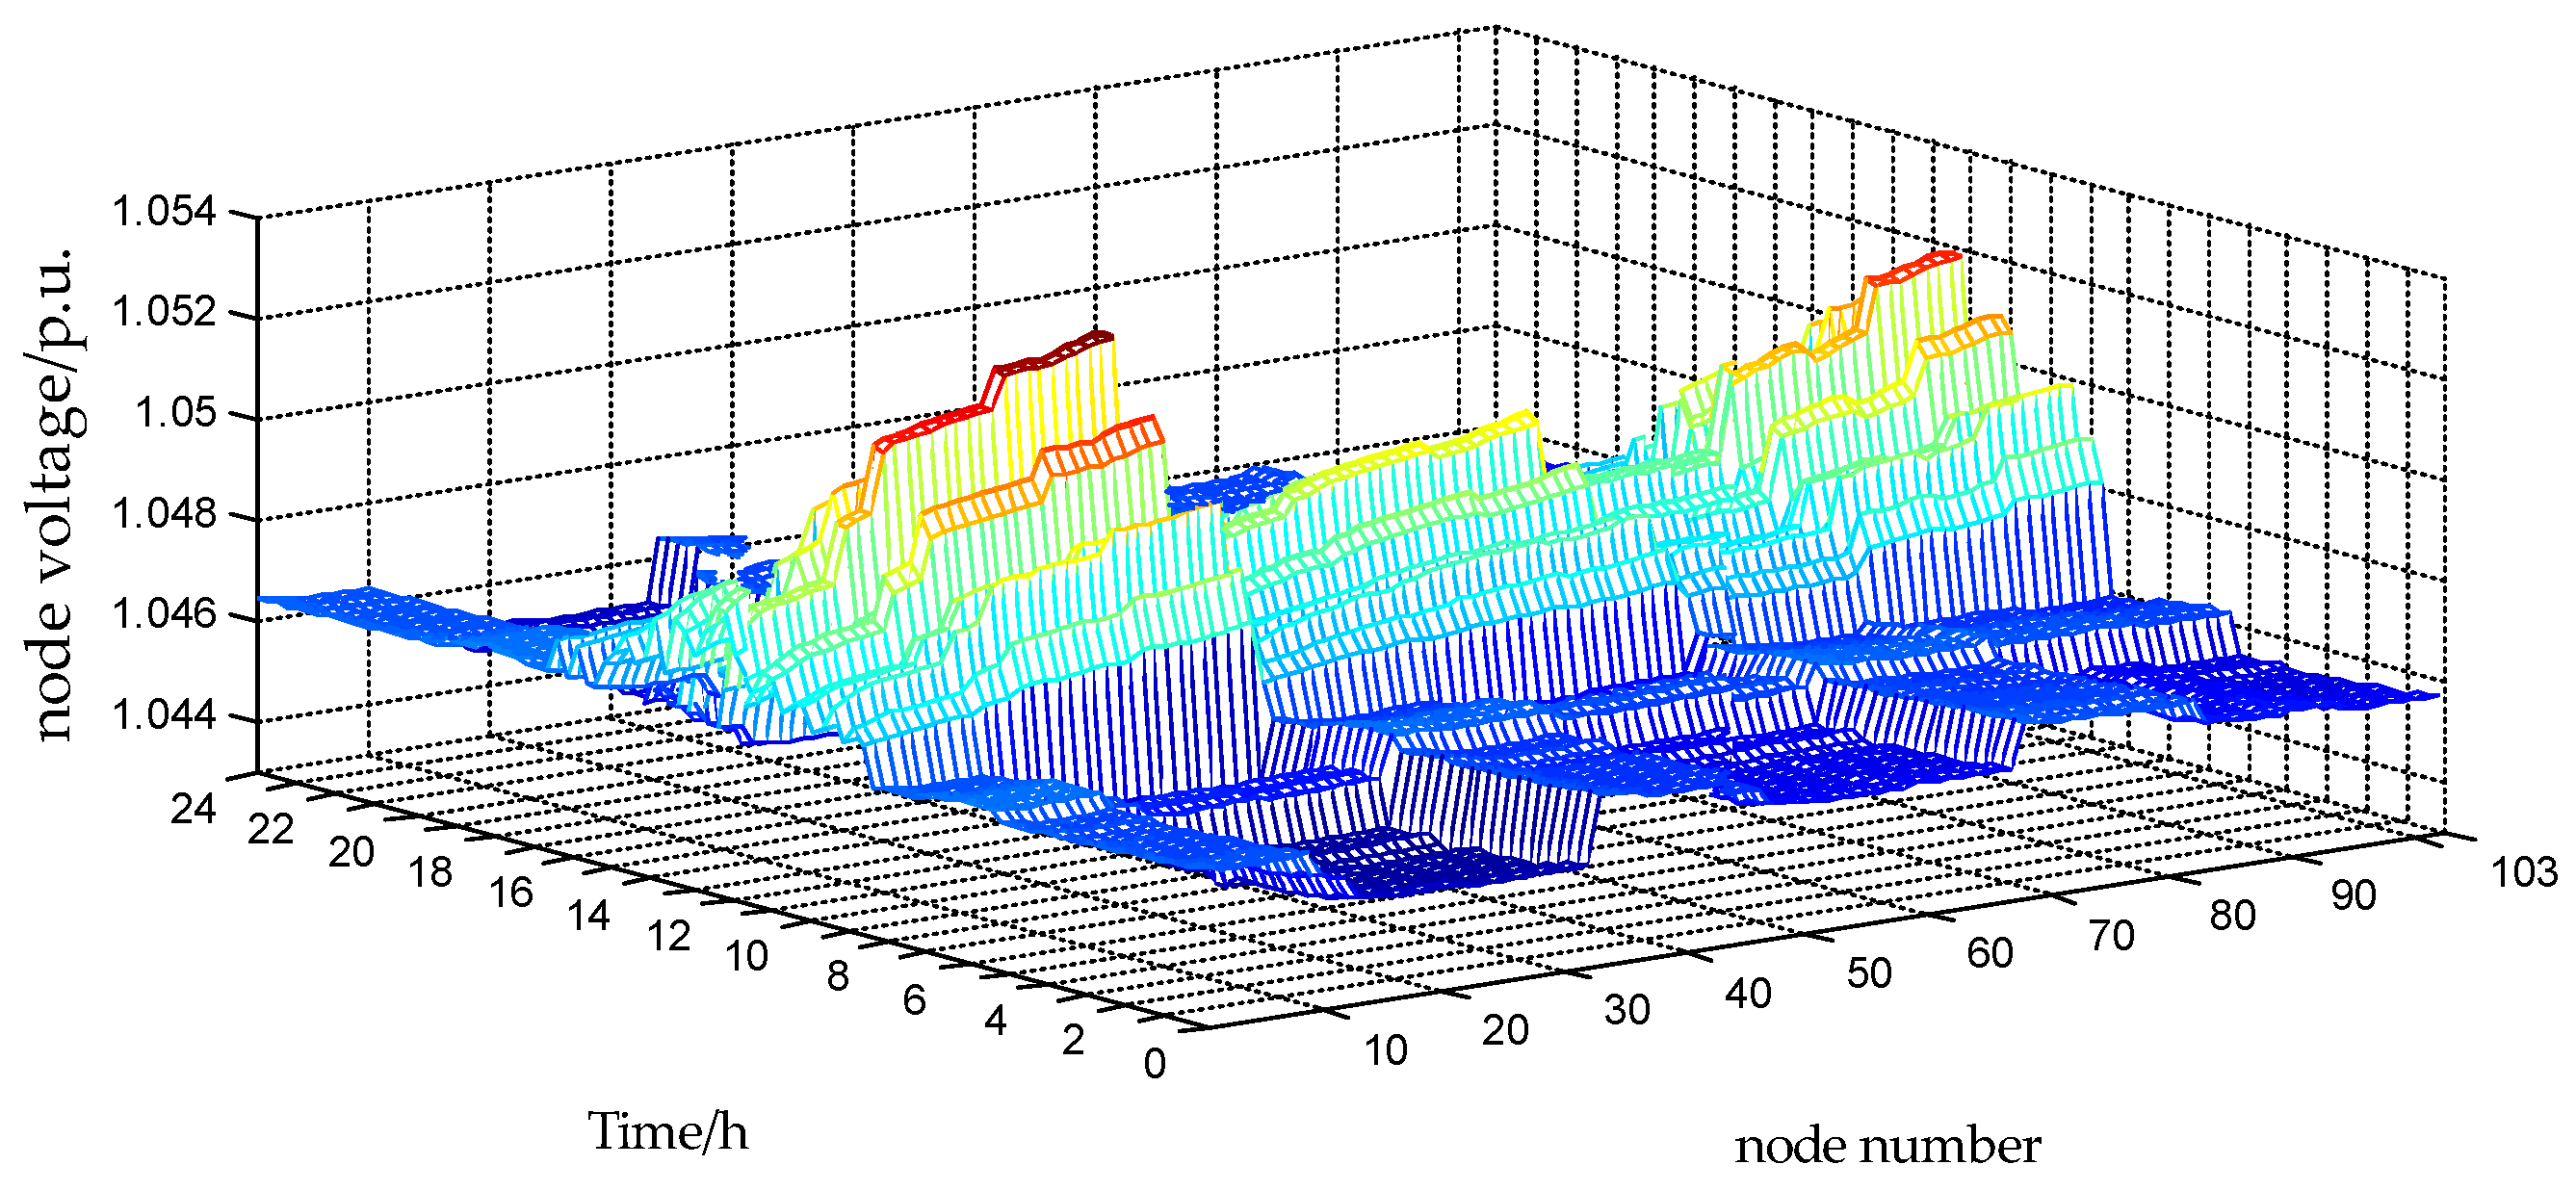
The feeder with 103 nodes is established in the OpenDSS platform, and the proposed strategy is carried out in the MATLAB platform. In order to verify that the proposed method can deal with the overvoltage of DNs effectively, 16 July 2020, the day with the strongest solar irradiance for the year, is chosen as an analyzed scenario. When the solar irradiance reaches its maximum, overvoltage occurs in the DNs. Additionally, the nodal voltage without any voltage control in one day is shown in Figure 5. The figure shows that some nodal voltage exceeds the upper limit of voltage constraints. Additionally, an effective voltage control strategy needs to be implemented urgently to maintain the stable operation of the feeder.

5.2. Cluster Partition for the Feeder

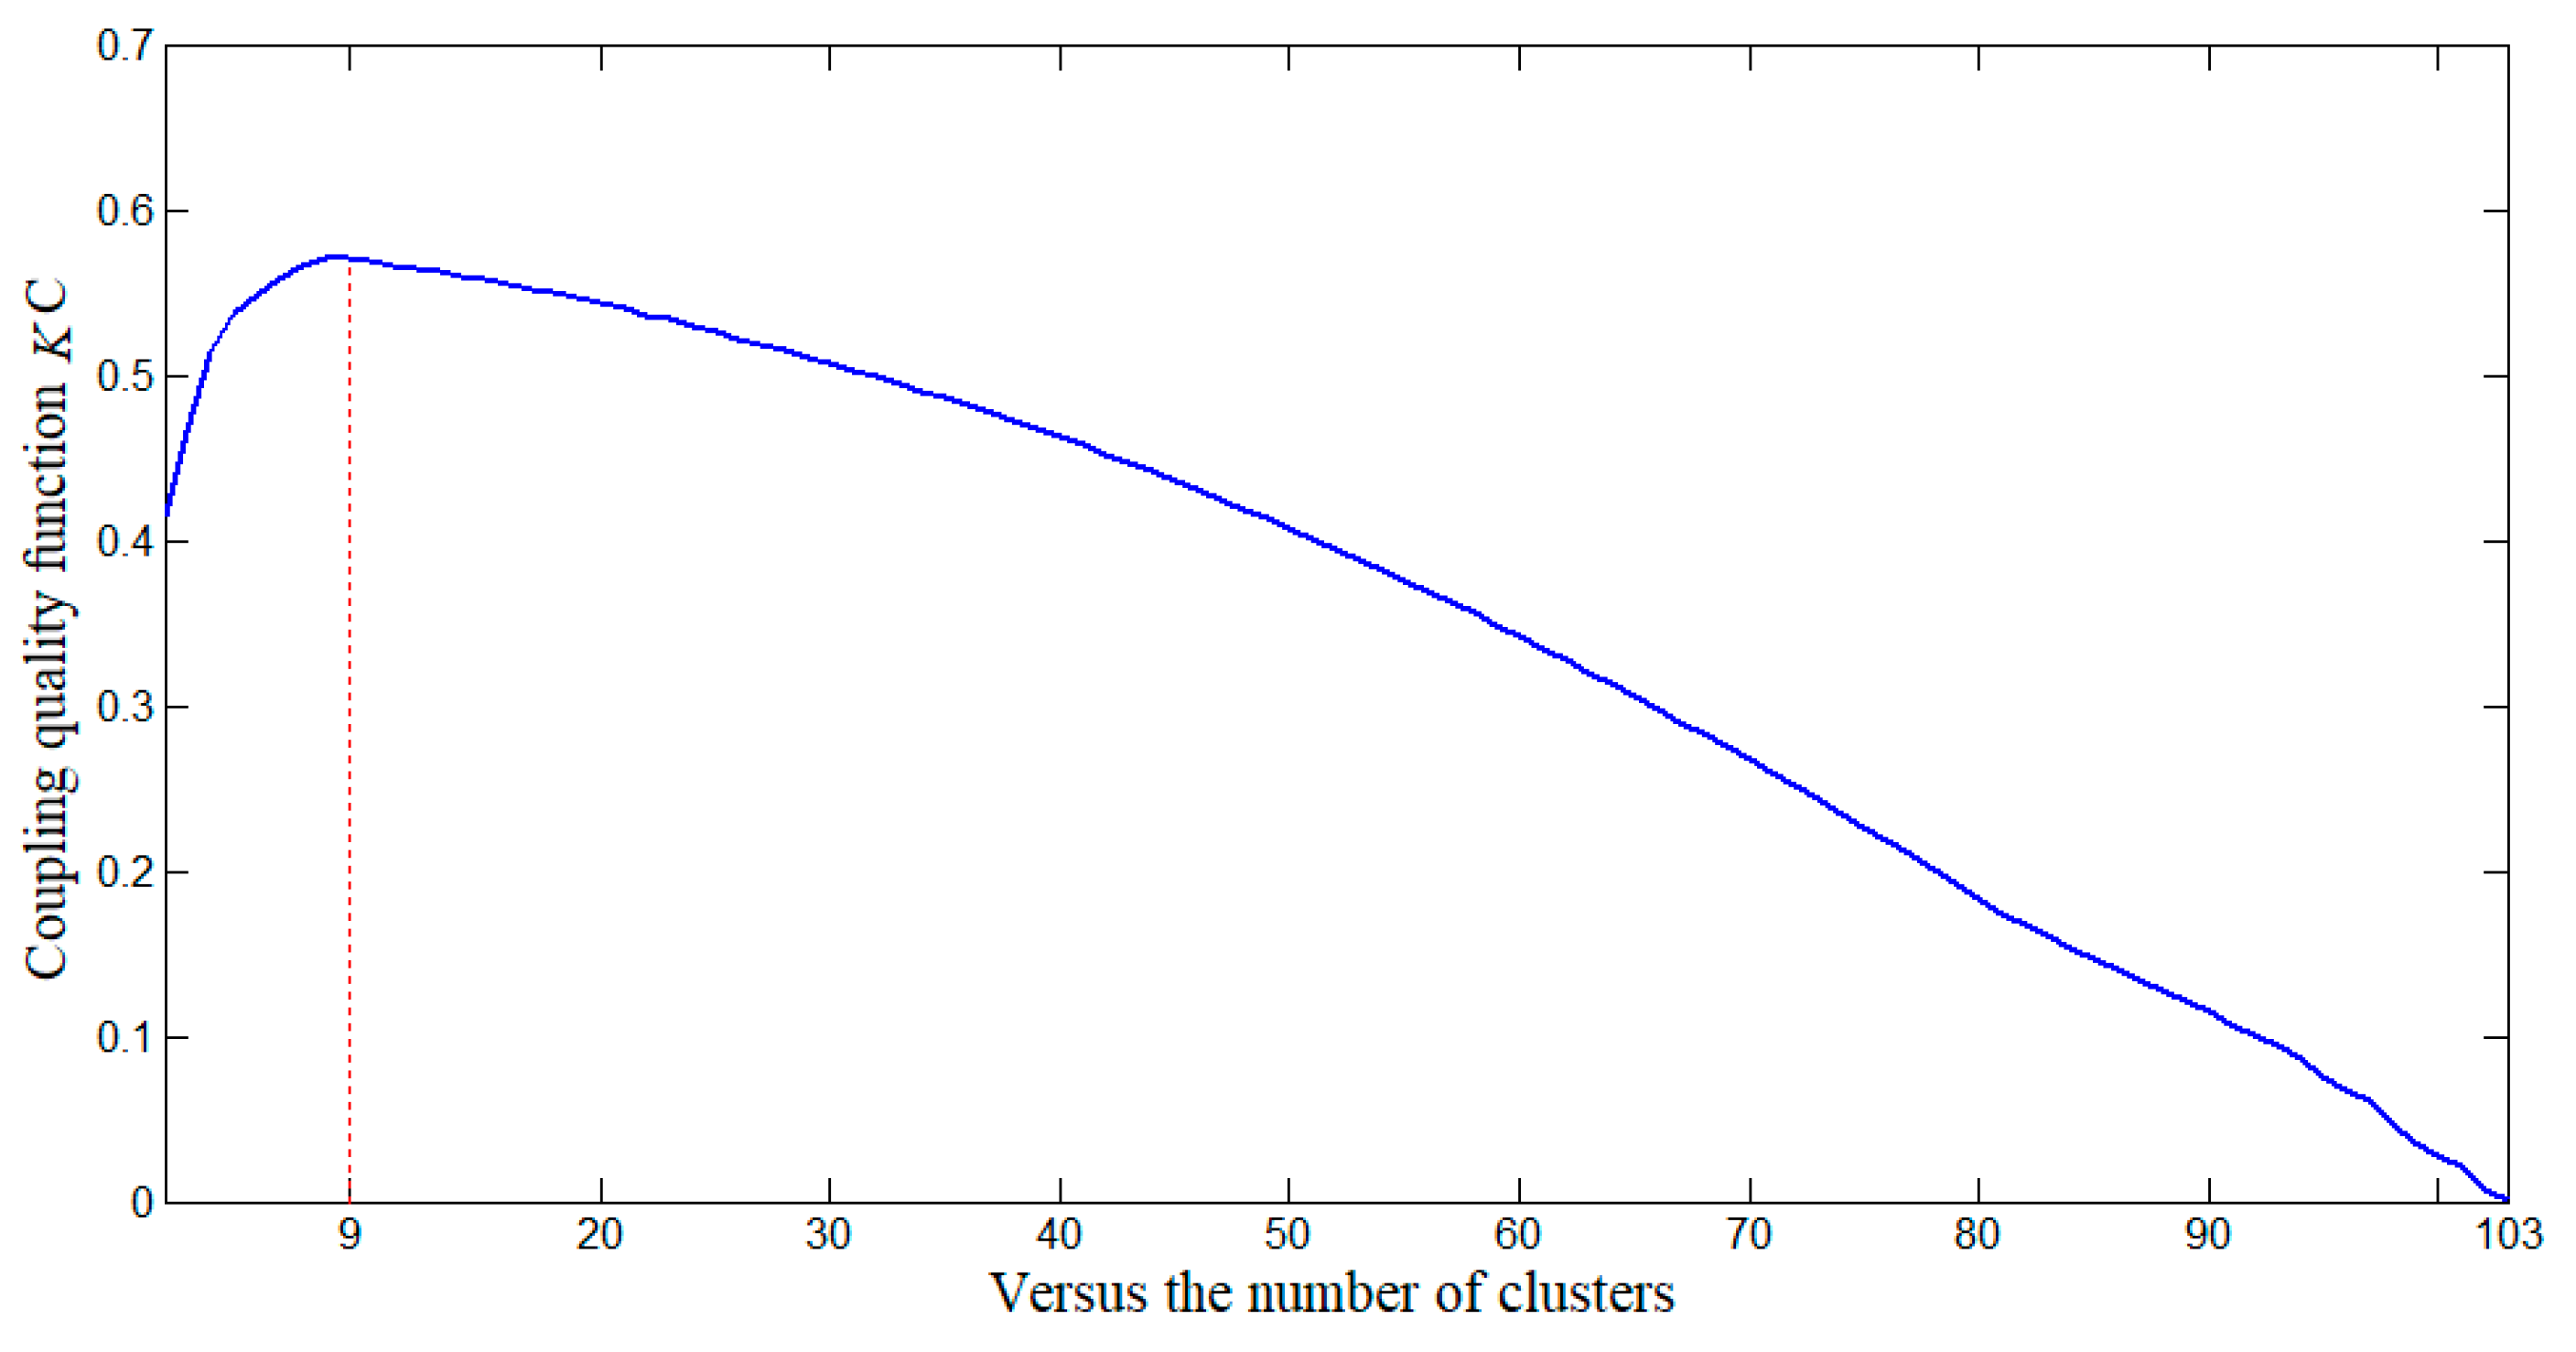
To deal with the overvoltage using the proposed strategy, the cluster partition needs to be carried out firstly. Based on the forecasted load demands and PV outputs, the feeder is partitioned into several clusters for the implementation of DAS and RTVC. The actual operation of the feeder at 12:30 is chosen to analyze the proposed partitioning strategy. Under the proposed partitioning strategy, the value of the coupling quality function versus the number of clusters is shown in Figure 6. This figure shows that the coupling quality function reaches the maximum value KC = 0.412, which means that the feeder is partitioned into nine clusters. Thus, the optimal cluster number is nine. In Figure 2, the final cluster partition is labeled by the red-dashed frame, and the clusters are denoted as {π1, π2, π3, π4, π5, π6, π7, π8, π9}. From the result of the cluster partition, it shows that the cluster partition is associated with the nodal geographic attributes. The reason for this is that the power–voltage sensitivity among nodes is associated with the line impedance, while the line impedance among nodes is associated with the nodal geographical attributes.
To analyze the proposed coupling quality function, the modularity function [20] is employed for comparison with the coupling quality function. The cluster partition with the coupling quality function and with the modularity function are displayed in Table 1. As shown in the cluster partition with the modularity function, the feeder is divided into 11 clusters. Additionally, the smallest-scale cluster (cluster π2) contains 4 nodes, while the largest-scale cluster (cluster π9) contains 15 nodes. A large difference in cluster size exists among the clusters with the modularity function. However, it can be seen from Table 1 that the feeder is divided to nine clusters according to the coupling quality function. Additionally, the largest-scale cluster (cluster π1) contains 15 nodes, while the smallest-scale cluster (cluster π8) contains 8 nodes. Obviously, the difference in cluster size according to the coupling quality function is much smaller. The reason for this is that the inner density index Ki and the outer density index Ko in the proposed method can balance the cluster size, which can avoid an excessive nodal number existing in a cluster. Then, the cluster size according to the coupling quality function is more reasonable.
To further verify the efficiency of the proposed cluster partition strategy, the proposed DAS combined RTVC strategy is implemented under the two cluster partition methods. The total regulation costs of DNs under the two cluster partition methods are shown in Table 1. The total regulation cost under the coupling quality function is USD 927.12, while the total regulation cost under the modularity function is USD 1241.47. It is shown that the total regulation cost under the cluster partition attained by the coupling quality function is smaller. Additionally, the difference in regulating cost proves that the coupling quality function can generate a more reasonable cluster partition for the subsequent voltage control.

5.3. DAS Combined RTVC Strategy

After the clusters of the feeder are formed, the cluster partition-based voltage control combined DAS and RTVC strategy is applied to deal with the overvoltage. Firstly, based on the forecast data, the DAS for OLTC and PV inverters is obtained by means of the process in Section 3. When coming to the RTVC period, the RTVC strategy for PV inverters can be obtained by means of the process in Section 4, which is formed by modifying DAS.
Under the proposed strategy, the operation of the OLTC in a day is displayed in Figure 7. It is shown that the tap position of the OLTC is adjusted twice in total in a day. During the time period 11:00–14:00, the tap position of the OLTC is lowered by one gear. It can be seen in Figure 5 that during the time period 11:00–14:00, the overvoltage in the feeder is serious, and the overvoltage cannot be solved only by means of a PV inverter, meaning that the OLTC participates in the voltage control.
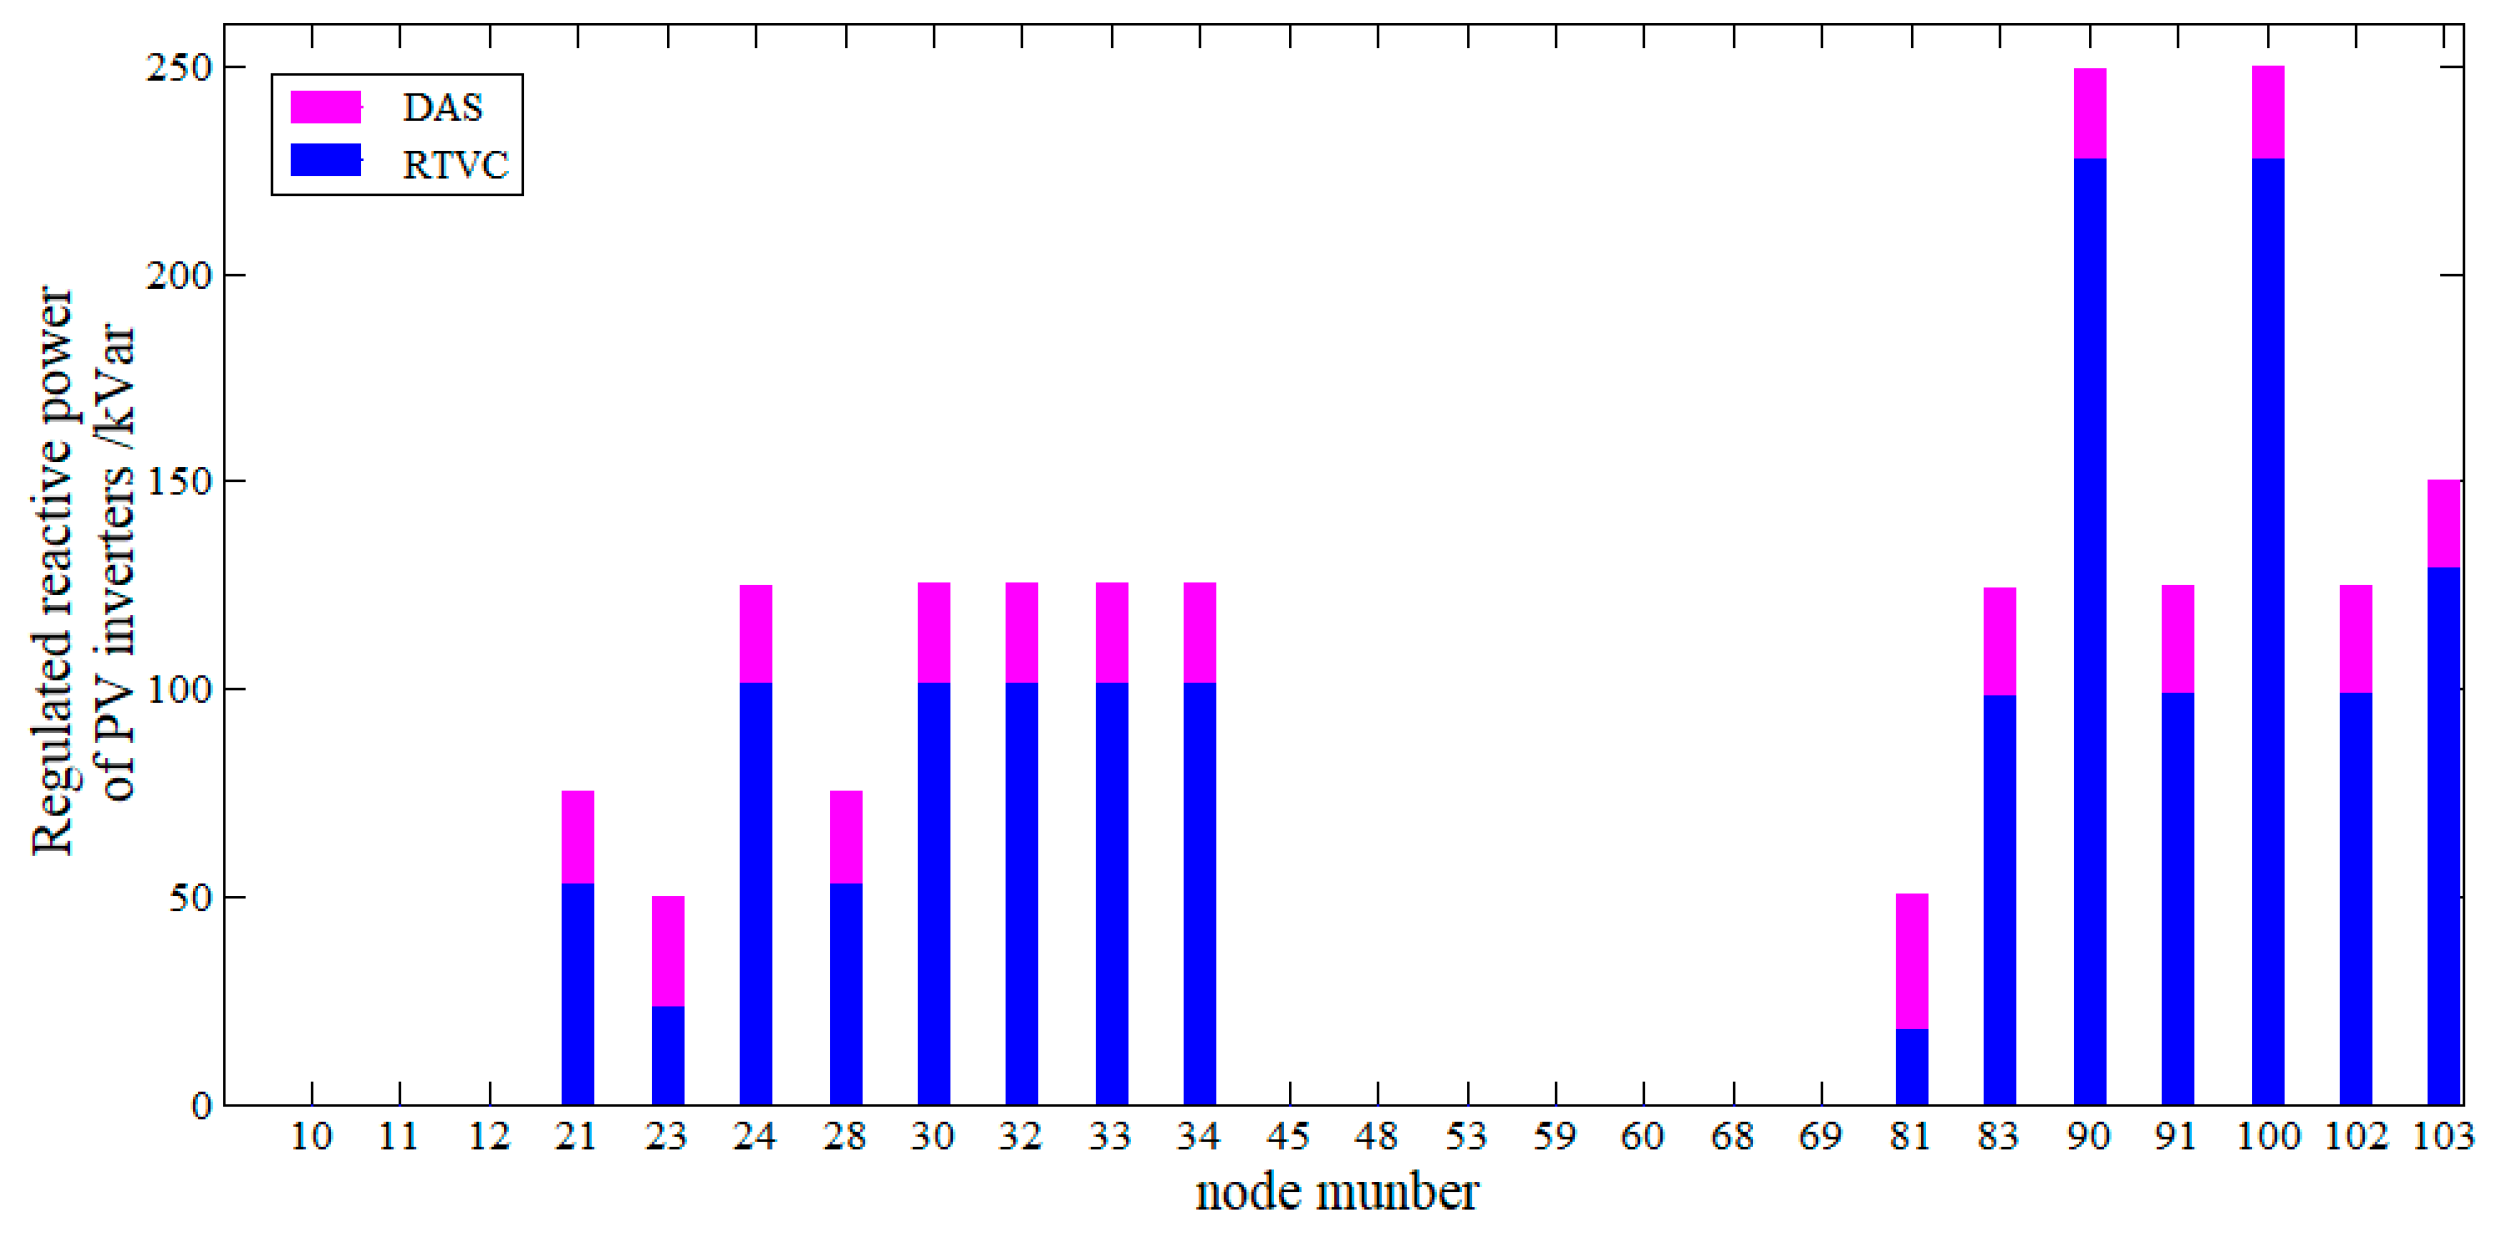
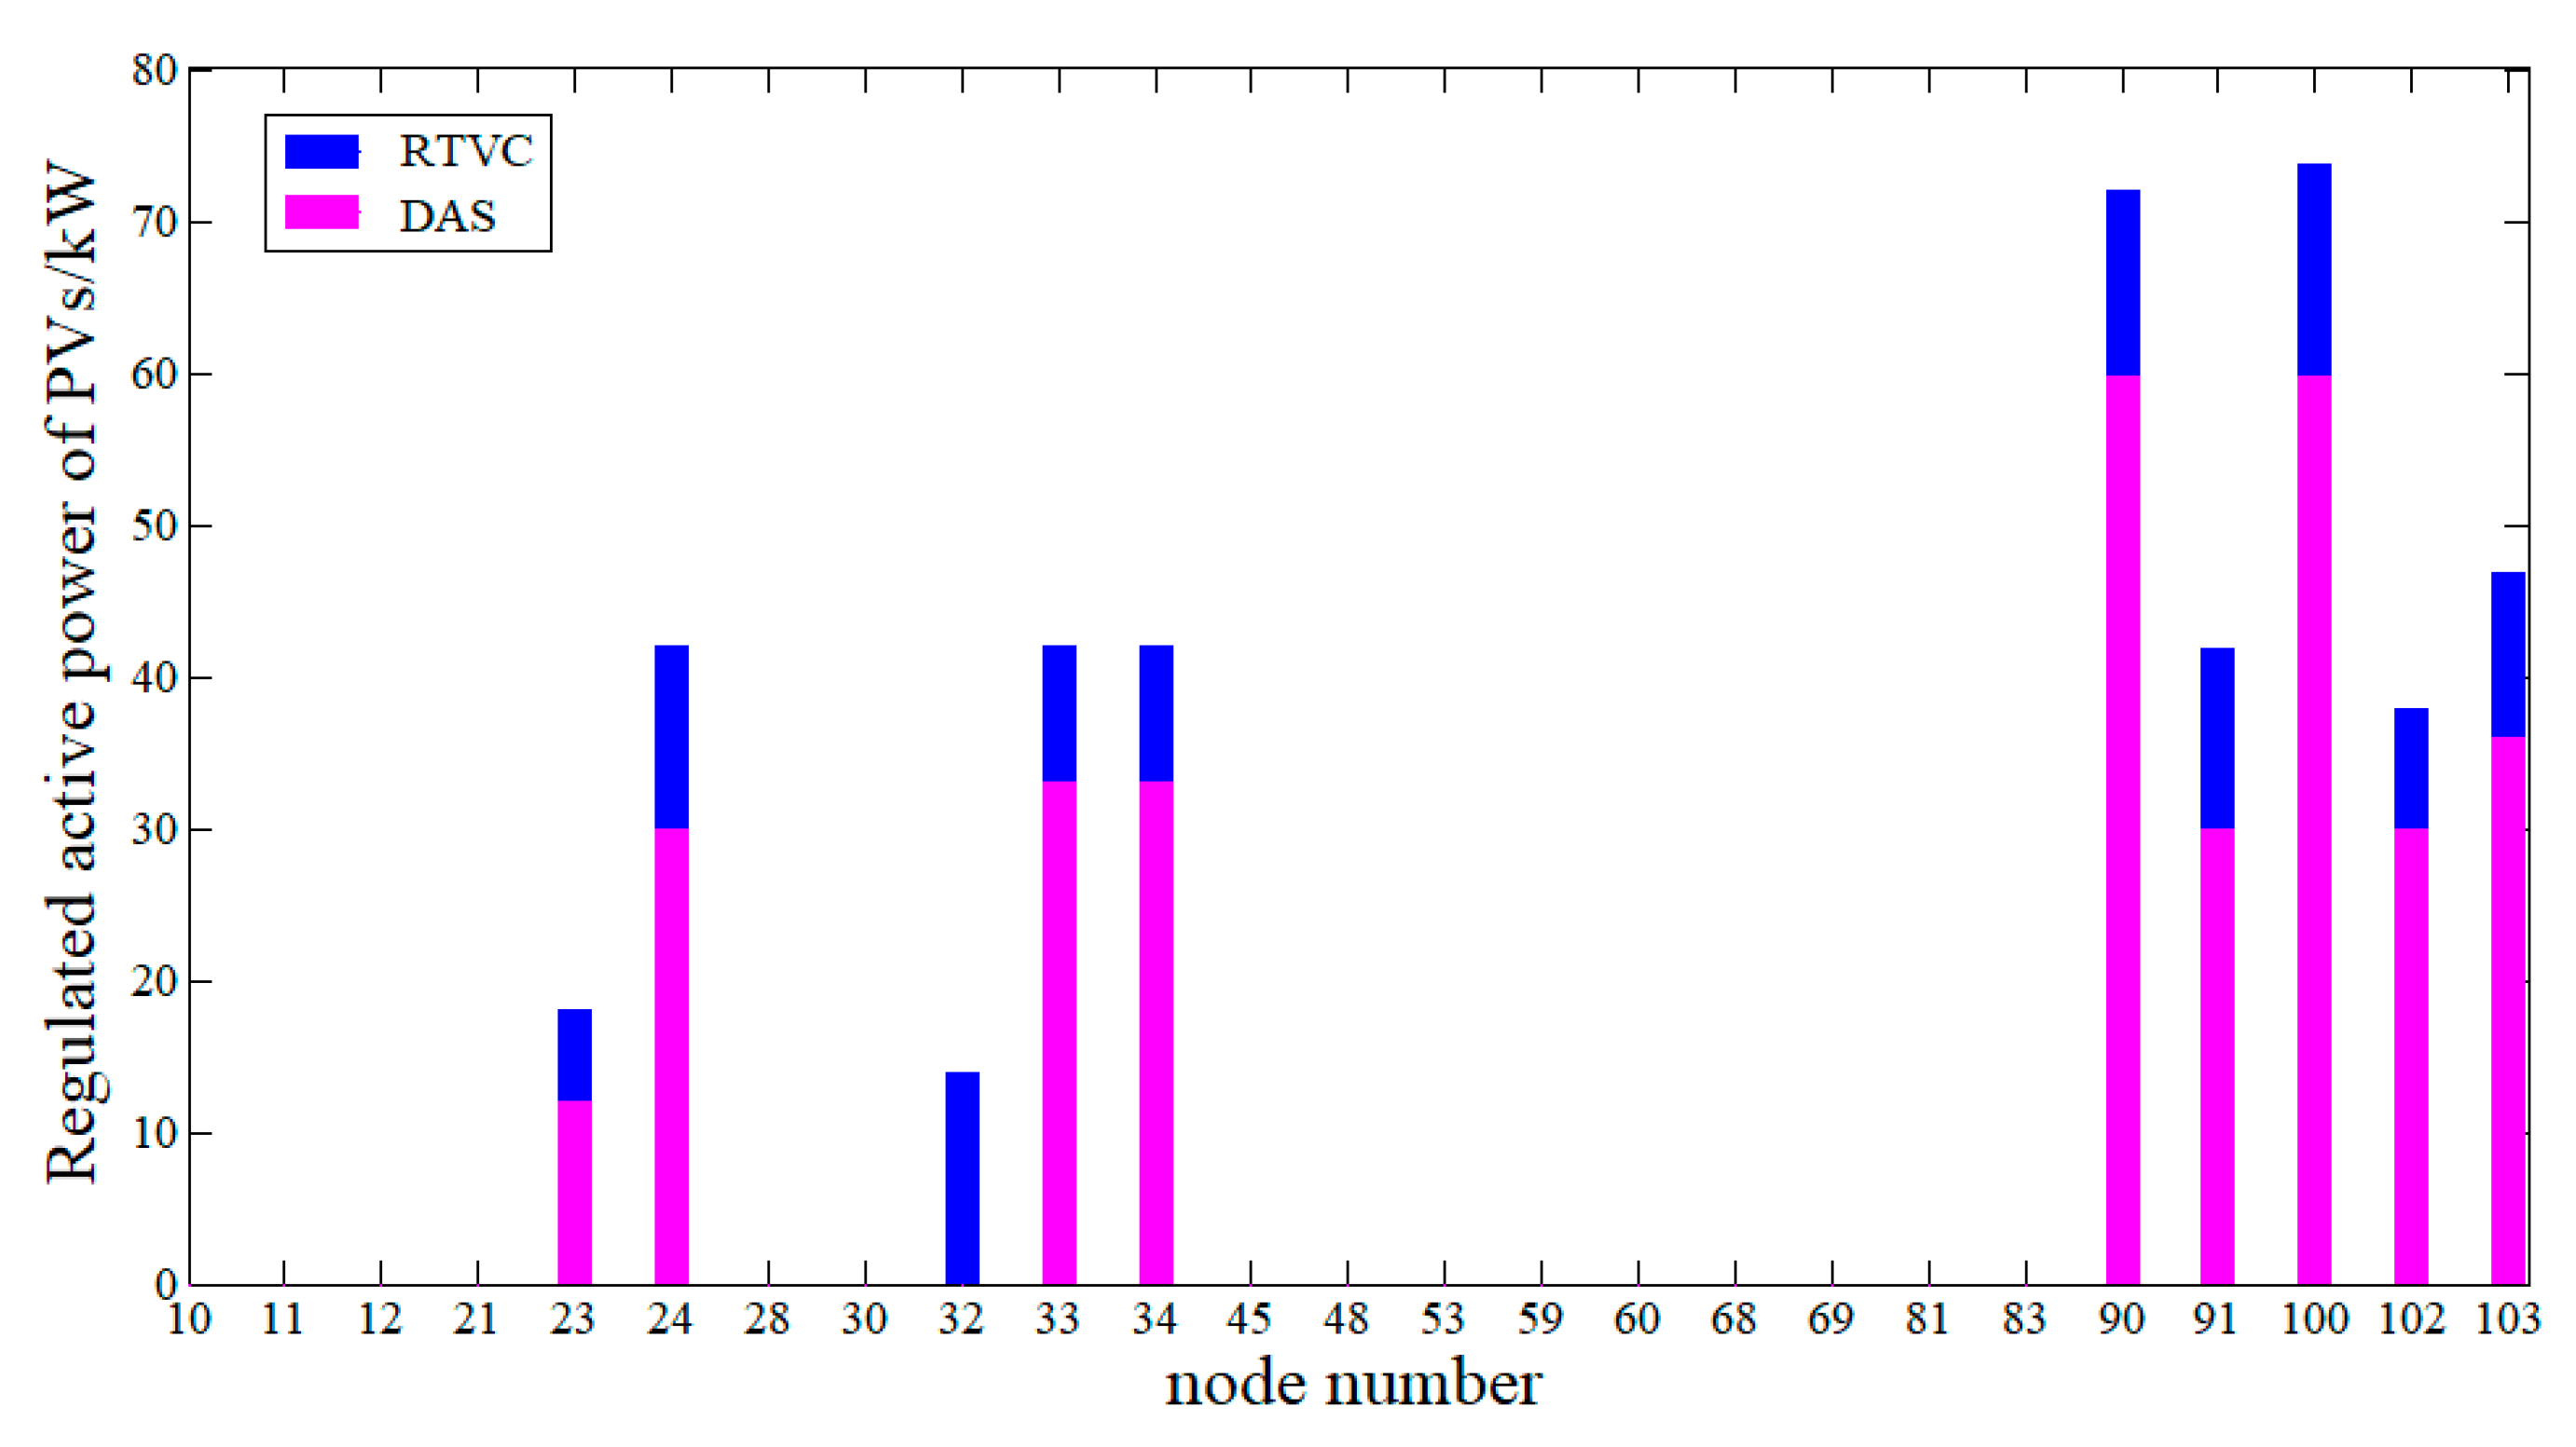
The regulated reactive power of the PV inverters at 12:30 is displayed in Figure 8, and the regulated PV active power is displayed in Figure 9. It can be seen from Figure 8 and Figure 9 that the optimized result of PV regulation under DAS is different from that under RTVC. The reason for this is that due to forecasting errors, the overvoltage cannot be solved only using DAS, and RTVC must be carried out by modifying the DAS; then, the optimized result of PV regulation changes under RTVC compared to DAS.
The nodal voltage at 12:30 under the proposed method is displayed in Figure 10. As shown, the overvoltage cannot be solved only using DAS. Due to forecasting errors, the PV output in real time is larger than the forecasted data. The optimized PV regulation in DAS cannot satisfy the voltage control requirements. In this case, overvoltage still exists. After the implementation of RTVC, all of the nodal voltage is regulated to within the safe operating range, which can verify that the proposed method can deal with overvoltage effectively.
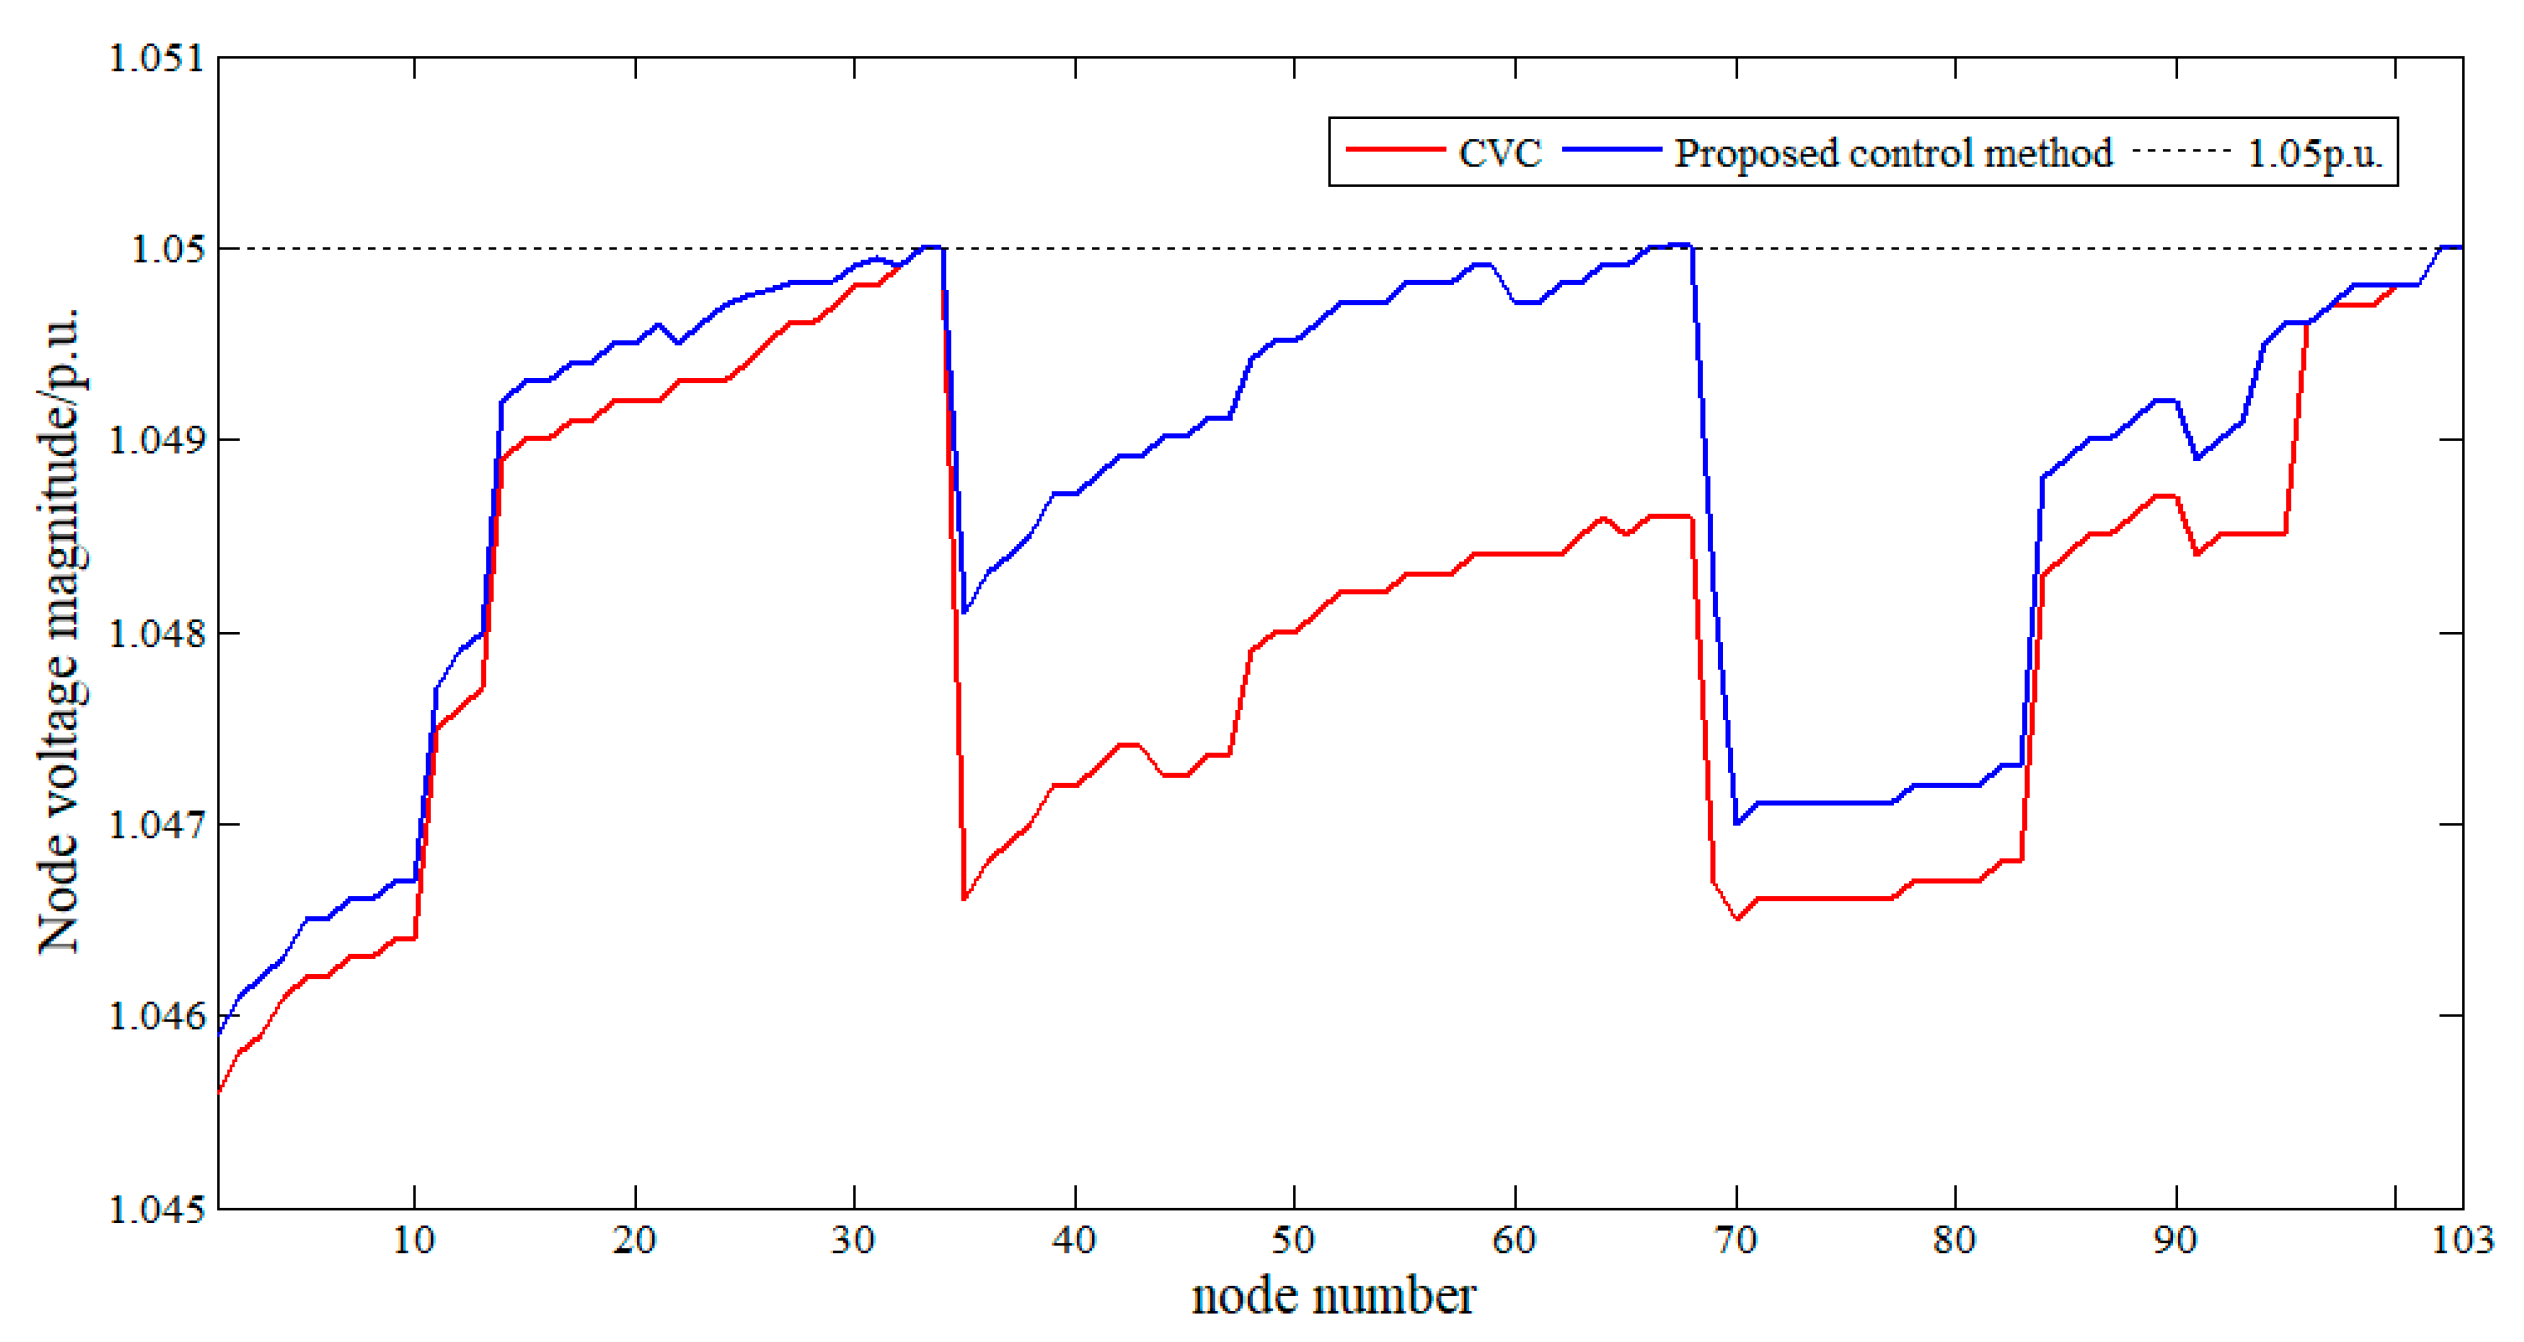
To further analyze the proposed strategy, a centralized voltage control (CVC) method is adopted to perform a comparative analysis. In the centralized voltage control method, the whole feeder is regarded as one cluster, and DAS is carried out on this basis. The nodal voltage under the two methods is displayed in Figure 11. Additionally, the figure shows that both methods can control the voltage to within the safe operating range.
The optimized control results of OLTC and PVs under the two methods are displayed in Table 2. In the CVC method, the total regulated reactive power of the PV inverters is 2765.34 kVar, and the regulated active power of PVs is 328.56 kW. However, under the proposed method, the total reactive power adjusted by the PV inverters is 1599.67 kVar, and the active power adjusted by the PV inverters is 445.24 kW. The voltage control method requires less active power regulation but more reactive power to deal with the overvoltage. Moreover, it can be seen from Table 2 that the tap position of OLTC changes six times in a day under the CVC method, but the tap position of OLTC only changes two times in the proposed method. The number of tap changes is greatly reduced under the proposed method, which can help to prolong the OLTC’s service life.
To evaluate the quality of voltage control, the computing time is another important index. The computing time under the two schemes is shown in Table 2. The computing time under the CVC method is 89.63 s, while the computing time only lasts 9.86 s in the proposed strategy. The computing time under the proposed scheme is greatly reduced compared to that under the CVC method. The main reason for this is that all the PV inverters are involved in the voltage control, which greatly increases the optimizing complexity. However, the proposed method carries out optimization in each cluster, and the optimization of voltage control can be greatly simplified, which is more suitable for the DNs with high-penetration PVs.

6. Conclusions

To deal with the overvoltage of DNs, a cluster partition-based voltage control combined DAS and RTVC strategy is proposed. Firstly, a coupling quality function is formed as the cluster partition index of DNs, and a fast cluster partition algorithm is proposed to divide the PVs into a number of clusters. Secondly, cluster partition-based DAS is proposed for the OLTC and PV inverters, which is optimized with the objective of minimizing the operation costs of DNs. Finally, an SOCP model for RTVC is established in each cluster, which can correct the DAS with the objective of minimizing output deviation of PVs from the DAS. The proposed strategy realizes the combination of DAS and RTVC, which can optimize the operation of OLTC, as well as improve the PV hosting capacity of DNs.

Author Contributions

Conceptualization, W.S.; Methodology, W.S.; Formal analysis, G.H. All authors have read and agreed to the published version of the manuscript.

Funding

This research was funded by Open Fund of State Key Laboratory of Operation and Control of Renewable Energy & Storage Systems(China Electric Power Research Institute)(No.NY80-22-002).

Data Availability Statement

There was no new data were created in this research.

Conflicts of Interest

The authors declare no conflict of interest.

References

  1. Confrey, J.; Etemadi, A.; Stuban, S.M.F.; Eveleigh, T.J. Energy Storage Systems Architecture Optimization for Grid Resilience with High Penetration of Distributed Photovoltaic Generation. IEEE Syst. J. 2020, 14, 1135–1146. [Google Scholar] [CrossRef]
  2. Koutsoukis, N.; Georgilakis, P.; Hatziargyriou, N. Multistage coordinated planning of active distribution networks. IEEE Trans. Power Syst. 2018, 33, 32–44. [Google Scholar] [CrossRef]
  3. Li, Z.; Wu, L.; Xu, Y. Temporally-coordinated optimal operation of a multi-energy microgrid under diverse uncertainties. Appl. Energy 2019, 240, 719–729. [Google Scholar] [CrossRef]
  4. Liu, Q.; Wang, Y.; Wang, S.; Liang, D.; Zhao, Q.; Zhao, X. Voltage Regulation Strategy for DC Distribution Networks Based on Coordination of Centralized Control and Adaptive Droop Control. IEEE Trans. Power Deliv. 2022, 37, 3730–3739. [Google Scholar] [CrossRef]
  5. Afandi, I.; Agalgaonkar, A.; Perera, S. Integrated Volt/Var Control Method for Voltage Regulation and Voltage Unbalance Reduction in Active Distribution Networks. Energies 2022, 15, 2225. [Google Scholar] [CrossRef]
  6. Hu, K.; Yin, R.; Shi, M. Distributed Photovoltaic Cluster Partition and Reactive Power Optimization Strategy Based on Improved Particle Swarm Optimization Algorithm. Power Capacit. React. Power Compens. 2021, 42, 14–21. [Google Scholar]
  7. Dou, B.; Chang, M.; Ni, H.; Duan, M.; Ge, D.; Wu, J. Multi-level Dispatching and Control of Active Distribution Network for Virtual Cluster of Distributed Photovoitaic. Autom. Electr. Power Syst. 2018, 42, 21–31. [Google Scholar]
  8. Bi, R.; Liu, F.; Ding, M.; Fang, H.; Zhang, J.; Chen, F. Renewable Energy Generation Cluster Partition Method Aiming at Improving Accommodation Capacity. Proc. CSEE 2019, 39, 6583–6592. [Google Scholar]
  9. Yan, D.; Cai, H.; Sha, J.; Lv, P.; Xu, Z. Distribution Network Cluster Division and Voltage Control with High Proportion of New Energy Access. Power Demand Side Manag. 2021, 23, 8–13. [Google Scholar]
  10. Chai, Y.; Liu, X.; Wang, S.; Guo, L.; Zhao, Z.; Gao, S. Coordinated voltage control for dis-tributed pvs clusters with incomplete meas-urements. Proc. CSEE 2019, 39, 2202–2212. [Google Scholar]
  11. Wei, B.; Qiu, Z.; Deconinck, G. A mean-field voltage control approach for active distribution networks with uncertainties. IEEE Trans. Smart Grid 2022, 12, 1455–1466. [Google Scholar] [CrossRef]
  12. Girvan, M.; Newman, M.E.J. Community structure in social and biological networks. Proc. Natl. Acad. Sci. USA 2002, 99, 7821–7826. [Google Scholar] [CrossRef] [PubMed]
  13. Danon, L.; Díaz-Guilera, A.; Arenas, A. The effect of size heterogeneity on community identification in complex networks. J. Stat. Mech. Theory Exp. 2006, 11, P11010. [Google Scholar] [CrossRef]
  14. Xiao, C.; Sun, L.; Ding, M. Multiple Spatiotemporal Characteristics-Based Zonal Voltage Control for High Penetrated PVs in Active Distribution Networks. Energies 2020, 13, 249. [Google Scholar] [CrossRef]
  15. Xiao, C.; Ding, M.; Sun, L.; Chung, C.Y. Network partition-based two-layer optimal scheduling for active distribution networks with multiple stakeholders. IEEE Trans. Ind. Inform. 2021, 17, 5948–5960. [Google Scholar] [CrossRef]
  16. Cohen, J. Graph Twiddling in a map reduce World. Comput. Sci. Eng. 2009, 11, 29–41. [Google Scholar] [CrossRef]
  17. Li, Z.; Wu, L.; Xu, Y. Risk-Averse Coordinated Operation of a Multi-Energy Microgrid Considering Voltage/Var Control and Thermal Flow: An Adaptive Stochastic Approach. IEEE Trans. Smart Grid 2021, 12, 3914–3927. [Google Scholar] [CrossRef]
  18. Li, Z.; Wu, L.; Xu, Y.; Moazeni, S.; Tang, Z. Multi-Stage Real-Time Operation of a Multi-Energy Microgrid with Electrical and Thermal Energy Storage Assets: A Data-Driven MPC-ADP Approach. IEEE Trans. Smart Grid 2022, 13, 213–226. [Google Scholar] [CrossRef]
  19. Xiao, C.; Zhao, B.; Ding, M.; Li, Z.; Ge, X. Zonal voltage control combined day-ahead scheduling and real-time control for distribution networks with high proportion of PVs. Energies 2017, 10, 1464. [Google Scholar] [CrossRef]
  20. Li, J.; Yang, H. Research on realization and comparison of community division algorithms in network. Comput. Digit. Eng. 2019, 47, 2861–2865. [Google Scholar]
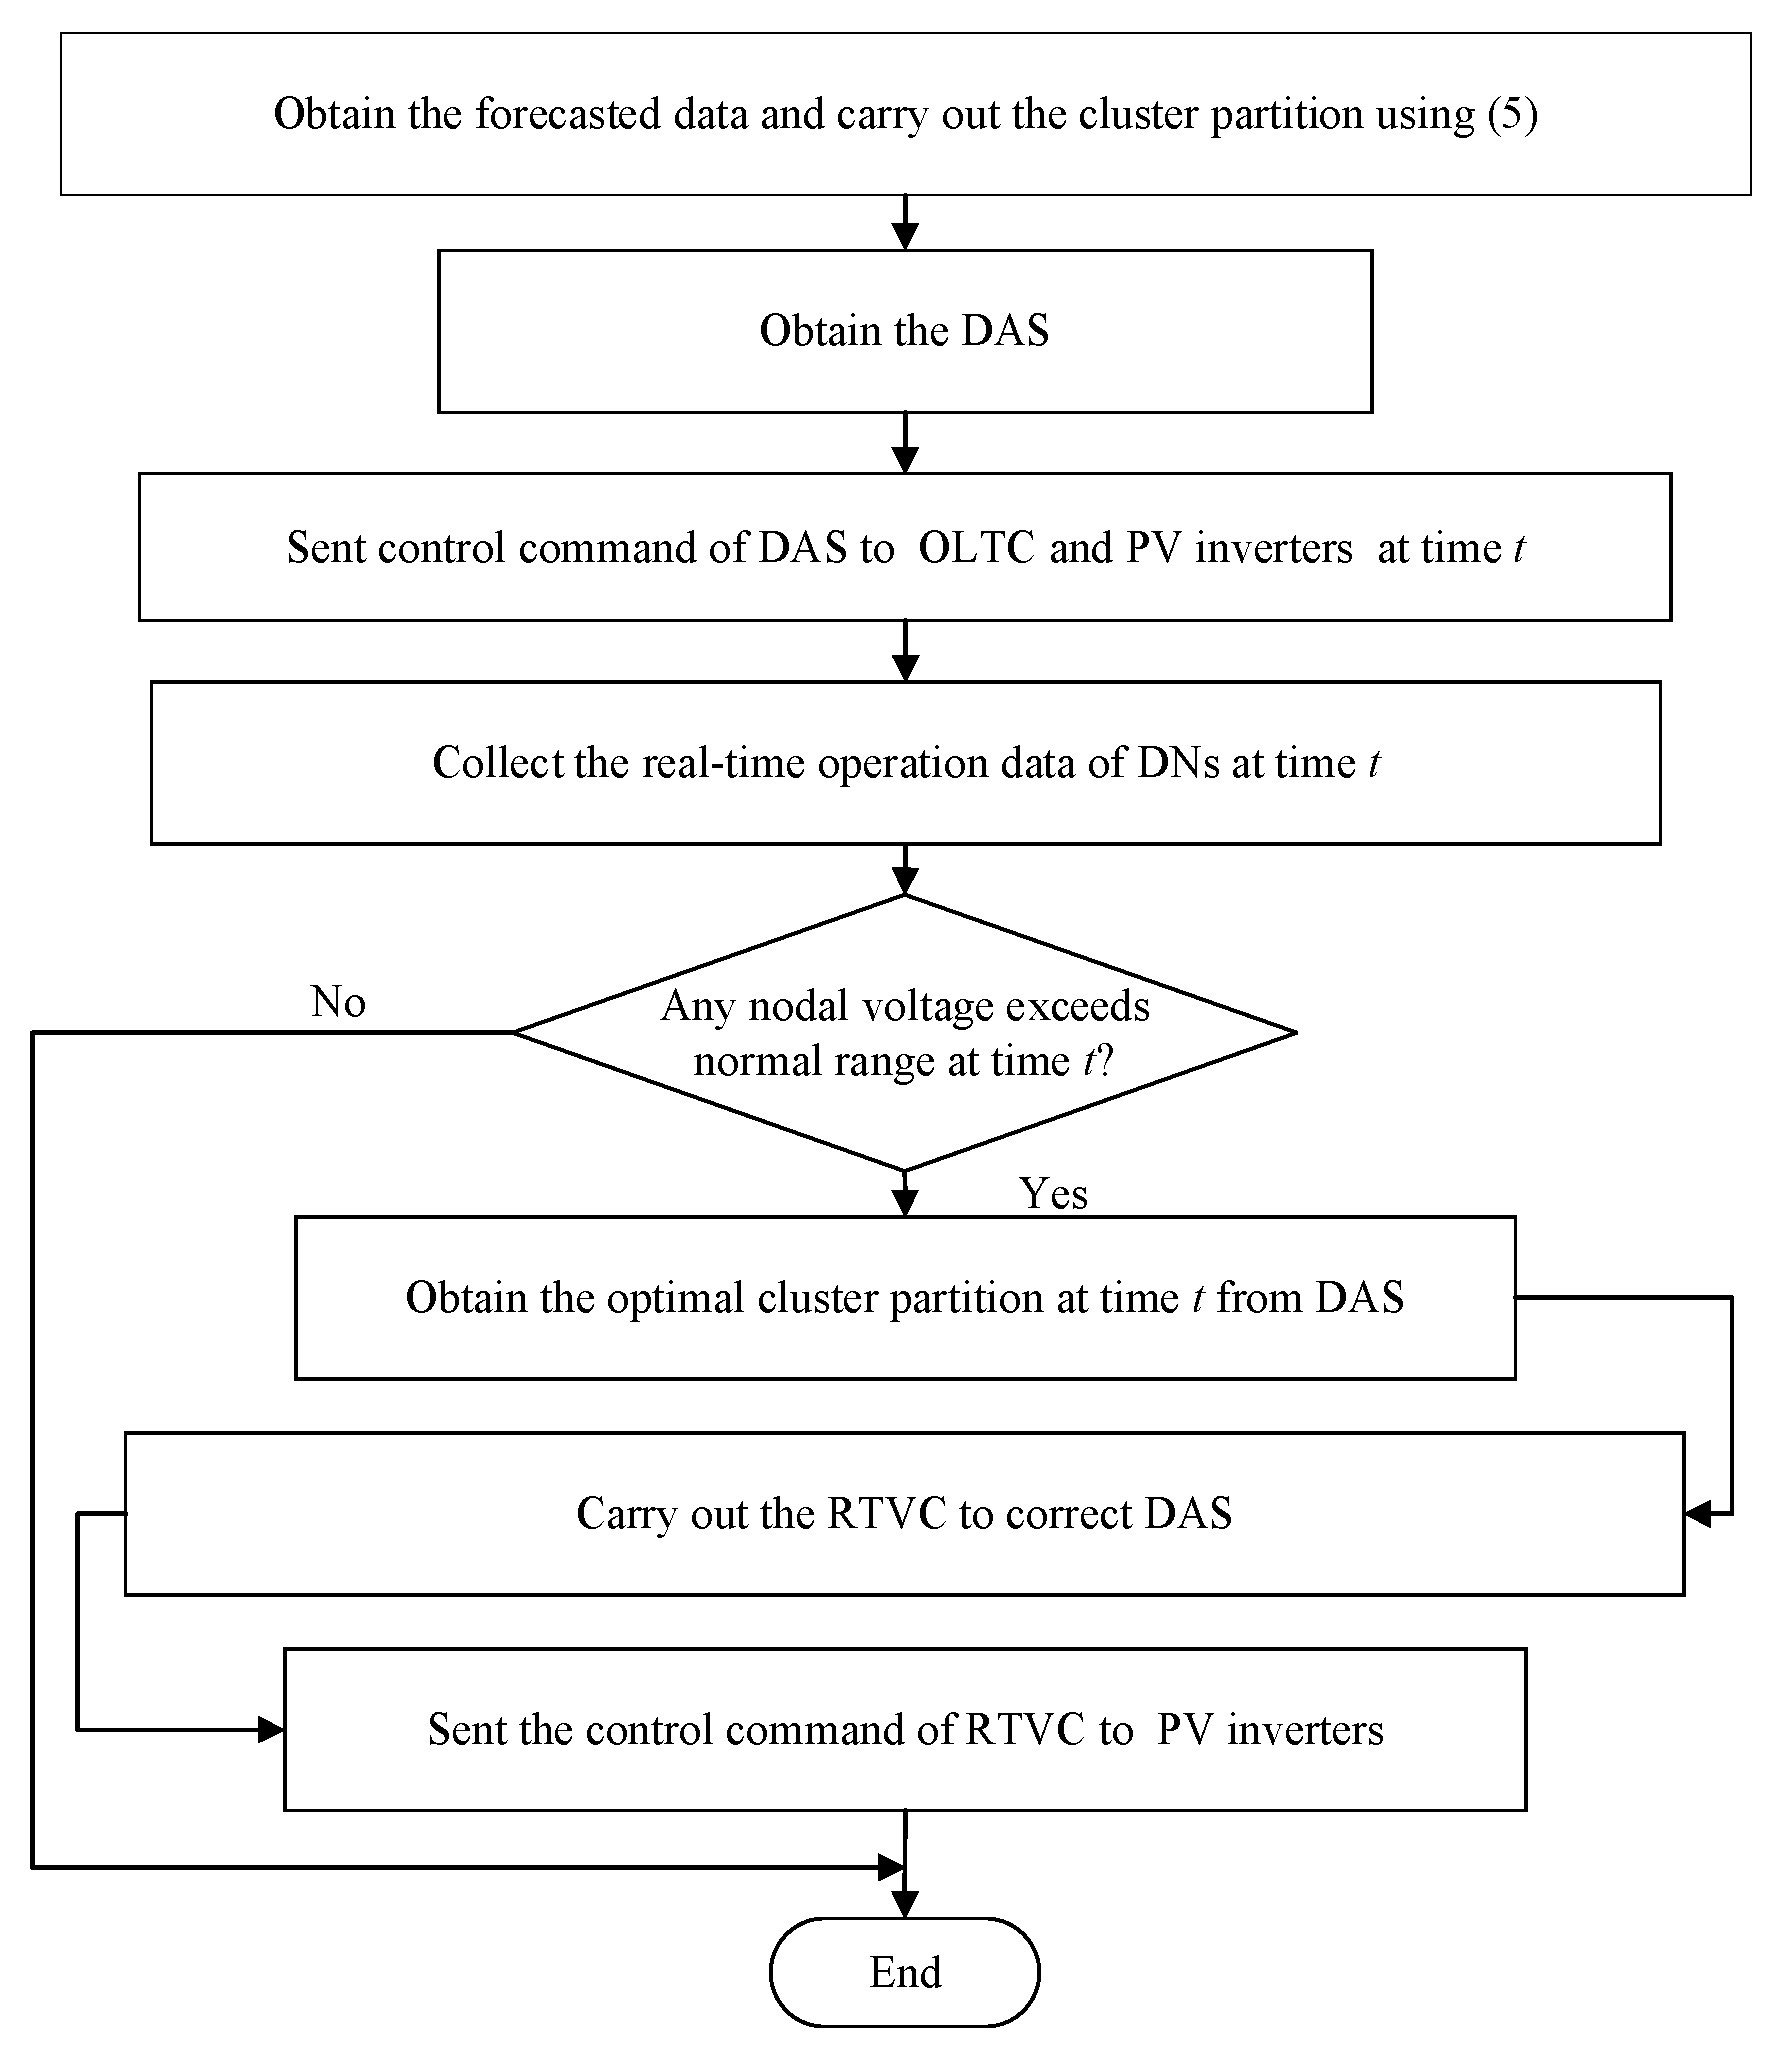
Figure 1. Flow chart of the proposed strategy.
Energies 16 04375 g001
Figure 2. Grid structure of the feeder under the study.
Energies 16 04375 g002
Figure 3. Load demand and the forecasted solar irradiance.
Energies 16 04375 g003
Figure 4. Installed PV capacity in each node.
Energies 16 04375 g004
Figure 5. Nodal voltage of a 10 kV feeder during a day.
Energies 16 04375 g005
Figure 6. Coupling quality function versus the number of clusters.
Energies 16 04375 g006
Figure 7. Operation of the OLTC in a day.
Energies 16 04375 g007
Figure 8. Absorbed reactive power of the PV inverters in different methods.
Energies 16 04375 g008
Figure 9. Curtailed PV active power in different methods.
Energies 16 04375 g009
Figure 10. Nodal voltage under the proposed method.
Energies 16 04375 g010
Figure 11. Nodal voltage under the two methods.
Energies 16 04375 g011
Table 1. Results of cluster partition under different methods.
ClusterCoupling Quality FunctionModularity Function
π11, 2, 3, 4, 5, 6, 7, 8, 9, 10, 11, 12, 13, 14, 151, 2, 3, 4, 5, 6, 7, 8, 9, 10, 11
π216, 17, 18, 19, 20, 21, 22, 23, 2412, 13, 14, 15
π325, 26, 27, 28, 29, 30, 31, 32, 33, 3417, 18, 19, 20, 21, 22, 23, 24
π435, 36, 37, 38, 39, 40, 41, 42, 43, 44, 45, 46, 47, 4816, 25, 26, 27, 28, 29, 30, 31, 32, 33, 34
π549, 50, 51, 52, 53, 54, 55, 56, 57, 58, 59, 6035, 36, 37, 38, 39, 40
π661, 62, 63, 64, 65, 66, 67, 68, 69 41, 42, 43, 44, 45, 46, 47, 48
π770, 71, 72, 73, 74, 75, 76, 77, 78, 79, 80, 81, 82, 8349, 50, 51, 52, 53, 54, 55, 56, 57, 58, 59, 60
π884, 85, 86, 87, 88, 89, 90, 9161, 62, 63, 64, 65, 66, 67, 68, 69
π992, 93, 94, 95, 96, 97, 98, 99, 100, 101, 102, 10370, 71, 72, 73, 74, 75, 76, 77, 78, 79, 80, 81, 82, 83, 84
π10 85, 86, 87, 88, 89, 90, 91, 92, 93
π11 94, 95, 96, 97, 98, 99, 100, 101, 102, 103
Total regulation cost (USD)927.121241.47
Table 2. Optimized control results under the two methods.
CaseReactive Power of PV InvertersActive Power Curtailments of PVsTap Position of OLTCTime
CVC method2765.34 kVar328.56 kWChange 6 times89.63 s
Proposed method1599.67 kVar445.24 kWChange 2 times9.86 s
Disclaimer/Publisher’s Note: The statements, opinions and data contained in all publications are solely those of the individual author(s) and contributor(s) and not of MDPI and/or the editor(s). MDPI and/or the editor(s) disclaim responsibility for any injury to people or property resulting from any ideas, methods, instructions or products referred to in the content.