Article

Thermal Performance Analysis of Composite Phase Change Material of Myristic Acid-Expanded Graphite in Spherical Thermal Energy Storage Unit

1
Engineering Research Center of Renewable Energy Power Generation and Grid-Connected Control, Ministry of Education, Xinjiang University, Urumqi 830017, China
2
Electric Power Research Institute of State Grid Xinjiang Electric Power Co., Ltd., Urumqi 830011, China
3
School of Energy and Power Engineering, Northeast Electric Power University, Jilin 132012, China
*
Author to whom correspondence should be addressed.
Energies 2023, 16(11), 4527; https://doi.org/10.3390/en16114527
Submission received: 20 March 2023 / Revised: 21 May 2023 / Accepted: 29 May 2023 / Published: 5 June 2023
(This article belongs to the Special Issue Phase Change Materials: The Ideal Solution for Thermal Management)

Abstract

:
In order to improve energy storage efficiency and promote the early achievement of global carbon neutrality goals, this paper proposes a spherical thermal storage unit filled with a composite phase change material (CPCM) comprising myristic acid (MA) and expanded graphite (EG). The effects of EG content and Stefan number (Ste) on the melting performance were investigated through a combination of experiments and numerical simulations. The results show that an increase in EG content (especially for ≥4 wt.% EG) leads to a temperature profile that assumes a concentric ring shape, while the melting rate increases with an increase in both the EG mass fraction and the Ste number. Compared to pure MA, the time required to complete melting was reduced by 82.2%, 85.6%, and 88.0% at EG contents of 4 wt.%, 5 wt.%, and 6 wt.%, respectively. Notably, the Ste value has a greater effect on melting when the EG content is ≤3 wt.%. The optimal EG content in the spherical cell was determined to be 4 wt.%, and a dimensionless analysis established a general correlation between the liquid mass fraction and the Fo, Ste, and Gr numbers.

1. Introduction

With the sustained growth of the global economy and population, energy demand continues to increase, mainly supplied by fossil fuels such as coal, gasoline, and natural gas. However, the world is facing severe challenges in an energy crisis. In order to solve this problem, renewable energy, such as solar and wind power, must be vigorously developed. According to data from the International Renewable Energy Agency (IRENA), as of 2022, the global solar and wind power generation capacity increased by 22.24% and 9.06%, respectively, from the previous year [1]. Although the development of renewable energy is an important measure to solve the energy crisis, these energy sources are unstable and intermittent in supplying energy [2]. Therefore, the development of thermal energy storage technology has become the key to solving these problems, as it can improve the comprehensive utilization level of renewable energy [3,4]. Among many thermal energy storage technologies, phase change thermal energy storage technology has gradually become the mainstream energy storage method due to its stable charging and discharging temperature, high energy density, and small volume change. However, most phase change materials (PCM) have low thermal conductivity [5,6,7], resulting in low charging and discharging efficiency of the thermal storage device, which is one of the key problems hindering the development of phase change thermal energy storage technology.
To solve this problem, scholars have carried out a large amount of research, mainly using two methods: optimizing the structure of the thermal storage unit and modifying PCMs. The former usually involves adding fins or changing the shape of the thermal storage unit in the thermal storage device to increase the heat exchange area and natural convection intensity between PCM and the heat storage unit, thereby improving the charging and discharging rate of PCM. Sun et al. [3] proposed a double-spherical PCM thermal storage unit with a ring-shaped fin and studied the influence of each parameter of the fin on the thermal performance of the thermal storage unit through experiments and numerical simulations. They pointed out that the ring-shaped fin can shorten the heat storage time of the heat storage unit by 14.4%. Joshi et al. [8] used structural theory to minimize the total melting time of a given fin-to-PCM volume ratio by relocating and reducing the size of the fins in the high heat transfer potential zone. The results showed that the optimized fin-to-PCM volume ratio was reduced by 50%, and the melting rate of the phase change material was increased by 6.34% within the same melting time. Jia et al. [9] investigated the effect of needle-shaped fins on spherical PCM storage units, discussing the impact of fin quantity, length, and diameter on fin efficiency, and found that the optimal needle-shaped fin could shorten melting time by more than 50%. Meghari et al. [10] used n-octadecane and gallium as phase change materials, filled in spherical storage units with ordinary fins and hollow fins. Through CFD numerical simulation, the effects of ordinary fins and hollow fins at different angles were compared, and the results showed that the melting time of PCM with hollow fins was reduced by 14 times compared to the structure without fins. Tang et al. [11] proposed adding a heat transfer fluid channel in the spherical storage unit and discussed the influence of channel diameter, inclination angle, and other parameters on melting performance. Finally, they pointed out that the melting time was reduced by 28% when the ratio of channel diameter to sphere diameter was 0.25. However, while adding fins can indeed improve the heat storage rate, the fins themselves occupy a certain volume of the storage unit, which may reduce the overall heat storage capacity. In addition, the manufacturing and installation processes for fins are also relatively complex. Therefore, modifying the PCM may be a more advantageous approach.
The main method for modifying phase change materials is to composite them with high thermal conductivity materials such as metal nanoparticles, carbon nanoparticles, etc., to obtain composite phase change materials (CPCM) with higher thermal conductivity. Yang et al. [12] proposed three types of composite materials, namely “nanoparticle/paraffin”, “metal foam/paraffin”, and “nanoparticle/metal foam/paraffin”. Based on the heat flux method and heat storage experiments, the heat transfer performance and the effect of metal foam and nanoparticles on the thermal properties of different parameter composite PCMs were studied. The results showed that the thermal conductivity of “nanoparticle/paraffin”, “metal foam/paraffin”, and “nanoparticle/metal foam/paraffin” increased in turn, and they were 123.27%, 740.39%, and 847.15% higher than pure paraffin, respectively. The melting time was reduced by 6.74%, 62.72%, and 72.61% compared with pure paraffin, respectively. Prabakaran et al. [13] developed a composite phase change material by combining fatty acid with functionalized graphene nanoplatelets and studied its melting behavior in a spherical thermal energy storage unit. The results showed that when the volume fraction of graphene nanoplatelets was 0.5%, the thermal conductivity was enhanced by about 102%, and the melting time was significantly shortened. However, the study also revealed the issue of increased viscosity caused by the addition of nanomaterials, which needs to be addressed. Mayilvelnathan et al. [14] synthesized a CPCM by compounding graphene nanoparticles with erythritol and tested its thermal performance in a horizontal shell and tube heat exchanger. The results showed that the melting time of NDPCM was 20% shorter than that of pure PCM when the inlet temperature of heat transfer oil was 180 °C, and the mass flow rate was 1 kg/min. Zhang et al. [15] proposed a new fin structure and the addition of Al2O3 nanoparticles to enhance the thermal storage performance of energy storage systems. Nano Al2O3 particles were added to PCM at concentrations of 3%, 6%, and 9%, and the melting time was shortened by 13.1%, 15.6%, and 18.8%, respectively. Jirawattanapanit et al. [16] proposed a shell-and-tube thermal energy storage device based on an outer waveform wall and discussed two thermal enhancement methods: fins and nanocomposite phase change materials (NePCM). The study showed that compared with pure PCM and a wave number of 4, the time required for the energy storage system to reach complete melting was reduced by 14% and 31% when the copper nanoparticle concentration was 4 vol%, and the wave number was 8, respectively. Abderrahmane et al. [17] proposed an improved shell-and-tube thermal energy storage device and filled it with copper nanoparticles and paraffin. The research results showed that adding copper nanoparticles could improve thermal and melting performance. When using a nanoparticle concentration of 8%, the melting time was reduced by 27%, and the entropy production of the system was also reduced. Masoumi et al. [18] filled dodecanoic acid and titanium dioxide nanoparticles into a horizontal shell and tube latent heat storage unit and installed longitudinal fins inside the tube. The results showed that adding fins increased the melting rate by 68%. However, although adding 0.39 wt.% of titanium dioxide nanoparticles to the PCM increased the thermal conductivity by 7% and 15% in liquid and solid states, respectively, its effect on improving the melting rate of the PCM was less than 4%, which was due to the increase in viscosity that weakened the natural convection flow. From the above literature, it can be seen that although compounding PCM with metal nanoparticles can improve the thermal conductivity of PCM, there are still some other issues, such as settling problems that occur easily after multiple thermal cycles due to the high density of metal nanoparticles. In comparison with metal nanoparticles, expanded graphite (EG) has a lower density, which can alleviate the settling and agglomeration of nanoparticles in PCM [19].
Previous research has mainly focused on enhancing the heat transfer of phase change thermal energy storage units by adding fins or metal particles, while the effect of adding EG on the melting characteristics of phase change thermal energy storage units remains unclear. In order to fill this research gap, this study combines experiments with numerical simulations to investigate the melting process of a spherical phase change thermal storage unit filled with EG–MA composites (where the experiments were conducted to validate the accuracy of the numerical model). The effects of EG mass fraction and Ste number on the melting process of PCM in the device were analyzed, and formulas relating the liquid mass fraction to Ste, Fo, Gr numbers, and EG mass fraction were derived. These formulas can help better understand the role of EG in phase change thermal energy storage units and optimize their design and performance. The contribution of this study is filling the previous research gap and providing important information on the impact of adding EG on the performance of phase change thermal energy storage units.

2. Experimental Methods and Procedures

2.1. Preparation and Packaging of CPCMs

The PCM used in this study is pure myristic acid (MA) produced by the China National Pharmaceutical Group Reagent Co., Ltd. (Shanghai, China), with a molecular formula of C14H28O2. The expanded graphite (EG) used in this study was prepared in our laboratory using a microwave expansion method, with an expansion ratio of approximately 200 mL/g [20]. The shell material for the phase change thermal storage unit was selected as 304 stainless steel. The physical properties of the PCM, EG, and shell are shown in Table 1 [21,22].
Figure 1 depicts the physical structure of the experimental unit. The spherical unit was constructed using stainless steel, featuring an outer diameter of 50 mm and a wall thickness of 1 mm. In contrast to other studies [23] that commonly utilized transparent materials like glass for producing spherical containers that allow direct observation of the melting process, the containers employed in this study were opaque. This choice was made due to the dark nature of the CPCM sample, rendering the transparency of the shell material irrelevant. By employing a stainless steel spherical container, the thermal resistance of the spherical shell was minimized, thereby achieving conditions as close as possible to isothermal boundary conditions. Although an invasive temperature measurement method was employed in this study, the influence of the thermocouple, with its thickness of only 1 mm, is negligible compared to the size of the sphere itself. The temperature data recording system recorded the temperature data at a frequency of 1 min.
In order to minimize the presence of voids within the solid sample, the pre-prepared PCM was carefully added to the spherical container in successive increments. Each addition ensured that the PCM was fully encapsulated until the container reached its maximum capacity.

2.2. Experimental Process

The experimental setup and procedure are depicted in Figure 2. The system consisted of a heat storage unit and a temperature data recording system. Three thermocouples, namely T1, T2, and T3, were longitudinally distributed within the heat storage unit to measure the temperatures. Prior to each melting experiment, the spherical unit filled with CPCM was placed in the initial temperature water region (water area 1) for a minimum of 12 h to ensure uniformity in the initial temperature of the sample within the sphere. Subsequently, the spherical heat storage unit was swiftly transferred to the high-temperature water region (water area 2) to initiate the melting experiment.

2.3. Uncertainty Analysis

The experiment was subject to a degree of uncertainty relating to the accuracy of the measuring device. Therefore, the residual sum of squares (RSS) method was used to evaluate the uncertainty of temperature measurement. The uncertainty of the K-type thermocouple used to measure temperature changes was ±1.5 °C. The uncertainty of the temperature data acquisition instrument was ±1.0 °C, whereas that of the constant-temperature water bath temperature control was ±1.0 °C. The uncertainty of the overall temperature measurement of the system was determined as follows:
U c = C 1 2 U 1 2 + C 2 2 U 2 2 + C 3 2 U 3 2 U 1 = 1.0 n , U 2 = 1.0 n , U 3 = 1.5 n
where U1, U2, and U3 are the uncertainties caused by the data acquisition instrument, constant temperature water bath, and thermocouple, respectively; n is the uniform distribution constant, generally taking the value 3 ; and C1, C2, and C3 are sensitivity coefficients and take the value 1 [24,25]. The calculated uncertainty of temperature measurements is ±1.2 °C.

3. Problem Statement

In this study, a three-dimensional model was employed to simulate the phase change unit filled with spherical PCM. The phase change unit had an inner diameter of 50 mm and a wall thickness of 1 mm and accounted for the effects of gravity. The outer surface of the spherical shell was maintained at a constant temperature. Due to the influence of buoyancy-driven natural convection during the melting process, the shape of the melted solid CPCM is non-circular, except in cases where materials have a high mass fraction of EG.

3.1. Governing Relations

To simplify the numerical calculations, the following assumptions were made:
(1)
The PCM within the heat storage unit is assumed to be isotropic and uniform.
(2)
The melted PCM is treated as an incompressible laminar fluid.
(3)
The volume change of the PCM during phase change is negligible.
(4)
Physical properties, except for density, are assumed to remain constant with temperature. The study focuses on the constrained melting of PCM in the heat storage unit and employs the Boussinesq hypothesis to define density. Density changes are only considered when buoyancy is taken into account.
(5)
Density changes in the liquid state, which drive natural convection, are considered only in the momentum term.
Based on the aforementioned assumptions, the continuity, momentum, and energy equations were formulated. In order to account for the phase change region within the PCM, the enthalpy-porosity method was employed [26]. The porosity of each cell was defined as the liquid fraction of the cell. In regions where complete solidification occurred, the porosity was set to zero, resulting in zero velocity. The governing equations are presented as follows:
Continuity:
V = 0
Momentum:
( ρ V ) t + V ( ρ V ) = P + μ 2 V + ρ β g ( T T 0 ) + A s V
Energy:
t ( ρ H ) + ( ρ V H ) = ( k l T )
Here is the Hamiltonian, defined as
= x i + y j + z k
where V , ρ , t , μ , β , T 0 , g , and k l represent the velocity vector, density, time, dynamic viscosity, thermal expansion coefficient, reference temperature, gravitational coefficient, and thermal conductivity, respectively; P , H t o t , and A s V represent pressure, total enthalpy, and the momentum source term. Total enthalpy consists of sensible enthalpy and latent enthalpy:
H t o t = H + Δ H
Sensible enthalpy can be expressed as
H = h 0 + T 0 T c p d T
Latent heat enthalpy can be expressed as
H = λ L
where L is latent heat, and the liquid mass fraction λ at different stages is expressed as
λ = 0 , T < T solid T T solid T liquid T solid , T solid < T < T liquid 1 , T liquid < T
As in the momentum source term is expressed as:
A s = ( 1 λ ) 2 λ 3 + 0.001 A mush
The phase transition interface typically constitutes a mushy region consisting of a solid–liquid mixture. In this study, the mushy zone constant (commonly ranging from 10 5 to 10 7 ) was denoted as A m u s h , and a value of A m u s h = 10 5 was adopted.
The thermophysical properties of the CPCMs were determined using a two-phase mixing model [27], and the following equations were proposed for calculations.
The volume fraction of the CPCM can be expressed as follows:
ϕ = 1 1 + ( 1 ω E G 1 ) ρ E G ρ pcm
The density of the CPCM can be expressed as follows:
ρ c p c m = ( 1 ϕ ) ρ p + ϕ ρ E G
The specific heat of the CPCM can be expressed as follows:
c p , c p c m = ( 1 ϕ ) c p , p + ϕ c p , E G
The latent heat of the CPCM can be expressed as follows:
L c p c m = ( 1 ω E G ) Δ L p
The thermal conductivity of the CPCM can be expressed as follows:
k c p c m = k c [ k d + 2 k c + 2 ϕ ( k d k c ) k d + 2 k c ϕ ( k d k c ) ]
where c is the continuous phase, and d is the dispersed phase. The viscosity of the CPCM can be expressed as follows [28]:
μ c p c m = μ p ( 1 ϕ ) 2.5
The physical properties of the CPCM calculated by the formula are shown in Table 2.

3.2. Boundary Conditions and Computational Methodology

At t = 0, the temperature set for the PCM region inside the spherical phase change heat storage unit was 25 °C, lower than the PCM’s phase change temperature, indicating that the PCM was in a solid state at t = 0. In the case of the spherical phase change heat storage unit used in this study, the outer wall of the shell was in contact with a constant-temperature water bath, representing the first type of boundary condition where the temperature of the outer wall of the shell remains constant. The inner wall surface of the shell, in contact with the PCM, serves as the coupling boundary with no slip velocity. This model considers thermal conduction within the spherical shell. Hence, the initial and boundary conditions can be expressed as follows:
t = 0 , T = T 0 R = R s out , T = T h R = R s in , k s T s i n = k p T p i n
where R s in and R s out represent the inner and outer surfaces of the spherical shell, respectively, and subscripts s and p denote the spherical shell and PCM, respectively.
In this study, the temperature Th of the outer wall of the capsule was set to 60, 70, or 80 °C, while the initial temperature T0 was set to 25 °C. The selection of initial and boundary conditions was based on the supply and return water temperature. The melting process was numerically simulated using ANSYS Fluent 19.2 software. The finite volume method (FVM) and QUICK scheme were utilized to discretize the governing equations. A pressure-based solver was employed to solve the control equations. The second-order upwind algorithm was applied as a spatial discretization method for solving the energy and momentum equations. The pressure correction equation followed the PRESTO format. Under-relaxation factors for pressure, momentum, energy, and liquid fraction were set as 0.3, 0.7, 1, and 0.9, respectively. Convergence of the solution was assessed at each time step, with convergence criteria set at 10−4, 10−5, and 10−7 for the continuity, momentum, and energy equations, respectively.

3.3. Characteristic Parameters and Evaluation Index

The Ste number represents the driving force for heat transfer in the melting process.
S t e = C p ( T h T m ) L
The Fo number represents dimensionless time.
F o = k t ρ C p R 2
The Gr number represents the strength of the natural convection effect in the melting process.
G r = g β R 3 ( T h T m ) ρ 2 μ 2
The Nu number represents the intensity of transient convective heat transfer.
N u = h l R k
The liquid mass fraction of the PCM is calculated as follows:
λ = m M

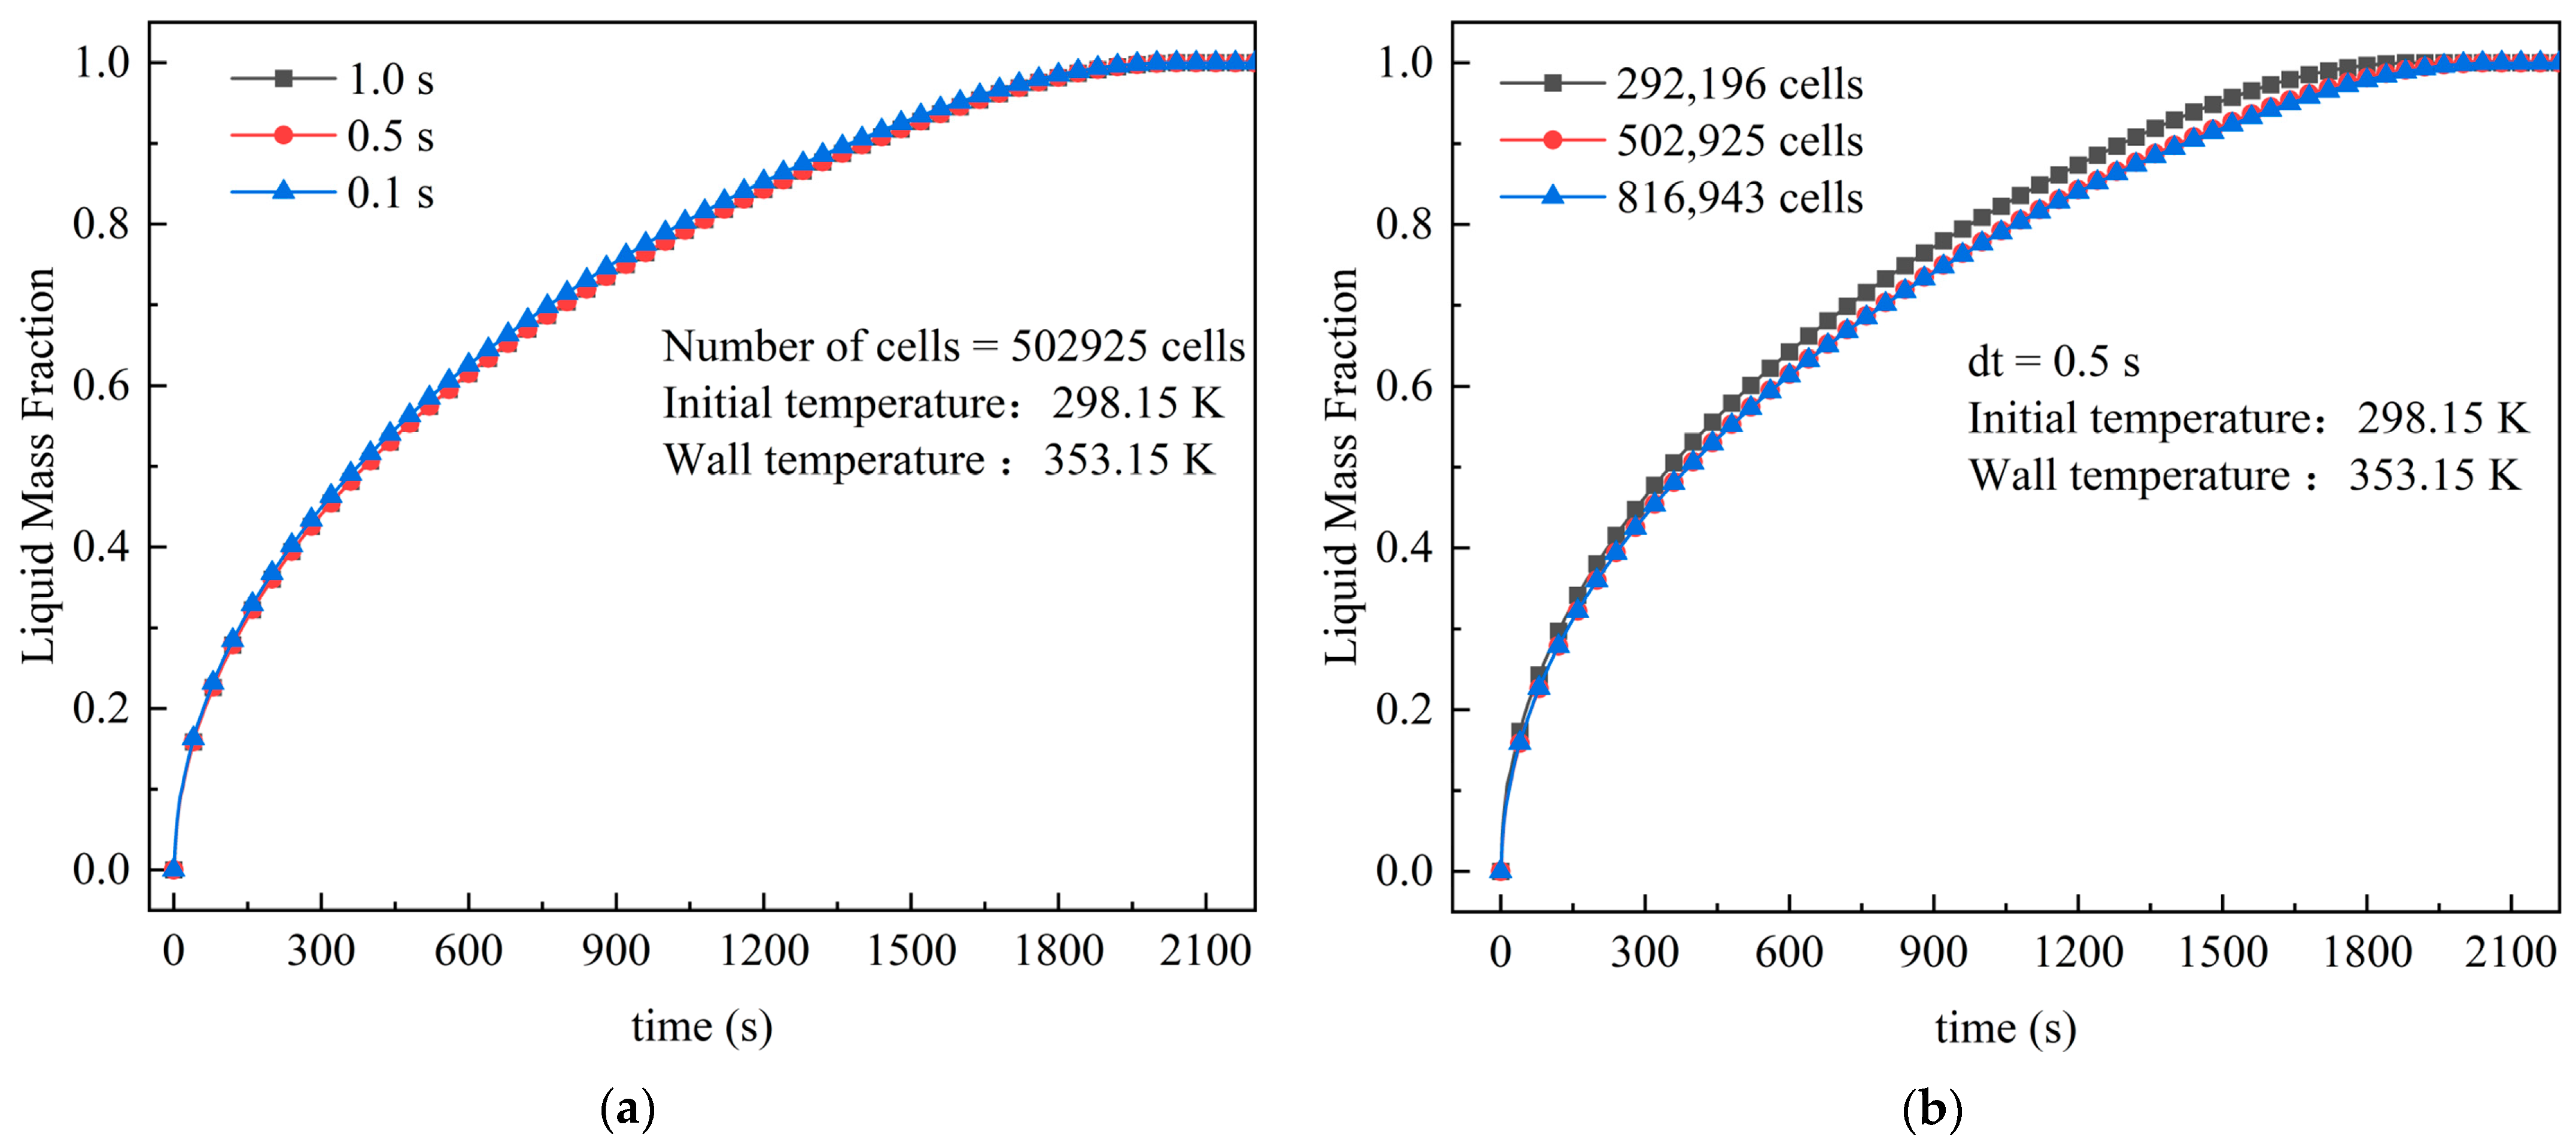
3.4. Grid and Step-Length Independence Verification

During the preliminary simulations, careful investigations were conducted to assess the influence of the time step and grid size on the simulation results. Figure 3a illustrates the verification of time step independence, with time steps of 0.1, 0.5 (selected), and 1 s being considered. It can be observed that the liquid mass fraction remains nearly unaffected by the time step, from t = 0 until the complete melting of the PCM. Workbench meshing 19.2 software was utilized to construct the mesh and refine the portion of the PCM area in contact with the spherical shell. The control equations were solved using ANSYS Fluent 19.2 software. Figure 3b demonstrates the results obtained using three different mesh sizes: 292,196 cells, 502,925 cells (selected), and 816,943 cells, representing the verification of mesh size independence. The full melting time obtained with the 292,196-cell mesh was 1859 s, which significantly differed from the simulation results obtained with the other two mesh sizes (2019 and 2034 s for the 502,925 and 816,943 cell meshes, respectively), exhibiting a difference of approximately 9%. Conversely, the difference between the 502,925 and 816,943 cell meshes was minimal, at around 1.2%.

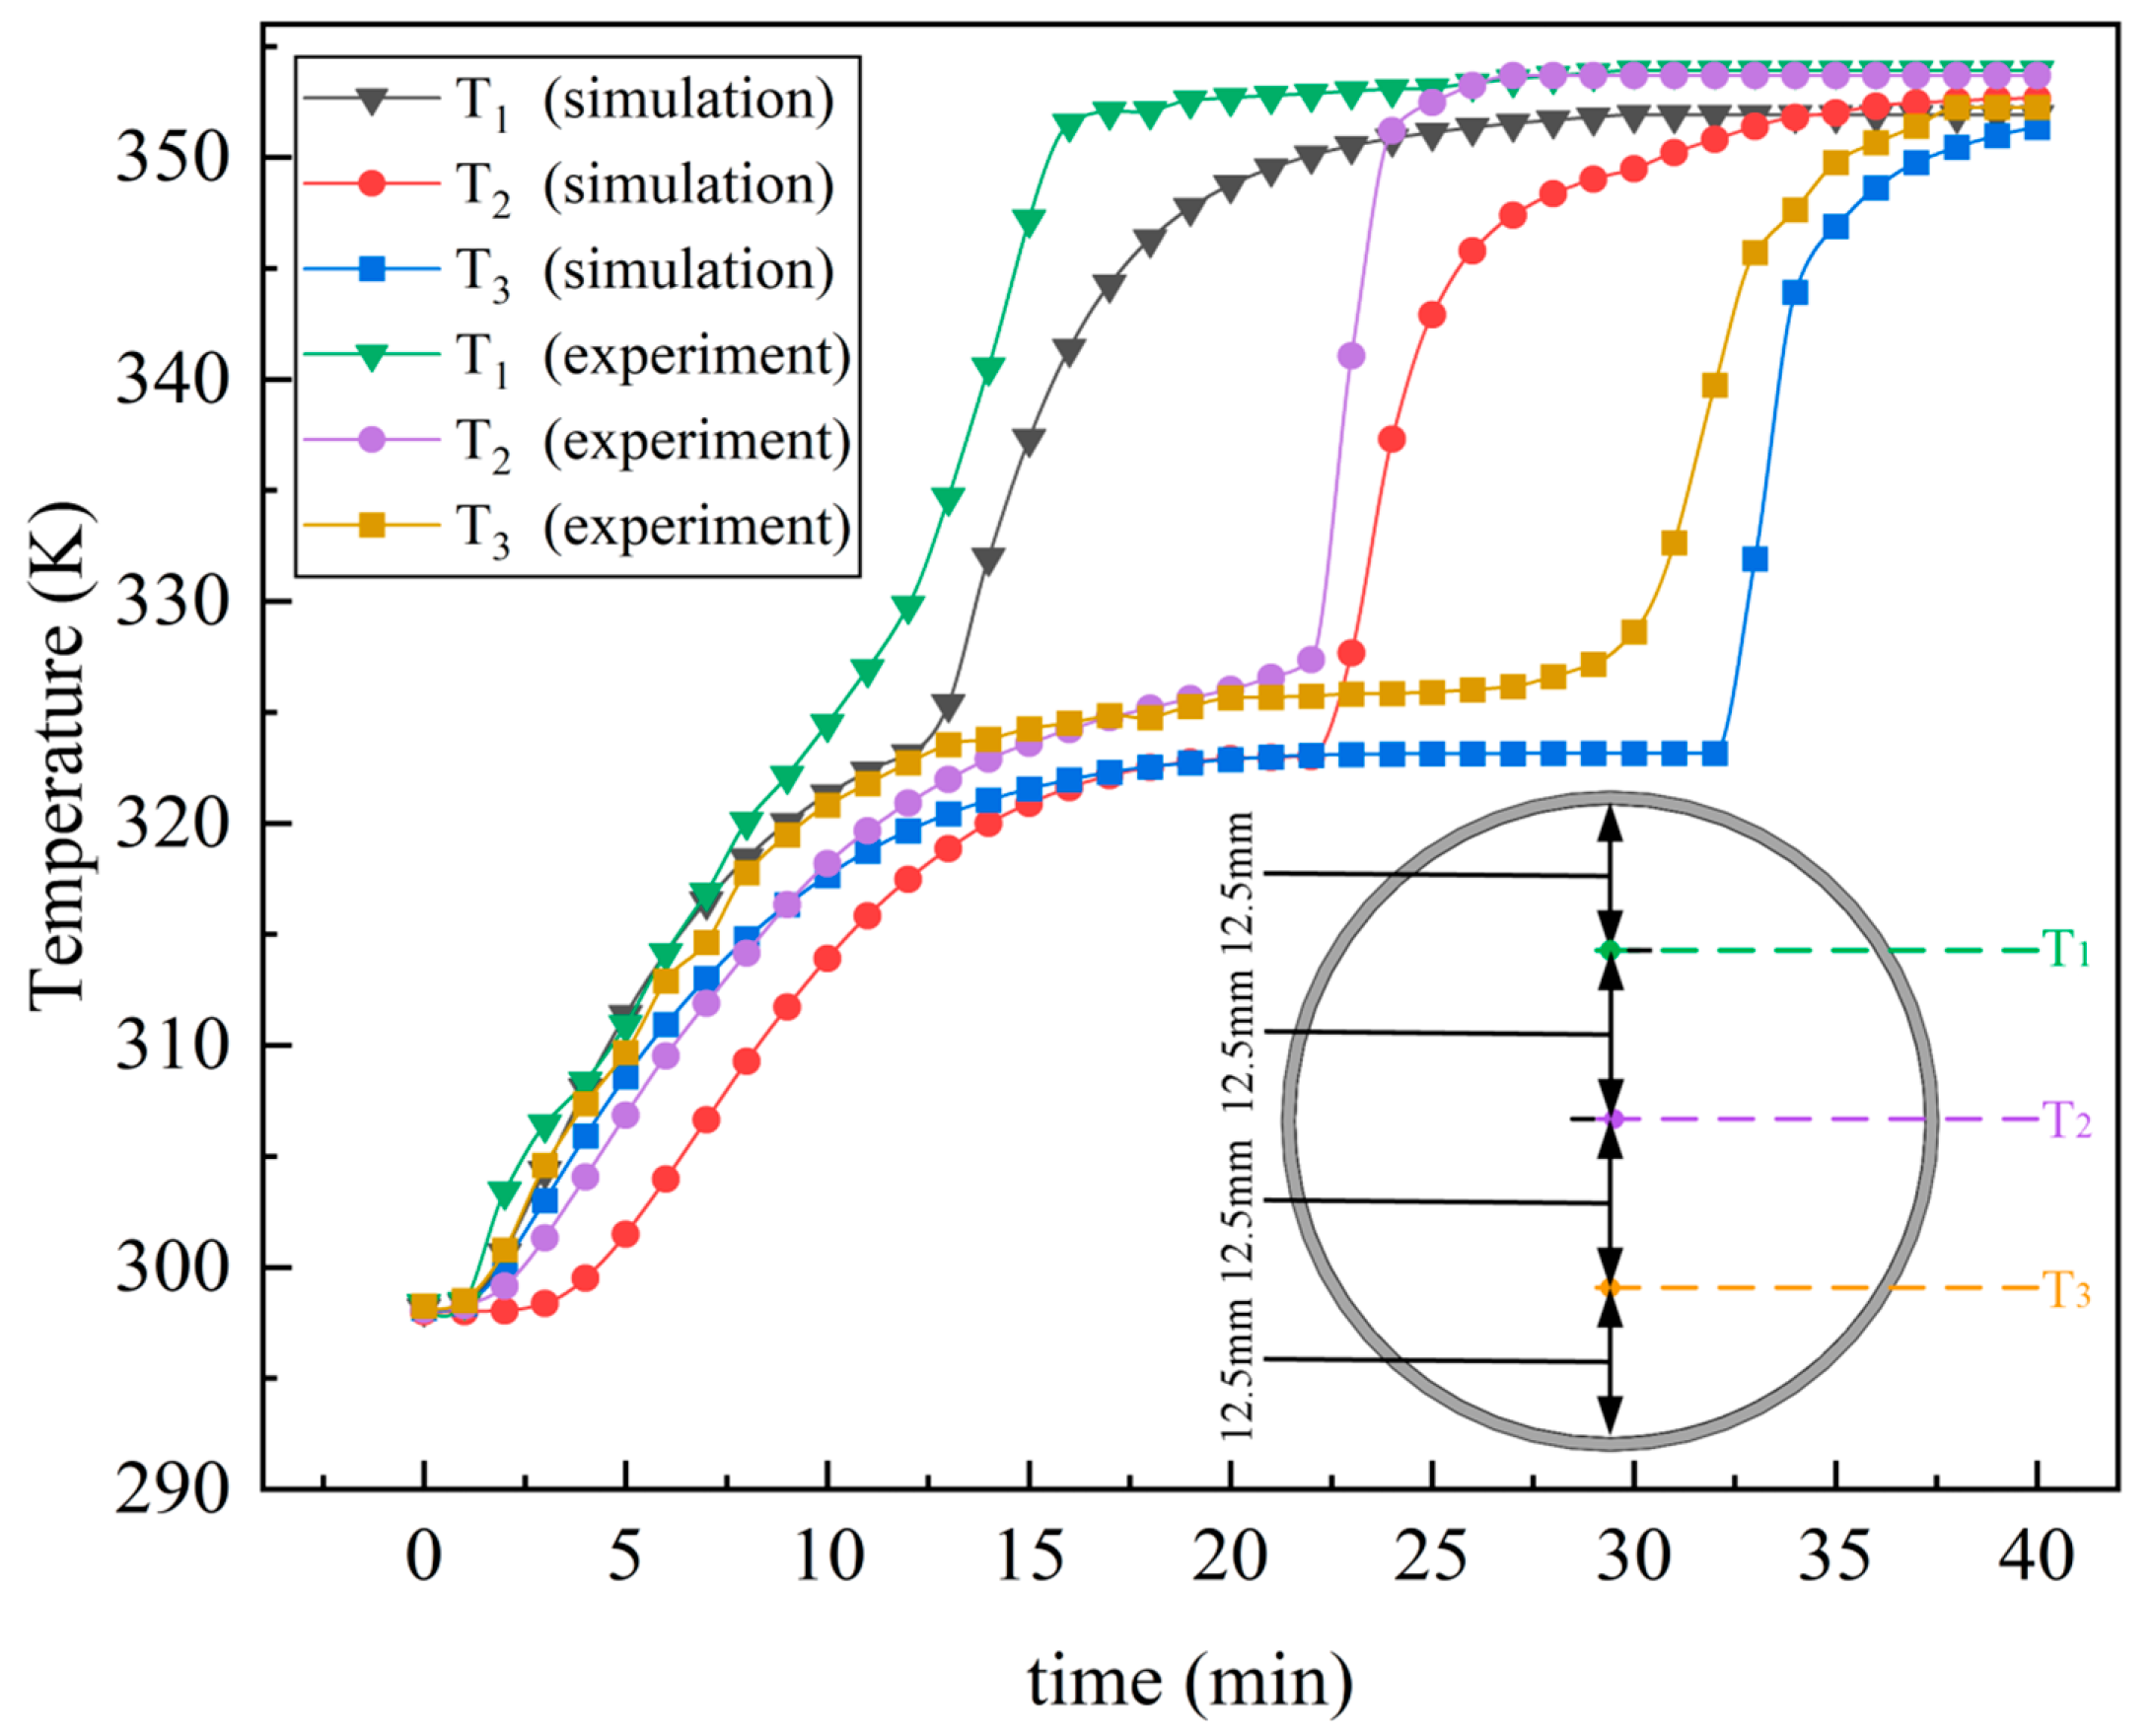
3.5. Model Validation

In Figure 4, the temperature distribution within the thermal storage unit is compared. As the PCM undergoes melting, the hot fluid rises due to density changes, resulting in natural convection inside the sphere. This accelerated melting primarily affects the upper half of the region, leading to a slower melting rate in the middle and lower sections. Consequently, the temperature at position T1 experiences the most rapid increase, while the temperature rise that occurs at position T3 takes the longest time. Although the simulated temperature was slightly lower than the experimentally measured temperature, the overall trend of the comparison curves remains relatively consistent. This discrepancy can be attributed to the nonlinear relationship between the PCM’s enthalpy and temperature to some extent.
The correlation coefficient (c) and root mean square deviation (e) were calculated as per Equations (22) and (23) to evaluate the deviation between numerical results and experimental data:
c = n x i y i ( x i ) ( y i ) n x i 2 ( x i ) 2 n y i 2 ( y i ) 2
e = ( x i y i x i ) 2 n
where n is the total number of analyzed data points and x i and y i are the numerical values of the simulation and experiment at each moment, respectively. The numerical calculation results were in good agreement with the experimental test values. The correlation coefficients for T1, T2, and T3 are 0.990, 0.991, and 0.969, respectively, with root mean square deviations of 1.3%, 1.6%, and 1.5%, respectively (Figure 4). The mass balance check error is 0.6%, and the heat storage balance check error is 1.1%.

4. Results and Discussion

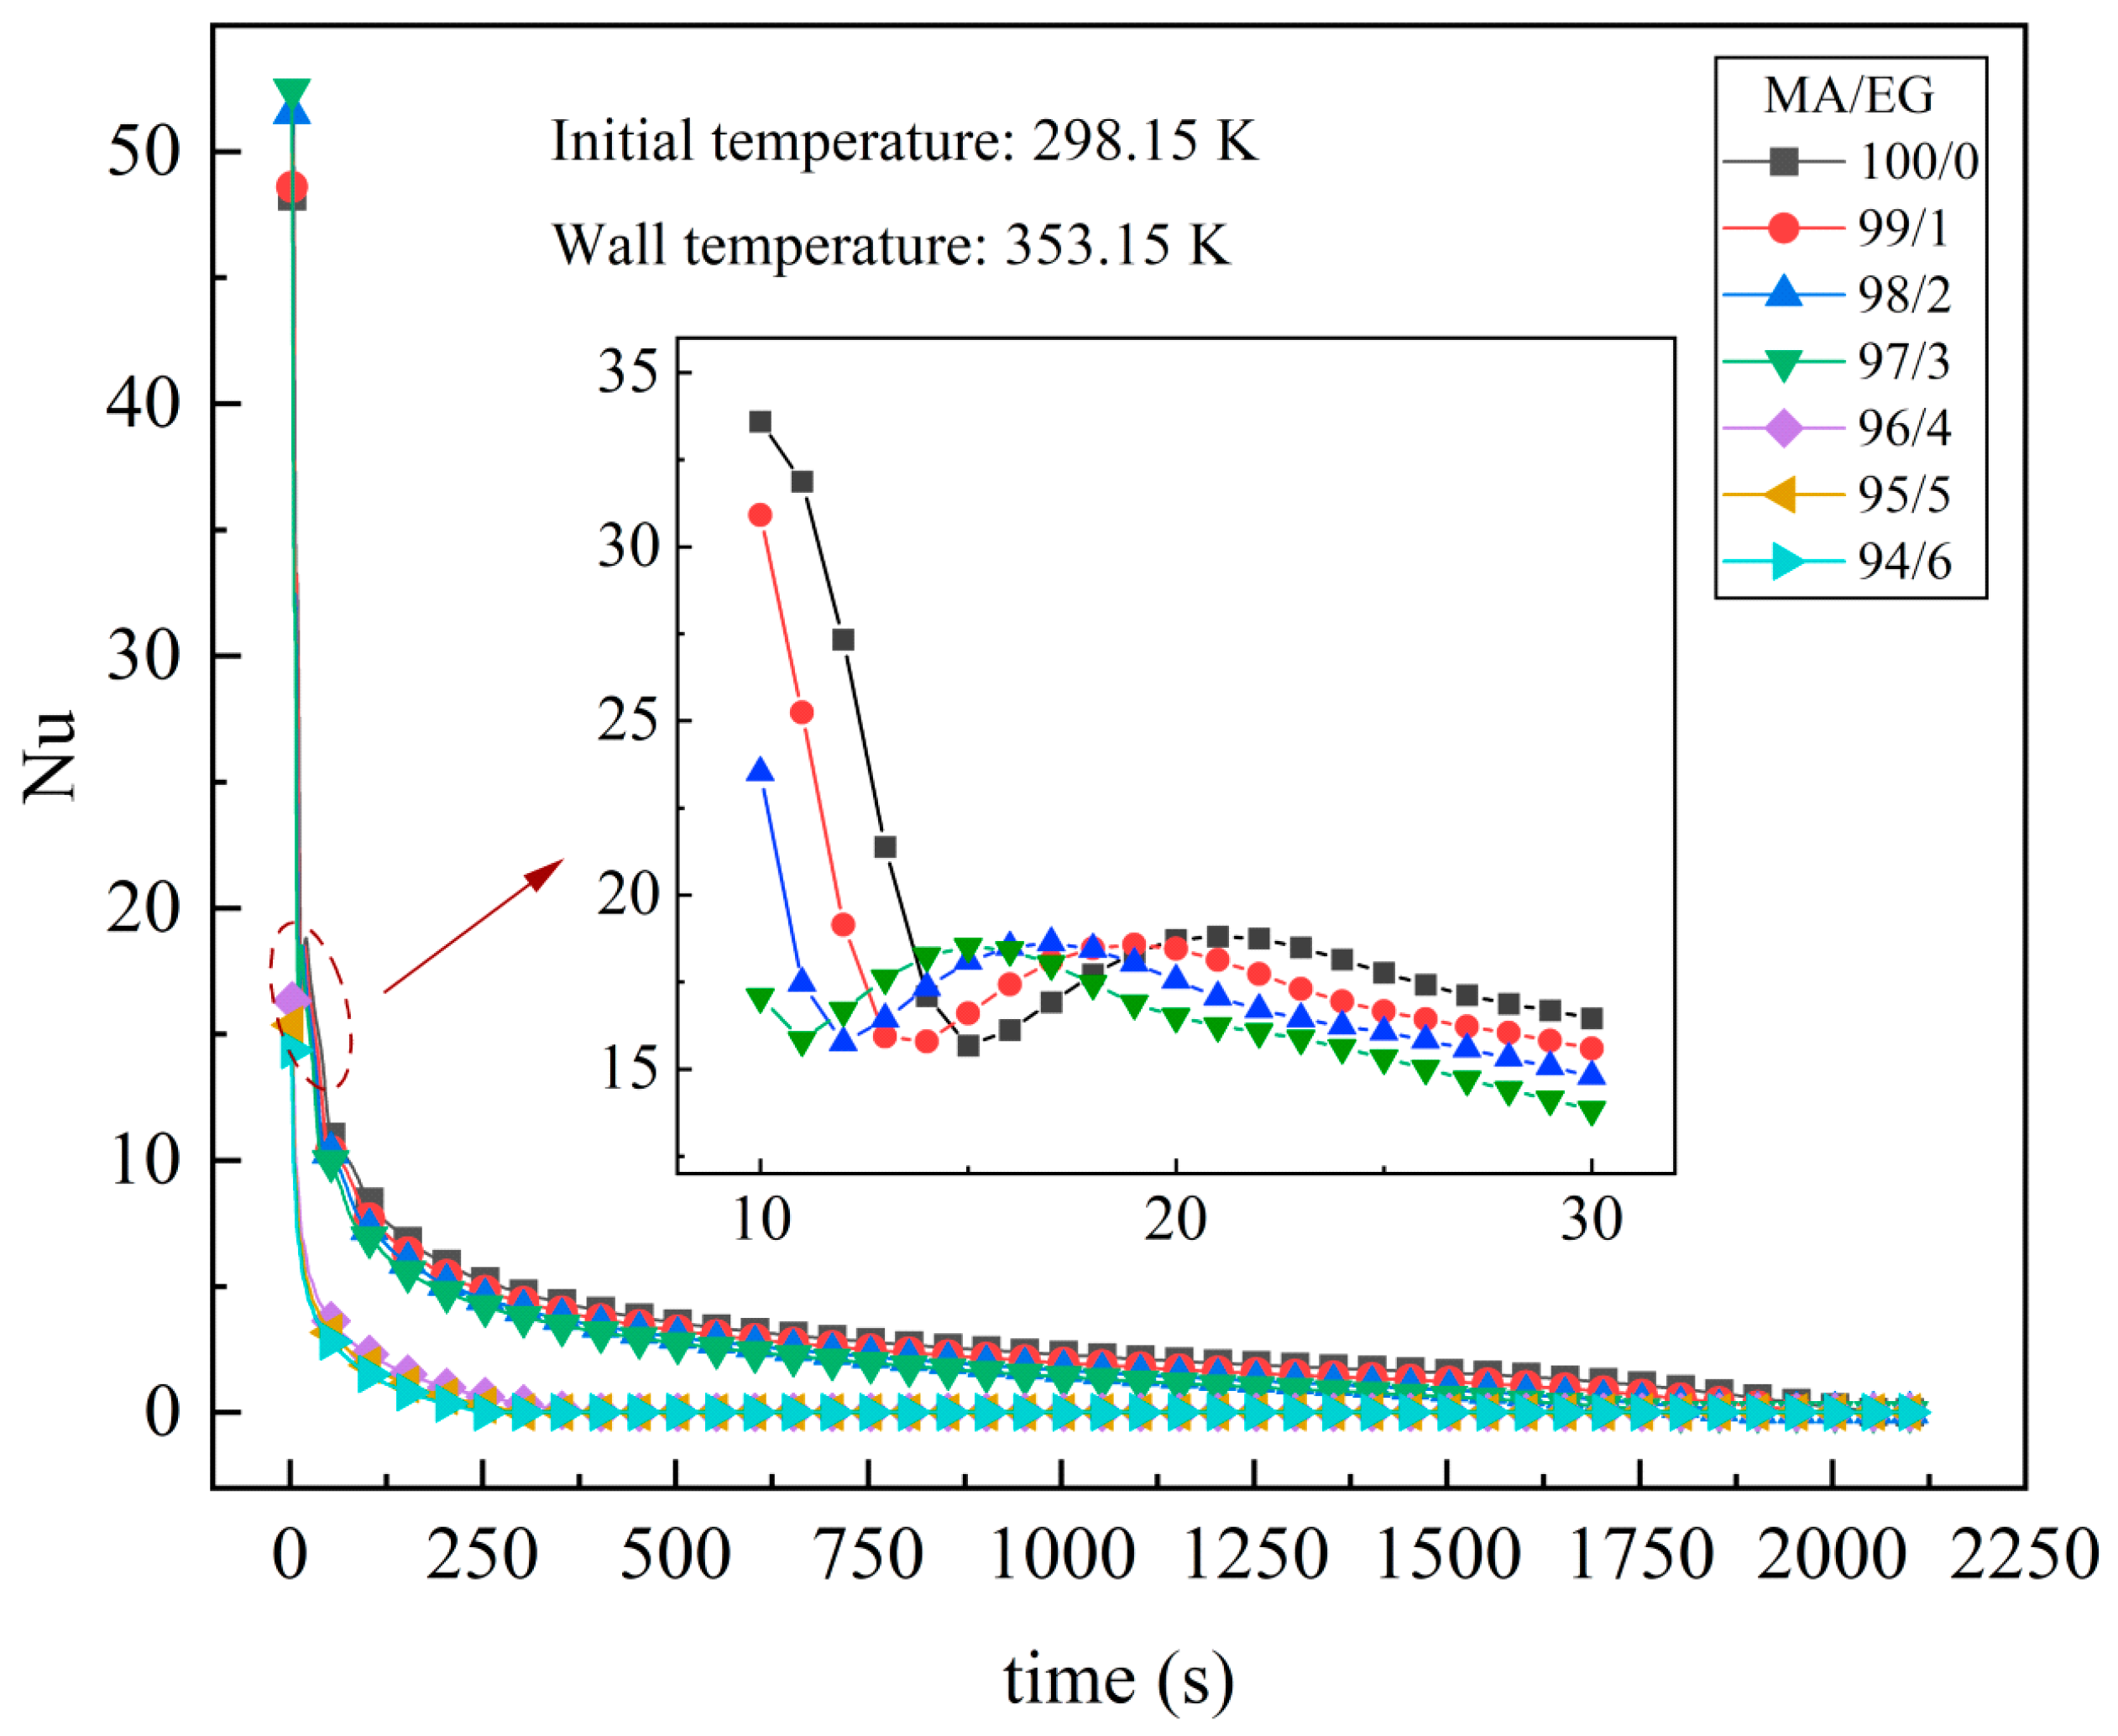
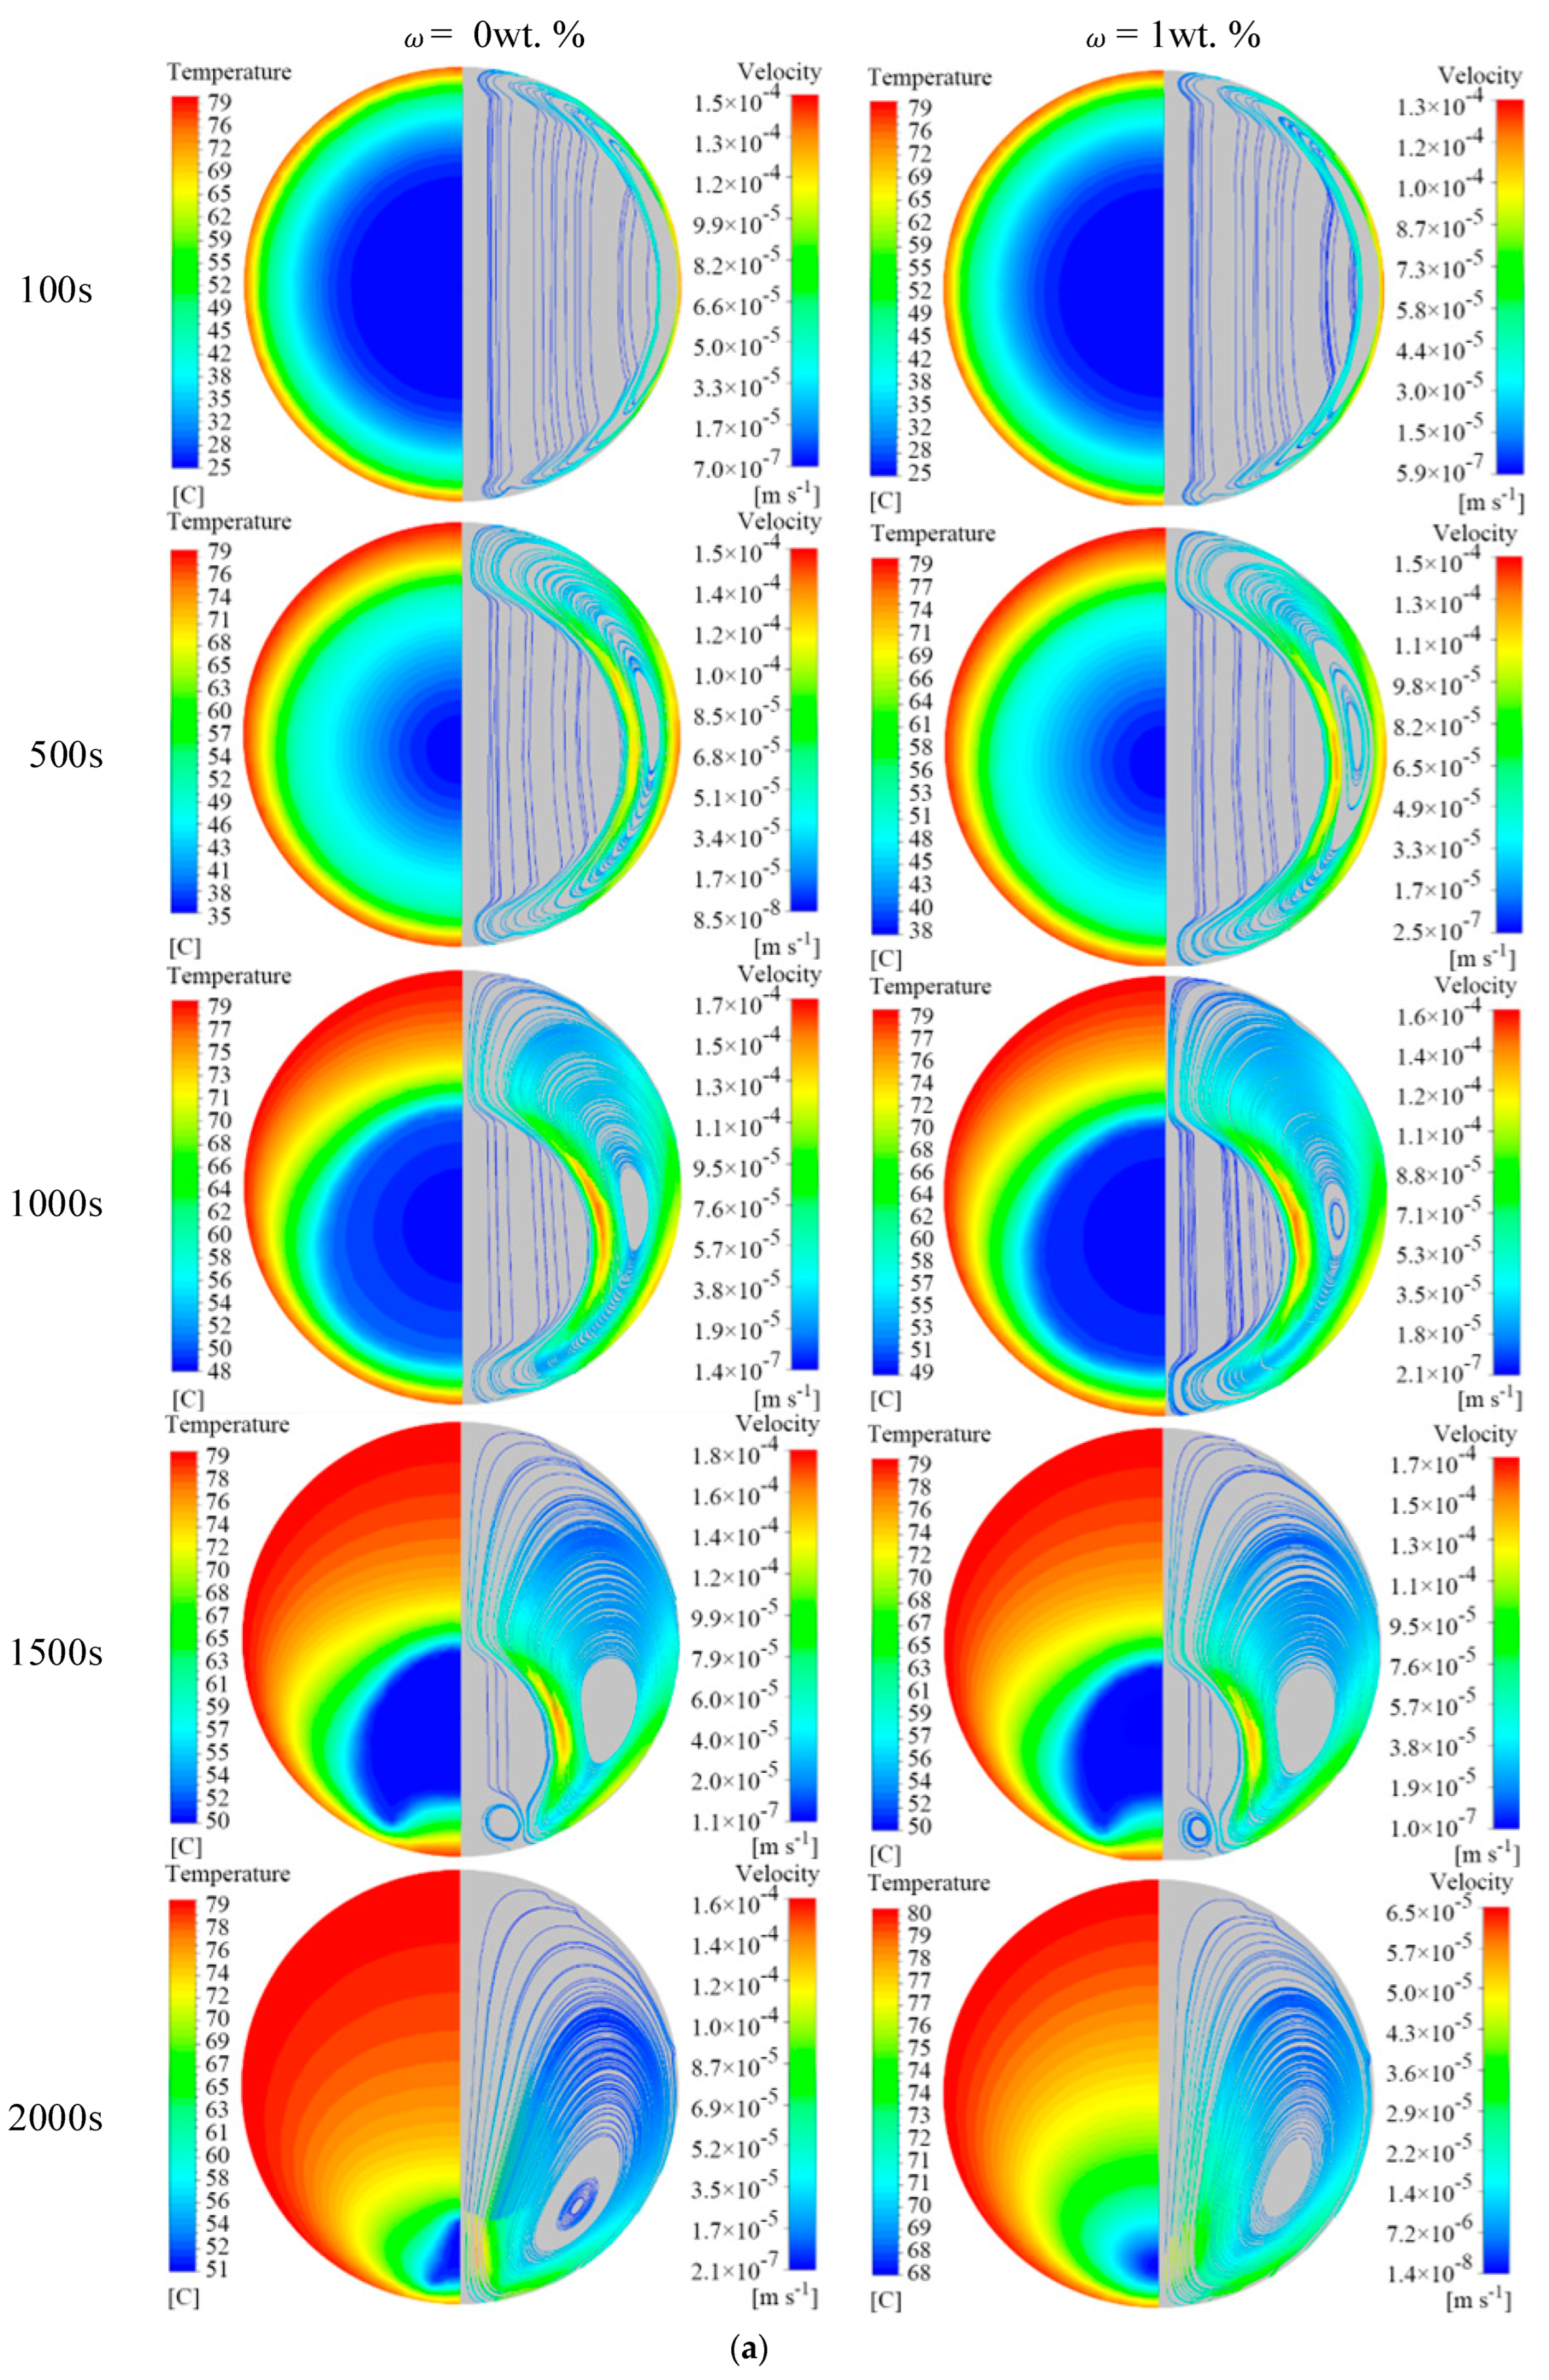
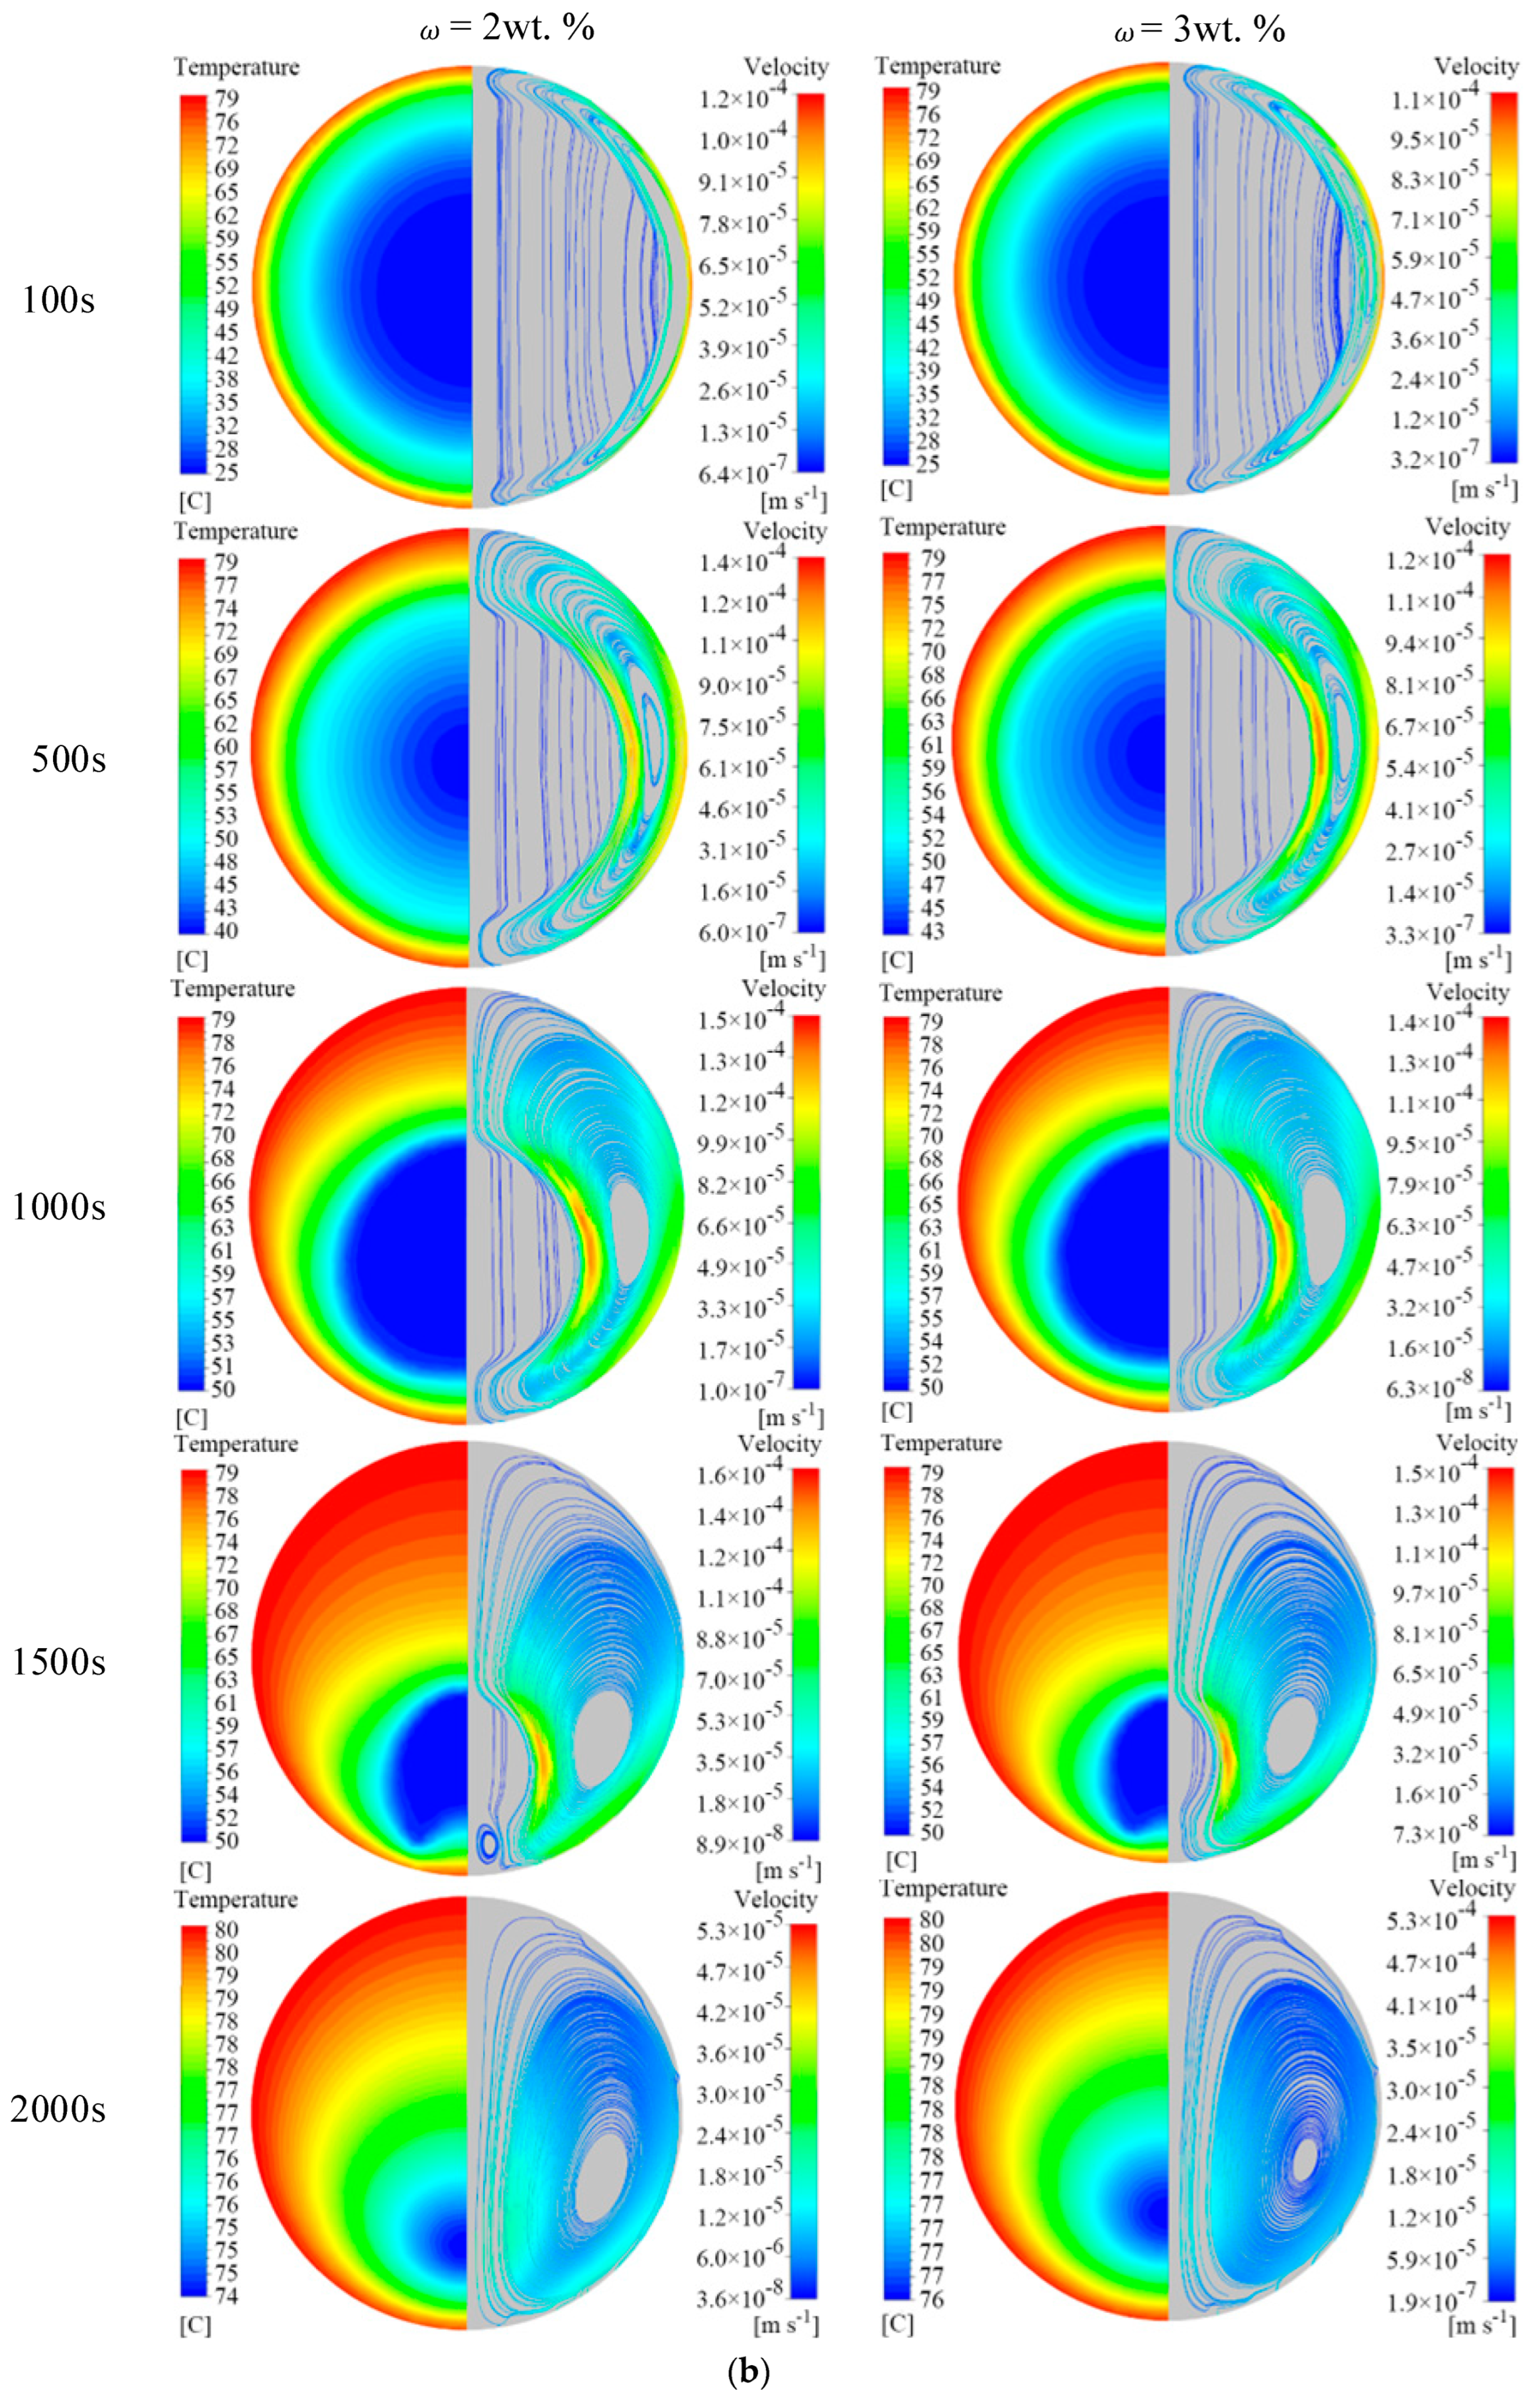
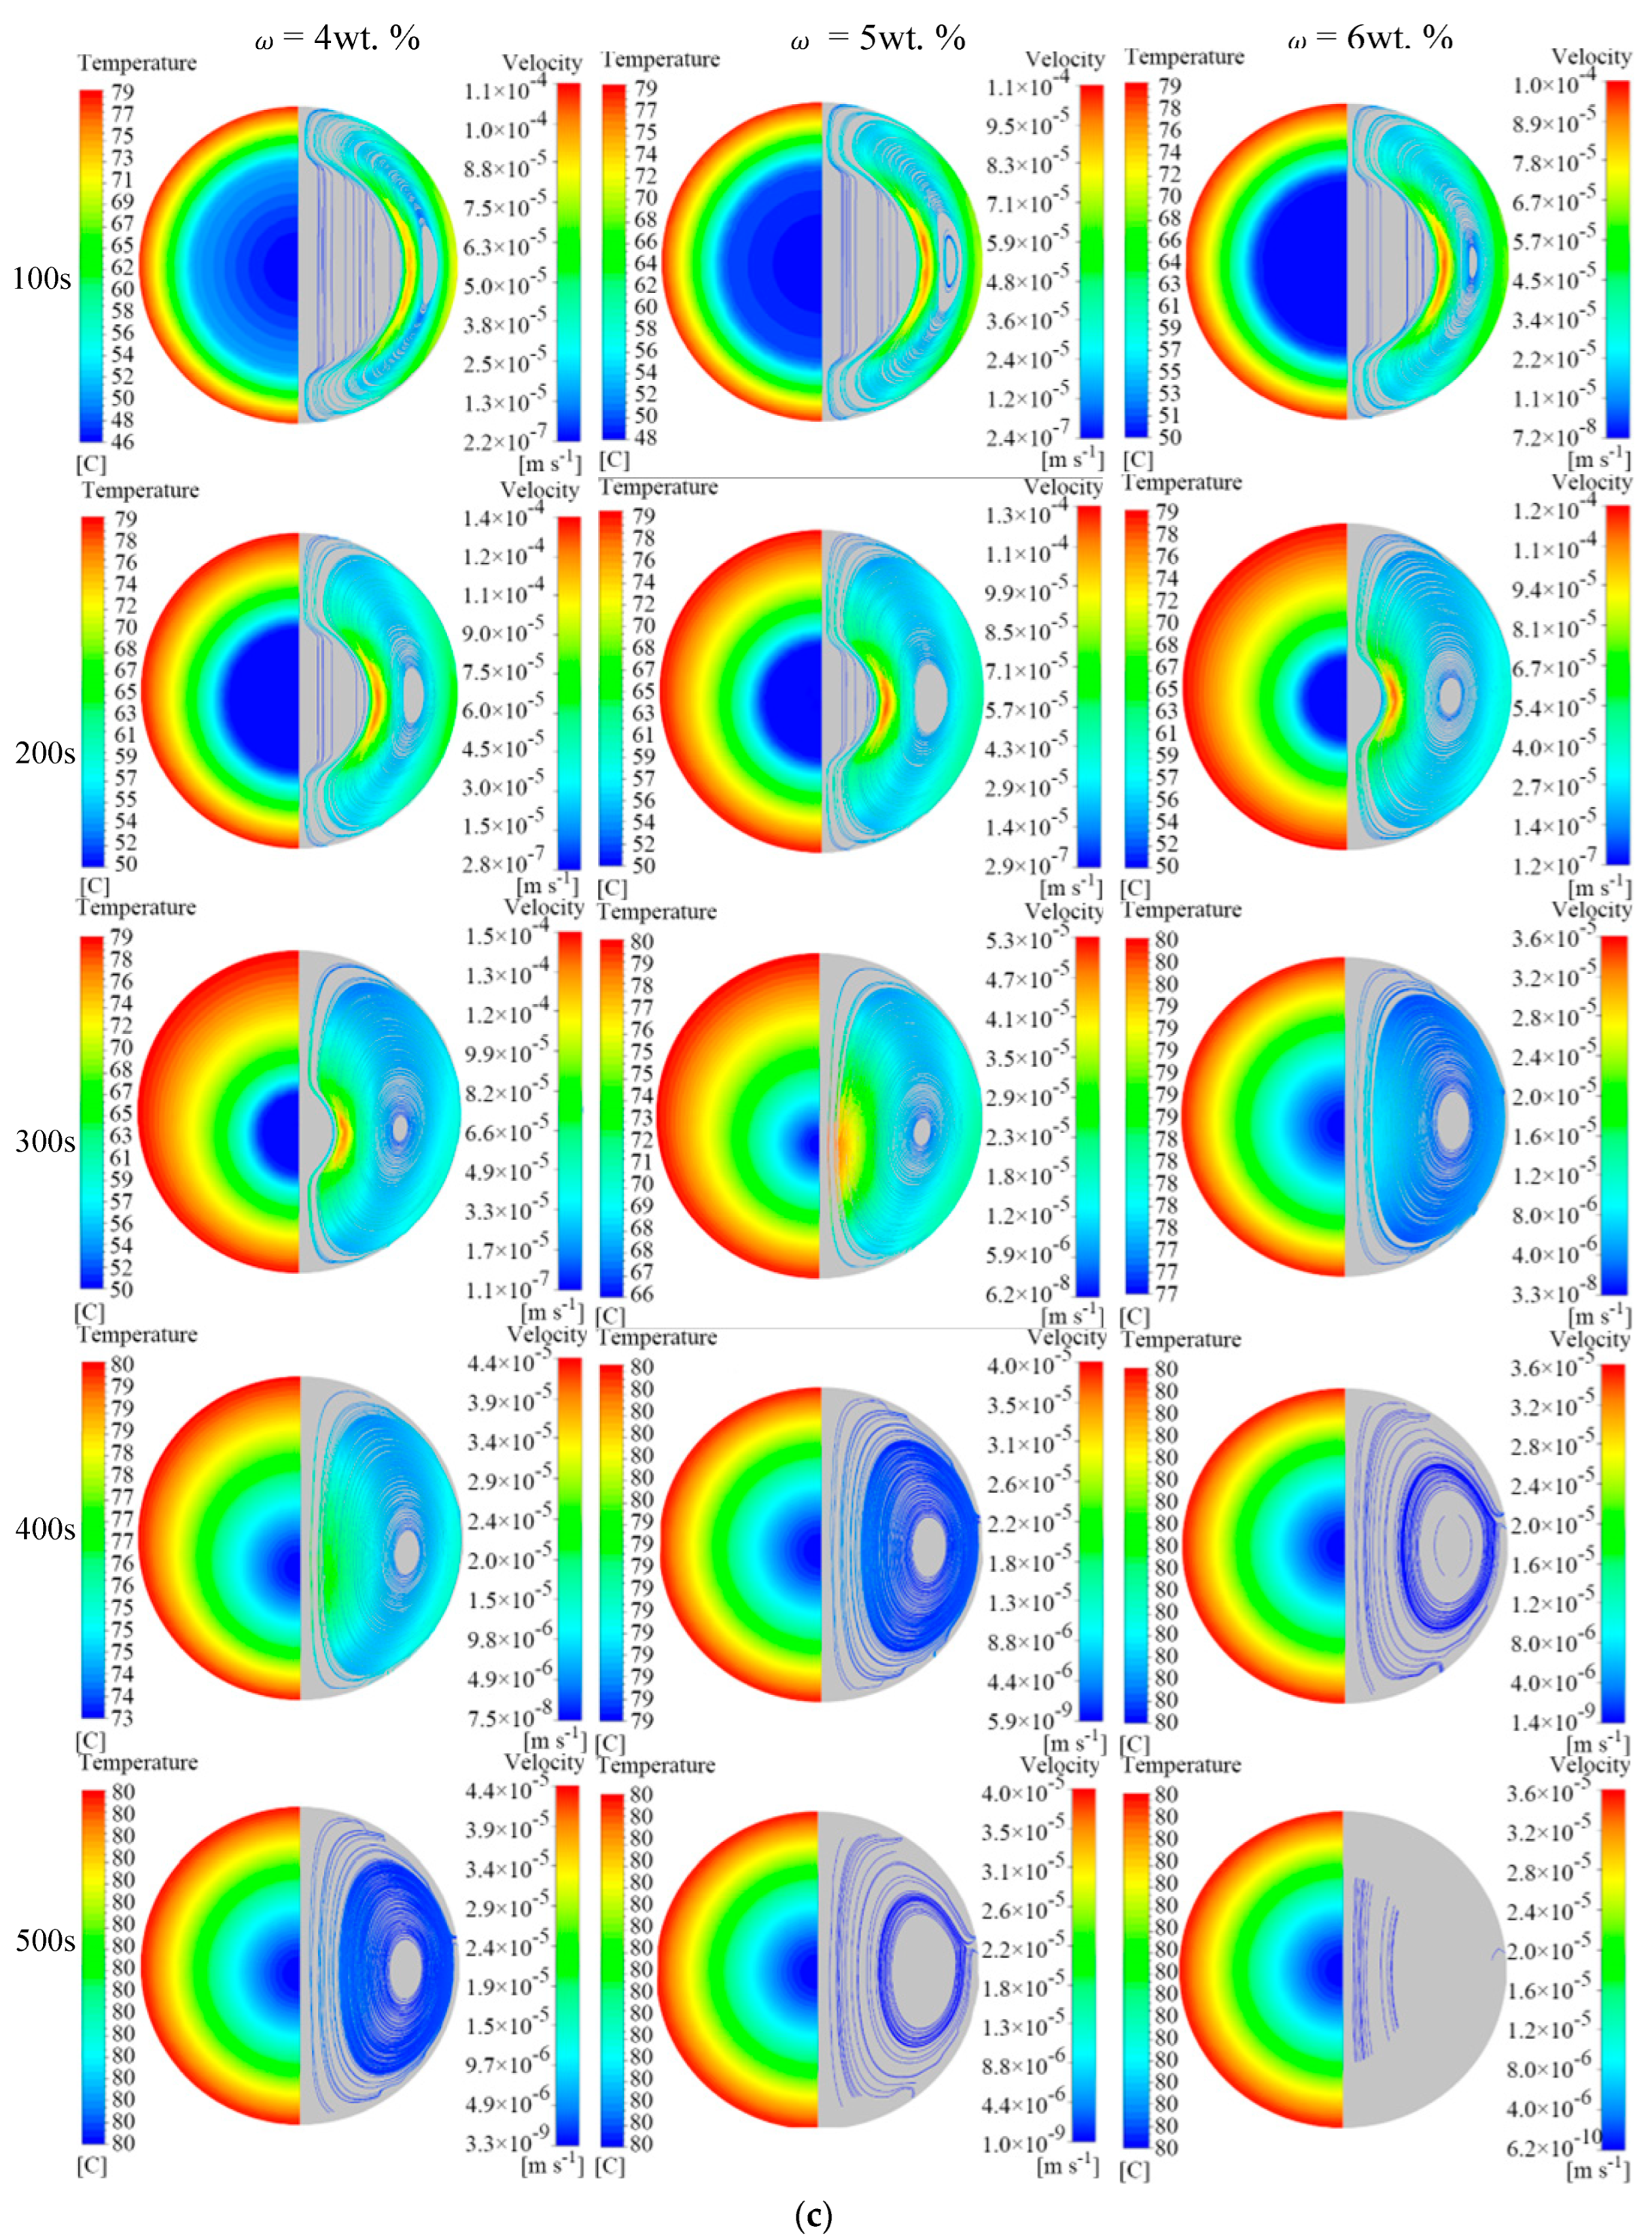
4.1. Effect of EG Content on Melting Properties

Figure 5 depicts the liquid mass fraction curve over time for various EG–MA CPCMs. The complete melting time of the material in the unit decreased with an increase in EG content, primarily due to the high thermal conductivity of the EG material. From Figure 5, it can be observed that when the EG content was ≥4 wt.%, the liquid mass fraction of the composite material experienced a sudden increase. This can be attributed to the conversion of EG between dispersed and continuous phases. In the mass ratio of the prepared CPCM, when the EG content was ≤3 wt.%, MA served as the continuous phase. The thermal conductivity of the composite phase change material increased compared to pure MA, but the increase was relatively small. As shown in Figure 5, EG contents of 1 wt.%, 2 wt.%, and 3 wt.% reduced the complete melting time in the unit by 3.9%, 8.4%, and 13.0%, respectively, compared to pure MA.
However, when the EG content was ≥4 wt.%, the continuous and dispersed phases of the corresponding CPCM changed, with EG becoming the continuous phase. With EG contents of 4 wt.%, 5 wt.%, and 6 wt.%, the complete melting time in the unit reduced by 82.2%, 85.6%, and 88.0%, respectively, compared to pure MA. The thermal conductivity of the composite material increased significantly after the transition of the continuous and dispersed phases. When comparing the melting time of units with an EG content of 4 wt.% to those with EG contents of 5 wt.% and 6 wt.%, it was found that the melting time of the latter two increased by 3.4% and 5.8%, respectively. The differences in melting time between EG contents of 4 wt.%, 5 wt.%, and 6 wt.% were not significant. However, it is important to consider that the increase in EG content led to a decrease in the latent heat of the material. These advantages and disadvantages should be carefully evaluated for practical applications. Based on these results, a composite material with an EG content of 4 wt.% demonstrates higher utility in the spherical unit compared to composite materials with other ratios.
Analyze the Nu number to observe the variation of convective heat transfer intensity in the system. A higher Nu value indicates more active convective heat transfer. Figure 6 shows the variation of Nu in the thermal storage units filled with seven different proportions of composite materials. From the graph, it can be observed that all the curves initially overlap and rapidly decrease. This phenomenon occurs due to the higher thermal conductivity of the shell. Around 200 s, Nu starts to decrease slowly, and when the PCM is completely melted in the entire unit, Nu approaches zero. From the subgraphs in Figure 6, a turning point can be observed for Nu at EG mass fractions of 0 wt.%, 1 wt.%, 2 wt.%, and 3 wt.%. Nu initially increases and then decreases at this point. Analyzing the melting process reveals that this is due to the higher water bath temperature (353.15 K) and lower thermal resistance of the shell. Solid PCM near the wall undergoes rapid melting, and the resulting liquid phase is heated by the inner wall of the shell, leading to a decrease in density and the generation of buoyancy inside the PCM liquid. This buoyancy drives the upward motion of the heated fluid, resulting in the occurrence of the turning point. This phenomenon also causes fluctuations in the melting region. Similar observations were made by Zhou et al. in reference [29]. Additionally, in the graph, it can be observed that for the material with an EG mass fraction of 3 wt.%, Nu initially decreases, indicating that an increase in the content of EG promotes further melting of the solid PCM.
When the EG content is ≥4 wt.%, a corresponding heat transfer network is formed inside of the CPCM. During this period, heat transfer inside the unit is primarily heat conduction. The natural convection phase effect is relatively weak; thus, at EG contents of ≥4 wt.%, the Nu number curve does not fluctuate and drops rapidly to 0. A unit with a higher EG can, therefore, reach thermal equilibrium more rapidly.
When the EG content is ≥4 wt.%, a heat transfer network is formed within the CPCM. During this period, heat transfer inside the unit is mainly through conduction. The influence of natural convection is relatively weak. As a result, for EG contents of ≥4 wt.%, the Nu number curve remains stable without fluctuations and drops rapidly to 0. Therefore, a unit with a higher EG content can reach thermal equilibrium more quickly.
Figure 7 illustrates the temperature contours (°C) and streamline diagram (m/s) of the z-x section of the model with a constant wall temperature of 80 °C. In the early stages of the melting process, due to the low thermal resistance of the shell, heat is rapidly transferred to the PCM area, resulting in concentric ring temperature contours. Heat conduction is the primary heat transfer mechanism during this period, as also confirmed by Zhu et al. [30]. From Figure 6, it can be observed that natural convection is present during the initial stage of melting, but its impact is relatively minor compared to heat conduction. At a melting time of 500 s, as shown in Figure 7a,b, the temperature contours start deviating from concentric rings, indicating a significant influence of natural convection on the melting process. As melting progresses, the solid PCM melts and forms a layer of liquid phase PCM, which increases the thermal conduction resistance, thereby hindering heat conduction. The streamline diagram in Figure 7a,b reveals a higher velocity flow field in the PCM area near the wall from the beginning, with the flow field area gradually expanding as melting progresses. This demonstrates an increase in natural convection as the melting progresses. Notably, several natural convection vortices can be observed at the bottom of the streamline diagram around 1000–1500 s, facilitating the melting of the solid PCM at the bottom and forming a groove shape. During the later stages of melting (1500 s to 2000 s), streamlines are visible in Figure 7a,b. Although flow lines exist throughout the interior of the unit, their rate is lower compared to the early and mid-term melting stages. This indicates a decrease in the strength of natural convection as the melting process nears completion. When the unit reaches thermal equilibrium, the convective heat transfer speed approaches zero.
The temperature distribution and streamlined diagram of the thermal storage unit with an EG mass fraction ≥ 4 wt.% are presented in Figure 7c. Unlike Figure 7a,b, the distribution throughout the melting process in this unit appears as a concentric circular ring without the occurrence of an eccentric circular ring. Analysis reveals that this phenomenon is attributed to the relatively high mass fraction of EG added, which forms an internal EG heat transfer network that suppresses the influence of convective heat transfer.
Additionally, it is noticeable from Figure 7 that the melting trend remains similar for EG contents ranging from 0 to 3 wt.%, exhibiting a slower melting rate compared to EG contents of 4 to 6 wt.%. In comparison to Figure 7a,b, the melting speed depicted in Figure 7c is considerably faster. Thus, it can be concluded that the melting process is significantly influenced by the EG mass fraction when the wall boundary conditions are the same, but the EG content in the CPCM differs.

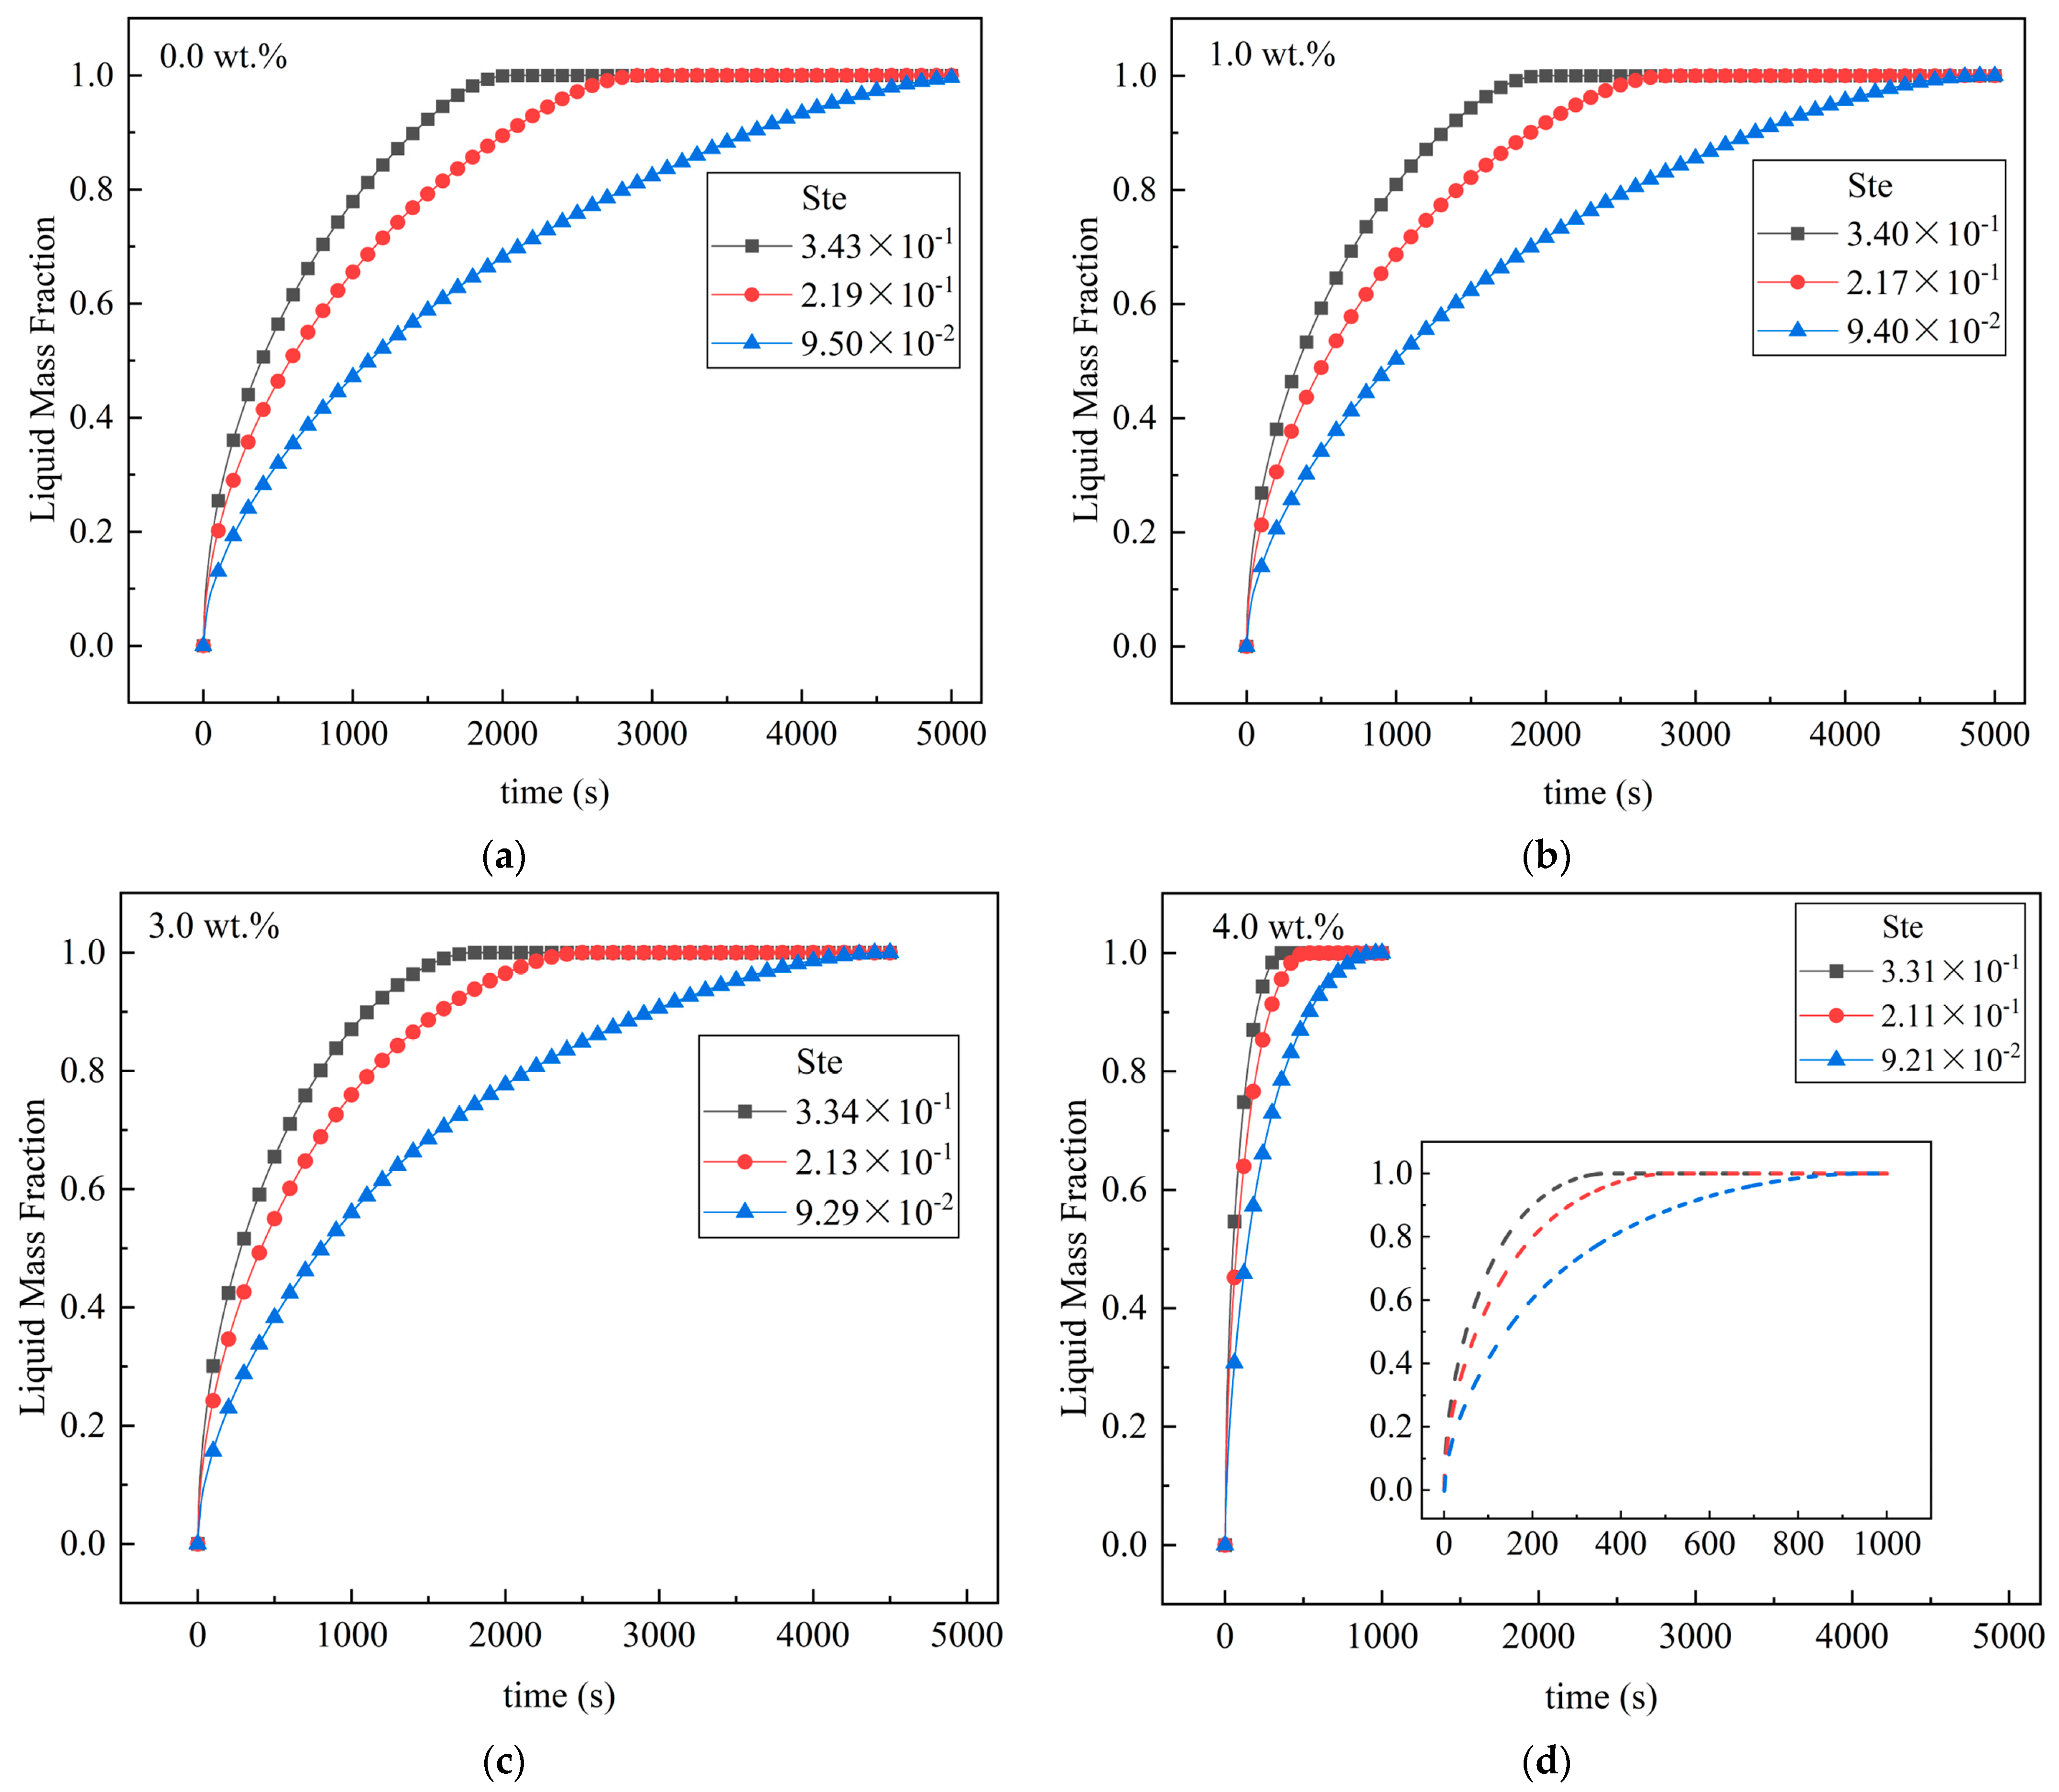
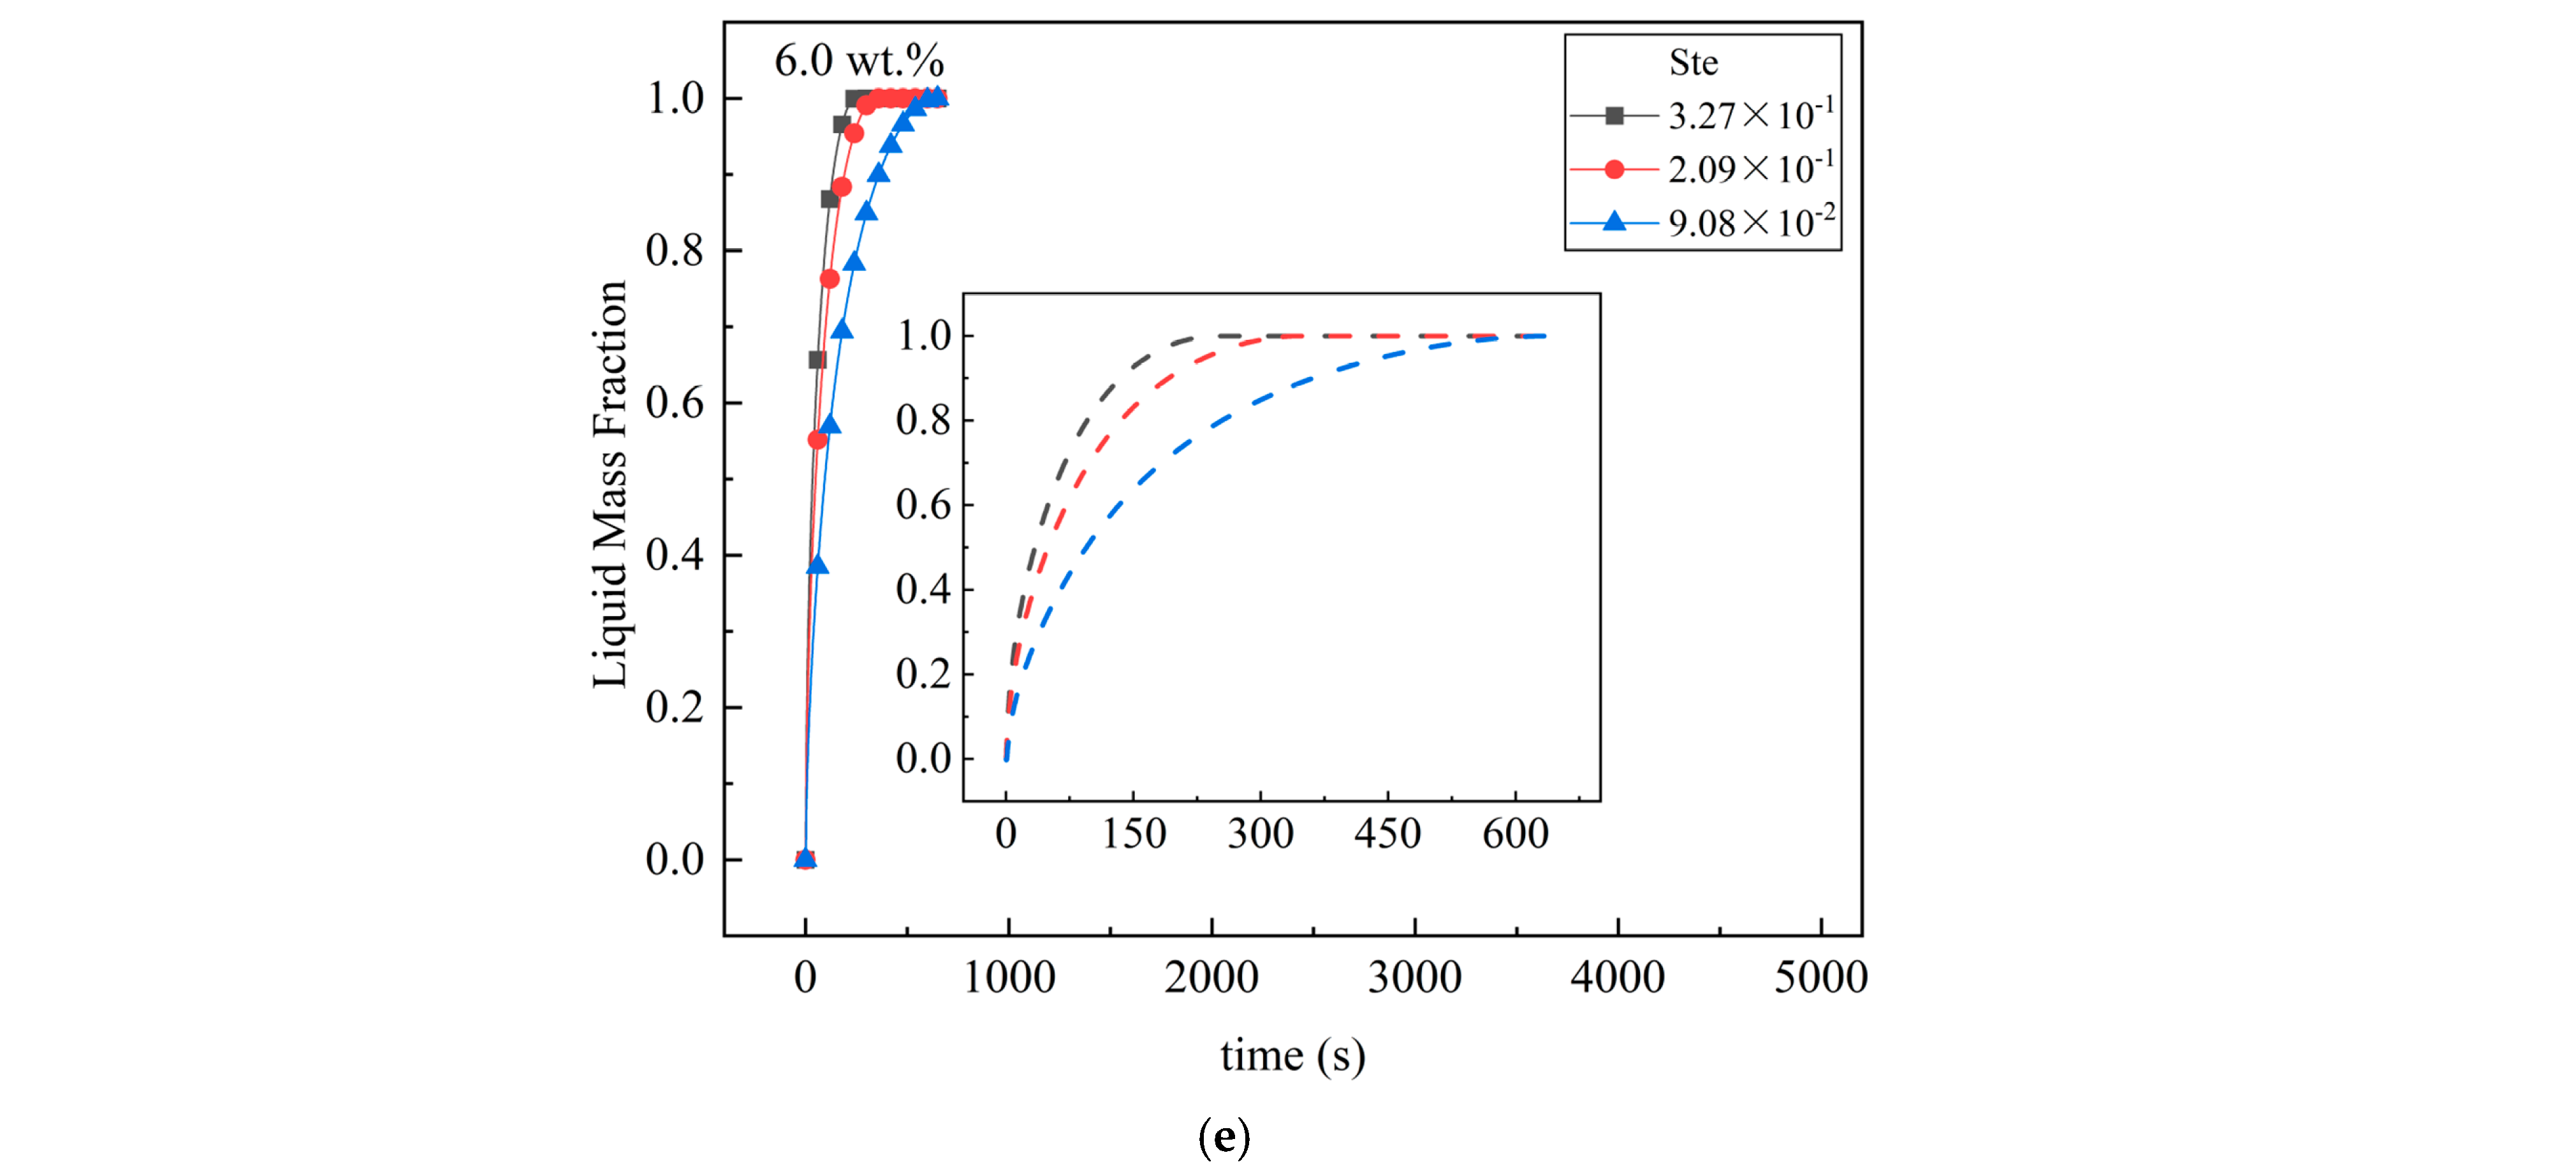
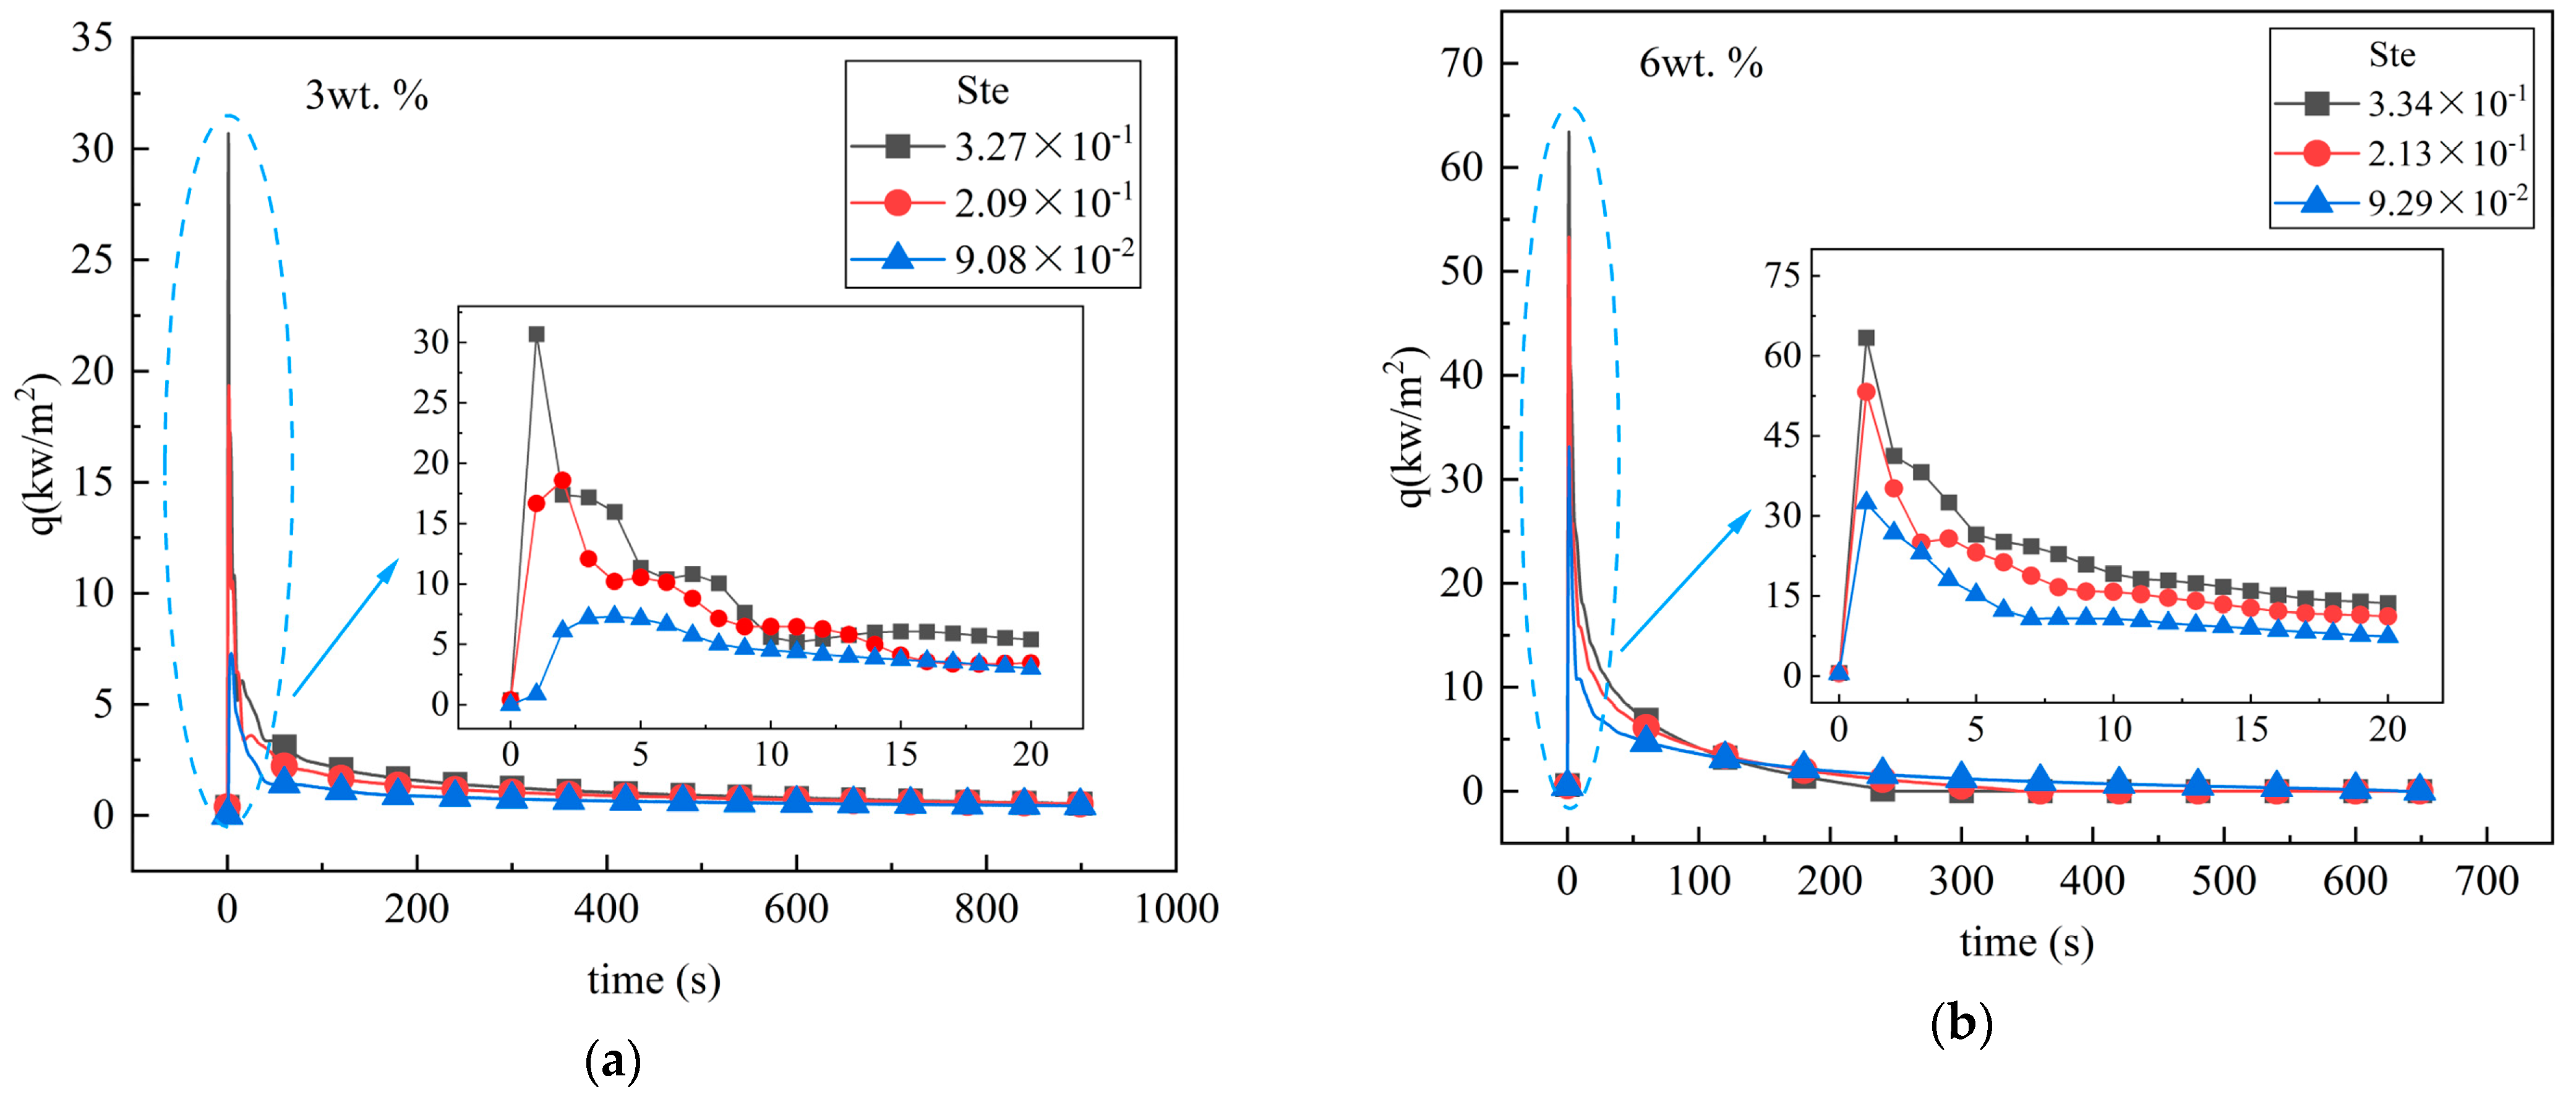
4.2. Influence of Ste Number on Melting

Figure 8 illustrates the transient variation of a liquid mass fraction over time for different Ste numbers at the same EG mass fraction. The specific Ste number values for each working condition in this study are provided in Table 3. Initially, the liquid mass fraction for all working conditions is zero. As melting proceeds, the solid phase gradually transforms into the liquid phase, leading to a continuous increase in the liquid mass fraction until it approaches one. For PCM units with the same EG mass fraction, the melting time significantly increases as the Ste number decreases. In the case of pure MA, as the Ste number decreases from 3.43 × 10⁻¹ to 9.50 × 10⁻², the complete melting time of the material in the unit increases by 58.9%. Similarly, it is evident that the increase in complete melting time for units with a higher EG mass fraction is smaller under the same temperature drop. When the Ste number reaches its minimum value (Th = 60 °C), the melting fraction of pure MA is 59.0% at 3000 s. However, when the EG content is 4 wt.%, the material achieves complete melting in only 940 s, reducing the melting time by 81.2%. In cases of low Ste numbers, pure MA cannot completely melt, whereas a CPCM with a higher EG mass fraction at the same wall temperature can undergo complete melting within a relatively short period. Hence, utilizing PCMs with higher EG mass fractions can mitigate the adverse effects of decreasing wall temperature on the melting process to some extent.
The steepness of the curve in the figure represents the rate of PCM melting. It is evident that the initial stage of the curve has a steeper slope, indicating faster melting of the material in the unit. This can be attributed to the significant temperature difference between the inner wall of the shell and the solid PCM, leading to dominant heat conduction as the main mode of heat transfer. However, as the melting process progresses, the thickness of the liquid PCM layer increases, along with the corresponding increase in thermal resistance, resulting in a gradual reduction in the melting rate. Furthermore, when comparing the melting behavior under different EG mass fractions, it was observed that the influence of the Ste number on the melting fraction of the PCM is more pronounced when the EG mass fraction is relatively low.
The heat flow density curves for 3 wt.% and 6 wt.% EG contents are shown in Figure 9, plotted against time. It can be observed that as the Ste number increases during melting, the heat flux density also increases. This indicates that more heat is transferred to the unit per unit time, resulting in a shorter melting time for the unit. During the initial stage of melting, the heat flux curve initially increases and then decreases after reaching its maximum value, with some fluctuations. The initial increase is due to the fact that at the beginning of melting, when heat has not yet been introduced into the shell, the heat flux density is nearly zero. As heat conduction begins through the spherical shell, heat is rapidly transferred to the inside of the unit, leading to a sharp increase in the heat flux density to its maximum value. Once the first layer of molten PCM is formed, the heat flux density drops significantly due to the high thermal resistance of the liquid layer. The density difference within the formed liquid phase PCM, caused by the variation in temperature, leads to buoyancy effects inside the unit. This results in a fluctuation area in the heat transfer as the liquid phase PCM descends.
Based on Figure 9a,b, it can be noted that the early-stage fluctuation range is greater for a 3 wt.% EG content compared to a 6 wt.% EG content. This can be attributed to the fact that the addition of EG helps suppress the impact of natural convection caused by buoyancy. As a result, the image appears smoother for a 6 wt.% EG content. The inclusion of EG contributes to reducing heat transfer fluctuations during the melting process of the PCM.

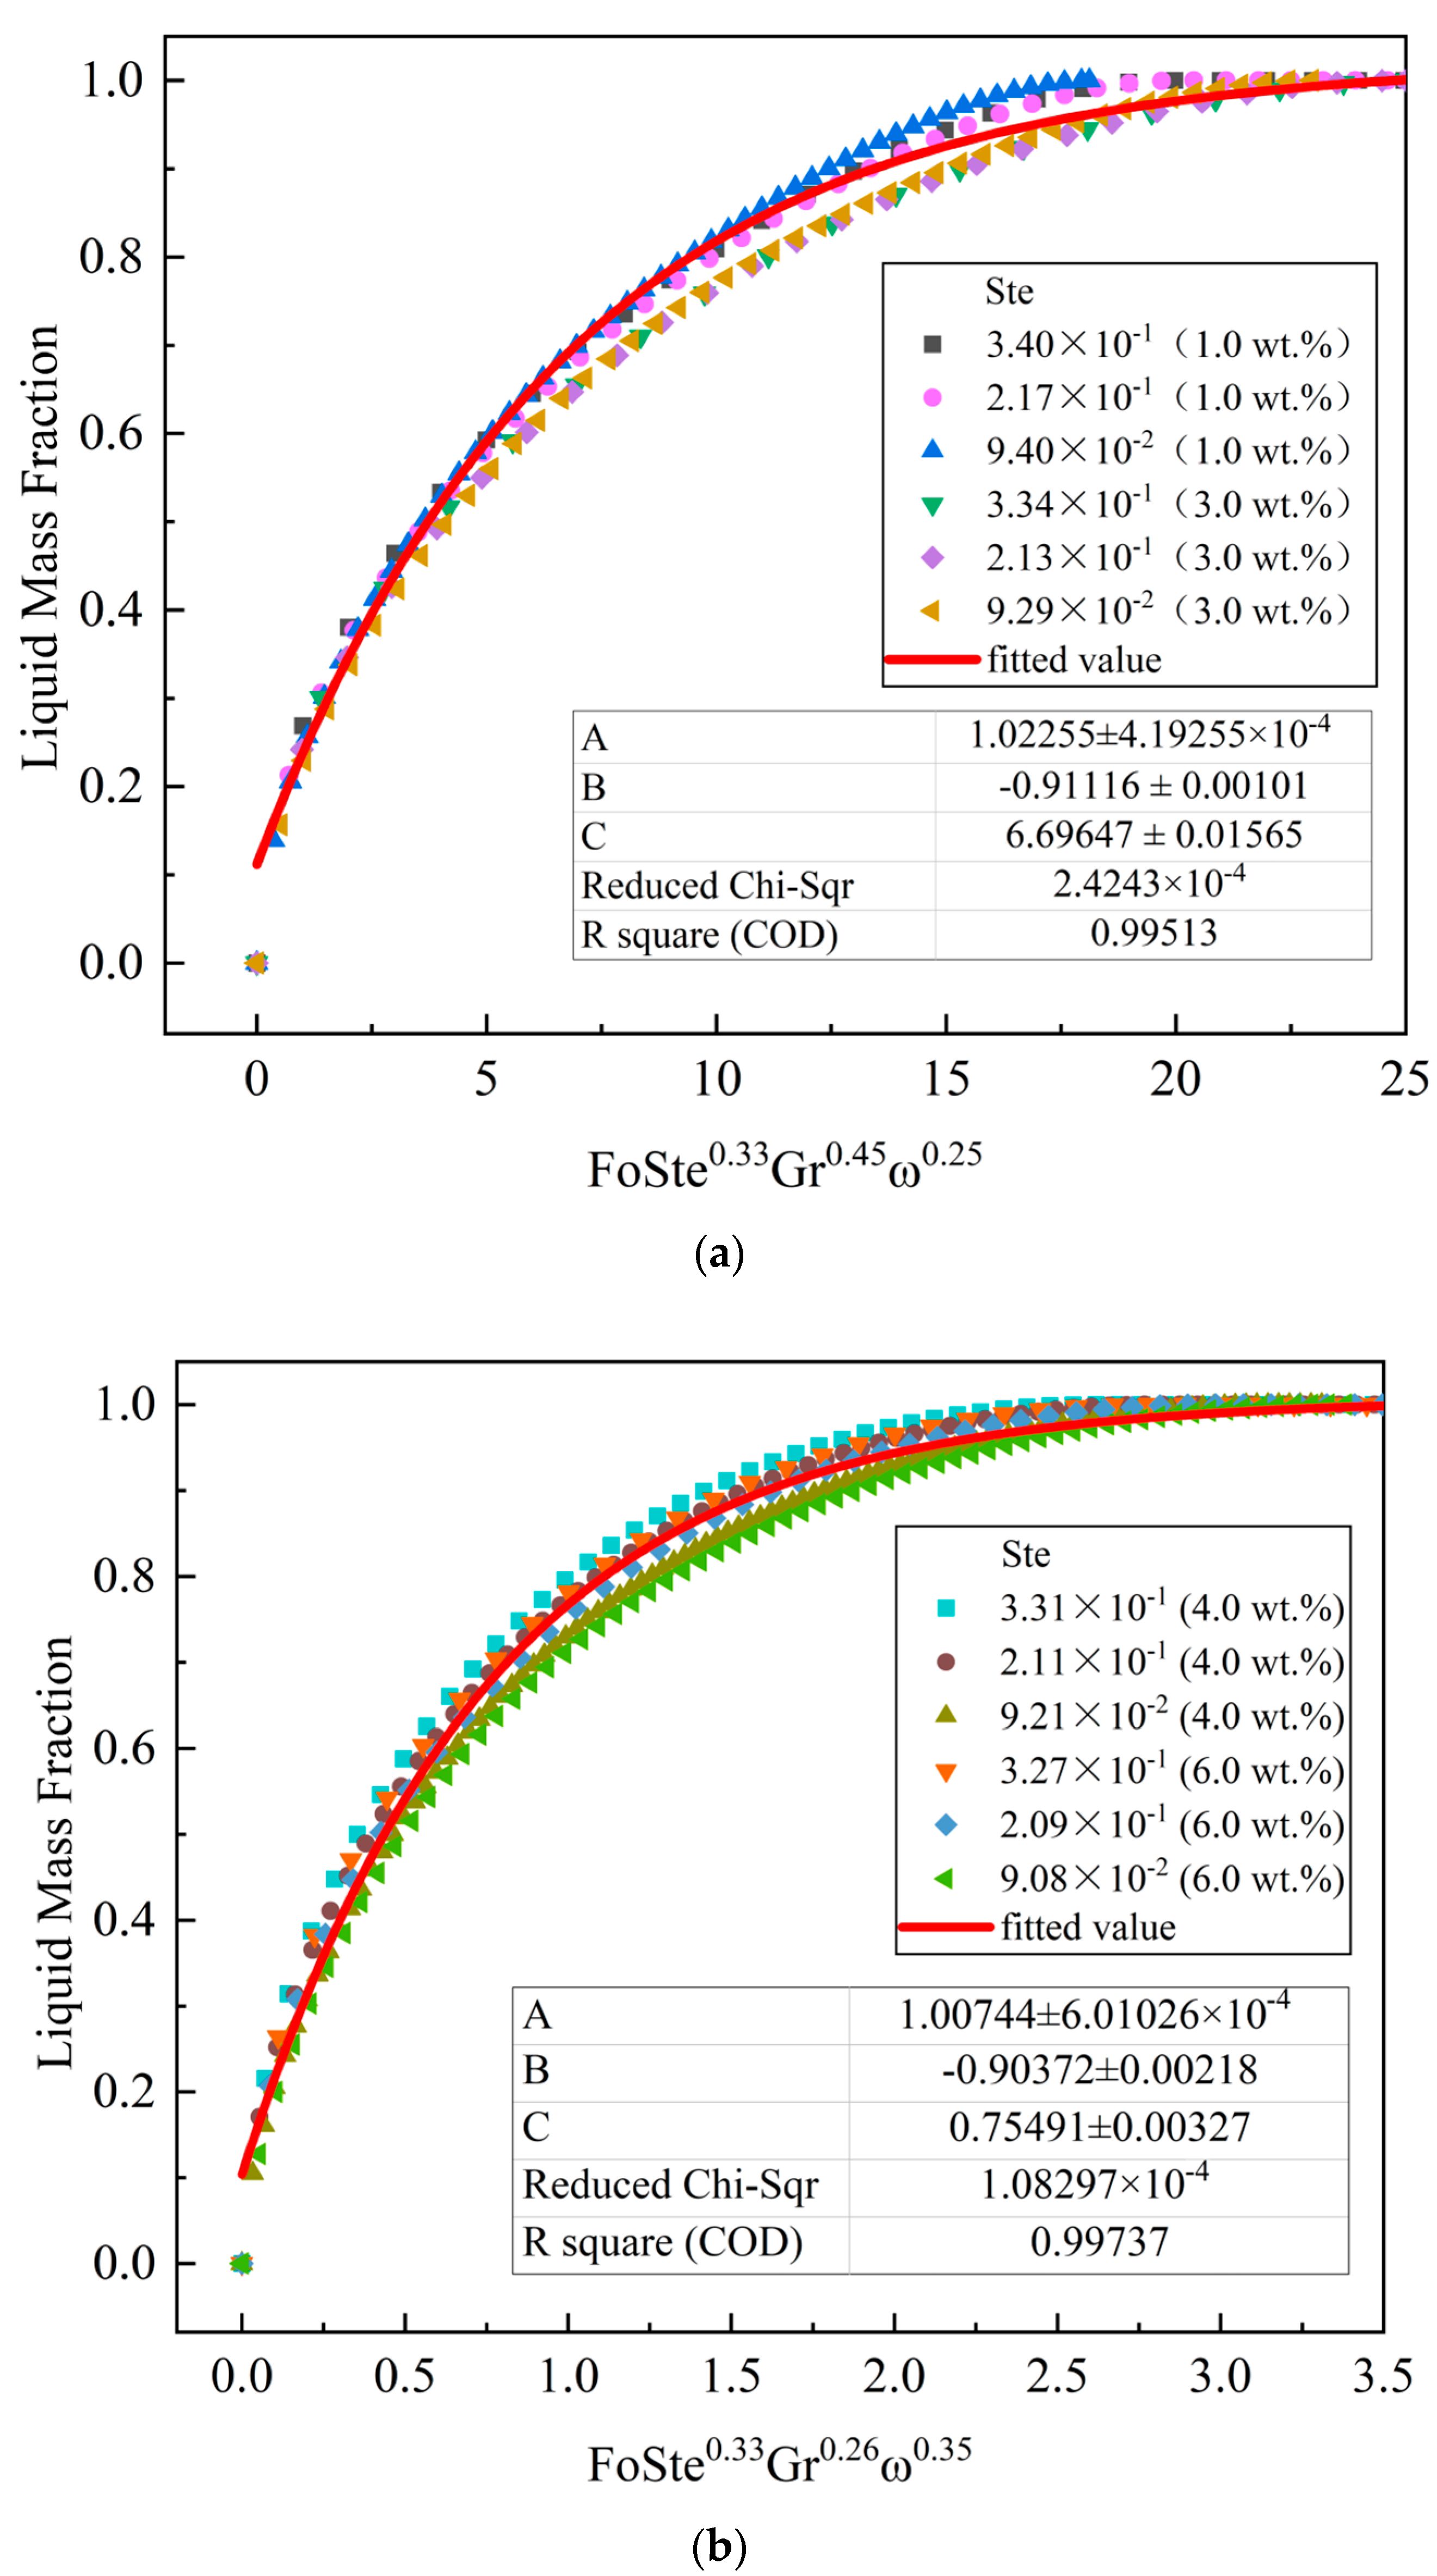
4.3. Dimensionless Analysis

Figure 6, Figure 7, Figure 8 and Figure 9 show the effects of different parameters on the melting process. Previous results showed that the melting process has similar characteristics under different parameters. Therefore, it was necessary to conduct a dimensionless analysis of results so that our conclusions are able to be extended to other conditions and applied to practical problems. The specific values of Ste and Gr numbers for each working condition in this study are given in Table 3.
Figure 10 shows the relationship between liquid mass fraction and Fo, Ste, and Gr numbers under three different EG mass fraction conditions. The dimensionless relationship is obtained by fitting as follows:
f = A + B exp ( F o S t e 0.33 G r x C )
where A, B, and C are undetermined constants.
From Figure 10, it can be observed that data under corresponding working conditions can perfectly converge to a curve, with a deviation within 6%. A comparison of Figure 10a–c shows that, as the mass fraction of EG increases, the power exponent of the Gr number decreases accordingly. This implies that the addition of EG weakens the influence of natural convection, as also observed by Fan et al. This phenomenon is also consistent with the conclusion obtained from Figure 9.
Figure 11 shows the relationship between the liquid phase ratio and Fo, Ste, and Gr numbers, and EG mass fraction ω for four groups of MA/EG with different ratios. The dimensionless relationship is obtained by fitting as follows:
f = A + B exp ( F o S t e 0.33 G r x ω y C )
where A, B, and C are undetermined constants. The value ranges of the dimensionless numbers are as follows: Figure 11a: 9.29 × 10⁻² < Ste < 3.40 × 10⁻¹, 2.47 × 10⁴ < Gr < 1.33 × 10⁵, 48.2 < Pr < 50.35; Figure 11b: 9.08 × 10⁻² < Ste < 3.31 × 10⁻¹, 1.39 × 10⁴ < Gr < 7.33 × 10⁴, 7.09 < Pr < 8.86.
All working conditions in Figure 11 converge well with the fitting curve. Figure 11a is a dimensionless fitting diagram for an EG mass fraction of ≤3 wt.%. By comparing the specific gravity of each dimensionless number in the melting process, it was found that the proportion of Gr was larger. Therefore, for EG–MA CPCMs with ω ≤ 3 wt.%, the Gr number has a greater influence on the liquid mass fraction during the melting process. In comparison, the specific gravity of ω in Figure 11b is relatively large; thus, for EG–MA CPCMs with ω ≥ 4 wt.%, ω makes a greater contribution to the melting process.
The non-dimensional analysis results in this study were obtained when cells were filled with composite materials. In actual engineering, the internal filling rate cannot reach 100%, and air gaps will be present. We plan to address this problem in the future. Nevertheless, the conclusions of this research provide a guide for the thermal design process of latent heat-packed bed heat exchangers for practical engineering problems.

5. Conclusions

This paper presents an experimental and numerical simulation study of a spherical thermal storage unit filled with CPCM. By changing the mass fraction of EG and the Ste number, the melting characteristics of the unit were determined. The melting time, Nu number, temperature contours, and streamline diagram were analyzed, and the generalized correlation of liquid mass fraction was fitted, leading to the following conclusions:
  • The addition of EG material promotes the melting of the PCM in the unit. When EG contents are 4 wt.%, 5 wt.%, and 6 wt.%, the time required to complete melting in the unit is reduced by 82.2%, 85.6%, and 88.0%, respectively, compared with pure MA. During the melting process of the phase change unit, the addition of EG suppresses the natural convective effect inside the unit. In the middle and late stages of melting, the natural convection effect dominates the heat transfer when the EG content is low, and heat conduction dominates the heat transfer when the EG content is high.
  • An increase in the Ste number can effectively reduce the melting time of the unit. For the pure MA unit, when the Ste number decreased from 3.43 × 10⁻¹ to 9.50 × 10⁻², the complete melting time of the material in the unit increased by 58.9%. When Ste numbers were 9.21 × 10⁻² (4 wt.%) and 9.50 × 10⁻² (0 wt.%), the melting time was reduced by 81.2%. It was also found that when the mass fraction of EG is small, the change in the Ste number has a greater impact on the liquid mass fraction of the PCM.
  • The dimensionless relationship between the liquid mass fraction and Fo, Ste, and Gr numbers and EG mass fraction ω was obtained by fitting. By comparing the power exponents of various dimensionless numbers, it was found that during the melting of the EG–MA composite PCM with ω ≤ 3 wt.%, the proportion of Gr was relatively large; when ω ≥ 4 wt.%, the impact of ω on the process was greater. The simulation data for each working condition converged well to the fitting curve, and the deviation was within 6%. The correlation equation can be used to guide the engineering applications of latent heat-packed bed heat exchangers.

Author Contributions

Conceptualization, J.L. and L.G.; Data curation, J.B.; Formal analysis, W.W., L.G. and L.X.; Investigation, L.G. and J.C.; Methodology, J.B.; Project administration, J.L.; Resources, J.L. and Z.Y.; Software, Y.D.; Supervision, W.W.; Validation, J.B.; Visualization, Y.D.; Writing—original draft, J.B.; Writing—review and editing, Y.D. and L.G. All authors have read and agreed to the published version of the manuscript.

Funding

This research is supported by the Jilin Provincial Natural Science Foundation of China project: Study on Thermophysical Properties Control and Energy Storage Mechanism of Solid Waste Carbon-Based Phase Change Composite Materials (Project Number: YDZJ202201ZYTS394).

Data Availability Statement

Data available on request due to restrictions, e.g., related to privacy or ethics. The data presented in this study are available on request from the corresponding author.

Conflicts of Interest

The authors declare no conflict of interest.

Nomenclature

Roman symbols
ccoefficient of association
cpconstant-pressure specific heat, J kg−1 K−1
eroot mean square deviation
FoFourier number
GrGrashof number
gacceleration of gravity, m/s2
Hsensible heat enthalpy, kJ/kg
hlconvection heat transfer coefficient, W/m2 K
Htottotal enthalpy, kJ/kg
klthermal conductivity, W m−1 K−1
Llatent heat, kJ/kg
minstantaneous melting mass, kg
Mtotal mass, kg
NuNusselt number
PrPrandtl number of the fluid
Ppressure, Pa
Rradius of sphericity
SteStefan number
ttime, min
Ttemperature, K
T0ambient temperature, K
Tmphase change temperature, K
vvelocity, m/s
ΔTheat transfer temperature difference, K
Greek symbols
βcoefficient of thermal expansion, 1/K
ϕvolume fraction, %
ωmass fraction, %
ρdensity, kg/m3
μdynamic viscosity, kg/m s
λliquid mass fraction, %
Abbreviations
EGexpanded graphite
FEMfinite element method
MAmyristic acid
PCMphase change material
POMpolarizing optical microscope
Subscripts
cpcmcomposite phase change material
hwall
oinitial state
ccontinuous phase
ddispersed phase
EGexpanded graphite
pPCM
sspherical shell

References

  1. IRENA. Available online: https://www.irena.org/Data/View-data-by-topic/Capacity-and-Generation/Statistics-Time-Series (accessed on 17 April 2023).
  2. Han, X.; Li, Y.; Nie, L.; Huang, X.; Deng, Y.; Yan, J.; Kourkoumpas, D.; Karellas, S. Comparative Life Cycle Greenhouse Gas Emissions Assessment Of Battery Energy Storage Technologies For Grid Applications. J. Clean. Prod. 2023, 392, 136251. [Google Scholar] [CrossRef]
  3. Sun, B.; Liu, Z.; Ji, X.; Gao, L.; Che, D. Thermal energy storage characteristics of packed bed encapsulating spherical capsules with composite phase change materials. Appl. Therm. Eng. 2022, 201, 117659. [Google Scholar] [CrossRef]
  4. Sun, B.; Sun, M.; Gao, L.; Che, D.; Deng, Y. Thermal performance analysis and optimization of a double-layer spherical phase-change material capsule with annular fins. J. Energy Storage 2023, 57, 106280. [Google Scholar] [CrossRef]
  5. Leng, G.; Qiao, G.; Jiang, Z.; Xu, G.; Qin, Y.; Chang, C.; Ding, Y. Micro encapsulated & form-stable phase change materials for high temperature thermal energy storage. Appl. Energy 2018, 217, 212–220. [Google Scholar] [CrossRef]
  6. Li, C.; Li, Q.; Cong, L.; Jiang, F.; Zhao, Y.; Liu, C.; Xiong, Y.; Chang, C.; Ding, Y. MgO based composite phase change materials for thermal energy storage: The effects of MgO particle density and size on microstructural characteristics as well as thermophysical and mechanical properties. Appl. Energy 2019, 250, 81–91. [Google Scholar] [CrossRef]
  7. Lee, S.L.; Saidur, R.; Sabri, M.F.M.; Min, T.K. Effects of the particle size and temperature on the efficiency of nanofluids using molecular dynamic simulation. Numer. Heat Transf. Part A Appl. 2016, 69, 996–1013. [Google Scholar] [CrossRef]
  8. Joshi, V.; Rathod, M.K. Constructal enhancement of thermal transport in latent heat storage systems assisted with fins. Int. J. Therm. Sci. 2019, 145, 105984. [Google Scholar] [CrossRef]
  9. Jia, X.; Zhai, X.; Cheng, X. Thermal performance analysis and optimization of a spherical PCM capsule with pin-fins for cold storage. Appl. Therm. Eng. 2019, 148, 929–938. [Google Scholar] [CrossRef]
  10. Meghari, Z.; Bouhal, T.; Benghoulam, M.; El Rhafiki, T.; El Khattabi, E.M.; Doghmi, H.; Mohammed, O.J. Numerical simulation of a phase change material in a spherical capsule with a hollow fin. J. Energy Storage 2021, 43, 103024. [Google Scholar] [CrossRef]
  11. Tang, Y.; Wang, Z.; Zhou, J.; Zeng, C.; Lyu, W.; Lu, L.; Yuan, Y. Heat transfer analysis of hollow channel in phase change materials spherical capsule. Appl. Therm. Eng. 2023, 219, 119390. [Google Scholar] [CrossRef]
  12. Yang, B.; Zhang, R.; Gao, Z.; Yu, X. Effect of nanoparticles and metal foams on heat transfer properties of PCMs. Int. J. Therm. Sci. 2022, 179, 107567. [Google Scholar] [CrossRef]
  13. Prabakaran, R.; Kumar, J.P.N.; Lal, D.M.; Selvam, C.; Harish, S. Constrained melting of graphene-based phase change nanocomposites inside a sphere. J. Therm. Anal. Calorim. 2019, 139, 941–952. [Google Scholar] [CrossRef]
  14. Mayilvelnathan, V.; Valan Arasu, A. Experimental investigation on thermal behavior of graphene dispersed erythritol PCM in a shell and helical tube latent energy storage system. Int. J. Therm. Sci. 2020, 155, 106446. [Google Scholar] [CrossRef]
  15. Zhang, J.; Cao, Z.; Huang, S.; Huang, X.; Liang, K.; Yang, Y.; Zhang, H.; Tian, M.; Akrami, M.; Wen, C. Improving the melting performance of phase change materials using novel fins and nanoparticles in tubular energy storage systems. Appl. Energy 2022, 322, 119416. [Google Scholar] [CrossRef]
  16. Jirawattanapanit, A.; Abderrahmane, A.; Mourad, A.; Guedri, K.; Younis, O.; Bouallegue, B.; Subkrajang, K.; Rajchakit, G.; Shah, N.A. A Numerical Investigation of a Melting Rate Enhancement inside a Thermal Energy Storage System of Finned Heat Pipe with Nano-Enhanced Phase Change Material. Nanomaterials 2022, 12, 2519. [Google Scholar] [CrossRef]
  17. Abderrahmane, A.; Qasem, N.A.A.; Mourad, A.; Al-Khaleel, M.; Said, Z.; Guedri, K.; Younis, O.; Marzouki, R. Enhancing the Melting Process of Shell-and-Tube PCM Thermal Energy Storage Unit Using Modified Tube Design. Nanomaterials 2022, 12, 3078. [Google Scholar] [CrossRef]
  18. Masoumi, H.; Haghighi Khoshkhoo, R. Investigation of melting of nanoparticle-enhanced phase change materials (NePCMs) in a shell-and-tube heat exchanger with longitudinal fins. Heat Mass Transf. 2020, 57, 681–701. [Google Scholar] [CrossRef]
  19. Eanest Jebasingh, B.; Valan Arasu, A. A detailed review on heat transfer rate, supercooling, thermal stability and reliability of nanoparticle dispersed organic phase change material for low-temperature applications. Mater. Today Energy 2020, 16, 100408. [Google Scholar] [CrossRef]
  20. Gao, L.; Sun, X.; Sun, B.; Che, D.; Li, S.; Liu, Z. Preparation and thermal properties of palmitic acid/expanded graphite/carbon fiber composite phase change materials for thermal energy storage. J. Therm. Anal. Calorim. 2019, 141, 25–35. [Google Scholar] [CrossRef]
  21. Zhang, N.; Yuan, Y.; Wang, X.; Cao, X.; Yang, X.; Hu, S. Preparation and characterization of Lauric–myristic–palmitic acid ternary eutectic mixtures/expanded graphite composite phase change material for thermal energy storage. Chem. Eng. J. 2013, 231, 214–219. [Google Scholar] [CrossRef]
  22. Yuan, Y.; Zhang, N.; Tao, W.; Cao, X.; He, Y. Fatty acids as phase change materials: A Review. Renew. Sustain. Energy Rev. 2014, 29, 482–498. [Google Scholar] [CrossRef]
  23. Gao, Z.; Yao, Y.; Wu, H. A visualization study on the unconstrained melting of paraffin in spherical container. Appl. Therm. Eng. 2019, 155, 428–436. [Google Scholar] [CrossRef]
  24. Venkitaraj, K.; Suresh, S. Experimental study on thermal and chemical stability of pentaerythritol blended with low melting alloy as possible PCM for latent heat storage. Exp. Therm. Fluid Sci. 2017, 88, 73–87. [Google Scholar] [CrossRef]
  25. Venkitaraj, K.; Suresh, S.; Praveen, B.; Nair, S.C. Experimental heat transfer analysis of macro packed neopentylglycol with CuO nano additives for building cooling applications. J. Energy Storage 2018, 17, 1–10. [Google Scholar] [CrossRef]
  26. Voller, V.R.; Prakash, C. A fixed grid numerical modelling methodology for convection-diffusion mushy region phase-change problems. Int. J. Heat Mass Transf. 1987, 30, 1709–1719. [Google Scholar] [CrossRef]
  27. Fan, L.-W.; Zhu, Z.-Q.; Zeng, Y.; Ding, Q.; Liu, M.-J. Unconstrained melting heat transfer in a spherical container revisited in the presence of nano-enhanced phase change materials (nepcm). Int. J. Heat Mass Transf. 2016, 95, 1057–1069. [Google Scholar] [CrossRef]
  28. Alktranee, M.; Shehab, M.A.; Németh, Z.; Bencs, P.; Hernadi, K. Effect of zirconium oxide nanofluid on the behaviour of photovoltaic–thermal system: An experimental study. Energy Rep. 2023, 9, 1265–1277. [Google Scholar] [CrossRef]
  29. Zhou, X.; Duan, W.; Chi, F.; Jiang, Y. Numerical Investigation of Nano-PCM melting enhanced by thermocapillary convection under microgravity condition. Microgravity Sci. Technol. 2022, 34, 41. [Google Scholar] [CrossRef]
  30. Zhu, M.; Wang, Z.; Zhang, H.; Sun, X.; Dou, B.; Wu, W.; Zhang, G.; Jiang, L. Experimental investigation of the comprehensive heat transfer performance of pcms filled with CMF in a heat storage device. Int. J. Heat Mass Transf. 2022, 188, 122582. [Google Scholar] [CrossRef]
Figure 1. Experimental phase change unit. (a) Test unit filling and (b) test unit package.
Energies 16 04527 g001
Figure 2. System diagram of the experimental device: 1 (25 °C) and 2 (80 °C) are constant-temperature water baths, 3 is a thermal insulation structure, 4 is a phase change heat storage unit, 5 is a k-type thermocouple, and 6 and 7 are data acquisition devices and computer.
Energies 16 04527 g002
Figure 3. Grid and time step independence of the solution, including (a) time step size and (b) number of cells.
Energies 16 04527 g003
Figure 4. Comparison between numerical results from the proposed model and experimental data.
Energies 16 04527 g004
Figure 5. Transient changes in liquid phase ratio of different expanded graphite (EG) mass fraction units (MA, myristic acid).
Energies 16 04527 g005
Figure 6. Transient changes in Nu number for different expanded graphite (EG) mass score units (MA, myristic acid).
Energies 16 04527 g006
Figure 7. Temperature contours (left) and streamline diagram (right) of different expanded graphite (EG) mass score units. The left half of each image is displayed as temperature contours (°C), and the right half is displayed as streamlined contours (m/s), displaying the heat transfer and convection characteristics inside the unit: (a) EG mass score of 0–1 wt.%, (b) EG mass score of 2–3 wt.%, and (c) EG mass score of 4–6 wt.%.
Energies 16 04527 g007aEnergies 16 04527 g007bEnergies 16 04527 g007c
Figure 8. Transient changes in liquid phase ratios of different Ste number units of expanded graphite (EG) content. (a) 0.0 wt.%, (b) 1.0 wt.%, (c) 3.0 wt.%, (d) 4.0 wt.%, and (e) 3.0 wt.%. (The dashed lines in d,e) are local enlargements of the curves in the figures.)
Energies 16 04527 g008aEnergies 16 04527 g008b
Figure 9. Transient changes in heat flux densities of different Ste number units of expanded graphite (EG) content: (a) 3.0 wt.% and (b) 6.0 wt.%.
Energies 16 04527 g009
Figure 10. Fitting curves of expanded graphite (EG) content: (a) 0.0 wt.%, (b) 3.0 wt.%, and (c) 6.0 wt.% melting rate based on the combination of dimensionless numbers.
Energies 16 04527 g010
Figure 11. Relationship between the liquid phase ratio and Fo, Ste, and Gr numbers, and expanded graphite (EG) mass fraction ω for four groups of myristic acid (MA)/EG with different ratios of EG content. (a) 1.0 wt.% and 3.0 wt.% and (b) 4.0 wt.% and 6.0 wt.%.
Energies 16 04527 g011
Table 1. Physical properties of the myristic acid (MA) expanded graphite (EG) and 304-stainless steel.
Thermophysical PropertyMAEG304-Stainless Steel
Density (kg/m3)862/9902697930
Specific heat capacity (J/kg·K)1700/2264874.5460
Thermal conductivity (W/m·K)0.2217.516.2
Melting temperature (K)327.15--
Latent heat (kJ/kg)182.6--
Dynamic viscosity (kg/m·s)0.00506--
Coefficient of thermal expansion (1/K)0.00062--
Table 2. Physical properties of the composite phase change material (CPCM).
Thermophysical Propertyω = 1 wt.%ω = 2 wt.%ω = 3 wt.%ω = 4 wt.%ω = 5 wt.%ω = 6 wt.%
Density (kg/m3)843.4825.6808.5792.1776.4761.3
Specific heat capacity (J/kg·K)2220.42178.72138.72100.32063.52028.1
Thermal conductivity (W/m·K)0.240.260.281.641.982.31
Latent heat (kJ/kg)180.8178.9177.1175.3173.5171.6
Dynamic viscosity (kg/m·s)0.00550.00590.00640.00690.00750.0081
Table 3. Gr and Ste numbers that correspond to each working condition.
ω (wt.%)Th (°C)SteGr
0.080
70
60
3.43 × 10⁻¹
2.19 × 10⁻¹
9.53 × 10⁻²
1.62 × 10⁵
1.03 × 10⁵
4.51 × 10⁴
1.080
70
60
3.40 × 10⁻¹
2.17 × 10⁻¹
9.44 × 10⁻²
1.33 × 10⁵
8.47 × 10⁴
3.68 × 10⁴
3.080
70
60
3.34 × 10⁻¹
2.13 × 10⁻¹
9.29 × 10⁻²
8.91 × 10⁴
5.69 × 10⁴
2.47 × 10⁴
4.080
70
60
3.31 × 10⁻¹
2.11 × 10⁻¹
9.21 × 10⁻²
7.33 × 10⁴
4.68 × 10⁴
2.04 × 10⁴
6.080
70
60
3.27 × 10⁻¹
2.09 × 10⁻¹
9.08 × 10⁻²
4.99 × 10⁴
3.19 × 10⁴
1.39 × 10⁴
Disclaimer/Publisher’s Note: The statements, opinions and data contained in all publications are solely those of the individual author(s) and contributor(s) and not of MDPI and/or the editor(s). MDPI and/or the editor(s) disclaim responsibility for any injury to people or property resulting from any ideas, methods, instructions or products referred to in the content.

