Article

EVs’ Integration Impact on the Reliability of Saudi Arabia’s Power System

Electrical Engineering Department, Umm Al-Qura University, Makkah, Saudi Arabia
*
Author to whom correspondence should be addressed.
Energies 2023, 16(12), 4579; https://doi.org/10.3390/en16124579
Submission received: 19 March 2023 / Revised: 31 May 2023 / Accepted: 3 June 2023 / Published: 8 June 2023
(This article belongs to the Section E: Electric Vehicles)

Abstract

:
This paper investigates the effect of involving electric vehicles (EVs) in the load profile on the generation system. The impact was studied from a reliability perspective on Saudi Arabia’s total generation system capacity as one source supplying the expected load for the year 2030. The EV load profile was then added. The outcomes were examined considering the gradual penetration percentage to the total load. The reliability indices measured are the loss of load probability (LOLP) and the expected energy not supplied (EENS). The results show that the estimated generation system of Saudi Vision 2030 will not withstand the estimated number of EVs without negatively impacting reliability. Similarly, the reliability assessment was conducted for the central region considering EVs in Riyadh City to verify Saudi Vision 2030. The results show that EV integration will greatly affect the electrical network’s reliability. Furthermore, a sensitivity analysis was conducted for Saudi Arabia and the central region to assess the generation system better. The study shows that investing in the generation infrastructure is essential to handle EV growth for the upcoming years. The work introduced in this paper will also help decision-makers make appropriate planning decisions in the future.

1. Introduction

Nowadays, there is a trend of not using or at least reducing the level of dependency on fossil fuels. Several countries are reducing or shifting to other non-fossil fuel-related consumables. Conventional vehicles account for one-third of CO2 emissions in some countries [1]. Hence, a shift is being made towards electrical vehicles (EVs). However, these changes could drive a negative impact on the generation system. This paper studies the impact of EVs on the generation system from a reliability perspective.

1.1. EV Growth

It was predicted in 2009 that the estimated worldwide sales of hybrid and plug-in electric vehicles for the year 2020 would reach 7 million, with a global market share representing 9% [2]. Nevertheless, the actual 2020 market share reached only 3.1 million, with a worldwide market share of 4.11%. This reduction in estimated sales is due to many causes, one of which is the effect of the COVID-19 pandemic. As noted from actual data, the years 2019 and 2020 represent a recession period for many industries, including the transportation market share. Despite this economic decline, EV sales recorded growth from 2.49% of the global market share in 2019 to 4.11% in 2020. In 2021, the EV global market share jumped to 8.57% with 6.7 million sales, representing more than double the value and share of 2019 [3]. It is estimated that by the year 2030, the global market share of EVs will be 30%, with 30 million vehicle sales [2]. As mentioned above, it can be noted that EVs’ worldwide growth cannot be paused or stopped due to their contribution to maintaining sustainability.
To the authors’ best knowledge, as supported by [4], in Saudi Arabia, the number of existing EVs on the road is unavailable. Nevertheless, Saudi Arabia is considering a program of sustainability which is part of Saudi Vision 2030 [5]. EVs and generation systems represent subsections of the sustainability program. Regarding the generation system of Saudi Arabia, Vision 2030 is considering deploying renewable energy sources to generate approximately 50% of the total generation system from renewable sources [5]. Regarding EVs, Vision 2030 aims to replace 30% of the total vehicles in the capital Riyadh to be EVs [6]. Thus, the move towards EVs and renewables will be reflected by greater sustainability as there will be a significant reduction in CO2 emissions. This is one of the main reasons the world is visualizing EVs as the suitable choice accompanied by a renewable energy-generation system [7]. Recently, in November 2022, Saudi Arabia took a bold step in entering the EV market as a manufacturer; the project brand called ‘Ceer’ is expected to provide EVs to the market by 2025 [8,9]. As illustrated above, it is clear that Saudi Arabia is considering EVs for Vision 2030 and its economy.

1.2. EVs’ Impact on the Generation System

Several papers have highlighted the significant role of EVs based on their capability to impact generation systems in the future [10,11,12]. EVs’ charging profile can increase the peak load for the daily load duration curve (LDC). It could also introduce another peak during the off-peak period for only a 20% penetration level in some cases [13]. Moreover, EVs could affect the performance of the electricity system, including, for example, voltage, line drops, and system losses [14]. Additionally, EVs affect the quality of the electric system [15].
Furthermore, EV integration’s impact extends to power protection devices’ operation, especially if the vehicle to the grid is considered [16]. EVs also influence the reliability of the electric supply system [17]. Hence, their effects should be studied and considered along with the policies and annual upgrading of the generation system to accommodate the increasing number of EVs before taking action to support EVs.

1.3. Modeling EV Charging Behavior and Reliability Study

The EV charging model is an essential component of electrical supply reliability studies, as the EV load profile can be obtained from the charging model. Many theories and actual data processing have been studied in this field to obtain models useful for further investigation in other aspects, such as reliability assessments, charger locating, and controlling policies [18,19]. A case of controlled and uncontrolled charging behavior was studied in [8], with the results showing how changing the EVs load profile led to improvements in the reliability of the generation system.
In [20,21,22], EV charging models were acquired from individual behaviors. The authors of [23] also considered the charger’s location and temporal impact on the electric network. Some of the main inputs required to develop the EVs’ charging model are state of charge (SoC), time of charging, distance traveled, gross domestic product (GDP)/electricity prices, weekday/weekend, and other calendar events [22,24,25,26].
Regarding the reliability assessment with EV penetration, [27] considered actual data for a particular city with its generation system represented as the maximum installed capacity. The assessment was conducted on various penetration levels of the total number of vehicles.
In [28], the U.S. National Household Travel Survey was used as a base. The data were analyzed, and algorithms were applied to process the data. After that, statistical methods involving probability density functions (PDFs) and cumulative distribution functions (CDFs) were applied to obtain a generalized model showing the peak and off-peak charging times. Furthermore, the study accounted for two charger levels from SAEJ1772 standards (level 1 and level 2) and weekday/weekend behavior. The study concluded with two ready-to-use models for each charger level for the weekend and weekday behavior. In [29], the same contributor implemented the fundamental and ready-to-use model developed previously in Saudi Arabia. The study data input was based on an actual survey conducted by the author on Saudi Arabia’s individual behavior. Next, the model was developed, producing the estimated load profiles of EVs in Saudi Arabia for 2025 with penetration levels of 10%, 20%, 30%, and 40%.

1.4. Study Contributions

As mentioned above, previous studies have accounted for many aspects of EVs. However, no study has conducted a reliability assessment of the generation system of Saudi Arabia. Until now, studies in this regard have looked at the charging behavior of Saudi Arabia without considering the evaluation of reliability assessments and the impact on its generation system. The central region of Saudi Arabia’s generation system supplies power to multiple cities, including the capital city Riyadh. Another aspect provided by this paper is verification from the electrical generation system’s point of view of Saudi Vision 2030 regarding EVs. Moreover, the study introduced in this paper will help the planning of decision-makers to ensure the proper deployment of EVs.
Thus, the main contributions of this paper are as follows:
  • Verifies the possibility and the impact from a reliability point of view of Saudi Vision 2030, which states that by the year 2030, 30% of the total vehicles in the capital Riyadh will be EVs [6].
  • Estimates the number of EVs in Saudi Arabia by 2030 with penetration levels from 10% to 100% and estimates the number of EVs in Riyadh with the same range of penetration levels.
  • Estimates Saudi Arabia’s generation capacity in the year 2030 based on historical data and estimates the capacity of its central region.
  • Estimates the reliability indices of the loss of load probability (LOLP) and the expected energy not supplied (EENS) by the generation system for the year 2030 in Saudi Arabia, considering the forecasted maximum installed capacity for the year 2030 and the integration of EVs with the mentioned penetration levels; as well, for the central region of Saudi Arabia, the same approach is implemented to uncover EVs’ penetration in Riyadh City.
  • Studies the impact of deploying EVs on the network in several penetration levels using fixed multiple increments to manifest the impact of EV deployment accurately.
This paper is divided into six sections. Section 2 presents the data collected from the related sources, including the number of registered vehicles in Saudi Arabia, the generation system capacity, and the peak load. Then, Section 3 implements estimation techniques and tools to predict the parameters required to build simulations for the year 2030. The assumed and gathered data are utilized in Section 4, with a simulation and reliability assessment conducted on two main cases. Case 1 focuses on Saudi Arabia’s generation system and EVs. Case 2 focuses on the central region’s generation system and EVs.
Specifically:
-
Case 1.1 is the estimated generation capacity with the estimated load profile in addition to the estimated EV profile of Saudi Arabia in 2030.
-
Case 1.2 is similar to Case 1.1 with a different estimated value for the generation capacity.
-
Case 2.1 looks at the estimated generation capacity with the estimated load profile of the central region in addition to the estimated EV profile of Riyadh City in 2030.
-
Case 2.2 is similar to Case 2.1, with a different estimated value for the generation capacity.
After, Section 5 conducts a sensitivity analysis on all cases in Section 4. Finally, Section 6 draws the conclusion of this paper along with recommendations and further studies to be explored.
Note that the reliability assessment conducted in this paper is of hierarchical level 1 (HL1) [30], which is a generation-oriented reliability assessment considering the load without details, such as the distribution system (HL3). Although it is HL1, the generation capacity levels are not considered, and only the maximum generation capacity is considered in the simulation and the study. Since the simulation shows the impact on the maximum generation level, other levels will also be impacted. This means the system’s reliability decreases for all the levels if the maximum level is affected. This paper focuses on the impact of EVs.

2. Data-Collecting

2.1. Number of Vehicles

Regarding the number of vehicles in Saudi Arabia, there is no actual record of the number of vehicles in use. Thus, no system can remove registered vehicles after they are defected, destroyed, or exported [4].
The available data is an estimation provided by the King Abdullah Petroleum Studies and Research Center (KAPSARC) for the years 1983 to 2018. The estimation was built on 2 numbers for the years 1983 and 2000, along with the available statistical data of annual vehicles imported obtained from the General Authority for Statistics for the years 1982 to 2018. Figure 1 shows the estimated number of vehicles in Saudi Arabia from 1983 to 2018 [4].
Hence, a forecasting method was implemented based on the data in Section 3 to estimate the number of registered vehicles in the years up to 2030.

2.2. Generation System

Saudi Arabia’s generation system is divided into four regions: the western region, the eastern region, the southern region, and the central region. Besides the areas that the central region supplies, it also supplies Riyadh, the capital city of Saudi Arabia. The installed generation capacity per year is provided by the Water and Electricity Regulatory Authority (WERA) [31]. For the purpose of the study, the generation capacity of the central region and the total generation capacity of Saudi Arabia are tabulated in Table 1 for the years 2007 to 2020.

2.3. Load Profile

Similar to Section 2.2, the same reference provided the peak load of Saudi Arabia as well as each of its regions. The peak load per year is shown in Table 2 for Saudi Arabia and its central region.
As shown in Table 2 and Table 3, the central region peak load exceeds the generation capacity for all the years. Thus, the eastern region supports the central region’s generation during peak periods to cover the demand [33].

2.4. EVs’ Consumption

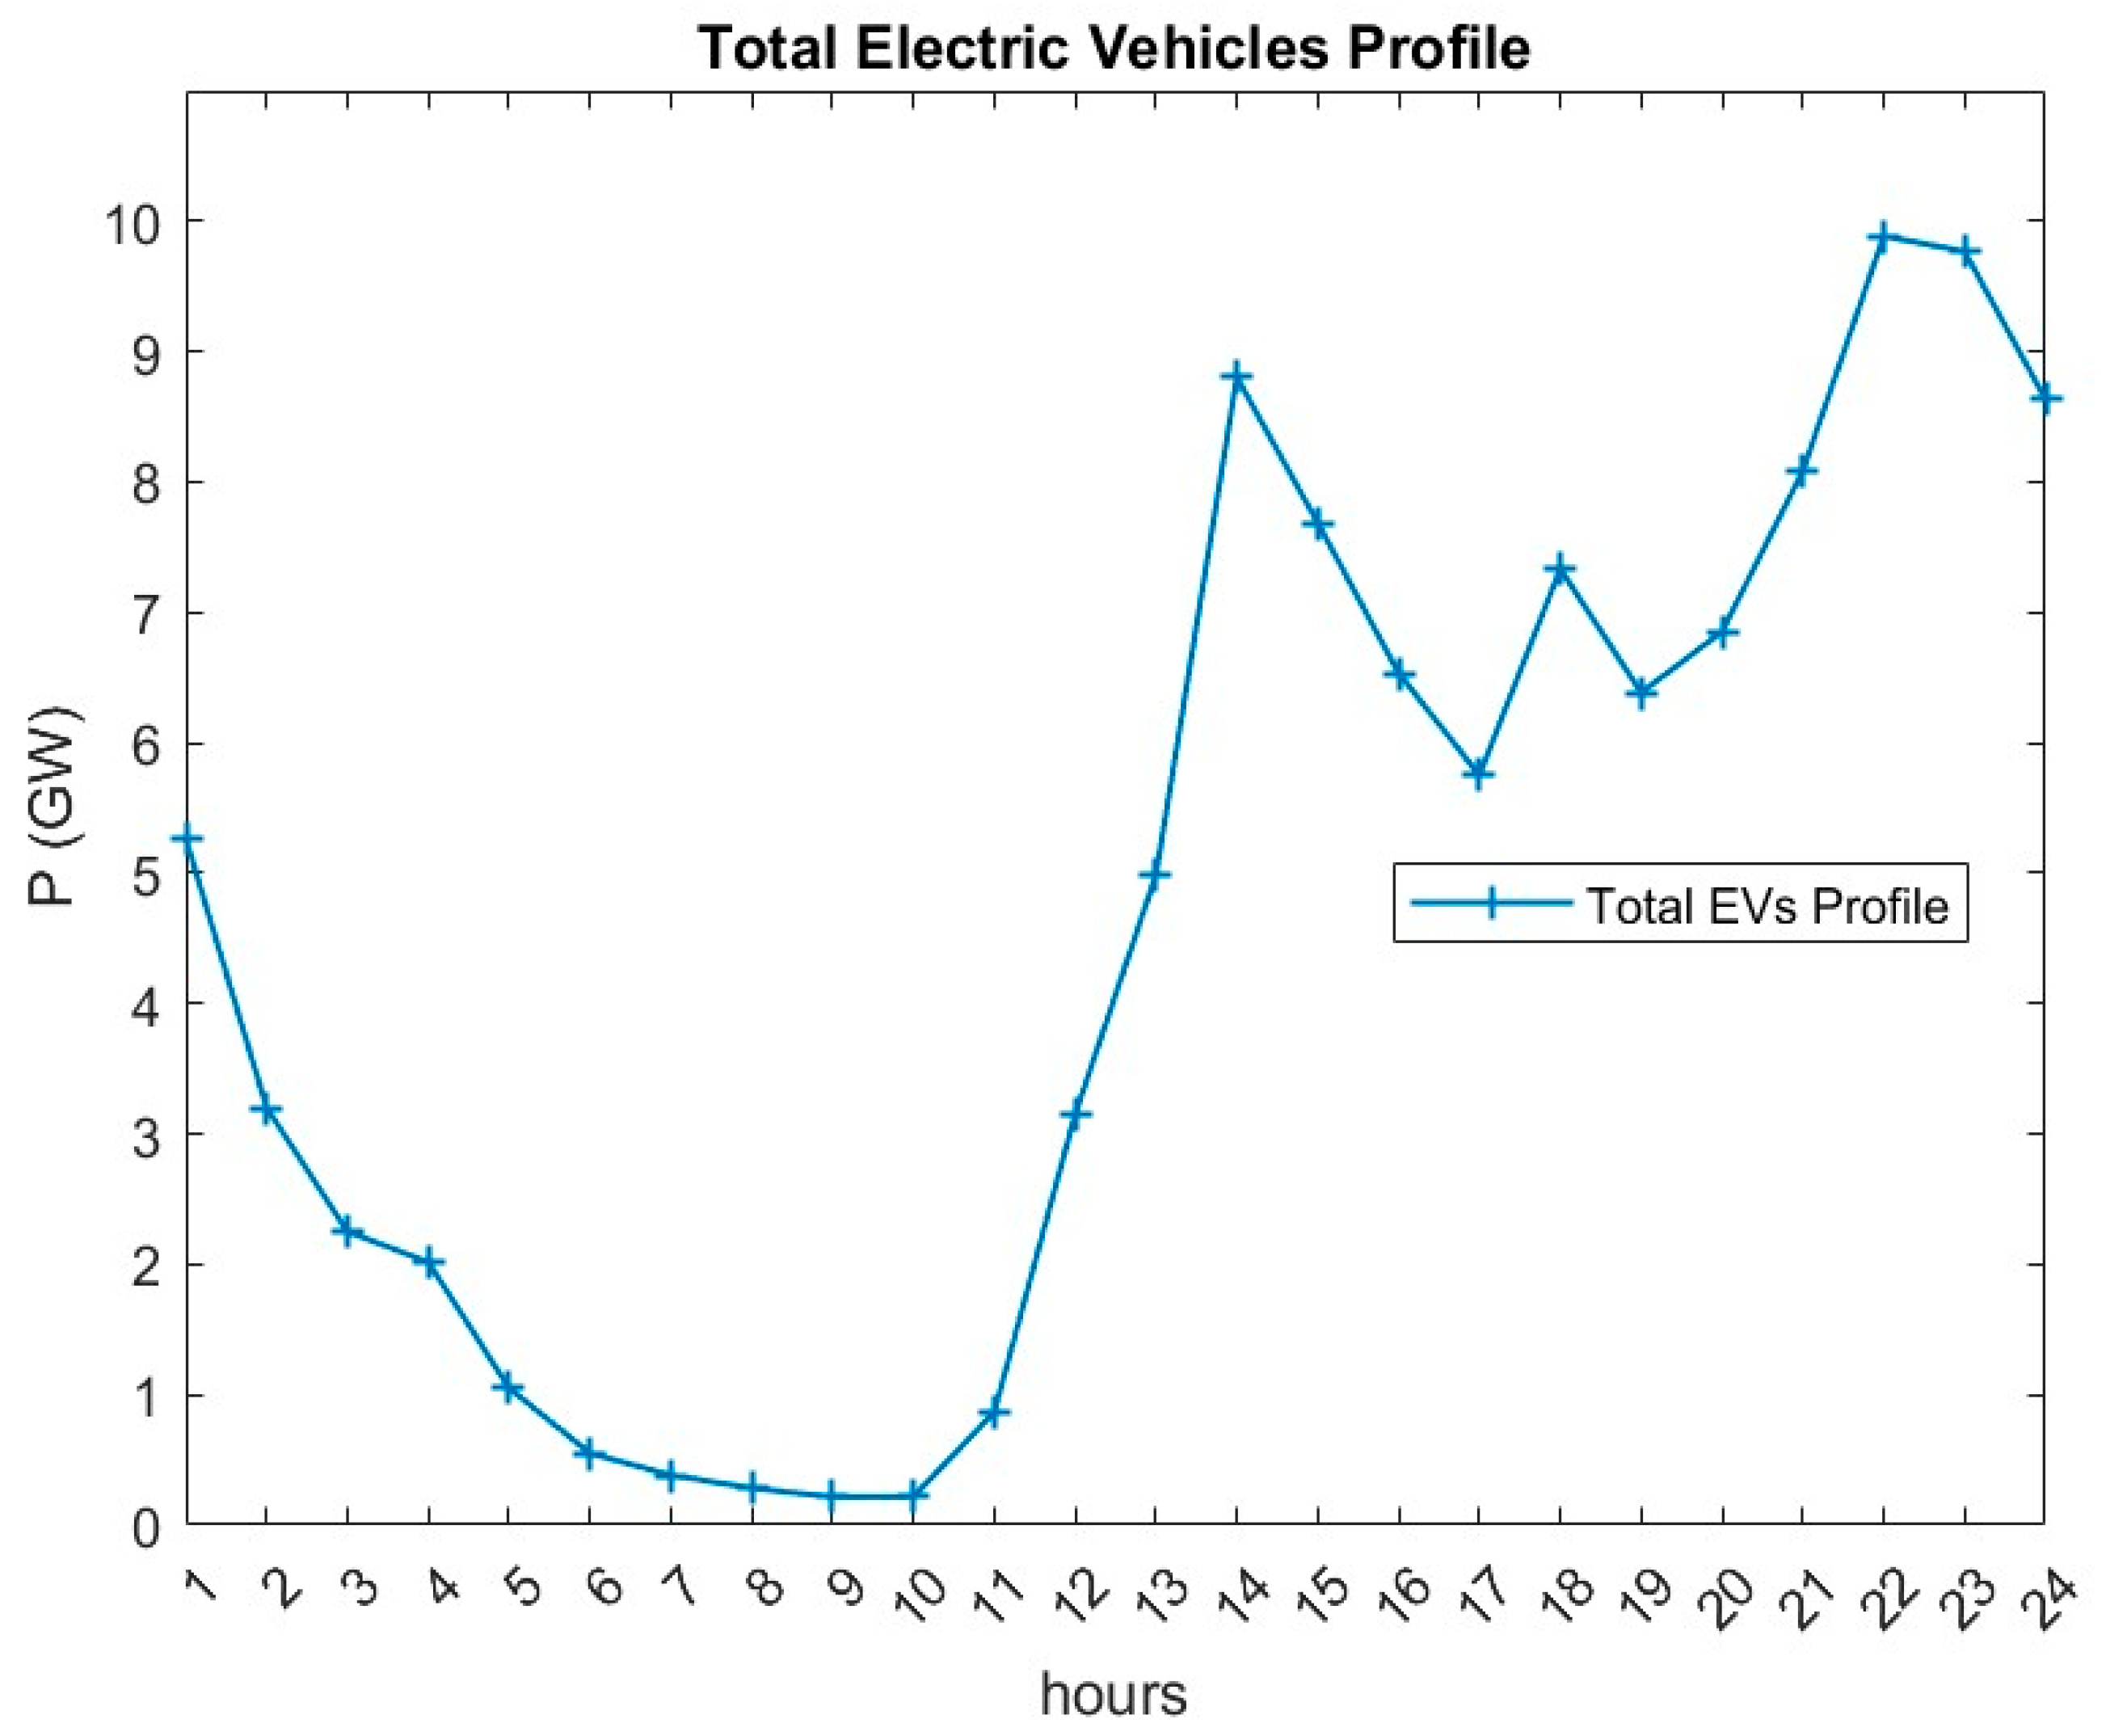
The requirement in this study is to obtain the expected charging behavior of the consumers. Therefore, this behavior is converted into a load profile by obtaining all consumer behavior, including charging time and the state of charge (SoC). The model developed in [28] helps obtain the charging profile by entering the required inputs such as distance traveled and type of vehicle. Thus, the model is used as a base in this study, as this is the only model applied to Saudi Arabia. Utilizing the model and conducting a survey to collect the data required by the model for Saudi Arabia yields the charging profile shown in Figure 2 [29]. The obtained profile is based on the charging level 2, as level 1 utilizes 120 V, which is very rare in the infrastructure of Saudi Arabia. The determination of the charging level is based on the standard SAE J1772 [34]. Table 3 shows the AC charging levels based on the standard SAE J1772.

3. Estimations and Assumptions

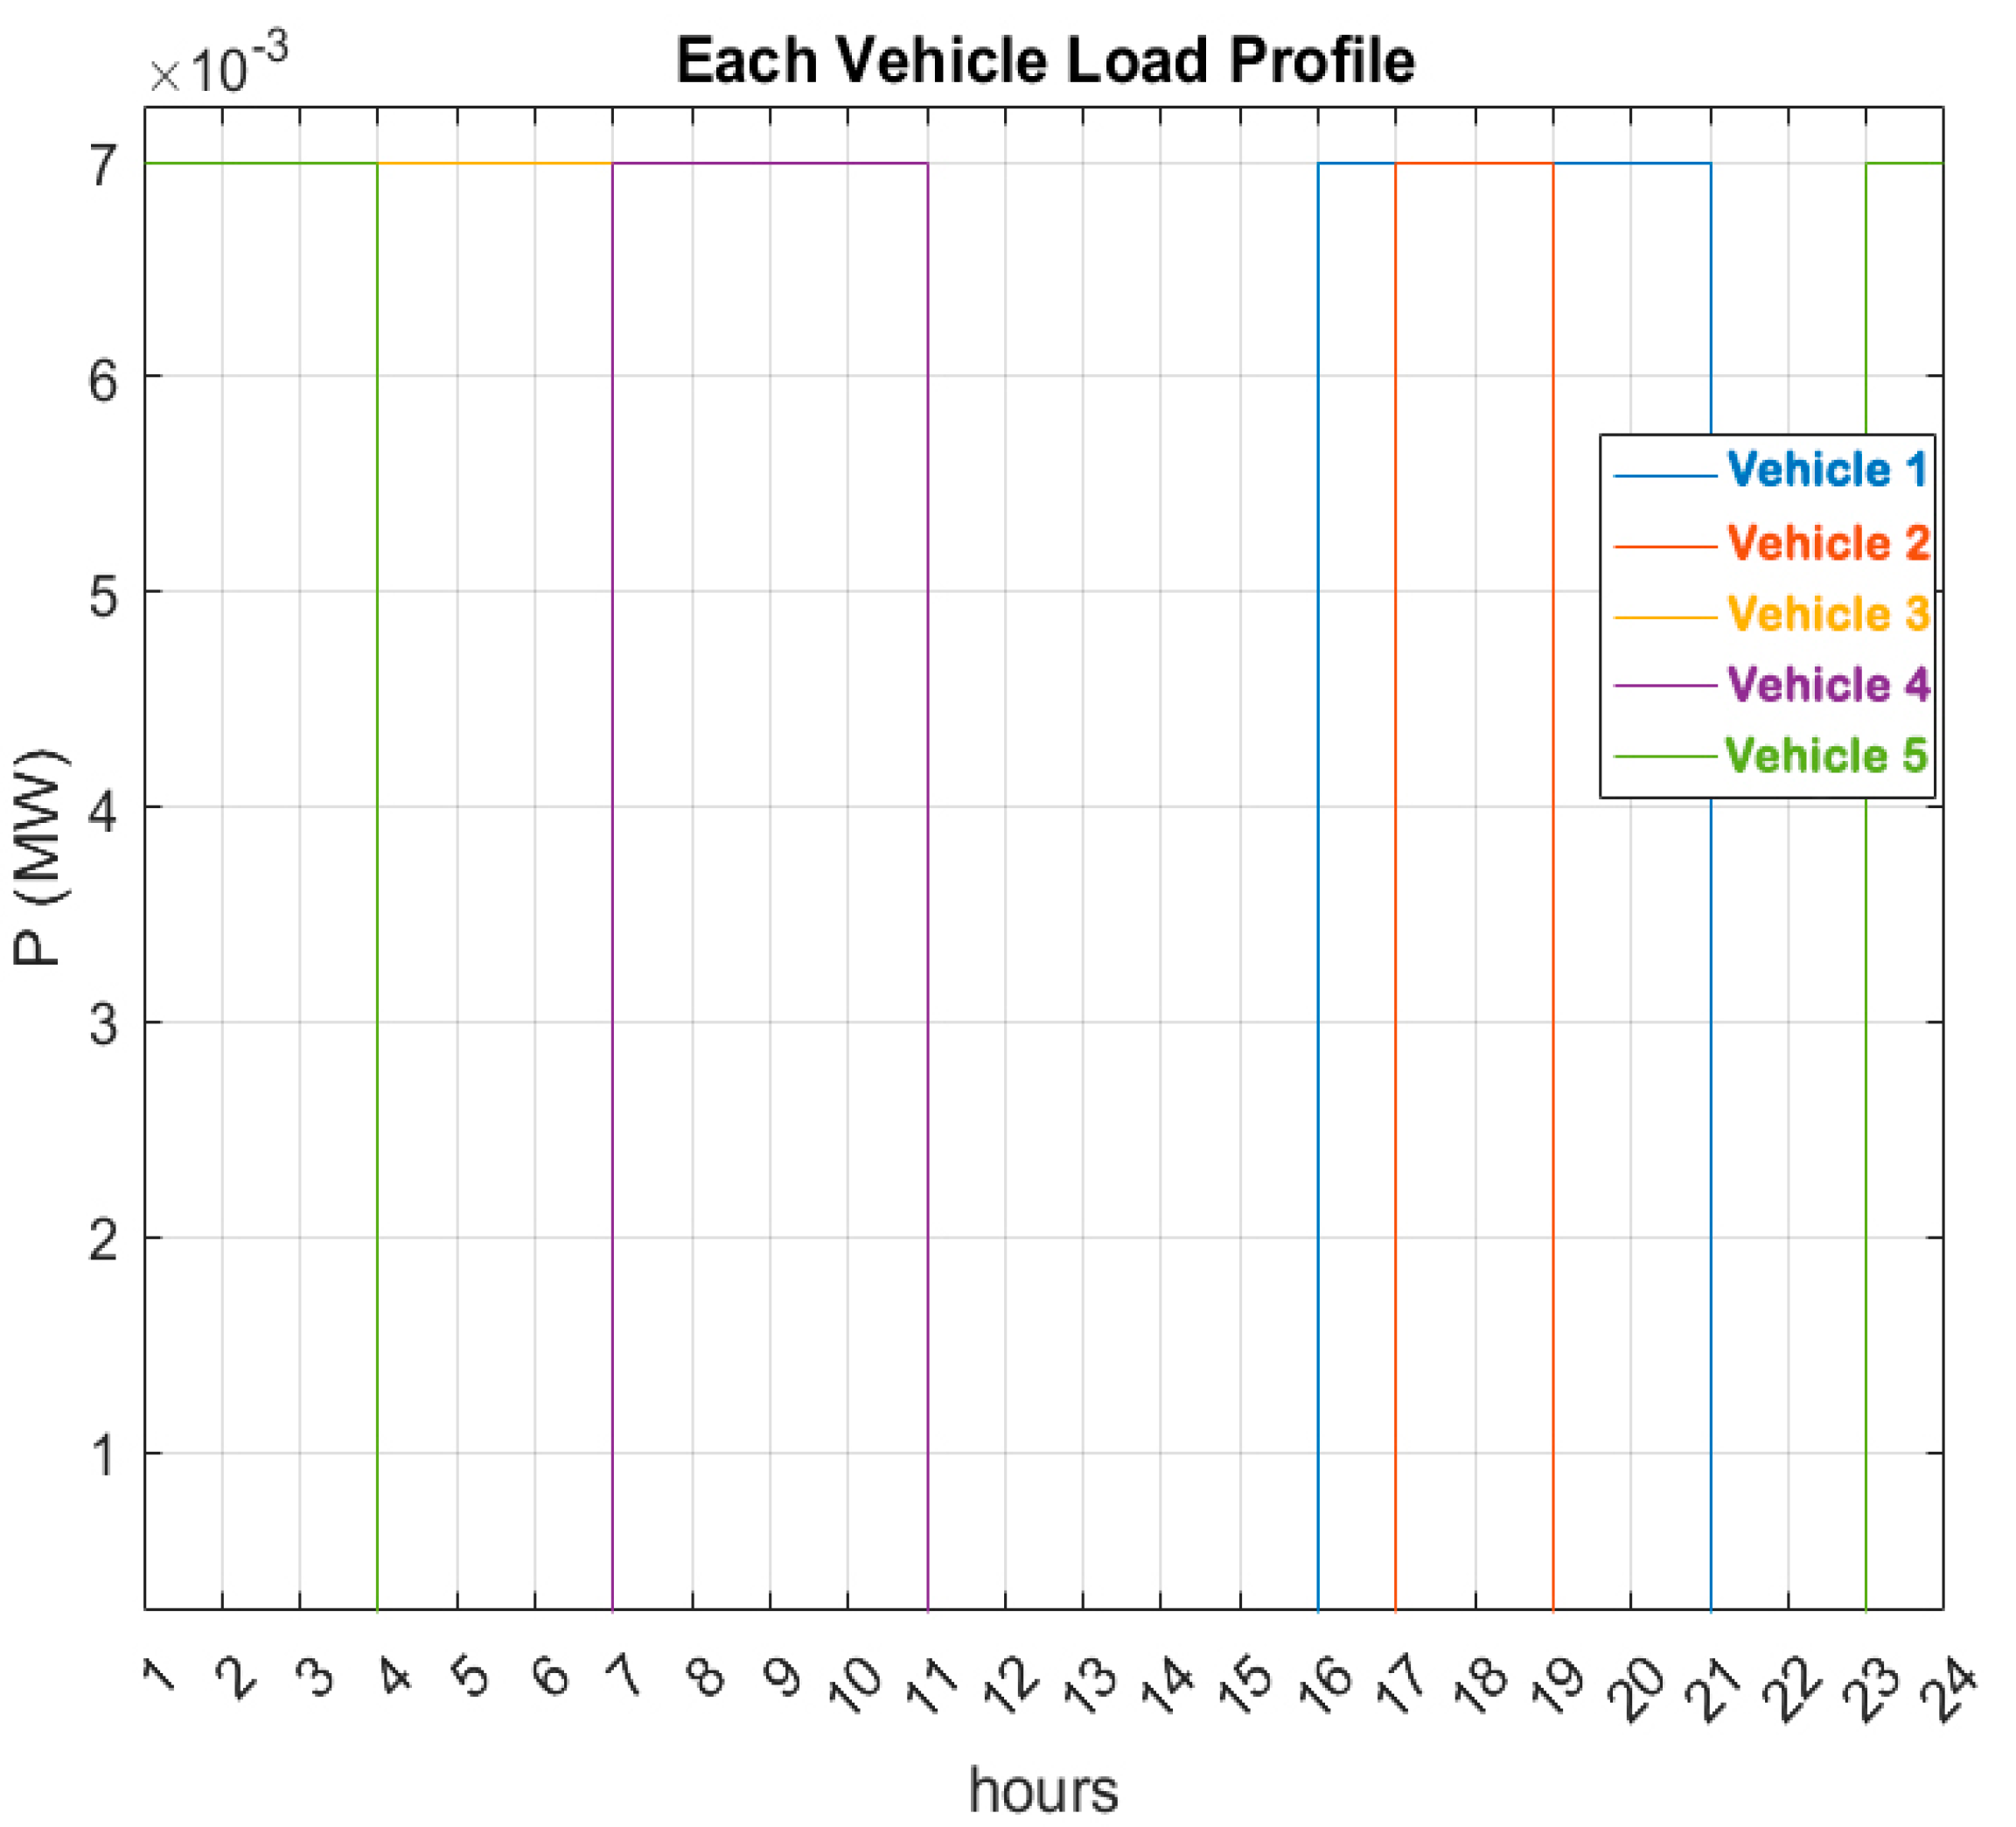
This section aims to estimate the year 2030 peak load, generation capacity, and the number of vehicles, further used in Section 4. The generation capacity is assumed to be a straight line at the maximum capacity. Regarding the conventional load profile, the annual statistical report for 2020 by WERA states that the peak load occurs in the summer. As well, a typical summer day’s load profile is shown; Figure 3 shows typical day curves for Saudi Arabia [32]. The load profile of the study was obtained by shifting the typical day’s profile curve by the ratio of its maximum point concerning the peak load estimated in 2030, which is discussed in the next section. As shown, the EVs’ charging profile is variable, with peaks in the afternoon and evening. A sample of EV charging is shown in Figure 4.

3.1. Estimating 2030 Peak Load

Using the peak load in Table 2, Ref. [35] stated that the peak load of Saudi Arabia in 2030 is forecasted to be 83.855 GW without considering any EV involvement. To estimate the error of the forecasted peak load, actual values for 2019 and 2020 were utilized as a test value for the estimated values provided by the reference. These are compared to the actual values to determine the error ratio.
Error calculation:
% Error = (|Actual value − Estimated value| ÷ Actual value) × 100
Error % for year 2019:
% Error = |62.076 GW − 61.688 GW |÷ 62.076 GW × 100 = 0.63%
Error % for year 2020:
% Error = |62.266 GW − 63.297 GW|÷ 62.266 GW × 100 = 1.66%
The error calculation shows the following:
  • As we estimate further years, the error percentage increases due to adding the uncertainty margin.
  • The estimated value for 2019 has a positive error, while the estimated value for 2020 has a negative error. Hence, the estimation could be represented with an upper and lower bound surrounding it. The boundaries of uncertainty widen when moving further from the actual values.
As shown in Table 2, for the years 2007 to 2020, the central region accounts for 31% to 34% of Saudi Arabia’s peak load. Hence, the 2030 peak load is estimated to be 34% of the total forecasted peak load for Saudi Arabia, equal to 28.511 GW.

3.2. Estimating 2030 Generation Capacity

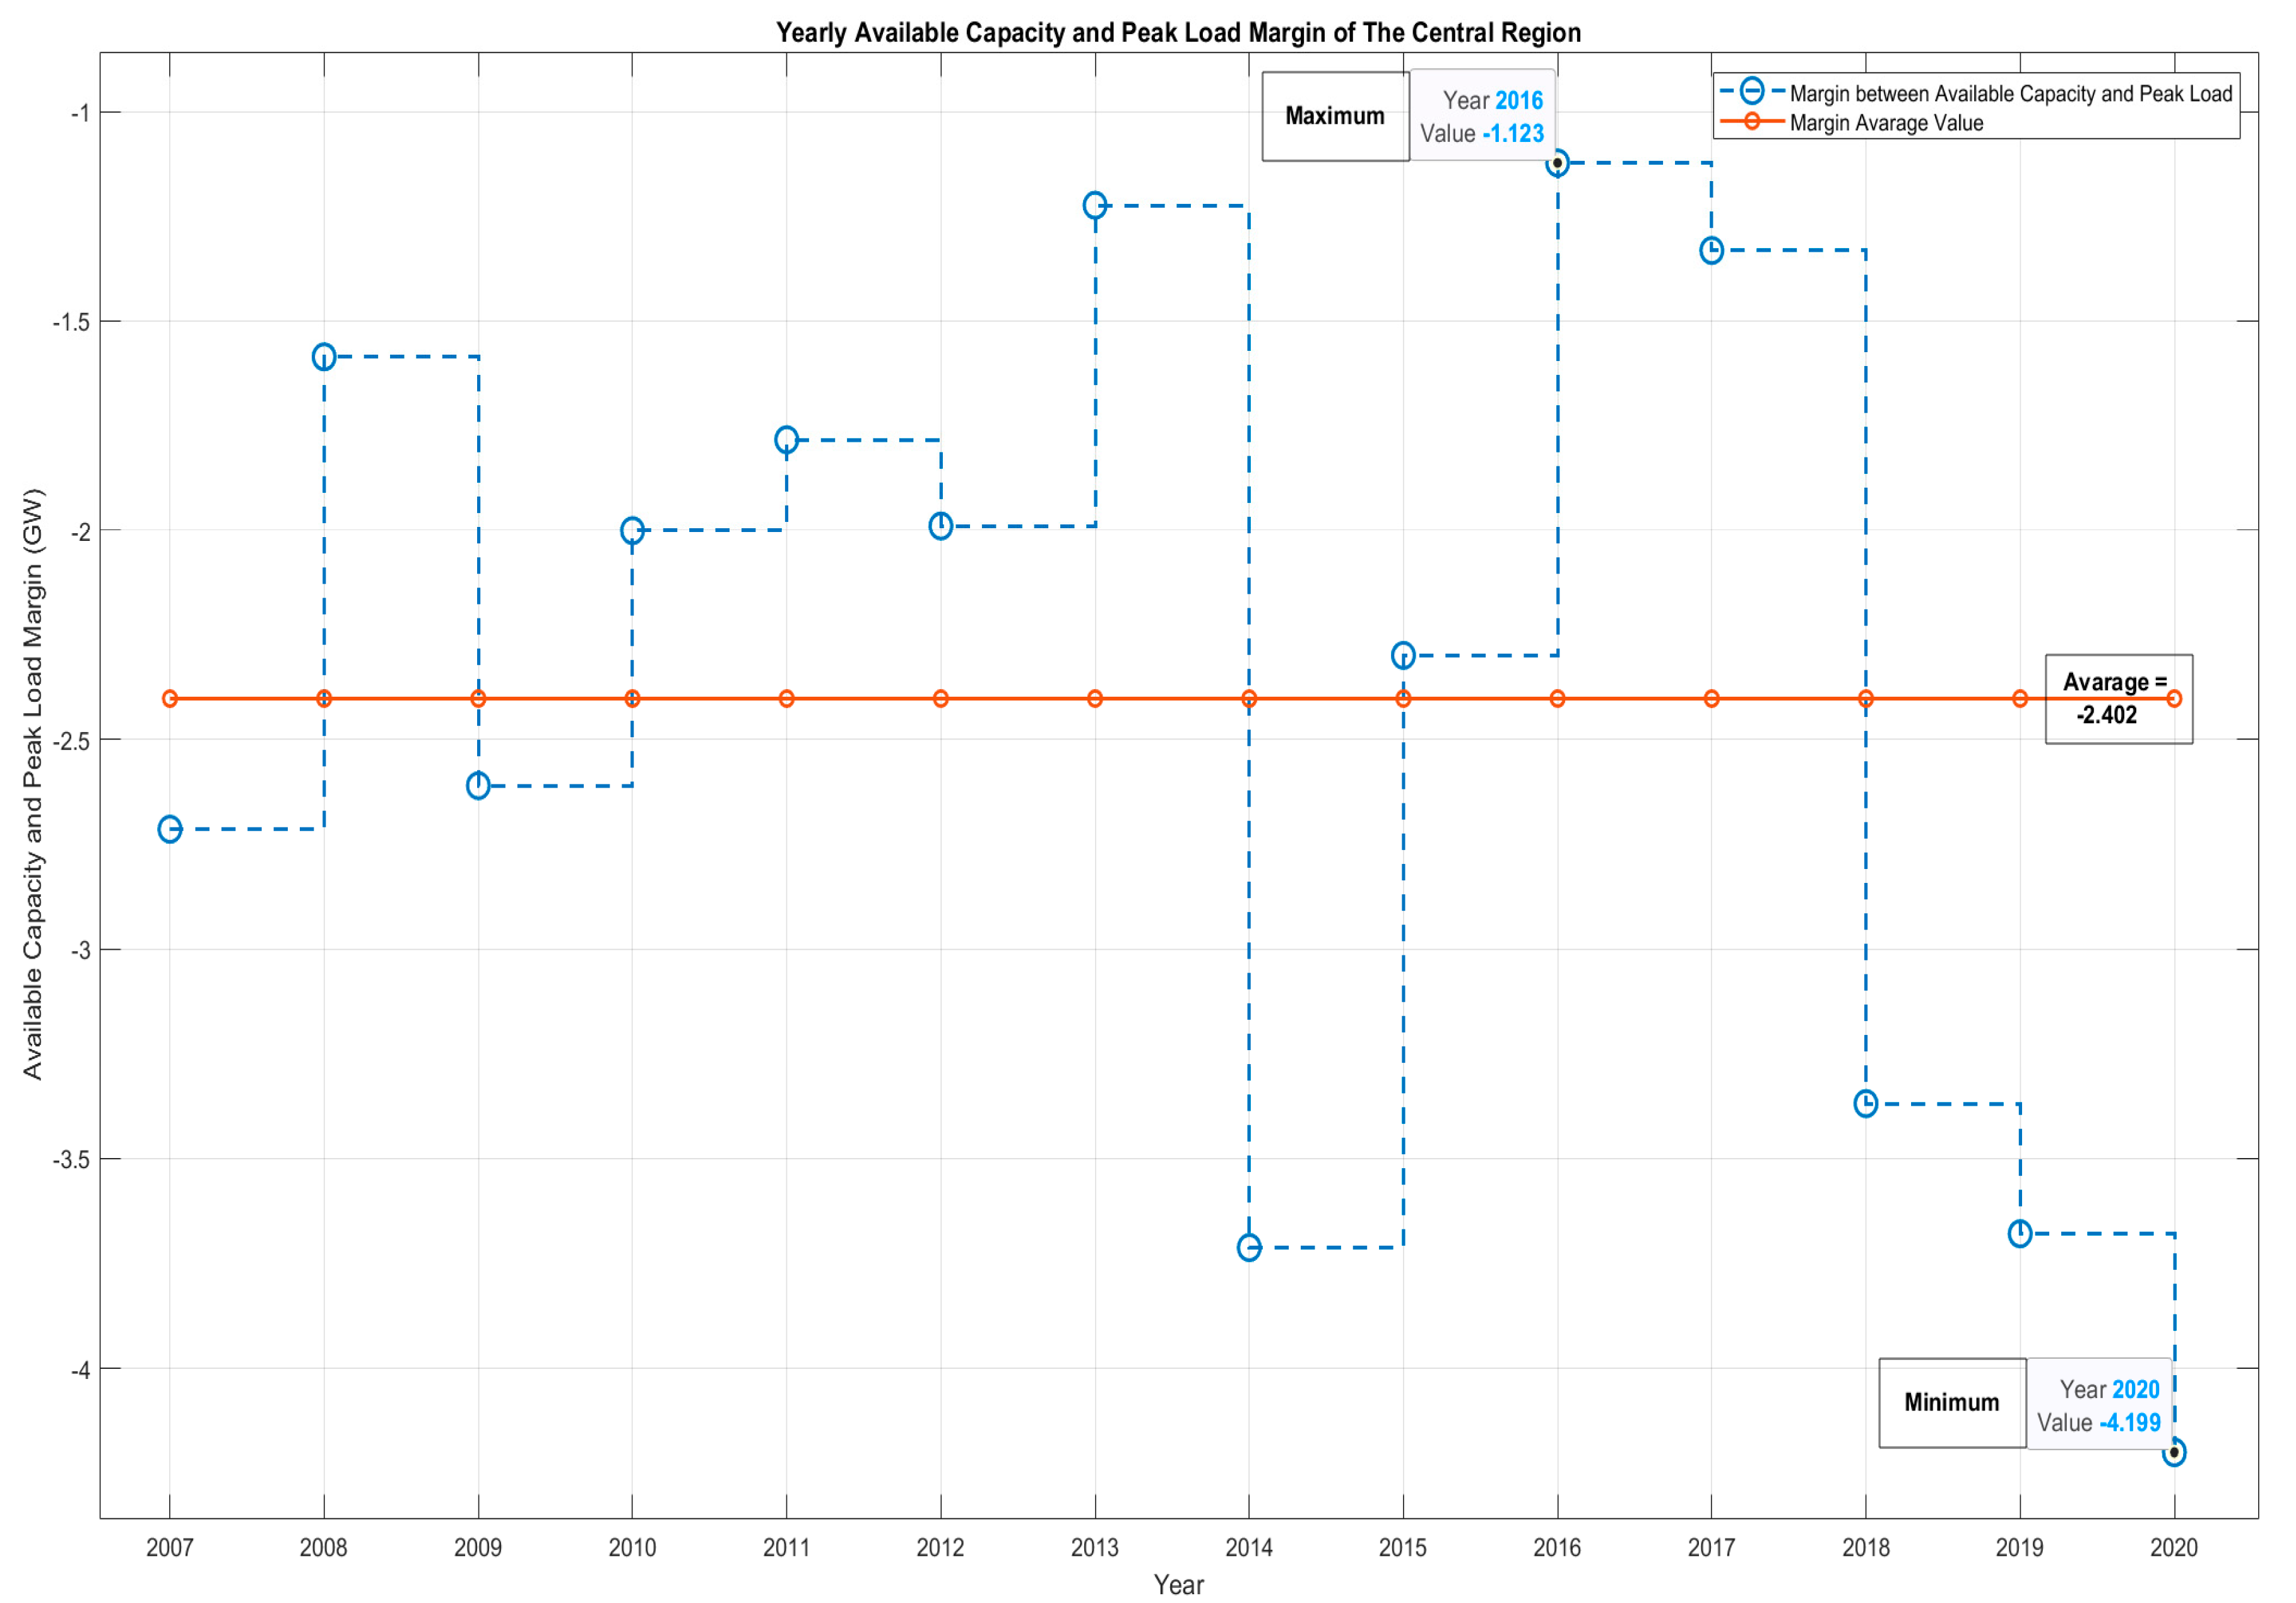
The estimation of the generation capacity is based on the historical data of both the generation capacity and the peak load. Therefore, finding the difference between the peak load and the generation capacity per year, with respect to the peak load, indicates the margin of the annual reserve capacity. Figure 5 shows Saudi Arabia’s difference margin between the generation capacity and annual peak load. Similarly, Figure 6 shows the difference margin for the central region. The maximum and average margin for the historical data of both Saudi Arabia and the central region are added to the peak load obtained in Section 3.1. Hence, the simulation section examines the estimated generation capacity of 2030 for Saudi Arabia and the central region.
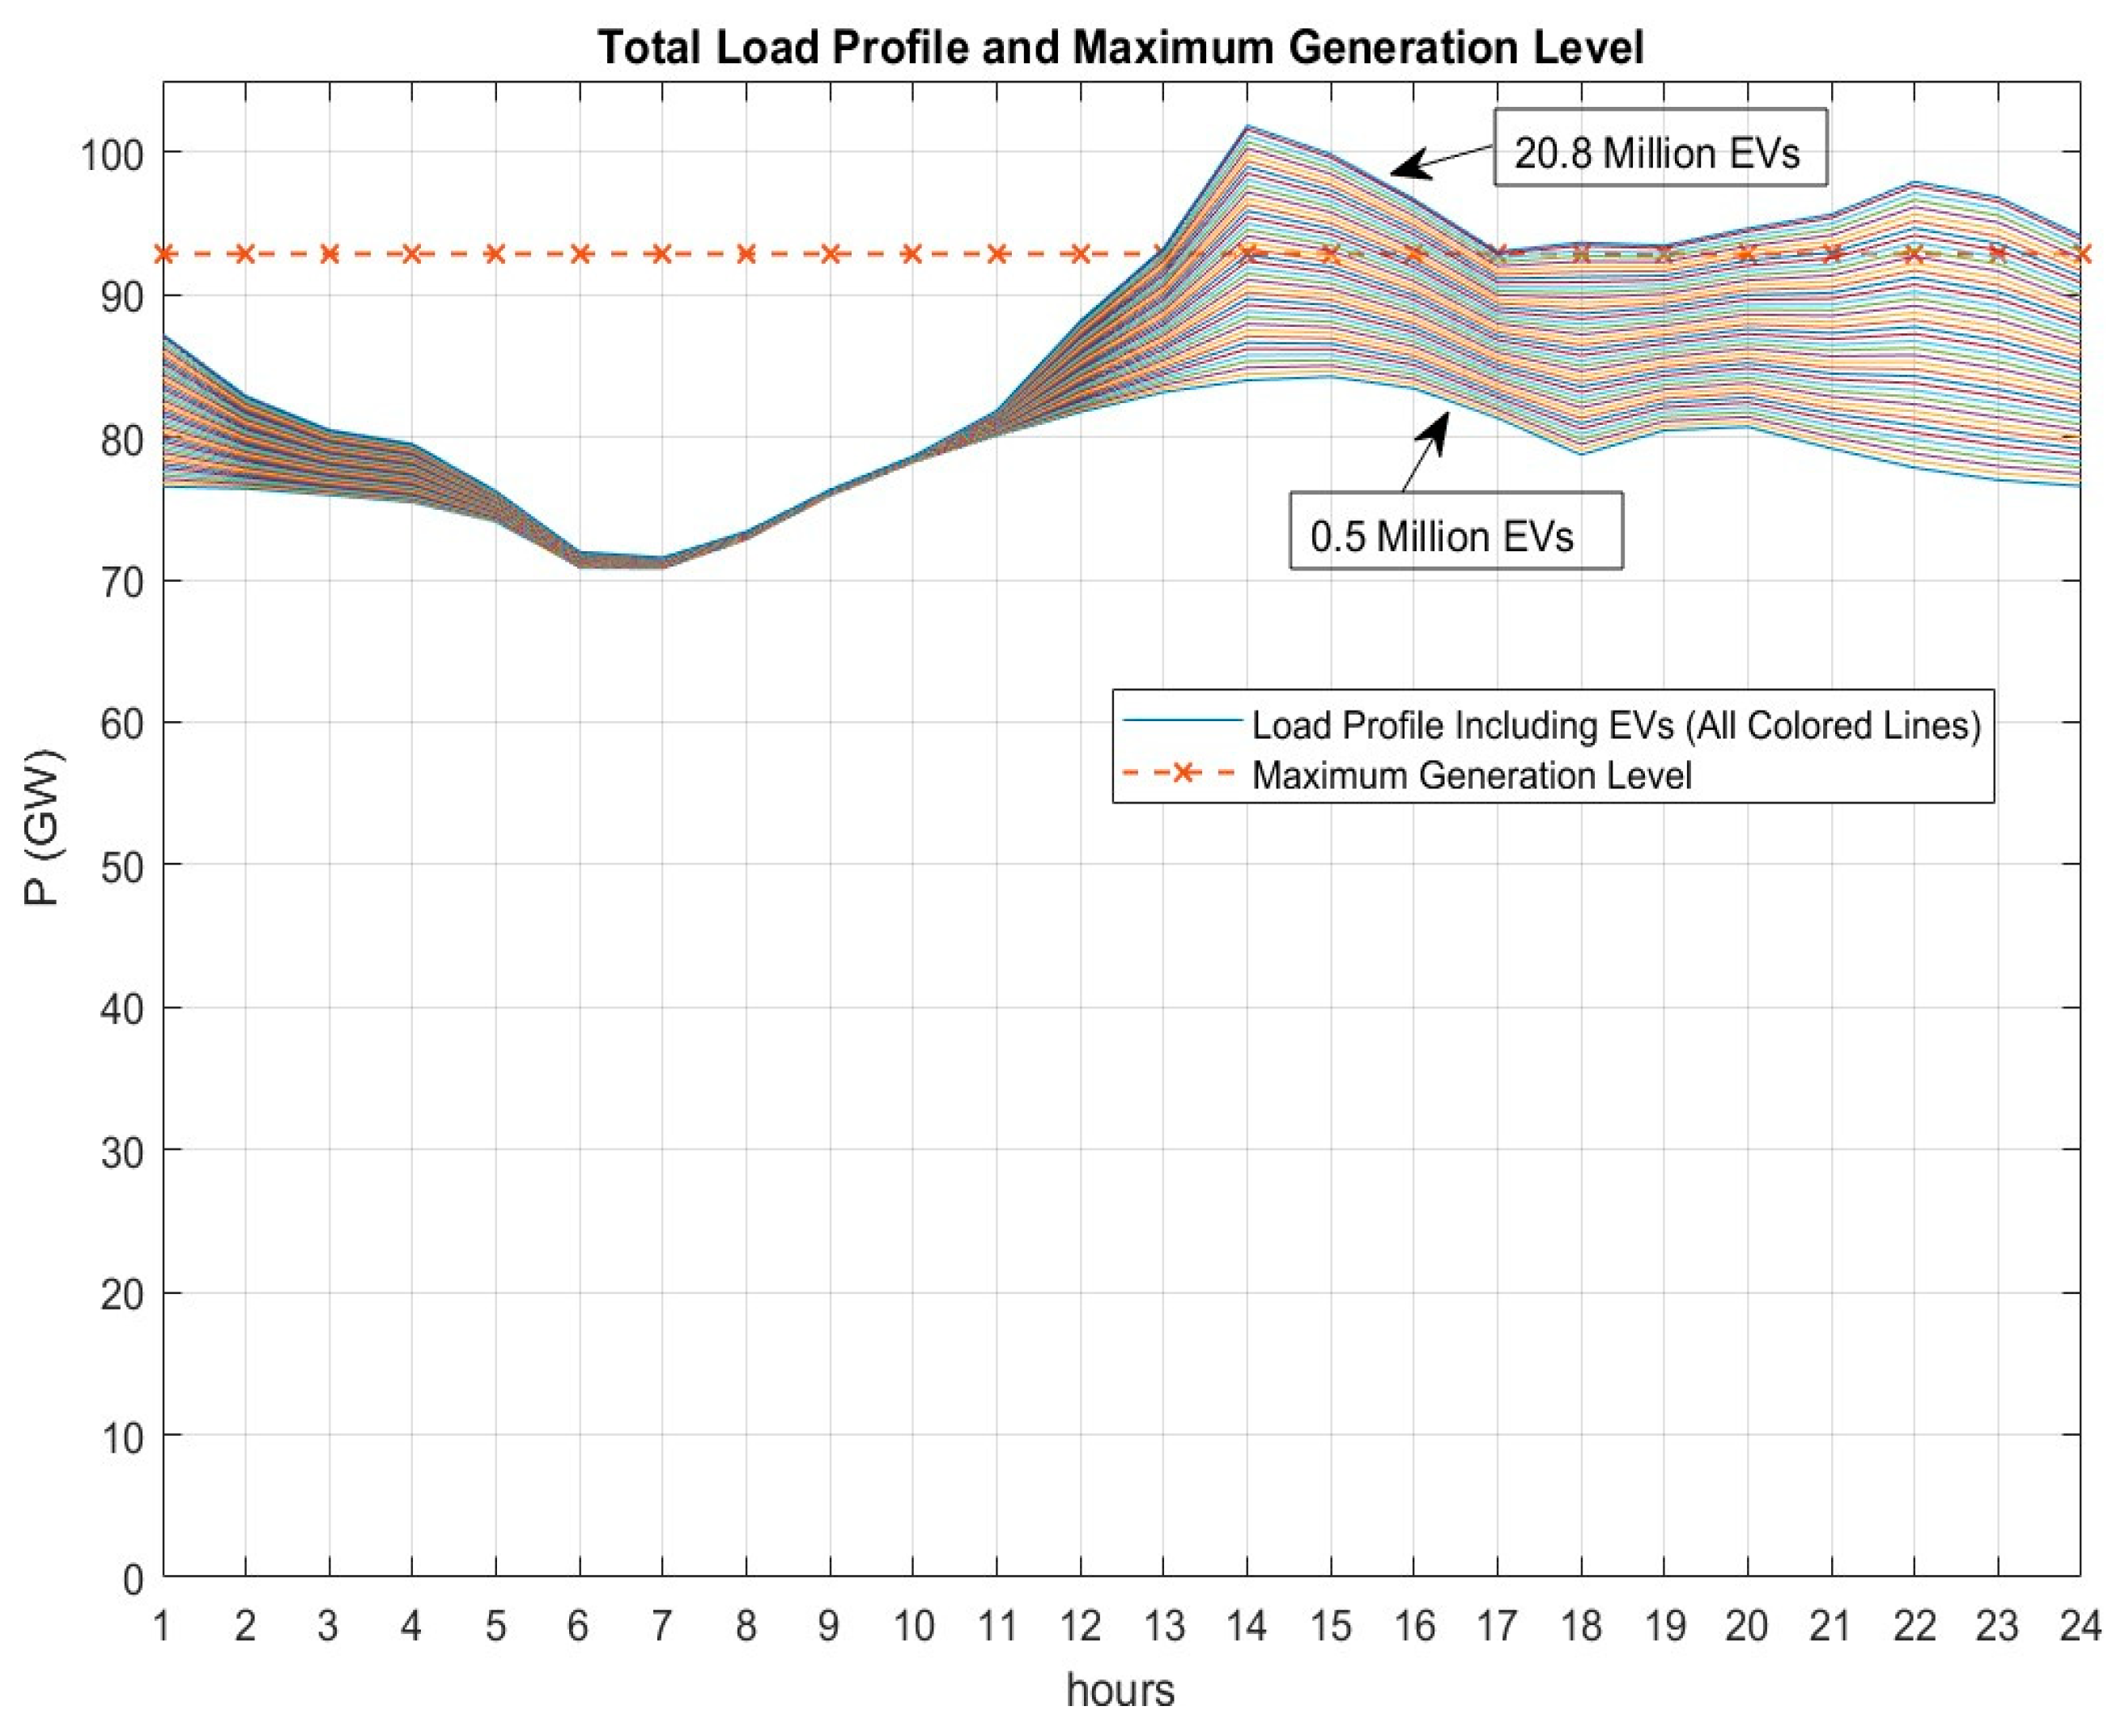
  • Value (1) Estimated generation capacity of Saudi Arabia in 2030 = peak load + maximum margin = 83.855 + 9 = 92.855 GW
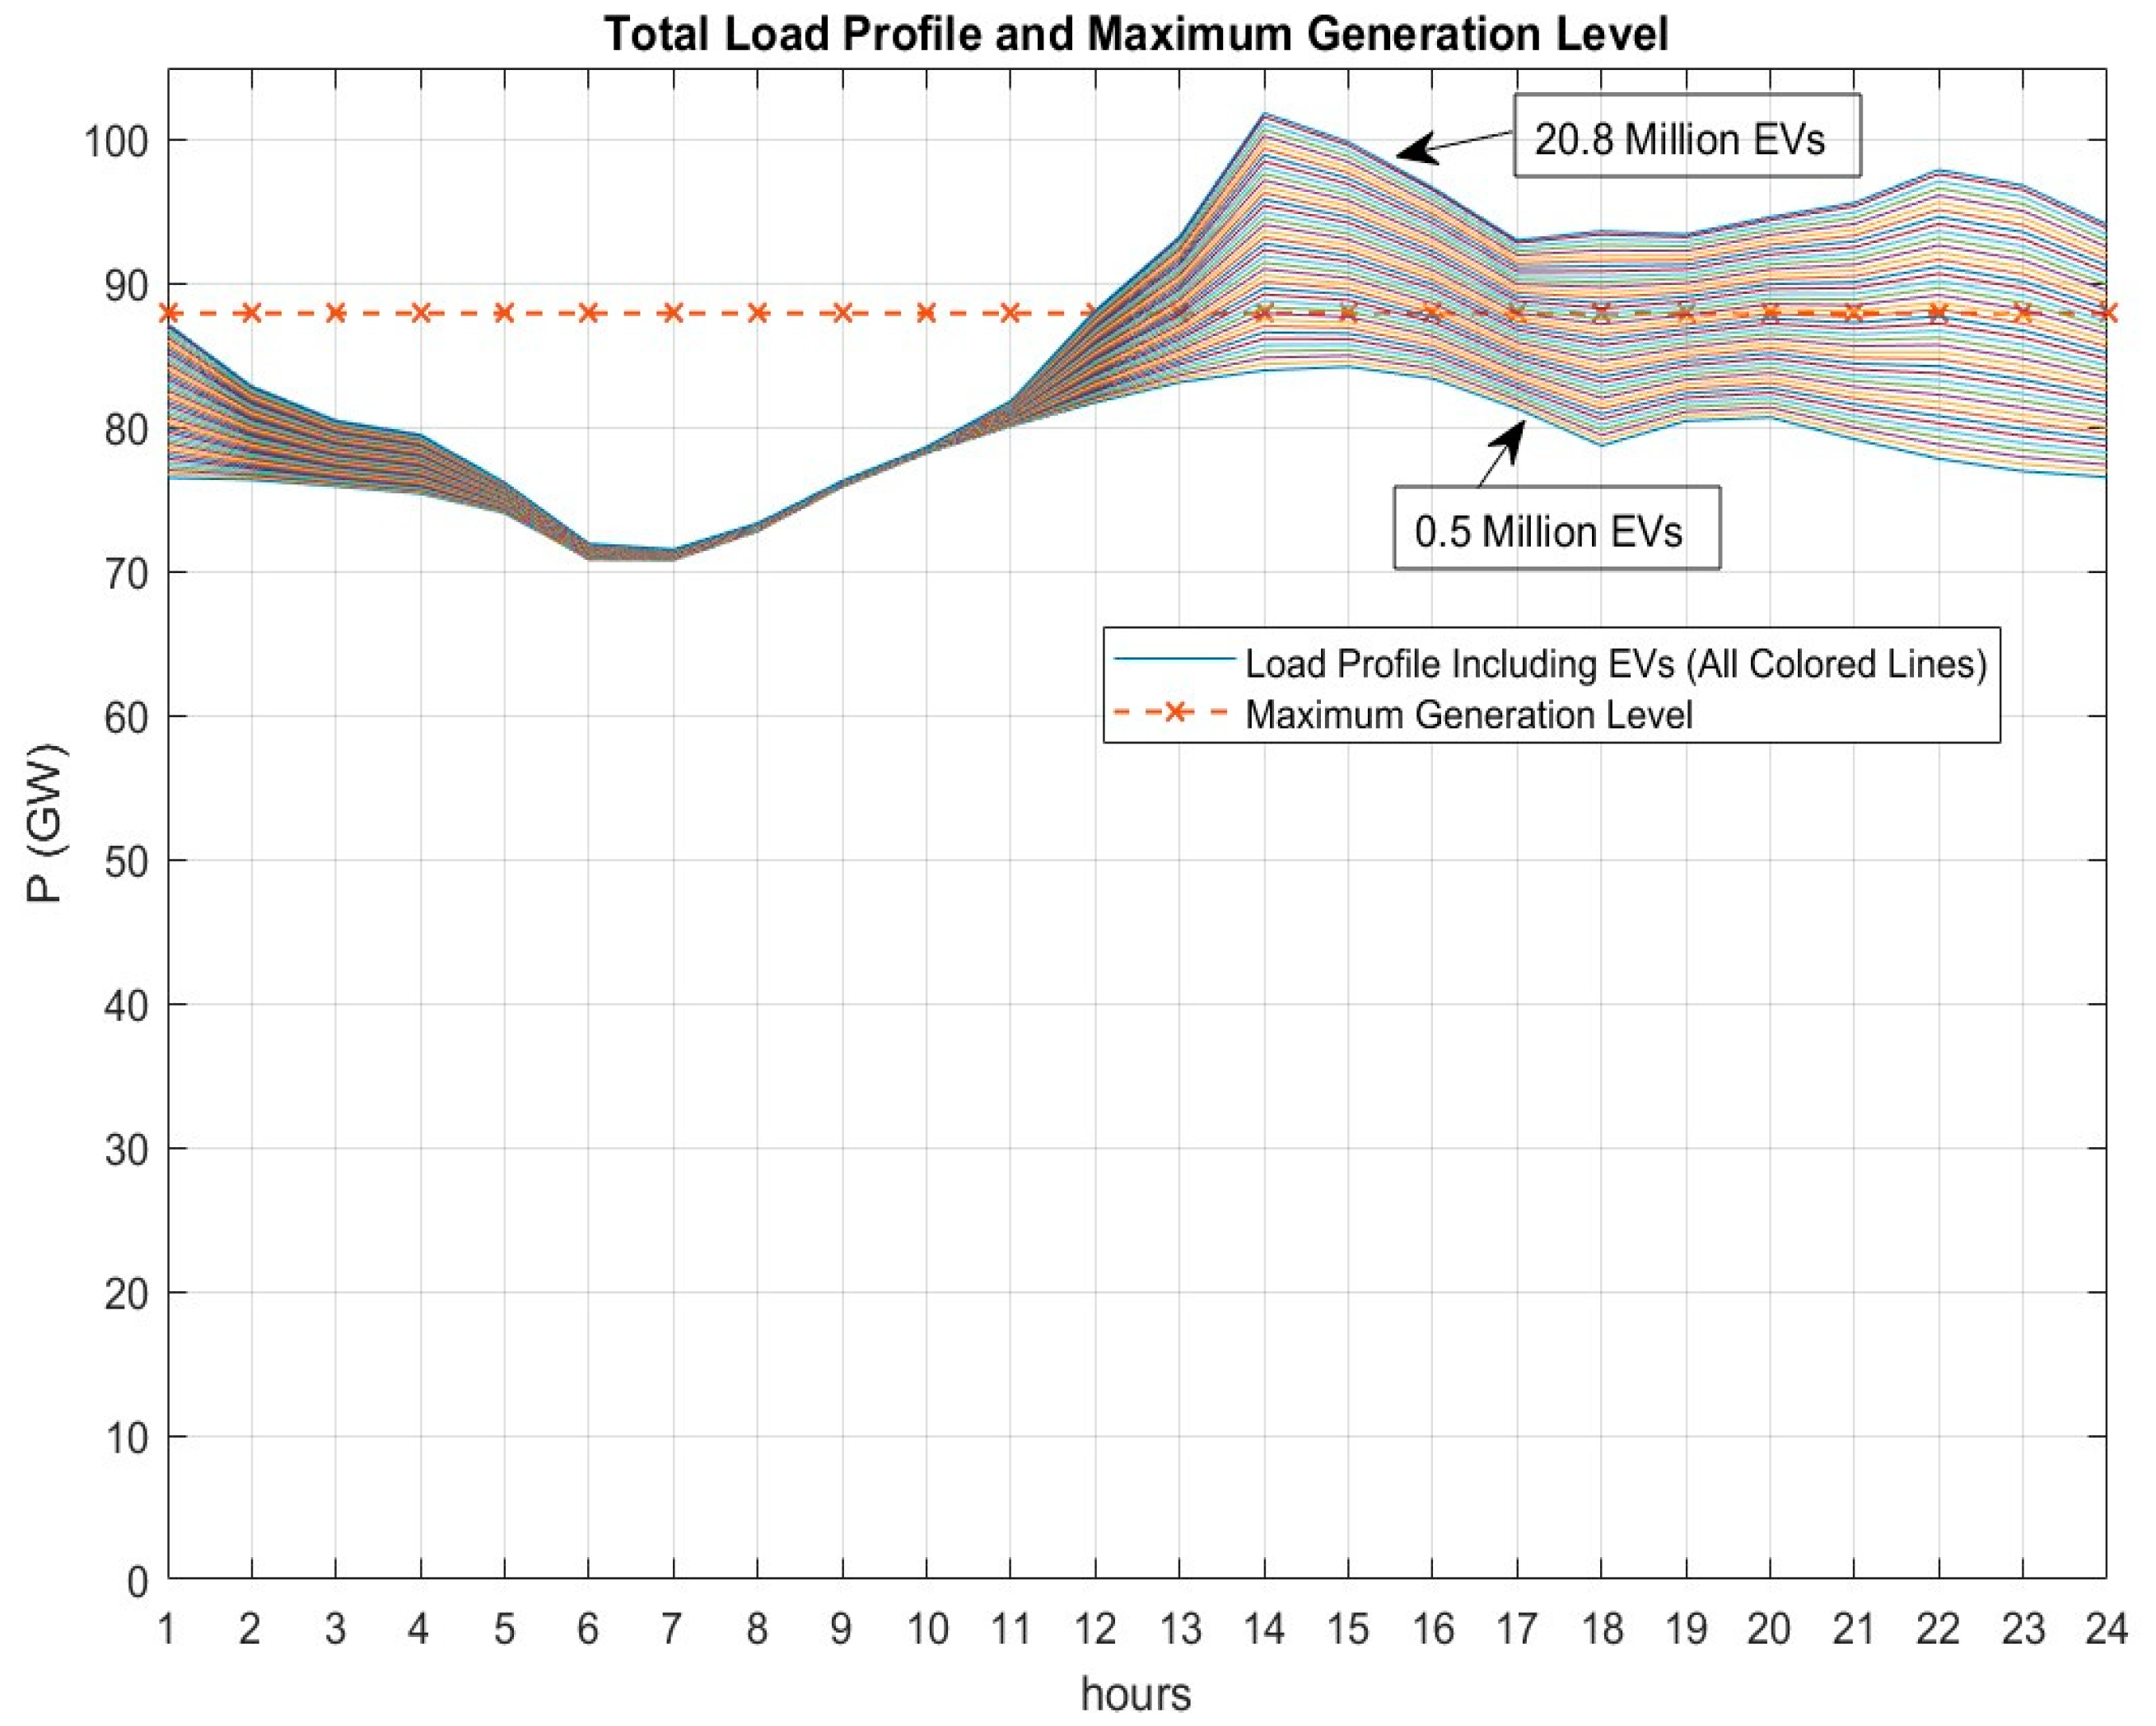
  • Value (2) Estimated generation capacity of Saudi Arabia in 2030 = peak load + average margin = 83.855 + 4.095 = 87.95 GW
  • Value (3) Estimated generation capacity of central region in 2030 = peak load + maximum margin = 28.511 + (−1.123) = 27.388 GW
  • Value (4) Estimated generation capacity of central region in 2030 = peak load + average margin = 28.511 + (−2.402) = 26.109 GW
Figure 5. History of Saudi Arabia’s peak load (no record of any EVs penetration) and generation capacity margin difference.
Energies 16 04579 g005
Figure 6. History of the central region’s peak load (no record of any EVs penetration) and generation capacity difference margin.
Energies 16 04579 g006
Considering the maximum margin obtains the best generation capacity scenario. The average value is obtained from the historical data to study a moderate scenario. From the given historical data in Figure 6, the difference margin between the generation capacity and the peak load for the central region is negative for all years. Thus, there is an expectation for energy not supplied (EENS) by the load without EV involvement.

3.3. EV Involvement

According to the vehicle statistics in Figure 1, the numbers increased gradually. Thus, a fit curve based on the lowest sum of squares due to error (SSE) found that a polynomial of the 4th degree fitted the behavior. Figure 7 shows the fitted polynomial and the forecasted values, noting that the uncertainty boundaries will increase with further data that is far from the actual data. Thus, in 2030, the estimated number of vehicles in Saudi Arabia will be 20.8 million. Figure 2 shows an example of the behavior for a load profile of 10 million EVs.
According to the statistics, Riyadh City’s share represents 24.1% of the total vehicles in Saudi Arabia [36]. Hence, for the year 2030, the estimated number of vehicles for Riyadh City is 24.1% of 20.8 million, and this is equal to 5.013 million vehicles.
According to Saudi Vision 2030, 30% of Riyadh’s estimated vehicles shall be EVs [6]. Thus, in the upcoming simulation section, the number 1.504 million, which is 30% of 5.013 million, is assumed to represent the number of EVs in Riyadh City by 2030. Other penetration levels are also tested.

4. Simulation

This section highlights the simulation to investigate the relationships between the generation capacity and load profile, including the effect of EV involvement. The simulation is first examined in Saudi Arabia as if the whole generation network is linked together (the whole capacity can be utilized from anywhere in Saudi Arabia) in addition to the penetration level of EVs. Then, another subsection considers the simulation for the central region supplying its load in addition to EV penetration from Riyadh City for the year 2030.

4.1. Loss of Load Probability (LOLP)

LOLP is a quantified percentage value representing the load consumption higher than the generation capacity. In our case, LOLP represents the load and EV consumption when they exceed the generation capacity. The load profile and generation capacity are shown in hours, which implies that the load duration curve (LDC) is used to evaluate the indices [30].
L O L P ( % ) = t = 1 T φ ( t ) T
where:
φ ( t ) = 0 ,   f o r   P L o a d ( t ) P g e n ( t ) 1 ,   f o r   P L o a d ( t ) > P g e n ( t )
T: Total study period (24 h)
Pload: Load power at (t)
Pgen: Generation power at (t)

4.2. Expected Energy Not Supplied (EENS)

EENS shows the quantity of energy that the system is expected to fail to supply for a particular duration of time [30].
E E N S = t = 0 N T ( C ( t ) L ( t ) ) × φ ( t ) d t           MWh / day
where:
φ ( t ) = 0 ,   f o r   P L o a d ( t ) P g e n ( t ) 1 ,   f o r   P L o a d ( t ) > P g e n ( t )
C(t) is the generation capacity in MW.
L(t) is the load consumption in MW.
NT is the total duration.
The bounded area between the generation capacity and load profile, shown in Figure 8a, represents the system’s EENS, indicating that the load profile exceeds the generation capacity. When there is no bounded area and the generation is above the load curve, this is a reserve situation (as shown in Figure 8b). Due to numerical data (points instead of continuous analog equations), the integrations are performed numerically by the trapezoidal numerical integration method via MATLAB’s software’s function “trapz”.

4.3. Reliability Assessment of Saudi Arabia

This section highlights reliability calculations regarding the total generation, load, and estimated EVs, assuming that the total grid generation supplies the total load (EVs + Load).
The simulation and reliability calculations are applied to the following:
  • Case 1.1: Saudi Arabia’s generation capacity is equal to Value (1), with the estimated load profile of 2030 in addition to the estimated EV profile of 2030 with a penetration percentage ranging from 10% to 100%.
  • Case 1.2: Saudi Arabia’s generation capacity is equal to Value (2), with the estimated load profile of 2030 in addition to the estimated EV profile of 2030 with a penetration percentage ranging from 10% to 100%.
The data are applied along with the assumptions made to obtain the reliability indices below:
-
Case 1.1:
Figure 9. Case 1.1—Generation capacity, load profile, and EV penetration levels.
Energies 16 04579 g009
Table 4. Case 1.1—Reliability indices, EENS, and LOLP for each level.
EV Penetration
(%)
Hours Load Exceeds Generation
(h)
LOLP
(%)
EENS
(GWh/day)
10%00%0.0000
20%00%0.0000
30%00%0.0000
40%00%0.0000
50%00%0.0000
60%14%2.2604
70%14%5.6898
80%28%10.2242
90%521%21.3528
100%1146%35.8946
-
Case 1.2:
Figure 10. Case 1.2—Generation capacity, load profile, and EV penetration levels.
Energies 16 04579 g010
Table 5. Case 1.2—Reliability indices, EENS, and LOLP for each level.
EV Penetration
(%)
Hours Load Exceeds Generation
(h)
LOLP
(%)
EENS
(GWh/day)
10%00%0.0000
20%00%0.0000
30%00%0.0000
40%28%5.7850
50%313%10.7132
60%833%21.3638
70%1146%38.4002
80%1146%56.3675
90%1146%74.3348
100%1250%92.5010
Observations:
  • Figure 9 and Table 4 for Case 1.1 show that the involvement of electric vehicles will affect Saudi Arabia’s estimated generation capacity in 2030. The obvious effect will start from a penetration percentage of 60%, with the expectation of energy that cannot be supplied (EENS) by the generation system being equal to 2.2604 GWh per day. When 100% is reached, the EENS will equal 35.8946 GWh daily.
  • Case 1.1 represents the best-case scenario, as the generation capacity is lowered in Case 1.2. It can be noted from Figure 10 and Table 5 that the obvious effect will start at 40%, with EENS equal to 5.785 GWh per day.
  • Although the generation levels are not included in the simulation and the overall study, it can be noted that the effect of EVs reaches the maximum generation capacity. Hence, the other generation levels will be affected too.
  • The EENS values mentioned in the tables of this section are not necessarily for the entire year. During the summer, the likelihood of reaching the EENS value mentioned is higher, especially during the peak or near peak days. Considering the loss of load probability, the values in the tables have a higher probability of occurring during the summer and the peak days.

4.4. Reliability Assessment of the Central Region

Using the same approach as the previous section, the simulation is applied to the central region (that supplies Riyadh City). As well, the EV penetration percentage in Riyadh City is considered.
The simulation and reliability calculations are applied to the following:
  • Case 2.1: The central region’s generation capacity is equal to Value (3), with the estimated load profile in 2030 in addition to the estimated EV profile in 2030 with a penetration percentage ranging from 10% to 100%.
  • Case 2.2: The central region’s generation capacity is equal to Value (4), with the estimated load profile in 2030 in addition to the estimated EV profile in 2030 with a penetration percentage ranging from 10% to 100%.
The data are applied, along with the assumption, to obtain the reliability indices below:
-
Case 2.1:
Figure 11. Case 2.1—Generation capacity, load profile, and EV penetration levels.
Energies 16 04579 g011
Table 6. Case 2.1—Reliability indices, EENS, and LOLP for each level.
EV Penetration
(%)
Hours Load Exceeds Generation
(h)
LOLP
(%)
EENS
(GWh/day)
10%625%6.6434
20%729%9.3701
30%1146%13.1419
40%1354%17.5340
50%1354%22.0656
60%1354%26.5973
70%1458%31.3243
80%1458%35.9880
90%1458%40.6517
100%1563%45.4468
-
Case 2.2:
Figure 12. Case 2.2—Generation capacity, load profile, and EV penetration levels.
Energies 16 04579 g012
Table 7. Case 2.2—Reliability indices, EENS, and LOLP for each level.
EV Penetration
(%)
Hours Load Exceeds Generation
(h)
LOLP
(%)
EENS
(GWh/day)
10%1563%21.7408
20%1667%26.5422
30%1771%31.3833
40%1771%36.3312
50%1875%41.2833
60%1875%46.3323
70%1875%51.3813
80%1875%56.4302
90%1875%61.4792
100%1875%66.5282
Observations:
  • According to the data provided in Table 2 and Table 3, the peak load for the central region exceeded the generation capacity without EVs. Hence, the expectation is that the estimated generation infrastructure for 2030 can also not supply the EVs.
  • Figure 11 and Table 6 for Case 2.1 show that the central region’s estimated generation capacity in 2030 will be more affected by the involvement of electric vehicles from Riyadh City. The obvious effect will start from a penetration percentage of 10%, with an expectation of energy that the generation system cannot supply (EENS)—equal to 6.6434 GWh per day. When 100% is reached, the EENS will equal 45.4468 GWh daily.
  • Case 2.1 represents the best-case scenario, as the generation capacity is lowered in Case 2.2. It can be noted from Figure 12 and Table 7 that the EENS for a 10% penetration level is equal to 21.7408 GWh per day. This is more than triple the value in Case 2.1, considering the loss of load probability (LOLP), which is double the value of Case 2.1. Additionally, 100% penetration yields an EENS of 66.5282 GWh daily, with the LOLP equal to 75%.
  • With 30% of the total vehicles in Riyadh City being EVs by 2030, the EENS will be 13.1419 GWh/day for Case 2.1; this is the best-case scenario. In Case 2.2, EENS will increase to become 31.3833 GWh/day. The LOLP values are 46% and 71% for Case 2.1 and Case 2.2, respectively. This means that the central region’s generation system will have a high probability (over 50%) of being unable to supply its dedicated load. The EENS and LOLP values are likely shown during the summer, near peak, or peak periods. During other periods, these values could be lower as the conventional load is reduced; this provides room for the EV profile. Thus, the Vision 2030 sustainability section stating that 30% of Riyadh’s total vehicles will be EVs is a very challenging item that should be addressed to overcome the obstacles and the threat of having a poor reliability system for the central region.
  • Figure 13 shows EENS behavior curves for all cases considering all penetration levels; with increasing the penetration percentage, the EENS increases. Cases 2.1 and 2.2 show linear EENS behavior, with respect to the penetration percentage; while Cases 1.1 and 1.2 show almost exponential behavior, with respect to penetration percentage.

5. Sensitivity Analysis

This additional section simulates cases 1.1, 1.2, 2.1, and 2.2 with an incremental process instead of a penetration percentage. This methodology is more appropriate to obtain a vision of the EV integration impact on the generation system. The penetration percentage method requires knowledge of the total number of vehicles to determine the penetration levels. If the estimated number of vehicles was not precise, the results would be affected, as the penetration levels are percentages of the estimated total value of the vehicles. While for the incremental process, the start value is determined then gradual increments (steps) are added and simulated until the end value is reached. This process will provide tabulated EENS values for many cases to support the decision to consider EV numbers based on the available generation capacity.

5.1. Saudi Arabia Sensitivity Analysis

The start value and the incremental value is 0.5 million EVs. The estimated value in the year 2030 is approximated to the nearest half million; 20.8 million EVs is the end value.
These yield the following:
-
Case 1.1:
Figure 14. Case 1.1—Generation capacity, load profile, and EV increments.
Energies 16 04579 g014
Table 8. Case 1.1—Reliability indices, EENS, and LOLP for each increment.
EV Penetration
(%)
Hours Load Exceeds Generation
(h)
LOLP
(%)
EENS
(GWh/day)
0.500%0
100%0
1.500%0
200%0
2.500%0
300%0
3.500%0
400%0
4.500%0
500%0
5.500%0
600%0
6.500%0
700%0
7.500%0
800%0
8.500%0
900%0
9.500%0
1000%0
10.500%0
1100%0
11.500%0
1200%0
12.500%0
1314%3.1177
13.514%3.9421
1428%4.1464
14.528%5.2975
1528%6.4486
15.528%7.5997
1628%8.7508
16.5313%10.4588
17521%10.8001
17.5521%13.5873
18625%16.2274
18.5729%18.9812
19833%21.4522
19.5833%25.0853
201146%28.9841
20.51146%33.3032
20.81146%35.8946
-
Case 1.2:
Figure 15. Case 1.2—Generation capacity, load profile, and EV increments.
Energies 16 04579 g015
Table 9. Case 1.2—Reliability indices, EENS, and LOLP for each increment.
EV Penetration
(%)
Hours Load Exceeds Generation
(h)
LOLP
(%)
EENS
(GWh/day)
0.500%0
100%0
1.500%0
200%0
2.500%0
300%0
3.500%0
400%0
4.500%0
500%0
5.500%0
600%0
6.500%0
714%3.0351
7.528%3.8972
828%5.0483
8.528%6.1994
928%7.3505
9.528%8.5015
1028%9.6526
10.5313%10.9932
11313%12.3935
11.5521%15.0071
12729%17.9155
12.5833%21.5133
131042%25.2227
13.51042%29.3259
141146%33.5629
14.51146%37.8819
151146%42.2010
15.51146%46.5200
161146%50.8391
16.51146%55.1582
171146%59.4772
17.51146%63.7963
181146%68.1154
18.51146%72.4344
191146%76.7535
19.51146%81.0726
201146%85.3916
20.51250%89.8151
20.81250%92.5010

5.2. Central Region Sensitivity Analysis

The start value and the incremental value will be 0.2 million EVs. The estimated value in 2030 is approximated to the nearest half million; the end value is 5 million EVs.
These yield the following:
-
Case 2.1:
Figure 16. Case 2.1—Generation capacity, load profile, and EV increments.
Energies 16 04579 g016
Table 10. Case 2.1—Reliability indices, EENS, and LOLP for each increment.
EV Penetration
(%)
Hours Load Exceeds Generation
(h)
LOLP
(%)
EENS
(GWh/day)
0.2521%5.0645
0.4625%6.1356
0.6625%7.1385
0.8625%8.1413
1729%9.3552
1.21042%10.7614
1.41042%12.2703
1.61146%13.9613
1.81250%15.6908
21250%17.4815
2.21354%19.2955
2.41354%21.1034
2.61354%22.9114
2.81354%24.7194
31458%26.5887
3.21458%28.4493
3.41458%30.3099
3.61458%32.1706
3.81458%34.0312
41458%35.8919
4.21458%37.7525
4.41458%39.6132
4.61563%41.4738
4.81563%43.3977
51563%45.3223
-
Case 2.2:
Figure 17. Case 2.2—Generation capacity, load profile, and EV increments.
Energies 16 04579 g017
Table 11. Case 2.2—Reliability indices, EENS, and LOLP for each increment.
EV Penetration
(%)
Hours Load Exceeds Generation
(h)
LOLP
(%)
EENS
(GWh/day)
0.21458%18.9685
0.41458%20.7808
0.61667%22.6599
0.81667%24.5889
11667%26.5179
1.21667%28.4469
1.41667%30.3759
1.61771%32.3327
1.81771%34.3067
21771%36.2807
2.21771%38.2547
2.41771%40.2288
2.61875%42.2260
2.81875%44.2403
31875%46.2547
3.21875%48.2690
3.41875%50.2834
3.61875%52.2977
3.81875%54.3121
41875%56.3264
4.21875%58.3408
4.41875%60.3551
4.61875%62.3695
4.81875%64.3839
51875%66.3982
Observations:
  • Regardless of the number of vehicles in use in Saudi Arabia or the central region, Table 8, Table 9, Table 10 and Table 11 along with Figure 14, Figure 15, Figure 16 and Figure 17 considered increments that account for the most probable values of vehicles to be EVs. This is a better consideration than estimating one value and assuming its penetration percentages.
  • The observations are similar to those in Section 4. In addition, it can be noted from Figure 16 and Figure 17 and Table 10 and Table 11 that the central region cannot handle the growth of EVs in Riyadh City without severe effects on its reliability, even for the least number of EVs studied (0.2 million EVs).
  • Alternatively, Table 10 and Table 11 can be read as the number of EVs in any city, not just Riyadh City, supplied by the central region. Hence, this can generalize the study further regarding the central region and Saudi Arabia according to Table 8 and Table 9.
  • Figure 18 shows EENS behavior curves for all cases considering all increments. With increasing the penetration percentage, the EENS increases. Cases 2.1 and 2.2 show linear EENS behavior concerning the EVs’ number, while Cases 1.1 and 1.2 show almost exponential behavior, with respect to the EVs’ number.

6. Conclusions

Regarding Saudi Arabia’s generation capacity, the simulation has shown that the estimated capacity for 2030 from a reliability perspective will not handle the growth of electric vehicles without a heavy negative impact. The generation infrastructure should be increased incrementally to accommodate the load demand. The central region’s historical, current, and estimated generation system cannot cover the peak load without EVs. The simulated cases for the central region, including EVs in Riyadh City, showed that the estimated generation capacity values by 2030 cannot cover the peak load along with the EVs’ load. Thus, recommended investments should be considered in line with Saudi Vision 2030. The recommendation is to either increase the infrastructure rapidly so that the margin between the peak and the maximum generation capacity will be more than what has been recorded over the last 20 years, or to enhance the integration links of Saudi Arabia’s grids. The simulation results showed that the entire generation capacity is sufficient with normal growth, as per the estimation, until 2030.
In summary, Saudi Arabia’s electrical network should implement enhancement projects that increase its generation-peak margin higher than the maximum recorded in the historical data (9 GW). The central region requires more enhancement projects at a faster pace to accommodate the target number of EVs in Vision 2030. Riyadh City, fed from the central region, is also undergoing many mega projects. Its population growth is increasing rapidly due to the relocation of many businesses, according to Vision 2030 [5]. These businesses will severely challenge the reliability of the electrical network system of the central region. Interestingly, in February 2023, [37] mentioned that Saudi Arabia is progressing to increase its generation capacity by adding more generation plants, especially in the central region [37]. Furthermore, in the same period, the Saudi Electricity Company (SEC) signed agreements to fund the electricity network to enhance the reliability of electricity in Saudi Arabia [38].

Author Contributions

Conceptualization, W.S. and H.A.A.; methodology, W.S.; software, W.S.; validation, W.S. and H.A.A.; formal analysis, W.S.; investigation, W.S.; resources, W.S.; data curation, W.S.; writing—original draft preparation, W.S.; writing—review and editing, H.A.A.; visualization, W.S.; supervision, H.A.A. All authors have read and agreed to the published version of the manuscript.

Funding

This research received only funding by the Deanship of Scientific Research at Umm Al-Qura University Grant Code: (23UQU44380238DSR001).

Data Availability Statement

Data are contained within the article.

Acknowledgments

The authors would like to thank the Deanship of Scientific Research at Umm Al-Qura University for supporting this work by Grant Code: (23UQU44380238DSR001).

Conflicts of Interest

The authors declare no conflict of interest.

References

  1. CO2 Emissions from Cars: Facts and Figures (Infographics): News: European Parliament. 15 June 2022. Available online: https://www.europarl.europa.eu/news/en/headlines/society/20190313STO31218/co2-emissions-from-cars-facts-and-figures-infographics (accessed on 11 January 2023).
  2. Electric and Plug-in Hybrid Vehicle Roadmap—Microsoft. Available online: https://iea.blob.core.windows.net/assets/91a4a053-8738-4bf2-895e-f4213a4a1253/EV_PHEV_brochure.pdf (accessed on 21 January 2023).
  3. IEA. Electric Cars Fend off Supply Challenges to More Than Double Global Sales—Analysis. Available online: https://www.iea.org/commentaries/electric-cars-fend-off-supply-challenges-to-more-than-double-global-sales (accessed on 21 January 2023).
  4. Dua, R. Estimating the Size and Efficiency of the Saudi Vehicle Fleet; KS-2020-C020; KAPSARC: Riyadh, Saudi Arabia, 2020. [Google Scholar]
  5. Homepage: The Progress & Achievements of Saudi Arabia. Vision 2030. Available online: https://www.vision2030.gov.sa/ (accessed on 21 January 2023).
  6. Nereim, V. Saudi Arabia to Start Electric-Vehicle Push in Capital Riyadh. Bloomberg.com. 23 October 2021. Available online: https://www.bloomberg.com/news/articles/2021-10-23/saudi-arabia-to-start-electric-vehicle-push-in-capital-riyadh?leadSource=uverify+wall (accessed on 18 January 2023).
  7. Emissions from Electric Vehicles. Alternative Fuels Data Center: Emissions from Electric Vehicles. Available online: https://afdc.energy.gov/vehicles/electric_emissions.html (accessed on 21 January 2023).
  8. The First Saudi Electric Vehicle Brand. Ceer. 12 January 2023. Available online: https://ceermotors.com/ (accessed on 21 January 2023).
  9. Wu, D. Foxconn Partners with Saudi Wealth Fund to Build Electric Cars. Bloomberg.com. 3 November 2022. Available online: https://www.bloomberg.com/news/articles/2022-11-03/foxconn-partners-with-saudi-wealth-fund-to-build-electric-cars?leadSource=uverify+wall (accessed on 21 January 2023).
  10. Xu, N.Z.; Chung, C.Y. Challenges in future competition of electric vehicle charging management and solutions. IEEE Trans. Smart Grid 2015, 6, 1323–1331. [Google Scholar] [CrossRef]
  11. Galus, M.D.; Vayá, M.G.; Krause, T.; Andersson, G. The role of electric vehicles in smart grids. Wiley Interdiscip. Rev. Energy Environ. 2013, 2, 384–400. [Google Scholar] [CrossRef]
  12. Richardson, D.B. Electric vehicles and the electric grid: A review of modeling approaches, impacts, and renewable energy integration. Renew. Sustain. Energy Rev. 2013, 19, 247–254. [Google Scholar] [CrossRef]
  13. Rahman, S.; Shrestha, G.B. An investigation into the impact of electric vehicle load on the electric utility distribution system. IEEE Trans. Power Deliv. 1993, 8, 591–597. [Google Scholar] [CrossRef]
  14. Pillai, J.R.; Bak-Jensen, B. Impacts of electric vehicle loads on power distribution systems. In Proceedings of the 2010 IEEE Vehicle Power and Propulsion Conference, Lille, France, 1–3 September 2010. [Google Scholar]
  15. Khalid, M.R.; Alam, M.S.; Sarwar, A.; Jamil Asghar, M.S. A comprehensive review on electric vehicles charging infrastructures and their impacts on power-quality of the utility grid. eTransportation 2019, 1, 100006. [Google Scholar] [CrossRef]
  16. Wang, B.; Dehghanian, P.; Wang, S.; Mitolo, M. Electrical safety considerations in large-scale electric vehicle charging stations. IEEE Trans. Ind. Appl. 2019, 55, 6603–6612. [Google Scholar] [CrossRef]
  17. Deb, S.; Kalita, K.; Mahanta, P. Impact of electric vehicle charging stations on reliability of distribution network. In Proceedings of the 2017 International Conference on Technological Advancements in Power and Energy (TAP Energy), Kollam, India, 21–23 December 2017; pp. 1–6. [Google Scholar] [CrossRef]
  18. Pantos, M. Exploitation of electric-drive vehicles in electricity markets. IEEE Trans. Power Syst. 2012, 27, 682–694. [Google Scholar] [CrossRef]
  19. Vagropoulos, S.I.; Bakirtzis, A.G. Optimal bidding strategy for electric vehicle aggregators in electricity markets. IEEE Trans. Power Syst. 2013, 28, 4031–4041. [Google Scholar] [CrossRef]
  20. Neaimeh, M.; Wardle, R.; Jenkins, A.M.; Yi, J.; Hill, G.; Lyons, P.F.; Hübner, Y.P.; Blythe, T.; Taylor, P.C. A probabilistic approach to combining smart meter and electric vehicle charging data to investigate distribution network impacts. Appl. Energy 2015, 157, 688–698. [Google Scholar] [CrossRef] [Green Version]
  21. Olivella-Rosell, P.; Villafafila-Robles, R.; Sumper, A.; Bergas-Jané, J. Probabilistic agent-based model of electric vehicle charging demand to analyse the impact on distribution networks. Energies 2015, 8, 4160–4187. [Google Scholar] [CrossRef] [Green Version]
  22. Xydas, S.; Marmaras, C.; Cipcigan, L.; Hassan, A.; Jenkins, N. Electric vehicle load forecasting using data mining methods. In Proceedings of the Hybrid and Electric Vehicles Conference (HEVC 2013), London, UK, 6–7 November 2013; Institution of Engineering and Technology: London, UK, 2013. [Google Scholar]
  23. Jiang, H.; Ren, H.; Sun, C.; Watts, D. The temporal-spatial stochastic model of plug-in hybrid electric vehicles. In Proceedings of the 2017 IEEE PES Innovative Smart Grid Technologies Conference Europe (ISGT-Europe), Torino, Italy, 26–29 September 2017; pp. 1–6. [Google Scholar]
  24. Zhu, J.; Yang, Z.; Guo, Y.; Zhang, J.; Yang, H. Short-term load forecasting for electric vehicle charging stations based on deep learning approaches. Appl. Sci. 2019, 9, 1723. [Google Scholar] [CrossRef] [Green Version]
  25. Liang, H.; Sharma, I.; Zhuang, W.; Bhattacharya, K. Plug-in electric vehicle charging demand estimation based on queueing network analysis. In Proceedings of the 2014 IEEE PES General Meeting|Conference & Exposition, National Harbor, MD, USA, 27–31 July 2014; pp. 1–5. [Google Scholar]
  26. Li, J.; Klee Barillas, J.; Guenther, C.; Danzer, M.A. A comparative study of state of charge estimation algorithms for LiFePO4 batteries used in electric vehicles. J. Power Sources 2013, 230, 244–250. [Google Scholar] [CrossRef]
  27. Falahati, B.; Fu, Y.; Darabi, Z.; Wu, L. Reliability assessment of power systems considering the large-scale PHEV integration. In Proceedings of the 2011 IEEE Vehicle Power and Propulsion Conference, Chicago, IL, USA, 6–9 September 2011; pp. 1–6. [Google Scholar] [CrossRef]
  28. Almutairi, A.; Alyami, S. Load profile modeling of plug-in electric vehicles: Realistic and ready-to-use benchmark test data. IEEE Access 2021, 9, 59637–59648. [Google Scholar] [CrossRef]
  29. Almutairi, A. Plug-in electric vehicles and their impact on power generation availability: A real survey-based analysis in Saudi Arabia. Sustain. Cities Soc. 2021, 75, 103389. [Google Scholar] [CrossRef]
  30. Billinton, R.; Allan, R.N. Reliability Evaluation of Power Systems; Plenum Press: New York, NY, USA, 1984. [Google Scholar]
  31. Electrical Energy Statistics 2020. General Authority for Statistics. 24 November 2022. Available online: https://www.stats.gov.sa/en (accessed on 3 January 2023).
  32. Saudi Arabia Electricity Installed Capacity (Peak Load) by Region for 2004–2019. Wera.gov.sa. Available online: https://wera.gov.sa/Statistics/NRList (accessed on 3 January 2023).
  33. Rahman, A.; Ashraf, I.; Alsharari, H.D. HVDC system for national and cross border grid interconnections in Saudi Arabia. IOSR J. Eng. 2012, 2, 529–537. [Google Scholar] [CrossRef]
  34. SAE Electric Vehicle and Plug in Hybrid Electric Vehicle Conductive Charge Coupler. SAE MOBILUS. Available online: https://saemobilus.sae.org/content/J1772_201710/#datasets (accessed on 8 January 2023).
  35. Al Harbi, F.; Csala, D. Saudi Arabia’s electricity: Energy supply and demand future challenges. In Proceedings of the 2019 1st Global Power, Energy and Communication Conference (GPECOM), Nevsehir, Turkey, 12–15 June 2019; pp. 467–472. [Google Scholar] [CrossRef] [Green Version]
  36. Statistics Authority: 3.3 Million Saudi Families Own Cars, 65% of Which Own One Car. Argaam. 14 February 2018. Available online: https://www.argaam.com/ar/article/articledetail/id/530080 (accessed on 22 February 2023).
  37. Minister of Energy Decision No. (2205/440201) Dated 29 June 1444 AH. Umm Al Qura Newspaper. 17 February 2023. Available online: https://uqn.gov.sa/?p=22079 (accessed on 22 February 2023).
  38. Economist/Saudi Electricity Signs a Joint Financing Agreement Worth 10 Billion Riyals with Nine Local Banks. Saudi Press Agency. Available online: https://www.spa.gov.sa/viewstory.php?lang=ar&newsid=2426238 (accessed on 22 February 2023).
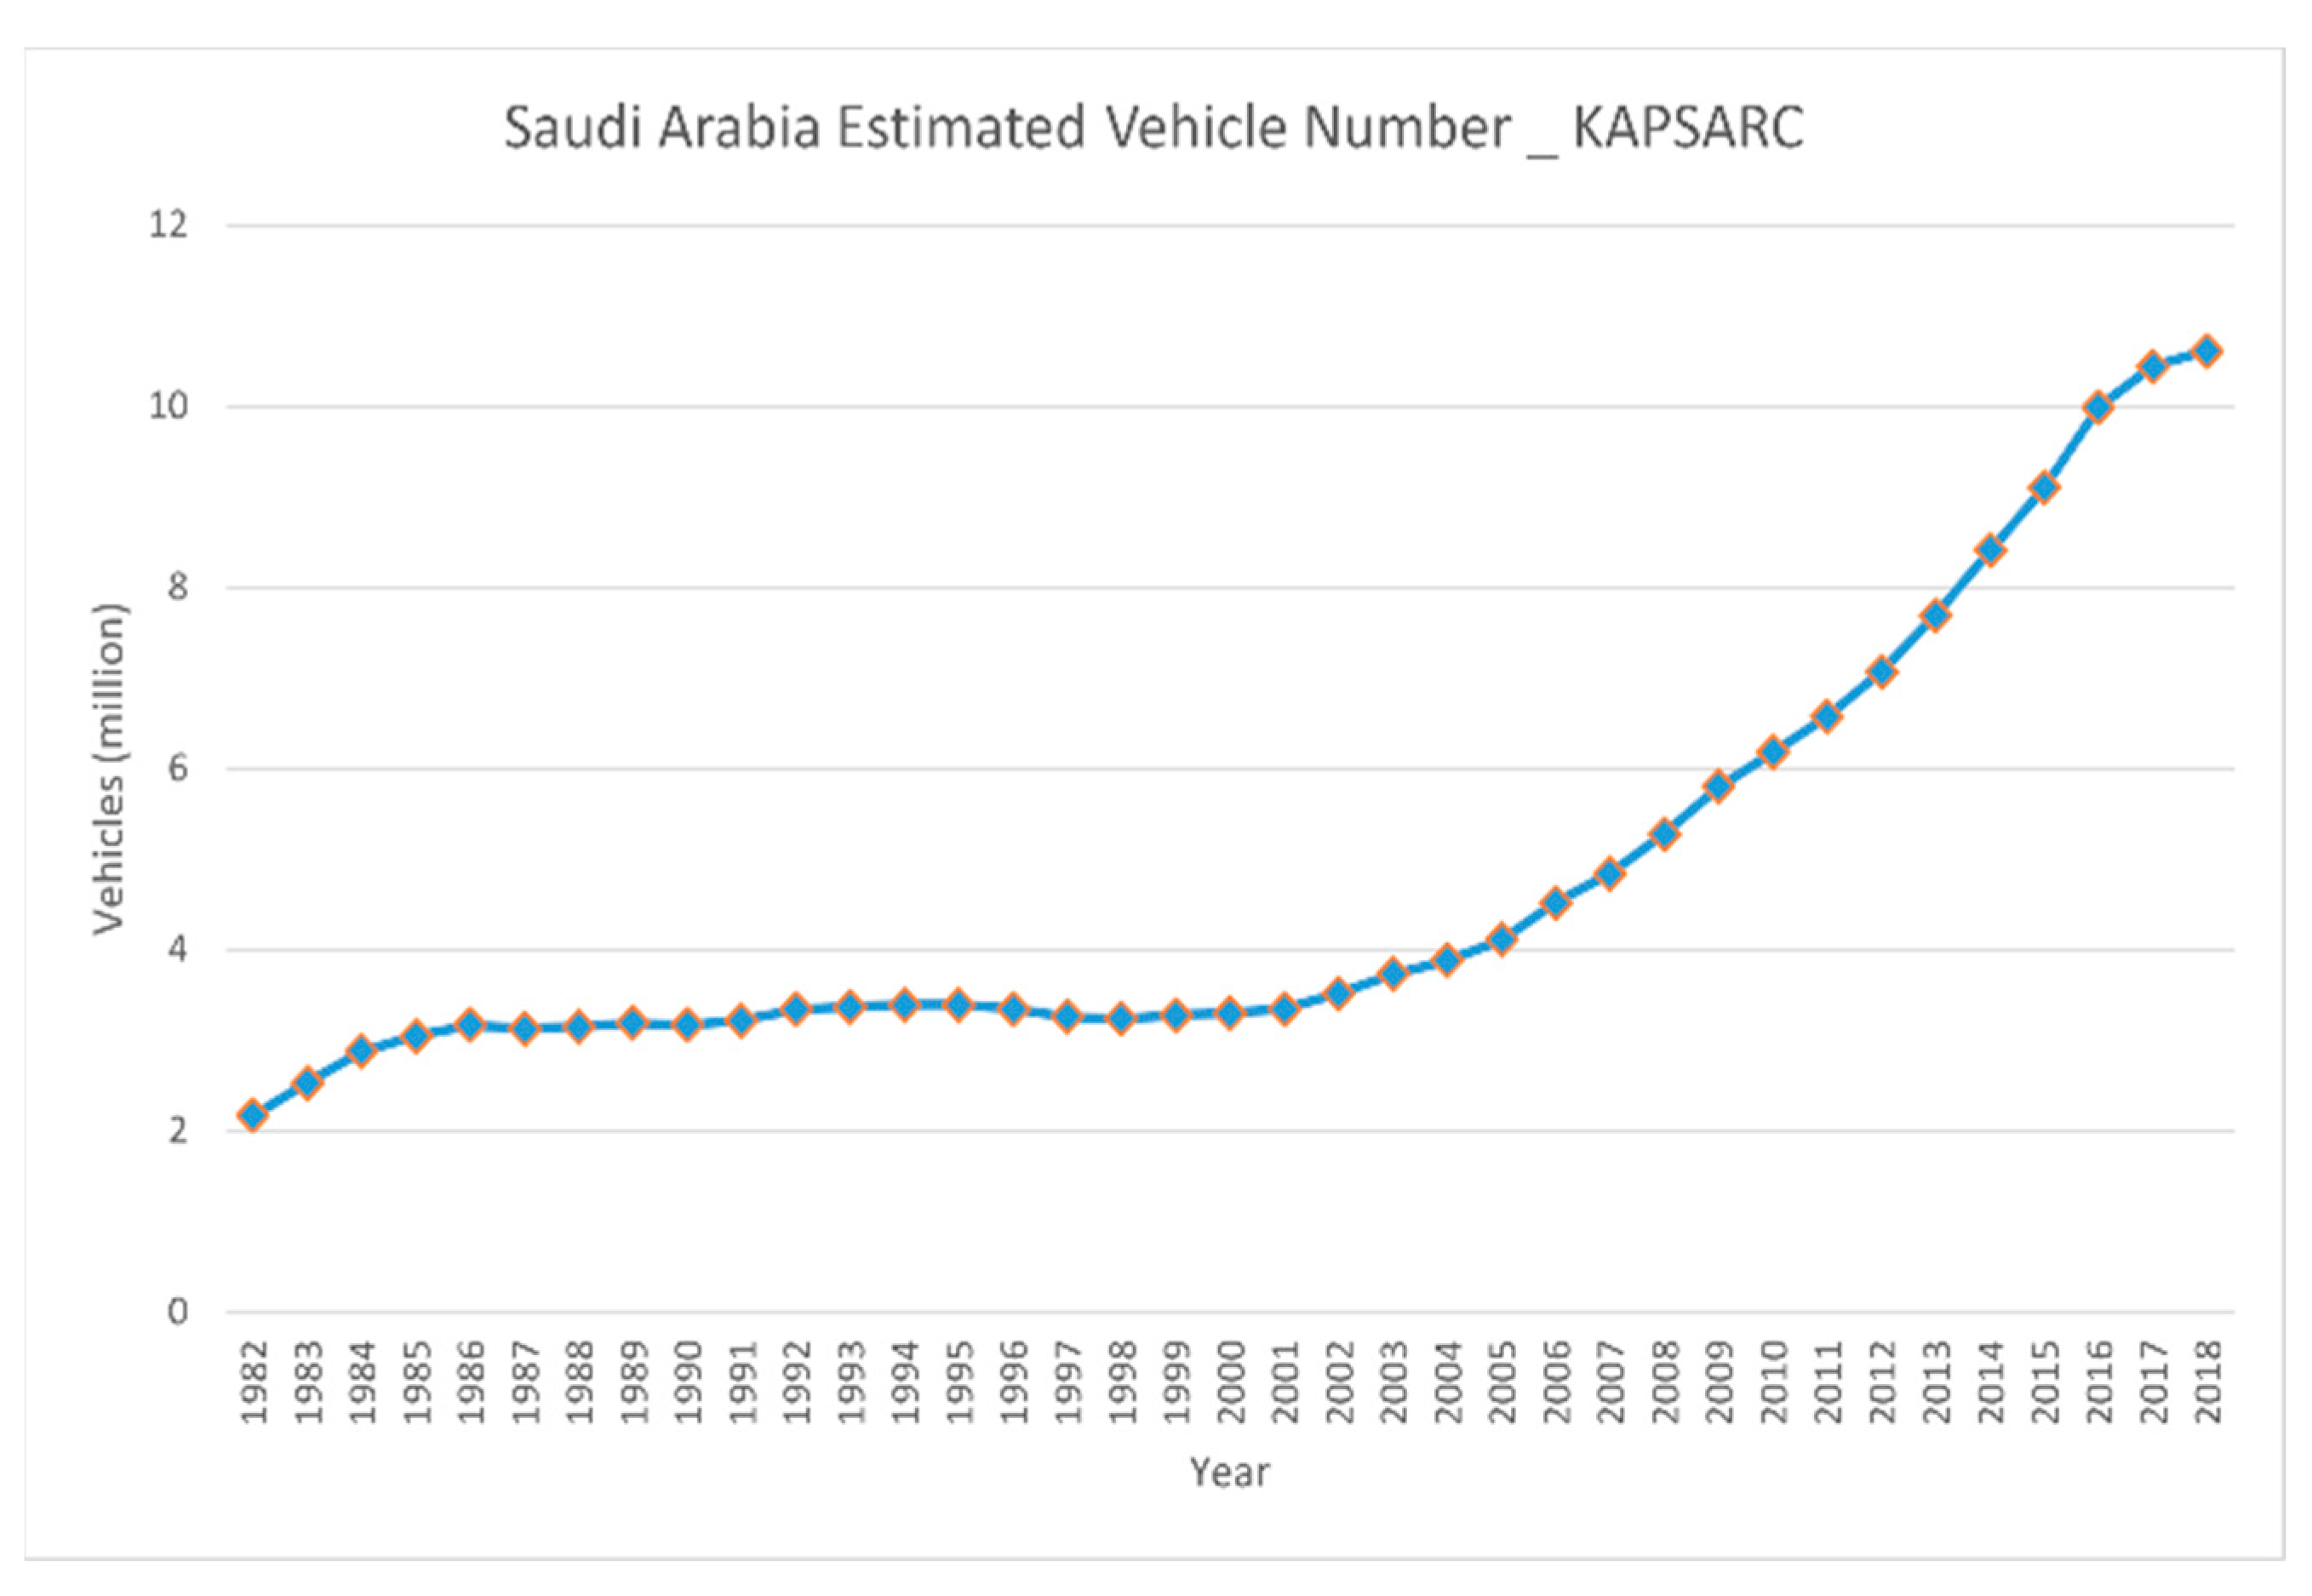
Figure 1. Estimated vehicles in use in Saudi Arabia [4].
Energies 16 04579 g001
Figure 2. EVs’ charging profile (10 million EVs).
Energies 16 04579 g002
Figure 3. Typical day load profiles for Saudi Arabia (2020).
Energies 16 04579 g003
Figure 4. Example of EVs’ charging behavior (five vehicles shown) for a 7 kW charger.
Energies 16 04579 g004
Figure 7. Estimated vehicle growth in Saudi Arabia.
Energies 16 04579 g007
Figure 8. (a) EENS situation (shaded area); (b) reserve situation (shaded area).
Energies 16 04579 g008
Figure 13. EENS vs. penetration percentage for all cases.
Energies 16 04579 g013
Figure 18. EENS vs. increments for all cases.
Energies 16 04579 g018
Table 1. Generation capacity per year [31].
YearSaudi Arabia Generation Capacity
(GW)
Central Region Generation Capacity (GW)
200737.0008.113
200839.00010.039
200944.00010.118
201049.00012.326
201151.00013.008
201254.00014.246
201358.00016.122
201466.00014.382
201569.00017.700
201668.60018.600
201769.90018.900
201868.80016.500
201963.70016.500
202064.80017.000
Table 2. Peak load per year [32].
YearSaudi Arabia Peak Load
(GW)
Central Region Peak Load
(GW)
200735.00010.827
200838.00011.625
200941.00012.728
201046.00014.327
201148.00014.792
201252.00016.236
201354.00017.346
201457.00018.094
201562.00019.999
201660.82819.723
201761.74320.232
201861.74319.869
201962.07620.179
202062.26621.199
Table 3. SAE J1772 charging levels [34].
LevelAC Voltage
(V)
PhaseMaximum Current
(A)
Maximum Power
(kW)
AC level 1120 V ACSingle12 or 161.2–1.8
AC level 2200 V–240 VSingle24–803.6–22
Disclaimer/Publisher’s Note: The statements, opinions and data contained in all publications are solely those of the individual author(s) and contributor(s) and not of MDPI and/or the editor(s). MDPI and/or the editor(s) disclaim responsibility for any injury to people or property resulting from any ideas, methods, instructions or products referred to in the content.