Abstract
A capacitive voltage transformer (CVT) is one of the electrical quantities measurement devices, and the state of its internal insulation is the key factor for ensuring the accuracy of its measurement of electrical energy. In view of the fact that the traditional real-time evaluation method of a CVT internal insulation anomaly mainly relies on empirical rules and prior knowledge and lacks the ability to independently mine effective features, an online evaluation method of a CVT internal insulation anomaly based on self-supervised learning is proposed. Firstly, an autoencoder is constructed to extract the residual sequence of the CVT secondary voltage and eliminate the influence of primary voltage fluctuation and power system voltage regulation. Without any prior knowledge, the complex dependence of the residual sequences in time and feature dimensions is learned by using a parallel graph attention layer (GATv2). Finally, a joint optimization based on the prediction and reconstruction model is introduced to obtain the abnormal inference score at each timestamp and realize the evaluation of the CVT internal insulation status. Experimental analysis shows that this method can effectively eliminate the influence of primary voltage fluctuation and power system voltage regulation on the online evaluation of the CVT internal insulation status and independently excavate the abnormal characteristics of the CVT secondary voltage to realize real-time monitoring and early warning of the CVT internal insulation status.
1. Introduction
A capacitive voltage transformer (CVT) is a kind of electrical quantities measurement equipment [1], which can provide accurate voltage signals for meters, relay protection and other devices [2]. Capacitive voltage transformers have the advantages of simple structure, small size, light weight, good insulation performance, wide frequency response and good temperature stability, and are widely used in high-voltage power transmission and transformation systems [3]. In operation, a CVT converts primary high voltage into secondary low voltage for use by relay protection, automatic devices and measuring instruments to meet the needs of various secondary protections [4]. However, its capacitive voltage divider is affected by many factors during long-term operation, and its internal insulating material will gradually age, which can easily lead to a decline in insulation performance, and even mislead protection devices or measuring instruments, endangering the reliability of power grid operation. It is therefore necessary to detect the deterioration of the internal insulation of the CVT in real time. Traditional blackout detection methods evaluate by measuring parameters such as insulation resistance, dielectric loss angle and partial discharge of the CVT under blackout conditions [5]. However, the disadvantage of this method is that it is not only impossible to track the operating status of the CVT in adjacent detection cycles, but also that each high-voltage bus connected to the CVT must be operating in a non-fault power outage during detection [6]. This affects the reliability of the power supply, the detection process is heavy and there are safety risks [7].
In response to the various problems faced by offline detection during power failures, the detection of the internal insulation status of the CVT has gradually become the main research trend from offline detection to real-time online evaluation. The literature [8,9] proposes a high-precision online calibration system that is connected to the high-voltage bus. By comparing the output voltage of the calibration system and the CVT, it can monitor changes in ECT errors. The literature [10] uses pieces of infrared temperature measurement technology to measure and analyze abnormal heating on the secondary side of the CVT and detect its potential internal faults. However, the methods in the literature [8,9,10] require the installation of additional equipment. The reliability of their detection is greatly affected by external environmental factors. At the same time, the additional magnetic field generated can affect the measurement accuracy of the CVT. The installation of equipment on the high-voltage busbar also increases additional safety risks.
How to solve the problem of installing additional equipment while accurately real-time monitoring the internal insulation status of the CVT has become a new problem to be solved. The literature [11] monitors and analyzes changes in the secondary voltage of the CVT to sense an early abnormal internal insulation status of the CVT in advance, but this method relies on the rich experience of professionals to analyze it. The literature [12] compares the actual voltage input of the power grid with the output of the prediction model to evaluate the health status of the CVT. However, this method does not take into account the impact of the CVT secondary measurement voltage offset caused by the CVT primary voltage fluctuations. The literature [13] reduces the condition assessment problem to a feature classification problem and uses machine learning algorithms, such as support vector machines, to achieve a CVT insulation condition fault diagnosis, but the method requires a large number of negative samples to train the model. The literature [14,15] estimates the measurement error by the analysis of multi-source heterogeneous data. The literature [16] proposes a supervised learning method for feature information analysis using principal component analysis and random forest to achieve the CVT internal insulation status evaluation. This method requires a large amount of abnormal data from the CVT to train models, and there are inevitably differences between simulated voltage fluctuations and real grid fluctuations, which limits the generalization ability of the models. The literature [17] separates the CVT secondary side voltage into a primary voltage component and residual component and achieves the evaluation of measurement error by evaluating the residual component. In recent years, deep learning methods for anomaly detection in various fields have been studied in depth, such as MTAD-GAT [18], TCN-AE [19], LATM-AE [20], USAD [21], TranAD [22] and GTAD [23], achieving good results in the field of anomaly detection.
Therefore, a CVT internal insulation abnormality online evaluation method based on self-supervised learning is proposed. This method is based on the redundant connection of CVT data of the same phase of the same bus in the substation [24] and extracts fault-enhanced features based on the autoencoding network [25] to maximize the elimination of the influence of primary voltage fluctuation and power system voltage regulation (such as changes in the transformer tap changer). The secondary voltage sequence of a single CVT is regarded as a separate feature, and two parallel improved graph attention layers (GATv2) [26] are used to learn the complex dependence of multivariate secondary voltage sequences in time and feature dimensions. A joint method based on feature prediction and reconstruction is used to optimize the model [18], and the abnormal inference score is obtained using prediction and reconstruction errors, which further eliminates the influence of primary voltage fluctuation and power system voltage regulation, thereby improving the abnormal detection performance. This method does not rely on prior knowledge and empirical rules, independently learns the effective features of CVT voltage data and has the advantages of adaptability and strong generalization ability.
2. Inner Relationship between CVT Internal Insulation and Measurement Error
2.1. CVT Transfer Characteristic
The CVT is mainly composed of a capacitive voltage divider and electromagnetic unit [27]. A schematic of a capacitive voltage transformer (CVT) and the equivalent model of the capacitive voltage transformer (CVT) are shown in Figure 1.
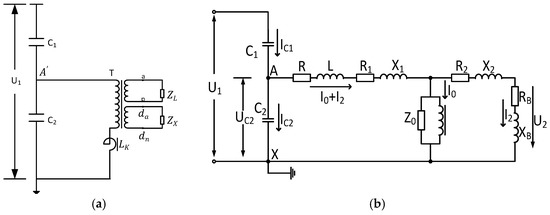
Figure 1.
(a) Schematic of a Capacitive Voltage Transformer (CVT); (b) Equivalent Model of Capacitive Voltage Transformer (CVT).
In Figure 1, represents the high-voltage capacitor, and represents the low-voltage capacitor. The transformation characteristic calculation formula is as follows:
where and are the no-load ratio difference and no-load phase difference, respectively, and are the load ratio difference and the load phase difference, respectively, and the calculation formulas of and are as follows:
In Equations (3) and (4), and are the voltage and current of the secondary load, respectively; and are the resistance and inductance of the tuned reactor; and are the resistance and leakage resistance of the primary winding after conversion to the secondary side, respectively; and are the high-voltage capacitance and voltage divider capacitance after conversion to the secondary side, respectively; and are the resistance and leakage resistance of the secondary winding; is the phase angle of the secondary load; and is the angular frequency.
According to Formulas (3) and (4), it can be seen that the secondary output value of the CVT is directly related to the intermediate voltage value, reactor impedance, capacitance size of and , power supply frequency, secondary load and electromagnetic unit impedance.
2.2. Influence of Insulation Performance on CVT Error
Theoretically, the failure of a capacitive voltage divider can be reflected by the deterioration in the CVT operation [27]. In actual operation, the failure of capacitive elements and will cause a step change in the CVT measurement error. To clarify the degree of influence of the capacitance change on the CVT measurement error, the relationship between the number of capacitor unit failures and the response of the CVT measurement error can be calculated. When a normal CVT is operating at its rated value, the capacitive voltage division ratio of the CVT can be calculated as:
In the formula, and are the numbers of capacitive elements and , respectively. According to the transmission characteristics of the CVT, when the breakdown elements of capacitors and are x and y, respectively, the degree of change in the secondary output voltage of the CVT is
The voltage of the substation will fluctuate with the change in the grid load, and the national standard stipulates that the voltage fluctuation is less than ±5% (under the most stringent conditions) [28]. Therefore, the secondary voltage value of the CVT under load will also change with the change in voltage fluctuation, resulting in changes in measurement values. In fact, the error of the CVT in operation is affected by many aspects, such as the insulation performance of the capacitor, the change in supply frequency, the change in temperature, the secondary load and the external electric field. For after the breakdown, the CVT ratio difference shifts to the positive direction, and the impact of one breakdown is +0.217%; for after the breakdown, the ratio difference shifts to the negative direction [29], and the impact of one breakdown is −3.959%. After superposition, it is 0.1% to 0.3%, and there are periodic changes (such as temperature and frequency) [30,31,32]; if the secondary voltage has a step error deviation, most of them have a CVT insulation performance (such as capacitance breakdown) that is abnormal [27]. Therefore, the insulation performance can be reflected indirectly by monitoring the change in the CVT secondary voltage.
3. Materials and Methods
The measured value of the CVT secondary voltage will change with the changes in voltage fluctuation in the power grid and voltage regulation in the power system. This may cause misjudgment and even hide the voltage data of abnormal insulation inside the CVT. To solve this problem, this paper introduces multivariate CVT voltage measurement data to distinguish between voltage fluctuation and measurement error caused by abnormal internal insulation status. If the change trend of all line CVT measurement values on the same bus is the same, it is considered that the change in measurement value is caused by grid voltage fluctuation or power system voltage regulation. On the contrary, it is a measurement error caused by an abnormal internal insulation status of the CVT.
3.1. Description of the Problem
Problem description: The CVT secondary voltage of all branches on the same bus in the same phase can be considered as multivariate time series data of multiple univariate time series. This represents a time-stamped CVT secondary voltage sequence of size T, where satisfies specific timestamps i and ; k represents the number of all branch CVTs on the same bus. For , we convert it to a sequence of multivariate time windows of size w, namely . The task of detecting abnormal insulation inside the CVT is to output an abnormal detection label , where indicates whether the voltage measurement data corresponding to the timestamp i are abnormal.
3.2. Data Preprocessing
In order to improve the convergence speed of the model, we perform max–min normalization on the voltage data and convert it into a time series window. We normalize the secondary voltage series as
where and are the minimum and maximum values in the training set of secondary voltage sequences; is a non-zero constant vector. For each missing data point at a timestamp, data points are filled from adjacent timestamps to ensure the completeness of the secondary voltage sequence in time.
After being processed by the autoencoder, in order to establish the inter-relationship of the secondary voltage residual sequence in time, a time series window of length w is established for the secondary voltage residual data point at timestamp i.
We convert the quadratic voltage residual input sequence V output from the autoencoder into a sliding time window sequence . In the neural network after the autoencoder layer, we do not directly use the quadratic voltage residual sequence as the model input, but use the sliding time window sequence W as the model input and use in the same mode as the training set as a test sequence. This method allows our model to use its local context rather than an independent vector to give data points [22].
3.3. AE-GATv2 Algorithm for Abnormal Detection of CVT Inner Insulation State
This paper extracts fault enhancement features of multivariate CVT output voltages based on autoencoder (AE) networks to eliminate the effects of primary voltage fluctuations and power system voltage regulation. The secondary voltage sequence of a single CVT is regarded as a separate feature. Two parallel graph attention layers (GATv2) are used to learn the complex dependencies of multi-element voltage sequences in time and feature dimensions. A model based on feature prediction and reconstruction is used for joint optimization to establish an AE-GATv2 model. A schematic diagram of the structure of the AE-GATv2 model is shown in Figure 2, and its workflow can be described in words as the following steps: (1) First, the preprocessed original data set is used to extract the residual sequence V using the AE layer; (2) the parallel GATv2 layers are used to capture the dependencies of the residual sequence in time and feature dimensions; (3) the features and time relationships from GATv2 and the residual sequence are input into a fully connected layer and then fed into a GRU to capture long-term sequence features; (4) and finally, the long-term sequence features are used as inputs to the reconstruction-based model and the prediction-based model to obtain the predicted value and reconstruction probability of anomaly detection and to calculate the possible anomaly score s for each timestamp.
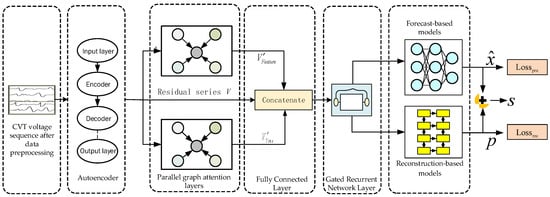
Figure 2.
Schematic diagram of the structure of the AE-GATv2 model.
3.3.1. Autoencoder
An autoencoder (AE) is an unsupervised learning model that can extract useful features from input data and use these features to reconstruct an output that approximates the original data.
This paper discusses an important application of autoencoders: extracting the residual sequence of multi-element CVT secondary voltage data [33], which represent the abnormal voltage features in the CVT secondary voltage sequence.
3.3.2. Graph Attention Network
GATv2 is an improved graph attention network (GAT) [34] that introduces an adaptive neighbor sampling strategy to reduce computational complexity and memory consumption. Specifically, in each graph attention layer of GATv2, a subset of neighbor nodes is dynamically selected for feature aggregation based on the importance of the nodes and the similarity of the neighbor nodes, thereby improving the efficiency and robustness of the model. GATv2 also uses a multi-scale feature fusion method to concatenate or average the outputs of different levels of graph attention layers to enhance the model’s expressiveness. It also adopts a residual connection and layer normalization structure to improve the stability and convergence speed of the model.
In this paper, the input of GATv2 is the time window of the multivariate CVT secondary voltage data residual sequence, where represents the vector of the CVT secondary voltage data residual sequence at timestamp i. GATv2 outputs a new set of node feature vectors that can represent the time window W of the residual sequence. The output of each node can be represented with Formula (10):
where represents the sigmoid activation function; represents the set of nodes adjacent to the node; represents the attention score that reflects the importance of adjacent nodes to node ; and is a learnable column vector.
3.3.3. Joint Optimization Model
The joint optimization model is jointly optimized by the forecast-based model and the reconstruction-based model. By combining the advantages of the two models, the problem of over-fitting or under-fitting is avoided.
- (1)
- Forecast-based models use a temporal convolutional network (TCN) [35]. Autoregressive prediction is used for single-step forecasting tasks for all timestamp sliding time windows. However, since the TCN is limited to modeling univariate time prediction and cannot consider spatial relationships, a Multi-Layer Perceptron (MLP) is used to solve this problem. Its loss function can be expressed as
Among them, represents the value of the next timestamp of the sliding time window currently input; represents the j-th feature of ; and represents the predicted value of corresponding to timestamp i.
- (2)
- The reconstruction-based model uses a variational autoencoder [36] (VAE), which is a deep neural network-based generative model that can learn latent feature representations from complex data distributions and use these features to generate new data samples. Its optimization goal is to maximize the marginal log-likelihood of the data. The input data x are mapped onto a latent space z, and the output is a conditional probability distribution on z. The conditional probability distribution can be expressed as
In Equation (12), is the prior probability distribution. The marginal log-likelihood is formulated as
Direct calculation of Formula (13) is very difficult, so we use the inference network and the generation network for approximate inference to simplify the calculation process. Therefore, the homeopathic function based on the reconstruction model can be expressed by the following formula:
In Equation (14), the first term is the reconstruction term (optimizing encoding–decoding), and the second term is the regularization term (regularizing the latent space).
3.3.4. Abnormal Detection Strategy of CVT Inner Insulation State
For all timestamps, the joint optimization model outputs the predicted value and reconstruction probability of each feature. In order to reflect the advantages of the joint optimization model, the possible abnormal score of each timestamp is counted as :
where γ is a hyperparameter used to balance the prediction-based error and the reconstruction-based probability, and is the original value of the j-th feature at timestamp i. and are the predicted value and reconstruction probability of the j-th feature model output at timestamp i. According to the characteristics of a voltage fluctuation, combined with the joint optimization model, the possible abnormal score s at each timestamp is obtained, and the optimal threshold is determined using the adaptive threshold method [37]. The proposed CVT internal insulation state abnormality detection strategy is proposed, and the detection strategy process can be seen in Algorithm 1.
| Algorithm 1. Flow chart of abnormal detection strategy for CVT internal insulation state |
| Update and Threshold according to the joint optimization model |
| Input: |
| Output: |
| Training: For to do: |
| ⟻ AE-GATv2 |
| ⟻ AE-GATv2 |
| (M is the size of the training set) |
| end for |
| Threshold = threshold function |
| Test: For to do: |
| ⟻ AE-GATv2 |
| ⟻ AE-GATv2 |
| If > Threshold: |
| Else: |
| end for |
3.3.5. AE-GTAv2 Anomaly Detection Model Based on Dung Beetle Optimization Algorithm
Dung beetle optimizer (DBO) is a swarm intelligence optimization algorithm based on nature inspiration [38]. This algorithm mainly simulates the adaptive behavior of dung beetles in different environments and was proposed by Xue J. and Shen B. in 2023 The dung beetle optimization algorithm divides the individuals in the population into four roles: rolling ball dung beetle, egg ball dung beetle, small dung beetle and stealing dung beetle. Each role implements different search strategies to achieve a balance between global and local searches. The main steps of the algorithm are as follows:
- (1)
- Initialize the population, randomly generate N individuals and calculate the initial population fitness value.
- (2)
- Divide the population into four subpopulations according to the initial fitness value: rolling ball dung beetle, egg ball dung beetle, small dung beetle and stealing dung beetle.
- (3)
- Perform the corresponding operation on each subpopulation.
- (4)
- Update the individual position and fitness value in the population, and record the current optimal solution.
- (5)
- Judge whether the termination condition is reached, such as the maximum number of iterations or a preset error threshold. If yes, output the optimal solution and end the algorithm; if no, return to step (3).
A flow chart of the dung beetle optimization algorithm used to optimize the hyperparameters of the AE-GATv2 model is shown in Figure 3.
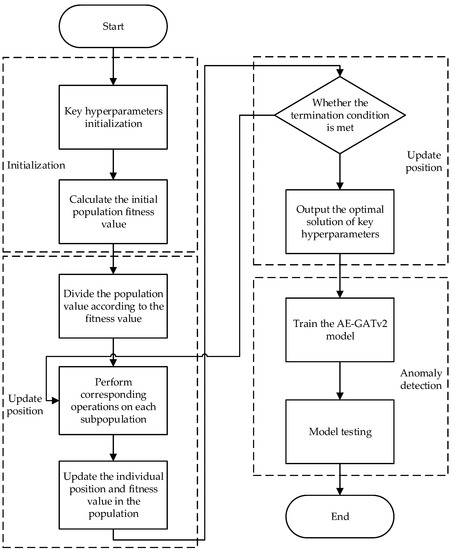
Figure 3.
Flow chart of the dung beetle optimization algorithm used to optimize the hyperparameters of the AE-GATv2 model.
4. Results
4.1. Experimental Data
An experiment was designed to verify the CVT internal insulation abnormality online evaluation method based on self-supervised learning. In order to truly reflect the characteristics of grid voltage fluctuations, the output voltage of the CVT secondary side, out of five CVTs hanging on each branch of the same busbar in a 220 kV substation, was collected as an experimental sample. The CVT secondary voltage data were sampled at a frequency of 1/60 Hz and a sampling time of 864,000 s. According to the change rate of measured voltage after the internal capacitance of the CVT was broken down and the measurement error when different capacitances were broken down inside the CVT, these were added to simulate the abnormal data of the internal insulation of the CVT. According to the ratio of 7:3, the data were divided into training set and test set, where the test set contained abnormal data, and the training set consisted of all normal data. Examples of the CVT secondary voltage sequence training and test samples after data preprocessing are shown in Figure 4: Figure 4a shows the training samples, and Figure 4b shows the test samples.
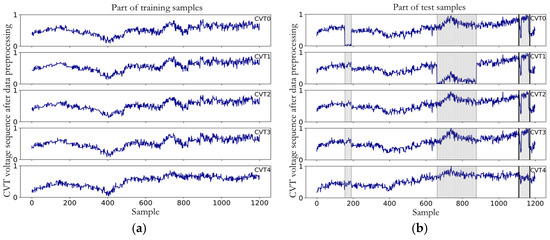
Figure 4.
Example of CVT secondary voltage sequence training and test samples after data preprocessing; (a) training samples; (b) test samples.
As shown in Figure 4a, the training samples are normal voltage data with fluctuations. As shown in Figure 4b, the first and second shaded intervals in the test samples are the secondary side voltage drop caused by the abnormal insulation of the voltage divider capacitor of CVT1 and CVT2. The third shaded interval is the normal data of the CVT fluctuation caused by the oscillation of the power system, as measured by CVT0-CVT4 which collectively decreased.
4.2. Experimental Setup
In the experiments, the machine learning library Scikit-learn was used, and the deep learning frameworks were Pytorch-1.13.1 and Python 3.9.1. The operating system used to implement the experiments was window11, and the GPU was NVIDIA GTX3060.
In the whole experimental scheme, we first preprocessed the data from the quadratic voltage sequences and then fed them into the AE-GATv2 model for training and testing. The principle of the AE-GATv2 model structure and the selection of thresholds can be found in Figure 2 and Algorithm 1. In the comparative validation phase, we set the sliding time window and the size of the hyperparameters for the experiments to 15 and 0.85, respectively. The AE layer, the size of the encoder, the embedding dimension of the GATv2 layer, the hidden dimension of the GRU layer, the hidden dimension of the TCN layer and the hidden dimension of the VAE layer were set to 128. Adam was chosen as the optimizer, and the learning rate was 0.001.
4.3. Evaluation of Indicators
In terms of evaluation indicators, the most commonly used, those being Precision, Recall and F1-score, were used [18]. Among them, Precision is the ratio of the number of true positive samples to the number of predicted positive samples, Recall is the ratio of the number of true positive samples to the number of actual positive samples and F1-scores can comprehensively reflect the Precision and completeness of the model. There were four categories of real labels and predicted labels of the data, which include
- (1)
- Predicted positive, actual positive (true positives, TPs);
- (2)
- Predicted positive, actual negative (false positives, FPs);
- (3)
- Predicted negatives, actual positives (false negatives, FNs);
- (4)
- Predicted negative, actual negative (true negatives, TNs).
Then, the calculation formulas of Precision, Recall and F1-scores are
In a real operating system, when the internal insulation state of the CVT is abnormal, the abnormal state is often continuous. Therefore, in the case of continuous prediction labels, when the previous label and the next label of the predicted label are normal, the predicted labeled anomalies are likely to be false positives (FPs), so a single anomaly clipping strategy [39] was adopted, i.e., when an anomaly with a single timestamp occurs, its prediction is changed to a normal label, which can reduce the false positive rate.
4.4. Compare and Verify
In order to verify the optimization performance of the model for the CVT internal insulation abnormality detection in this paper, in the comparison method based on the autoencoder, this paper compared the LSTM-AE model [20], based on the autoencoder, with the MTAD-GAT model [18] and the GTAD model [23], based on the prediction and reconstruction model. The Precision, Recall and F1-score of these three indicators were compared. The above algorithms participating in the comparison used the hyperparameters of the baseline model, and the results are shown in Table 1.

Table 1.
Detection metrics for different anomaly detection models.
Table 1 shows the experimental results of different models on the same CVT secondary voltage data. The method of this paper achieved an accuracy of 97.93% and a recall rate of 99.32%, which is a significant improvement over other anomaly detection methods in detecting anomalies in the CVT secondary voltage sequence. This indicates that the AE-GATv2 model has good performance in recognizing the CVT internal insulation abnormalities.
An active change in secondary voltage sequence is shown in Figure 5, which is a sequence of secondary voltages for the normal condition of the insulation inside the CVT where the shaded part is the data during the regulation of the power system, which can be used for the detection of whether the self-encoder in the model of this paper can effectively extract the sequence of the CVT secondary voltage residuals. In the abnormal recognition results of different models, it was found that only this paper’s model would not misjudge the voltage sequence during voltage regulation as abnormal, indicating that this paper’s model can effectively eliminate the interference caused by voltage regulation in the power system and more accurately mine the abnormal characteristics of the CVT secondary voltage sequence.
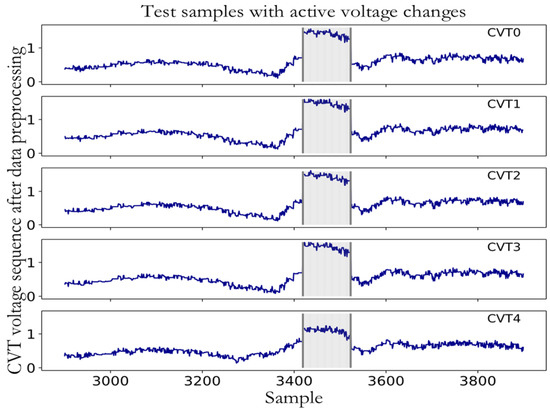
Figure 5.
Active change in secondary voltage sequence.
4.5. Ablation Analysis
We analyzed the impact of the four main components of the model—the self-encoder, GATv2, the prediction-based model and the reconstruction-based model—by removing them from the model performance. The following conclusions were drawn based on the results shown in Table 2.
Table 2.
Ablation analysis.
- When we remove AE from AE-GATv2, the F1-score drops by about 3.22%. This indicates that the AE can take into account the influence of primary voltage fluctuation and power system voltage regulation, making AE-GATv2 more able to accurately mine the abnormal characteristics of the CVT secondary voltage sequences.
- If the model lacks GATv2, the F1-score decreases by about 1.42%, indicating that parallel GATv2 layers take into account the correlation of residual sequences in time and feature dimensions, improving the performance of AE-GATv2 anomaly detection.
- The individual effects of prediction-based and reconstruction-based models are not as good as the joint optimization of the two models, indicating that the joint optimization model integrates their superior performance.
4.6. Effectiveness Analysis of Adaptive Threshold Method
The adaptive threshold method is crucial for the final abnormal detection results of the CVT secondary voltage sequence. By comparing with the Peak Over Threshold (POT) method and the epsilon method, the effectiveness of the adaptive threshold method is shown, and the results are shown in Table 3.
Table 3.
Detection indicators of different threshold determination methods.
4.7. Sensitivity Analysis for Hyperparameters
The size setting of the model time window w is a problem worthy of attention, being that w cannot be too large or too small. If the time window is too large, the detection in the real system will lose its practical significance; on the contrary, if the window is too small, the time correlation of the window sequence will be small, and a lot of time modal information will be lost. F1-scores of the AE-GATv2 model under different sliding time windows are shown in Figure 6.
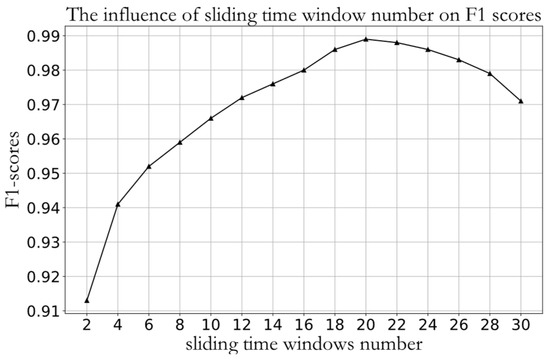
Figure 6.
F1-scores of the AE-GATv2 model under different sliding time windows.
In addition to the sliding time window that affects the final model performance, the learning rate, the size of the autoencoder layer encoder, the embedding dimension of the GATv2 layer and the number of training iterations will all affect the final model performance. Therefore, the above five hyperparameters of the AE-GATv2 model are used as the optimization variables of the dung beetle optimization algorithm. According to the method in Section 3.3.5, the optimal hyperparameters are iteratively obtained by initializing the hyperparameters and updating the position of the population. Then, the model is trained under optimal hyperparameters, and anomaly detection is performed. At the same time, according to the characteristics of the tCVT insulation abnormality, a single anomaly clipping strategy [39] is introduced to change possible false positive abnormal time windows to normal labels, further improving the results of model abnormal voltage detection. The F1-score value of anomaly detection in the test set reached 100%. Figure 7 shows the CVT anomaly detection results of the AE-GATv2 model under optimal hyperparameters for part of the test set, where the red part is correctly predicted as abnormal.
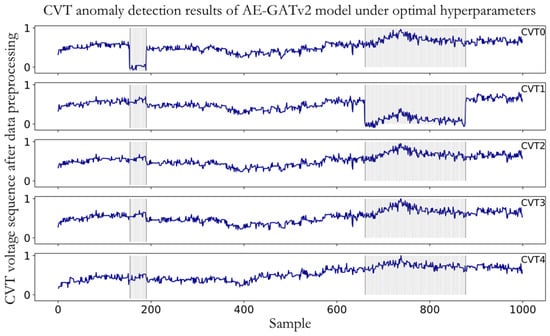
Figure 7.
CVT anomaly detection results of AE-GATv2 model under optimal hyperparameters.
5. Discussion
Our model solves some existing problems, but there are still some limitations. The method in this paper has the following advantages over previous methods: First, the model in this paper does not need to rely on empirical rules and prior knowledge, and it autonomously mines the abnormal characteristics of the CVT secondary voltage sequence. No labels need to be added during model training. Second, the model in this paper extracts the residual sequence of the CVT secondary voltage sequence to reduce the impact of primary voltage fluctuations and power system voltage regulation on the detection results. Finally, using the ant colony optimization algorithm to obtain the optimal model parameters further improves the performance of model abnormal detection.
However, the method in this paper cannot directly determine the number of CVT internal capacitor breakdowns and the cause of the abnormality.
6. Conclusions and Future Work
An effective online evaluation method for the CVT internal insulation abnormality can effectively reduce the cost of CVT inspection and reduce the burden of inspection personnel. We propose a CVT internal insulation abnormality online evaluation method based on self-supervised learning. This is performed by extracting the residual sequence of multivariate CVT secondary voltage through an autoencoder, using a parallel graph attention layer (GATv2) to learn the complex dependencies of the residual sequence in time and feature dimensions and finally, introducing a prediction and reconstruction model for joint optimization. According to the CVT internal insulation status abnormality detection strategy and single abnormality trimming strategy, experimental analysis shows that, in the absence of any labeled training set, this method effectively reduces the impact of primary voltage fluctuations and power system voltage regulation, independently excavates the fault characteristics of the CVT secondary voltage and realizes the real-time online evaluation of the CVT internal insulation state. Future work will include two aspects. First, it will provide a classification mechanism for the abnormal diagnosis of CVTs, and second, it will provide a mechanism for the root cause of abnormal diagnosis and analysis of the CVT internal insulation.
Author Contributions
Conceptualization, J.H. and Z.Z.; data curation, C.T. and Q.X.; formal analysis, C.T. and F.L.; funding acquisition, J.H.; investigation, C.T. and F.L.; methodology, J.H. and Z.Z.; software, Z.Z. and F.R.; supervision, F.R. and Q.X.; validation, J.H., Z.Z., F.R. and Q.X.; writing—original draft, J.H. and Z.Z.; writing—review and editing, J.H., Z.Z. and C.T. All authors have read and agreed to the published version of the manuscript.
Funding
This research was funded by the National Natural Science Foundation of China under Grant No. 62066025.
Data Availability Statement
The data are not publicly available due to [data is confidential].
Conflicts of Interest
The authors declare no conflict of interest.
References
- Meng, Z.; Li, H.; Zhang, C.; Chen, M.; Chen, Q. Research on the reliability of capacitor voltage transformers calibration results. Measurement 2019, 146, 770–779. [Google Scholar] [CrossRef]
- Jinsong, L.I.; He, D.; Jian, Q.I.N.; Bing, A.I.; Ruixi, L.U.O.; Qiang, S.H.I. Design and application of on-line monitoring system for insulation capacitive voltage transformer. Electr. Meas. Instrum. 2016, 53, 33–37. [Google Scholar]
- Zhang, X.; Shi, M.; He, C.; Li, J. On site oscillating lightning impulse test and insulation diagnose for power transformers. IEEE Trans. Power Deliv. 2020, 35, 2548–2550. [Google Scholar] [CrossRef]
- Davarpanah, M.; Sanaye, P.M.; Badrkhani, A.F. Compensation of CVT increased error and its impacts on distance relays. IEEE Trans. Power Deliv. 2012, 27, 1670–1677. [Google Scholar] [CrossRef]
- Wang, H.; Zhang, G.; Cai, X.; Guo, Z. The electronic capacitive voltage transformers error characteristics research and parameter optimization design. In Proceedings of the 2009 IEEE Power & Energy Society General Meeting, Calgary, AB, Canada, 26–30 July 2009; pp. 1–7. [Google Scholar] [CrossRef]
- Li, Z.; Li, Q.; Wu, Z.; Li, Z. Research into an Online Calibration System for the Errors of Voltage Transformers Based on Open–Closed Capacitor. Energies 2018, 11, 1455. [Google Scholar] [CrossRef]
- Zhao, S.; Huang, Q.; Lei, M. Compact system for onsite calibration of 1000 kV voltage transformers. IET Sci. Meas. Technol. 2018, 12, 368–374. [Google Scholar] [CrossRef]
- Li, Z.; Li, H.; Zhang, Z. An accurate online calibration system based on combined clamp-shape coil for high voltage electronic current transformers. Rev. Sci. Instrum. 2013, 84, 075113. [Google Scholar] [CrossRef] [PubMed]
- Hu, C.; Chen, M.-Z.; Li, H.-B.; Zhang, Z.; Jiao, Y.; Shao, H. An accurate on-site calibration system for electronic voltage transformers using a standard capacitor. Meas. Sci. Technol. 2018, 29, 055901. [Google Scholar] [CrossRef]
- Chen, Q.; Li, Y.; Liu, Z.; Gao, J.; Li, X.; Zhang, S. Fault detection and analysis of voltage transformer secondary terminal based on infrared temperature measurement technology. In Proceedings of the 2019 IEEE 4th Advanced Information Technology, Electronic and Automation Control Conference, Chengdu, China, 20–22 December 2019; pp. 1283–1286. [Google Scholar]
- Fu, W.; Huo, C. Early Fault Monitoring Method of CVT. Power Capacit. React. Power Compens. 2009, 30, 29–31. [Google Scholar]
- Ting, L.; Marco, F.; Roberto, O.; Sergio, T. On-line fault detection technique for voltage transformers. Measurement 2017, 108, 193–200. [Google Scholar]
- Wei, W.; Tao, P.; Yi, F.; Li, Y. The online diagnosis of internal insulation fault of capacitance voltage transformers based on machine learning. J. Phys. Conf. Ser. 2022, 2290, 012025. [Google Scholar] [CrossRef]
- Yuxuan, Z.; Chuanji, Z.; Hongbin, L.; Qing, C. An online detection method for capacitor voltage transformer with excessive measurement error based on multi-source heterogeneous data fusion. Measurement 2022, 187, 110262. [Google Scholar]
- Zhou, F.; Zhao, P.; Lei, M.; Yue, C.; Yu, J.; Liang, S. Capacitive voltage transformer measurement error prediction by improved long short-term memory neural network. Energy Rep. 2022, 8, 1011–1021. [Google Scholar] [CrossRef]
- Xing, Y.; Xu, Y.; Zhai, X.; Sun, K.; Chen, Q.; Bao, Z. On-line evaluation method of CVT internal insulation state considering the influence of primary voltage fluctuation. Electr Meas. Instrum. 2023, pp. 1–9. Available online: https://kns.cnki.net/kcms/detail/23.1202.TH.20230213.1656.006.html (accessed on 5 June 2023).
- Zhang, M.; Zhang, Z.; Fan, M.; Ding, L. Online detection of measurement error in three-phase CVT based on equivariant adaptive source separation. Meas. Sci. Technol. 2023, 34, 025022. [Google Scholar] [CrossRef]
- Zhao, H.; Wang, Y.; Duan, J.; Huang, C.; Cao, D.; Tong, Y.; Xu, B.; Bai, J.; Tong, J.; Zhang, Q. Multivariate time-series anomaly detection via graph attention network. In Proceedings of the 2020 IEEE International Conference on Data Mining (ICDM), Sorrento, Italy, 17–20 November 2020; pp. 841–850. [Google Scholar]
- Thill, M.; Konen, W.; Wang, H.; Bäck, T. Temporal convolutional autoencoder for unsupervised anomaly detection in time series. Appl. Soft Comput. 2021, 112, 107751. [Google Scholar] [CrossRef]
- Kieu, T.; Yang, B.; Jensen, C.S. Outlier Detection for Multidimensional Time Series Using Deep Neural Networks. In Proceedings of the 2018 19th IEEE International Conference on Mobile Data Management (MDM), Aalborg, Denmark, 25–28 June 2018; pp. 125–134. [Google Scholar] [CrossRef]
- Audibert, J.; Michiardi, P.; Guyard, F.; Marti, S.; Zuluaga, M.A. USAD: Unsupervised anomaly detection on multivariate time series. In Proceedings of the 26th ACM SIGKDD International Conference on Knowledge Discovery & Data Mining, Virtual, 6–10 July 2020; pp. 3395–3404. [Google Scholar]
- Shreshth, T.; Giuliano, C.; Jennings, N.R. TranAD: Deep transformer networks for anomaly detection in multivariate time series data. Proc. VLDB Endow. 2022, 15, 1201–1214. [Google Scholar]
- Guan, S.; Zhao, B.; Dong, Z.; Gao, M.; He, Z. GTAD: Graph and Temporal Neural Network for Multivariate Time Series Anomaly Detection. Entropy 2022, 24, 759. [Google Scholar] [CrossRef]
- Zhang, C.; Li, H.; Chen, Q. Detection of the ratio error drift in CVT considering AVC. Measurement 2019, 138, 425–432. [Google Scholar] [CrossRef]
- Shi, Y.; Lei, M.; Ma, R.; Niu, L. Learning Robust Auto-Encoders With Regularizer for Linearity and Sparsity. IEEE Access 2019, 7, 17195–17206. [Google Scholar] [CrossRef]
- Brody, S.; Alon, U.; Yahav, E. How attentive are graph attention networks? arXiv 2021, arXiv:2105.14491. [Google Scholar]
- Xu, Y.; Li, H.; Chen, Q.; Zhang, C.; Zhang, J.; Zhang, Y. On-line Evaluation Method of CVT Internal Insulation State Based on Support Vector Machine. In Proceedings of the 2021 IEEE 15th International Conference on Electronic Measurement & Instruments (ICEMI), Nanjing, China, 29–31 October 2021; pp. 137–144. [Google Scholar] [CrossRef]
- GB 50052-2009; Code for Design of Power Supply and Distribution System. Beijing Book Co. Inc.: Linden, NJ, USA, 2018.
- Chen, B.; Du, L.; Liu, K.; Chen, X.; Zhang, F.; Yang, F. Measurement Error Estimation for Capacitive Voltage Transformer by Insulation Parameters. Energies 2017, 10, 357. [Google Scholar] [CrossRef]
- Sun, J.; Wen, X.; Lan, L.; Li, X. Steady-state error analysis and digital correction for capacitor voltage transformers. In Proceedings of the 2008 International Conference on Electrical Machines and Systems, Wuhan, China, 17–20 October 2008; pp. 769–773. [Google Scholar]
- He, B.; Li, Y.; Bo, Z.Q. An adaptive distance relay based on transient error estimation of CVT. IEEE Trans. Power Deliv. 2006, 21, 1856–1861. [Google Scholar] [CrossRef]
- Feng, S.Z.; Chen, X.S.; Luo, R.X.; He, N.; Zhou, K. Simulation on influence of external electric field on error characteristics of CVT. In Proceedings of the 2016 International Conference on High Voltage Engineering and Application, Chengdu, China, 19–22 September 2016. [Google Scholar]
- Lundström, A.; O’nils, M.; Qureshi, F.Z.; Jantsch, A. Improving Deep Learning Based Anomaly Detection on Multivariate Time Series Through Separated Anomaly Scoring. IEEE Access 2022, 10, 108194–108204. [Google Scholar] [CrossRef]
- Veličković, P.; Cucurull, G.; Casanova, A.; Romero, A.; Lio, P.; Bengio, Y. Graph attention networks. arXiv 2017, arXiv:1710.10903. [Google Scholar]
- Bai, S.; Kolter, J.Z.; Koltun, V. An empirical evaluation of generic convolutional and recurrent networks for sequence modeling. arXiv 2018, arXiv:1803.01271. [Google Scholar]
- Kingma, D.P.; Welling, M. Auto-encoding variational bayes. arXiv 2013, arXiv:1312.6114. [Google Scholar]
- Hundman, K.; Constantinou, V.; Laporte, C.; Colwell, I.; Soderstrom, T. Detecting spacecraft anomalies using lstms and nonparametric dynamic thresholding. In Proceedings of the 24th ACM SIGKDD International Conference on Knowledge Discovery & Data Mining, London, UK, 19–23 August 2018; pp. 387–395. [Google Scholar]
- Xue, J.; Shen, B. Dung beetle optimizer: A new meta-heuristic algorithm for global optimization. J. Supercomput. 2023, 79, 7305–7336. [Google Scholar] [CrossRef]
- Xu, H.; Chen, W.; Zhao, N.; Li, Z.; Bu, J.; Li, Z.; Liu, Y.; Zhao, Y.; Pei, D.; Feng, Y.; et al. Unsupervised Anomaly Detection via Variational Auto-Encoder for Seasonal KPIs in Web Applications. In Proceedings of the 2018 World Wide Web Conference, Lyon, France, 23–27 April 2018; pp. 187–196. [Google Scholar]


Disclaimer/Publisher’s Note: The statements, opinions and data contained in all publications are solely those of the individual author(s) and contributor(s) and not of MDPI and/or the editor(s). MDPI and/or the editor(s) disclaim responsibility for any injury to people or property resulting from any ideas, methods, instructions or products referred to in the content. |
© 2023 by the authors. Licensee MDPI, Basel, Switzerland. This article is an open access article distributed under the terms and conditions of the Creative Commons Attribution (CC BY) license (https://creativecommons.org/licenses/by/4.0/).