Communication

Selection of a Multicriteria Method for Selecting Independent Variables for Forecasting the Energy Potential of Municipal Waste—A Case Study in Poland

Faculty of Production and Power Engineering, University of Agriculture in Krakow, 30-149 Krakow, Poland
*
Authors to whom correspondence should be addressed.
Energies 2023, 16(12), 4646; https://doi.org/10.3390/en16124646
Submission received: 20 April 2023 / Revised: 5 June 2023 / Accepted: 9 June 2023 / Published: 11 June 2023
(This article belongs to the Section G: Energy and Buildings)

Abstract

:
The study examined the usefulness of selected classification methods and independent variable selection (conditional attributes) for building a model based on rough set theory (RST). The aim of the study was to estimate the local indicator of municipal waste generation and the energy potential of the waste, which could be utilized in thermal waste treatment facilities. The research was conducted on a group of 2451 municipalities in Poland which differed from each other in terms of administrative type (urban, urban–rural, and rural municipalities). These municipalities were described using 4 qualitative variables and 27 quantitative variables available in statistical reports. Using five submethods of variable classification, sets of features characterizing them in terms of the amount of municipal waste produced were extracted from the collected data. Purposeful selection of conditional attributes for modeling the unitary municipal waste accumulation index allows for reducing the number of decision variables without compromising the quality of the model. During the analysis, the number of conditional attributes was reduced from 31 to 3 for urban municipalities, 5 for urban–rural municipalities, and 7 for rural municipalities. The analysis results showed that the developed models exhibited mean absolute error (MAE) values ranging from 30 kg·(per·year)−1 to 52 kg·(per·year)−1, while the mean absolute percentage error (MAPE) ranged from 9% to 21%. By utilizing municipal waste for energy purposes, an average of approximately 160 kWh·(per·year)−1 for rural municipalities and around 270 kWh·(per·year)−1 for urban municipalities can be obtained.

1. Introduction

Municipal waste represents a potential source of energy, the quantity of which de-pends on the technology used for energy recovery from the waste. The dominant technology in most European countries (alongside landfill gas utilization) is energy recovery through thermal waste treatment. Among the available thermal waste conversion processes, combustion methods clearly dominate [1,2]. The recovery of heat generated during waste combustion and its efficient utilization has become mandatory. Currently, there are over 500 municipal waste incineration plants operating in Europe (with 9 such facilities in Poland). They incinerate over 100 million tons of raw material [3]. The operation of waste incineration facilities as power plants, heat plants, or combined heat and power plants depends on local possibilities and needs regarding the transmission and utilization of the produced energy. The most thermally efficient and operationally flexible system is combined heat and power generation, which produces both thermal and electric energy [2,3]. Modern large-scale thermal waste conversion plants built in Europe in recent years are primarily grate incineration plants [3]. According to the data included in the Best Available Techniques (BAT) guidelines, one metric ton of municipal waste processed in a combined heat and power system can generate approximately 0.4 MWh of electricity and about 6.6 GJ of net heat energy [3,4]. Considering that thermal waste treatment plants constitute an important element of the municipal waste management sector in Poland, the development of such installations is planned. According to the provisions of the Voivodeship Waste Management Plans, the construction of approximately 100 facilities is planned in the coming years. Unfortunately, currently, the majority of collected municipal waste (40%) is landfilled, and only about 20% is used for thermal conversion with energy recovery [4]. The location, technology, and size of a specific thermal waste treatment facility, apart from the ecological requirements and social acceptance, should consider the quantity of municipal waste generated in a given area. This will allow for an estimation of the energy potential of the waste that can be utilized in thermal waste treatment facilities [1]. The quantity of municipal waste is most often described by the indicator of mass accumulation expressed in kg∙(person∙year)−1. The quantity and composition of generated waste are essential information needed for waste management system planning, operation, and optimization. The demand for reliable data on waste generation is indirectly included in most national waste management regulations. Specifically, waste regulations require the assessment of current waste generation and forecasts. As waste generation cannot be directly measured in a detailed manner (unlike gas or electricity consumption), which would allow for further evaluation of disposal habits, changes, and utilization trends, reliable information on waste quantity and composition is difficult to obtain at a disaggregated level. Therefore, it is necessary to search for methods that indirectly allow estimating the quantity of municipal waste flow.

1.1. The Significance of Selecting Variables for Forecasting Municipal Waste Flow

Municipal waste management planning requires obtaining reliable data on waste generation, the factors influencing waste quantity, and credible forecasts of accumulated waste quantities within a specific time horizon. The selection of appropriate variables for modeling municipal waste flow is crucial for effective analysis, forecasting, and waste management planning [5]. Suitable variables allow for a better understanding of factors influencing waste generation, improving analysis efficiency, considering data availability, and enabling result interpretation within the context of reality.
By analyzing various variables, factors such as population size, population density, standard of living, demographic structure, consumption patterns, and consumer behavior that significantly impact municipal waste generation can be identified. The selection of appropriate variables allows for identifying these factors and assessing their interdependencies.
Modeling municipal waste flow can be utilized to forecast future waste generation growth, which is crucial for infrastructure planning, resource allocation, and waste management strategies. Selecting appropriate variables, such as demographic trends, consumption patterns, public policies, and technological innovations, allows for more accurate forecasting and planning.
The selection of suitable variables allows for focusing on significant factors and eliminating unnecessary or insignificant variables. Limiting the number of variables helps to avoid the issue of overfitting the model, which can lead to incorrect results and difficulties in generalizing the model to new data.
The selection of variables for modeling municipal waste flow is often limited by data availability. It is important to choose variables that are available in sufficient quality and quantity to ensure the model’s reliability. This may require collecting additional data or using substitute variables if data are limited.
Selecting appropriate variables allows for a better understanding of modeling results and their interpretation within the context of cause-and-effect relationships. If the chosen variables are logically justified and have strong theoretical foundations, the results will be more reliable and easier to interpret.

1.2. Review of Methods and Variables Used for Forecasting the Quantity of Municipal Waste Flow

Research on forecasts of solid waste generation has been conducted for the purposes of municipal waste management planning at various levels, including national [3,4], regional [6], as well as in households in rural and urban areas [5,7]. The most commonly used indicators for estimating the mass and composition of generated waste rely on publicly available statistical data or information provided by municipalities, such as [8,9,10,11,12,13,14,15,16,17,18,19]: socioeconomic factors, including economic development and residents’ incomes, industrial and commercial activities, tourism, municipality size, land-use structure, urbanization level, technical equipment in households, demographics and population density, as well as waste collection systems, social awareness, and environmental education. The data used for creating models may have missing values, inconsistent data, noise, and outliers [20]. Understanding the complex interaction of these factors is important for developing effective waste management strategies, particularly in the context of energy recovery. Therefore, the science of feature selection, also known as variable selection or attribute selection, is necessary for the effective identification of features for predicting the municipal waste accumulation indicator. Statistical methods, such as linear regression models [21], multiple regression [8], rough set theory [22], multidimensional gray models [23], and artificial neural networks [5,24,25,26], are primarily used for forecasting the accumulation of municipal waste. Studies have shown that the selection of a forecasting method, which serves as the basis for waste management planning in each area, should consider a range of significant features and factors that influence the forecast’s quality. However, existing studies lack comparisons of feature selection methods that impact waste generation. Consequently, it is not possible to unambiguously identify the best set of variables for constructing a model estimating the municipal waste accumulation indicator. Therefore, the aim of this work was to develop and test a multicriteria method for selecting independent variables (conditional attributes) for forecasting the energy potential of municipal waste. The selected variables were used to build predictive models based on rough set theory. Such an approach has not been previously used in estimating municipal waste flow, making it a novelty in this type of research. Quality indicators, such as MAE, MBE, CV RMSE, MAPE, and APE [27], were used to evaluate the predictive model’s quality. Additionally, we hypothesize that the administrative type of a municipality can significantly influence the quantity of municipal waste that can be used for energy purposes. To test this hypothesis, we developed a methodology and verified it based on data obtained from all municipalities in Poland. We believe that considering locational factors and purposeful selection of conditional attributes can reduce their number without compromising the model’s quality. Despite significant territorial variability, the developed model allowed for determining the waste accumulation indicator values, thereby enabling the estimation of the local energy potential of waste.

2. Materials and Methods

The independent variables (conditional attributes) describing the size of the municipal waste accumulation indicator were selected based on a literature review [5,6,7,8,9,10,11,12,13,14,15,16,17,18,19] and the results of our own research [19,22,26]. The necessary data to achieve the aim of the work were mainly obtained from the Local Data Bank of the Central Statistical Office for individual municipalities in Poland [28,29]. The gathered database included 2451 objects (municipalities) described by 31 variables, both qualitative (C0÷3), presented in Table 1, and quantitative (C4÷C30), presented in Table 2.
Based on the developed database, further research was conducted, which proceeded in two stages (Figure 1). The first stage involved the preliminary preparation of research material and the selection of potential independent variables affecting the amount of municipal waste generated annually per capita. It was carried out according to the algorithm presented in Figure 2.
From the preliminary analysis, it appears that the variable that allows for obtaining homogeneous groups for the examined objects is the administrative type of the municipality. Therefore, the selection of independent variables for modeling the municipal waste stream began with the division of municipalities according to their administrative type. This action was also caused by a large variation in the amount of municipal waste generated between different types of municipalities. Observations that were outside the range of Xi avg ± 3·δ were then removed from the developed database. During the research, the selection of the best potential set of explanatory variables (attributes) was limited to five submethods. This was performed based on three classical methods utilizing the strength of correlation, as well as forward and backward regression methods. Two alternative methods were also used based on the evaluation of the sensitivity of the ANN model and the algorithm implemented in the data mining module of the Statistica program. Based on each method, the impact of individual variables on the value of the unit indicator of municipal waste accumulation was evaluated, and the top 9 variables were selected for each method. Only those variables that were indicated as one of the best by at least 3 submethods were included in the predictor set from which the most efficient set was sought.
In the second stage, predictive models were built using the rough set theory (RST), and their quality was evaluated according to the algorithm presented in Figure 3. This was performed based on further sets built from the selected conditional attributes for each type of administrative municipality, which were chosen in the first stage. The rough sets proposed by Prof. Pawlak are an appropriate tool for handling general (imprecise) and ambiguous data [30,31]. The methodology of building predictive models based on the theory of rough sets has been presented in works [22,32,33].
The next stage of the study was to calculate metrics to assess the quality of the developed predictive models. The following evaluation metrics were used to assess the quality of the developed models: the mean absolute error (MAE), mean systematic error (MBE), coefficient of variance of the root mean square error (CV RMSE), mean absolute percentage error (MAPE), and absolute percentage error (APE) [27]. Assessment metrics were calculated using Formulas (1)–(5).
M A E = 1 n g i = 1 n g | y i y i P |   i = 1 , 2 , 3 , n g
M B E = i = 1 n g ( y i y i P ) i = 1 n g y i · 100 %   i = 1 , 2 , 3 , n g
C V   R M S E = m = 1 n g ( y i y i P ) 2 y i 1 n g   i = 1 n g y i · 100 %   i = 1 , 2 , 3 , n g
M A P E = 1 n g i = 1 n g | y i y i P y i | · 100 %   i = 1 , 2 , 3 , n g
A P E = | y i y i P y i | · 100 %   i = 1 , 2 , 3 , n g
where:
  • yi—the actual value of the unit rate of municipal waste accumulation determined on the basis of data from the Bank of Local Data of the Central Statistical Office in Poland at facility i;
  • ypi—the predicted value of the unit rate of municipal waste accumulation at facility i;
  • i—number of the test object;
    ng—number of objects in the test collection (i = 1,2,3,…,ng).

3. Discussion of Research Results

3.1. Preliminary Preparation of the Research Material

From the local database of the Central Statistical Office in Poland and the work of Banski [28,29], variables describing the value of the unit rate of municipal waste accumulation for individual municipalities were obtained. Brief characteristics of the quantitative variables for the studied sites are presented in Table 3.
The unit indicator of municipal waste accumulation was characterized by a high coefficient of variation above 45%, and only 93 out of 2451 observations were below 50 kg·(per·year)−1 or above 500 kg·(per·year)−1. From the preliminary analysis, it appears that the variable that allows for obtaining homogeneous groups for the studied objects is the administrative type of the municipality. The characteristic of the decision attribute and the selected conditional attributes ranked by the highest variability in the division by the administrative type of the municipality are presented in Table 4.
The analysis shows that the highest amount of municipal waste per capita is generated in urban municipalities. This indicator is 160 kg lower in rural municipalities, but still exhibits high variability. The statistical analysis indicates that the calculated mean values for each municipality type are significantly different from each other. The high variability was mainly caused by outliers, whose causes could not be determined. Outliers were defined as those observations that differed from the mean value by more than three standard deviations. Since they were individual observations, they were removed from the database before the next stage of the study, in which sets of potential explanatory variables (conditional attributes) were developed.

3.2. Develop a Set of Potential Conditional Attributes

Out of 31 conditional attributes describing the size of the unit indicator of municipal waste accumulation, those with a variability lower than 10% were eliminated. As a result of the elimination, 26 variables for urban municipalities, 27 for urban–rural municipalities, and 29 for rural municipalities remained for the next stage. In the next step, variables that were statistically insignificantly correlated with the dependent variable or whose correlation strength was too low were eliminated. The significance of the correlation was evaluated at α = 0.05. The threshold value of the correlation strength r* was determined according to the methodology described by Bartosiewicz [34].
r * = ( t * ) 2 ( t * ) 2 + n 2
where:
  • t*—the critical value of the t-Student statistic read from the tables for the significance level α = 0.05;
  • n—degrees of freedom, equal to the number of observations.
Then, selected variables (17 for urban municipalities, 19 for urban–rural municipalities, and 22 for rural municipalities) were sorted using the strength of the correlation (I), progressive (II) and regressive regression analysis (III), as well as alternative methods that utilized the sensitivity assessment of the ANN models (IV) and the algorithm implemented in the data mining module of the Statistica program (V). The nine best conditional attributes indicated by each submethod were selected for further analysis. Since only one of the indicated submethods appeared among the selected attributes, only those that were indicated as the best by at least three submethods were selected for further analysis. This action made it possible to reduce the number of sets of conditional attributes for analysis. Table 5 shows the conditional attributes from among which the optimal set of variables describing the size of the municipal waste stream was sought.

3.3. Building a Predictive model for Estimating the Value of the Unit Indicator of Municipal Waste Accumulation and Evaluating Its Quality

After determining the sets of conditional attributes separately for each type of administrative unit of municipalities (Table 5), the developed database was divided into a training set, which included 80% of the studied objects randomly selected, and a test set consisting of the remaining units. They were used to build a predictive model that determined the value of the municipal waste accumulation indicator in each area using rough set theory (RST). The Rough Set Exploration System RSES 2.1 [33] was used to build the model, which is a computer tool enabling the analysis of data in tabular form, using the theory of rough sets. In the computer program, individual combinations of variables were introduced as conditional attributes, as presented in Table 5, for three types of administrative units. Following the methodology depicted in Figure 3, and extensively discussed in the works of Renigier-Biłozor [35] and Szul [22], the forecast of the mass waste accumulation index was determined for the data from the training set. Subsequently, the forecast quality was evaluated by comparing it with the actual value, according to Equation 4, using the data from the test set. The sets of the top three conditional variable groups for each type of administrative unit were compiled in Table 6.
The quality of the developed models was evaluated based on evaluation metrics, such as the mean absolute error (MAE), mean bias error (MBE), coefficient of variance of the root mean square error (CV RMSE), and the mean absolute percentage error (MAPE), frequently used in the literature [27]. Empirical distribution functions for the APE error were also developed to assess the frequency of errors at a specified level. The study sought a model that exhibited the best quality across all evaluated criteria. The evaluation metrics for each type of administrative unit of municipalities for the best sets of conditional attributes are presented in Table 7 and Figure 4.
The analysis shows that the developed models had good quality, and the MAPE error value ranged between 9 and 21%. The models developed for urban municipalities had the lowest indicators, regardless of the selected set of conditional attributes (Table 7). It was observed that, for this group, building models with only three conditional attributes is optimal. Increasing the number of attributes increases the time required for data preparation, lengthens the calculation time, and worsens the quality of the model. A different trend was observed for rural municipalities. In this group, increasing the number of conditional attributes improved the quality of the model in the test set. The best of the developed models, based on seven conditional attributes, had an MAPE error of 14%, which is slightly worse than for urban municipalities. However, it allowed for predicting the unit waste accumulation indicator with an error of 30 kg·(per·year)−1 for a yearly period. This is an absolute value lower than for urban municipalities by only 3 kg·(per·year)−1, but when compared to the average amount of generated waste, the models will be wrong by approximately 13% and 9%, respectively. Urban–rural municipalities located on the border of the two previous sets had intermediate parameters. The best model developed based on five conditional attributes had an MAPE error of 17%, which is a worse result than for the two previous groups. However, this model had a lower MBE and CV RMSE error rate compared to rural municipalities. It is also worth emphasizing the high consistency of the selected model evaluation indicators. In most cases, all evaluation metrics unambiguously pointed to one set of conditional attributes. Some small discrepancies only occurred for urban municipalities for the MBE indicator and for urban–rural municipalities for the MAE indicator. The selection of the best model based on the analyzed evaluation metrics was also confirmed by the analysis of the empirical distribution functions for APE errors. The greatest differences were observed for rural municipalities. The share of errors with a value below 10% for the model built on seven selected conditional attributes was at the level of 35%, while for the remaining sets, it oscillated around 26%. The first model did not register errors at a level higher than 60%, while for the other two models, they even exceeded 100%.

3.4. Energy Potential of Municipal Waste

Based on the gathered research material, the energy potential of municipal waste was estimated for each facility depending on the administrative type of the municipality. The analysis assumed that 40% of the municipal waste collected could be utilized for thermal conversion with energy recovery. The results of the analysis presented in Figure 5 assumed that the calorific value of the fraction above the sieve from the waste is at the level of 1.8 MWh·Mg−1 [4,5].
The highest amount of energy from thermal conversion of municipal waste, at a level of 270 kWh per capita, can be obtained from the average resident of urban municipalities. This figure varies in the range from 190 to 340 kWh per capita. A lower average level is expected in urban–rural and rural municipalities, where it was 210 and 160 kWh per capita during the study, respectively. Additionally, there was a very high variability in the range from 30 to 120 kWh per capita in rural municipalities. Before planning to invest in a thermal conversion installation for municipal waste, it is necessary to analyze and forecast the availability of energy raw materials. This study enables the estimation of the predicted energy potential in each area for any time horizon for which the values of decision variables are known. By reducing the required number of conditional attributes for forecasting with acceptable quality, this subtask will require less effort to gather information and build a predictive model.

4. Discussion

Based on the analyses conducted on a group of over 2000 municipalities in Poland, for which the authors of the study gathered over 30 variables, specific sets of intentionally selected conditional attributes were distinguished that characterized the level of the unit indicator of municipal waste accumulation. The conducted research shows that this indicator is characterized by a high variability at the level of 45% and individual conditional attributes have a variability exceeding even 200%. The variable allowing for the division of the community into homogeneous groups is the administrative type of the municipality.
Based on the developed methodology for the studied objects that differ from each other in, among others, the functional structure of the municipality, its typology based on the scope of its influence, as well as socioeconomic factors, a set of qualitative and quantitative variables characterizing the unit indicator of municipal waste accumulation in an annual period was distinguished. The conducted research confirms the hypothesis presented in the study that the amount of municipal waste that can be designated for energy purposes depends on the administrative type of the municipality. The selected variables, based on the developed methodology that utilizes multicriteria selection of conditional attributes, were used to build a predictive model using rough set theory (RST). The model quality assessment showed that it can be used in practice to predict the local energy potential in the process of thermal transformation of municipal waste.
Incineration of municipal waste in the context of a closed-loop economy is a matter related to sustainable waste management, aiming to minimize the negative impact on the environment and maximize resource utilization. In the traditional waste management model, the majority of municipal waste is either landfilled or subjected to incineration processes in waste-to-energy facilities. However, this traditional model based on the so-called “linear economy” is inefficient and leads to resource wastage, emissions of harmful substances into the atmosphere, and issues with waste accumulation. In a closed-loop economy, which aims to minimize waste and maximize resource utilization, the approach to incinerating municipal waste undergoes a change. Municipal waste is treated as potential resources rather than mere waste to be eliminated. Incineration is often seen as a last resort when there are no possibilities for resource recovery or recycling.
In the case of incineration of municipal waste in a closed-loop economy, there are several key aspects:
  • Energy efficiency: In modern waste-to-energy facilities, the energy generated during the incineration process can be utilized for electricity or heat production. This way, municipal waste can contribute to meeting the energy needs of local communities.
  • Resource recovery: Prior to incineration, waste can undergo selective sorting and recycling to recover valuable materials. For example, metals, glass, paper, and plastic can be separated and processed into new products. This process reduces the consumption of natural resources and reduces the need for extraction.
  • Emission purification: Modern waste-to-energy facilities are equipped with advanced flue gas cleaning systems that reduce emissions of harmful substances into the atmosphere. Filters and desulfurization and denitrification systems help minimize the negative impact on air quality.
Residue management: After waste incineration, ash and slag remain. These residues can be further processed, for example, for the production of construction materials or road aggregates. Incineration of municipal waste in the context of a closed-loop economy aims to maximize resource utilization, minimize waste, and reduce the negative impact on the environment. However, it is important to treat incineration as a last resort rather than the first choice, prioritizing waste reduction, recycling, and resource recovery.
The multicriteria method of selecting independent variables for forecasting the size of municipal waste streams presented in this paper is universal. We believe that it can also be applied to other methods than rough set theory. A limitation may be the fact that there is a lack of access to the conditional attributes indicated as being the best in other countries. Currently, state institutions involved in collecting and sharing statistical data do not have a common set of indicators. However, there is no restriction to looking for an optimal one for a different set of potential independent variables. Our research shows that this activity is expedient because it allows to improve the quality of forecasting the size of the waste stream. Our earlier work on municipalities in Poland allowed us to develop models with MAPE errors of 20–21% for the test set. The share of APE errors with values up to 20% was at the level of 40%. The selection of variables according to the proposed methodology allowed to significantly improve the quality of forecasts. Moreover, compared to the work of other authors in this area, our models are characterized by good quality [12,16,21].

5. Conclusions

The obtained research results led to the following conclusions:
  • The usefulness of the presented method, allowing for the reduction of the number of conditional attributes without deteriorating the quality of the model, has been positively verified using the example of Poland. The indicated conditional attributes can be applied in other countries, or the developed algorithms for attribute selection can be used with a group of variables available in their statistical compilations.
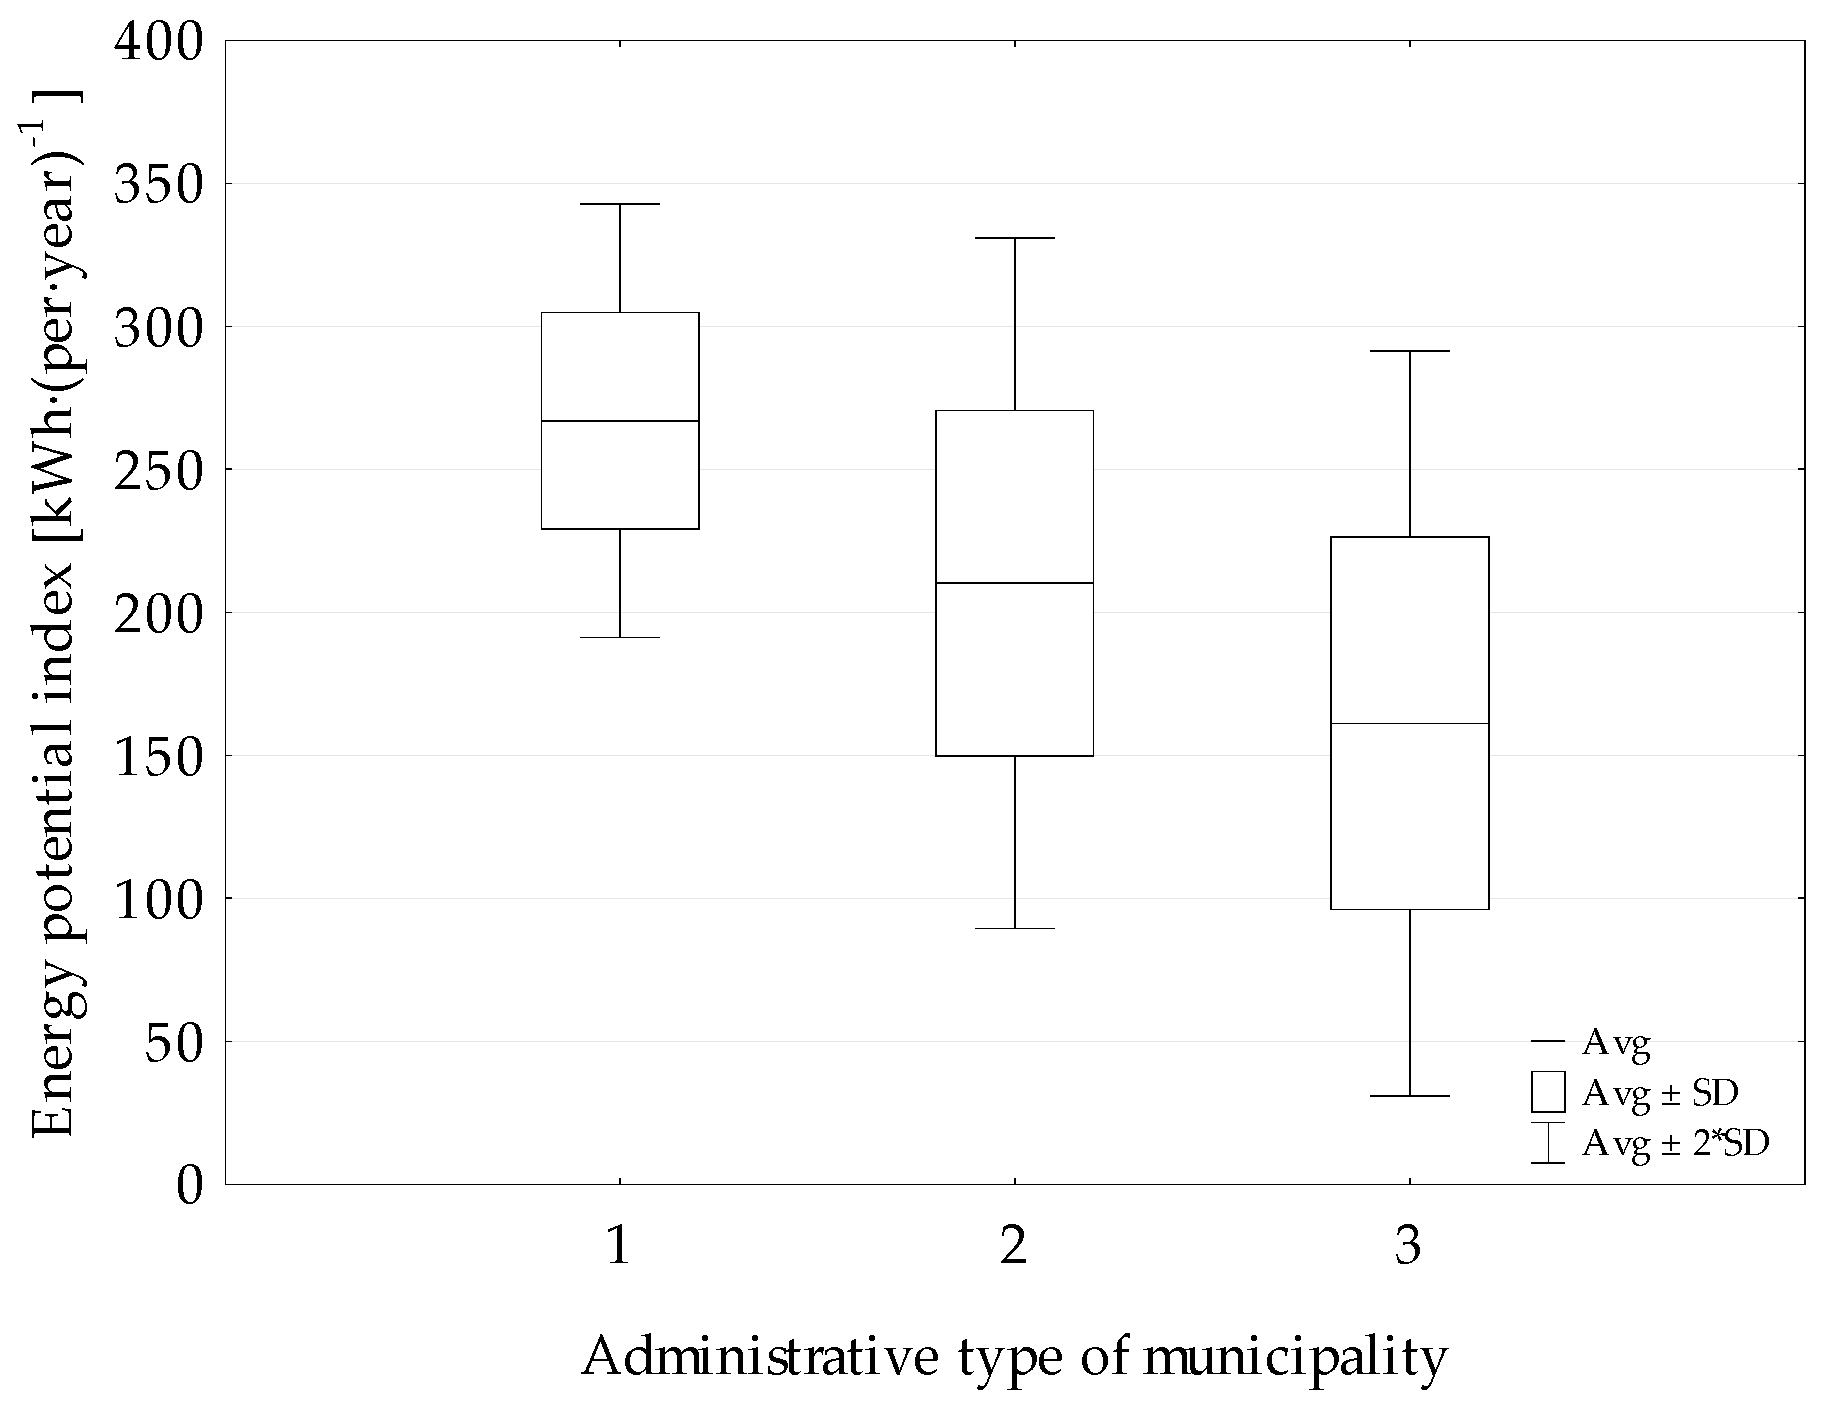
  • The presented case study for Poland indicated that the energetic utilization of municipal waste allows for an average annual gain of approximately 160 kWh·(per)−1 for rural municipalities and up to approximately 270 kWh·(per)−1 for urban municipalities.
  • For urban municipalities, an RST model of acceptable quality can be built based on only three conditional attributes, such as expenditures on municipal waste management, the cost-efficiency ratio of total services for municipal waste collection, and the total registered unemployment rate per population. Utilizing these conditional attributes allowed for obtaining forecasts with an MAE error of 33.8 kg·(per·year)−1 and an MAPE of 9.3%.
  • For urban–rural municipalities, it is advisable to use five conditional attributes, including the building occupancy rate, the proportion of apartments equipped with a flush toilet, the proportion of apartments equipped with a bathroom, the share of personal income tax revenue from municipalities, excluding cities with county rights in the state budget, and the cost-efficiency ratio of total services for municipal waste collection. This set of conditional attributes enables the development of forecasts with an MAE error of 47.9 kg·(per·year)−1 and an MAPE at the level of 17%.
  • For rural municipalities, it is necessary to expand the set of conditional attributes to seven, including the functional structure of communes, the proportion of apartments equipped with a flush toilet, the proportion of apartments equipped with a bathroom, the share of personal income tax revenue from municipalities, excluding cities with county rights in the state budget, the amount of municipalities’ spending on municipal waste management, migration balance per 1000 population, and the cost-efficiency ratio of total services for municipal waste collection. The models developed for rural municipalities allowed for making forecasts with an MAE error at the level of 30.5 kg·(per·year)−1 and an MAPE of 14.4%.
  • The problem in forecasting the energy potential from the thermal transformation of municipal waste lies in the need to know the future values of the conditional attributes. Therefore, further work in this area is necessary to further reduce the number of conditional attributes or to identify those for which the forecasted values are readily available in statistical publications.

Author Contributions

Conceptualization, K.N. and T.S.; data curation, K.N. and T.S.; investigation, K.N. and T.S.; methodology, K.N. and T.S.; project administration, T.S. and K.N.; supervision, K.N. and T.S.; writing—original draft, K.N. and T.S.; writing—reviewing and editing, K.N. and T.S. All authors have read and agreed to the published version of the manuscript.

Funding

This research was funded by the Ministry of Science and Higher Education of the Republic of Poland and the University of Agriculture in Krakow.

Institutional Review Board Statement

Not applicable.

Informed Consent Statement

Not applicable.

Data Availability Statement

Not applicable.

Conflicts of Interest

The authors declare no conflict of interest.

References

  1. Klimek, P. Ocena potencjału energetycznego odpadów komunalnych w zależności od zastosowanej technologii ich utylizacji. Naft.-Gaz 2013, 12, 909–914. [Google Scholar]
  2. Przywarska, R. Odpady komunalne źródłem energii odnawialnej. Recykling 2009, 7, 103–104. [Google Scholar]
  3. Wielgosinski, G. Wybór technologii termicznego przekształcania odpadów komunalnych. Nowa Energ. 2012, 1, 66–80. [Google Scholar]
  4. Boas Berg, A.; Radziemska, M.; Adamcová, D.; Zloch, J.; Vaverková, M.D. Assessment Strategies for Municipal Selective Waste Collection-Regional Waste Management. J. Ecol. Eng. 2018, 19, 33–41. [Google Scholar] [CrossRef]
  5. Nęcka, K.; Szul, T.; Knaga, J. Identification and Analysis of Sets Variables for of Municipal Waste Management Modelling. Geosciences 2019, 9, 458. [Google Scholar] [CrossRef] [Green Version]
  6. Mazzanti, M.; Zoboli, R. Waste generation, waste disposal and policy effectiveness: Evidence on decoupling from the European Union. Resour. Conserv. Recycl. 2008, 52, 1221–1234. [Google Scholar] [CrossRef]
  7. Vieira, V.H.A.D.M.; Matheus, D.R. The impact of socioeconomic factors on municipal solid waste generation in São Paulo, Brazil. Waste Manag. Res. 2017, 36, 79–85. [Google Scholar] [CrossRef] [Green Version]
  8. Tałałaj, I.A.; Walery, M. The effect of gender and age structure on municipal waste generation in Poland. Waste Manag. 2015, 40, 3–8. [Google Scholar] [CrossRef]
  9. Bach, H.; Mild, A.; Natter, M.; Weber, A. Combining socio-demographic and logistic factors to explain the generation and collection of waste paper. Resour. Conserv. Recycl. 2004, 41, 65–73. [Google Scholar] [CrossRef]
  10. Beigl, P.; Lebersorger, S.; Salhofer, S. Modelling municipal solid waste generation: A review. Waste Manag. 2008, 28, 200–214. [Google Scholar] [CrossRef] [PubMed]
  11. Hage, O.; Söderholm, P. An econometric analysis of regional differences in household waste collection: The case of plastic packaging waste in Sweden. Waste Manag. 2008, 28, 1720–1731. [Google Scholar] [CrossRef]
  12. Lebersorger, S.; Beigl, P. Municipal solid waste generation in municipalities: Quantifying impacts of household structure, commercial waste and domestic fuel. Waste Manag. 2011, 31, 1907–1915. [Google Scholar] [CrossRef]
  13. Miller, I.; Lauzon, A.; Wattle, B.; Ritter, M.; Hood, J. Determinants of Municipal Solid Waste Generation and Recycling in Western New York Communities. J. Solid Waste Technol. Manag. 2009, 35, 209–236. [Google Scholar] [CrossRef]
  14. Petryk, A.; Malinowski, M.; Dziewulska, M.; Guzdek, S. The Impact of the Amount of Fees for the Collection and Management of Municipal Waste on the Percentage of Selectively Collected Waste. J. Ecol. Eng. 2019, 20, 46–53. [Google Scholar] [CrossRef]
  15. Passarini, F.; Vassura, I.; Monti, F.; Morselli, L.; Villani, B. Indicators of waste management efficiency related to different territorial conditions. Waste Manag. 2011, 31, 785–792. [Google Scholar] [CrossRef]
  16. Purcell, M.; Magette, W. Prediction of household and commercial BMW generation according to socio-economic and other factors for the Dublin region. Waste Manag. 2009, 29, 1237–1250. [Google Scholar] [CrossRef] [PubMed]
  17. Suthar, S.; Singh, P. Household solid waste generation and composition in different family size and socio-economic groups: A case study. Sustain. Cities Soc. 2015, 14, 56–63. [Google Scholar] [CrossRef]
  18. Khan, D.; Kumar, A.; Samadder, S. Impact of socioeconomic status on municipal solid waste generation rate. Waste Manag. 2016, 49, 15–25. [Google Scholar] [CrossRef] [PubMed]
  19. Grochowalski, P.; Pancerz, K.; Szul, T. Rough set based approximations of classes in the OWL ontology of places in Poland. In Proceedings of the Concurrency, Specification and Programming, CS&P’2016, Rostock, Germany, 28–30 September 2016; Volume 247, pp. 68–73. [Google Scholar]
  20. Guyon, I.; Elisseeff, A. An introduction to variable and feature selection. J. Mach. Learn. Res. 2003, 3, 1157–1182. [Google Scholar] [CrossRef]
  21. Boer, E.D.; Jędryczak, A.; Kowalski, Z.; Kulczycka, J.; Szpadt, R. A review of municipal solid waste composition and quantities in Poland. Waste Manag. 2010, 30, 369–377. [Google Scholar] [CrossRef] [PubMed]
  22. Szul, T.; Knaga, J.; Nęcka, K. Application of Rough Set Theory to Establish the Amount of Waste in Households in Rural Areas. Ecol. Chem. Eng. S. 2017, 24, 311–325. [Google Scholar] [CrossRef] [Green Version]
  23. Intharathirat, R.; Salam, P.A.; Kumar, S.; Untong, A. Forecasting of municipal solid waste quantity in a developing country using multivariate grey models. Waste Manag. 2015, 39, 3–14. [Google Scholar] [CrossRef] [PubMed]
  24. Maryam, A.; Ali, E.H. Forecasting municipal solid waste generation using artificial intelligence modelling approaches. Waste Manag. 2017, 56, 13–22. [Google Scholar] [CrossRef]
  25. Bates, J.M.; Granger, C.W. The combination of forecasts. J. Oper. Res. Soc. 1969, 20, 451–468. [Google Scholar] [CrossRef]
  26. Nęcka, K.; Szul, T. Metody szacowania wskaźnika nagromadzenia odpadów służącego do określenia lokalnego potencjału energetycznego z odpadów komunalnych na terenie gmin w Polsce. Przegląd Elektrotechniczny 2022, 12, 258–261. [Google Scholar] [CrossRef]
  27. Ruiz, G.R.; Bandera, C.R. Validation of Calibrated Energy Models: Common Errors. Energies 2017, 10, 1587. [Google Scholar] [CrossRef] [Green Version]
  28. Statistics Poland. Central Statistical Office. Local Data Bank. 2023. Available online: https://bdl.stat.gov.pl/.BDL/start (accessed on 15 March 2023).
  29. Współczesne Typologie Obszarów Wiejskich w Polsce–Przegląd Podejść Metodologicznych. Available online: http://www.rcin.org.pl/Content/51257/WA51_70537_r2014-t86-z4_Przeg-Geogr-Banski.pdf (accessed on 10 March 2023).
  30. Pawlak, Z. Rough Sets: Theoretical Aspects of Reasoning about Data; Kluwer Academic Press: Dordrecht, The Netherlands, 2012; Available online: http://bcpw.bg.pw.edu.pl/Content/2026/RoughSetsRep29.pdf (accessed on 10 March 2023).
  31. Nutech Solution-Science for Business. 2005. Available online: http://www.nutechsolutions.com.pl/ (accessed on 10 March 2023).
  32. Nguyen, D.V.; Yamada, K.; Unehara, M. Extended Tolerance Relation to Define a New Rough Set Model in Incomplete Information Systems. Adv. Fuzzy Syst. 2013, 2013, 372091. [Google Scholar] [CrossRef] [Green Version]
  33. Rough Set Exploration System 2.1. Available online: http://logic.mimuw.edu.pl/∼rses (accessed on 25 February 2023).
  34. Bartosiewicz, S. (Ed.) Metody Ekonometryczne. Przykłady i Zadania; Polskie Wydawnictwo Ekonomiczne: Warszawa, Poland, 1980. [Google Scholar]
  35. Renigier-Biłozor, M. Zastosowanie teorii zbiorów przybliżonych do masowej wyceny nieruchomości na małych rynkach (Application of rough set theory for mass valuation of real estate in small markets). Acta Sci. Pol. Adm. Locorum 2008, 7, 35–51. Available online: https://scholar.google.com/scholar_lookup?title=Zastosowanie+teorii+zbior%C3%B3w+przybli%C5%BConych+do+masowej+wyceny+nieruchomo%C5%9Bci+na+ma%C5%82ych+rynkach+(Application+of+rough+set+theory+for+mass+valuation+of+real+estate+in+small+markets)&author=Renigier-Bi%C5%82ozor,+M.&publication_year=2008&journal=Acta+Sci.+Pol.+Adm.+Locorum&volume=7&pages=35%E2%80%9351 (accessed on 15 October 2022).
Figure 1. View of indicating global strategy of adopted methodology.
Energies 16 04646 g001
Figure 2. Methodology for data preprocessing and selection of independent variables (conditional attributes) for modeling the magnitude of the municipal waste accumulation rate.
Energies 16 04646 g002
Figure 3. Scheme for building an inference model based on the core of a set of conditional attributes using rough set theory (RST).
Energies 16 04646 g003
Figure 4. APE error distributions for municipalities: (a) urban; (b) urban–rural; (c) rural.
Energies 16 04646 g004
Figure 5. The value of the municipal waste energy potential index kWh·(per·year)−1 according to the administrative type of the municipality.
Energies 16 04646 g005
Table 1. Description of the qualitative conditional attributes selected for analysis [5,29].
ParameterParameter DescriptionSymbol Attribute
name of the voivodeshipwhere: 1—dolnośląskie; 2—kujawsko–pomorskie; 3—lubelskie; 4—lubuskie; 5—łódzkie; 6—małopolskie; 7—mazowieckie; 8—opolskie; 9—podkarpackie; 10—podlaskie; 11—pomorskie; 12—śląskie; 13—świętokrzyskie; 14—warmińsko–mazurskie; 15—wielkopolskie; 16—zachodniopomorskie.c0
municipality administrative typewhere: 1—urban municipality; 2—urban–rural municipality; 3—rural municipalityc1
functional structure of communeswhere: 1—urban; 2—urbanized area; 3—multifunctional transition area; 4—mainly agricultural area; 5—area with prevailing agricultural function; 6—area with tourist and recreational functions; 7—forest functions area, 8—mixed functions area)c2
typology of municipalities according to the scope of impactwhere: 1—zone of the strongest real impact (real suburbs zone); 2—zone of the strongest possible impact (possible suburbs zone); 3–weakly available zone of strong impact; 4—zone of weak possible impact (possible internal zone); 5—outskirts zone; 6—urban centers cores)c3
Table 2. Description of the quantitative conditional attributes selected for analysis.
ParameterSymbol Attribute
population density (per·km−2)c4
building occupancy rate (per·apartment−1)c5
average agricultural area (ha)c6
percentage of apartments heated with natural gas (%)c7
average gas consumption for residential heating by household (MWh)c8
share of apartments equipped with water supply (%)c9
share of apartments equipped with sewage systems (%)c10
share of apartments equipped with a gas installation (%)c11
share of apartments equipped with a flush toilet (%)c12
share of apartments equipped with a bathroom (%)c13
share of farms deriving income from agricultural activities (%)c14
municipalities, excluding cities, with county rights shares in taxes constituting income of the state budget personal income tax (PLN)c15
municipalities, excluding cities, with district rights shares in taxes constituting income of the state budget corporate income tax (PLN·per−1)c16
municipalities’ spending on municipal waste management (PLN·per−1)c17
feminization coefficient—a coefficient that determines the mutual relationship between the number of men and women; that is, the number of women per 100 men (per)c18
nonworking age population per 100 people of working age (per)c19
postworking age population per 100 people of working age (per)c20
postworking age population per 100 people of working age (per)c21
migration balance per 1000 population (per)c22
indicator of enterprises carrying out collection of mixed municipal waste (%)c23
indicator of provision of municipal waste collection services from residential properties (%)c24
indicator of provision of municipal waste collection services from nonresidential properties (%)c25
cost-efficiency ratio of total services of municipal waste collected (PLN·Mg−1)c26
total registered unemployment to population (%)c27
number of apartments in the building (pcs)c28
number of live births per 1000 people (-)c29
natural increase per 1000 inhabitants (%)c30
Table 3. Summary of potential variables describing the value of the unit rate of municipal waste accumulation in the municipality.
Symbol AttributeUnitMinAverageMaxCoefficient of Variation *
dkg·per−152.1264.32416.745.5
c4per·km−24.0218.73974.6209.95
c5per·apartment−11.23.14.714.95
c6ha0.59.881.883.6
c7%0.011.882.1127.4
c8MWh0.010.8980.9223.6
c9%0.087.7100.019.7
c10%0.049.2100.057.5
c11%0.026.698.7117.7
c12%42.687.3119.311.1
c13%40.583.83118.712.3
c14%9.382.53100.019.8
c15PLN0.0638.13634.951.2
c16PLN·per−1−0.224.52236.2250.2
c17PLN·per−10.0137.71941.559.5
c18per89.0102.1120.24.4
c19per48.663.3112.97.3
c20per41.9108.5377.927.4
c21per18.032.584.218.2
c22per−11.4−0.544.9−933.9
c23%0.029.9100.055.1
c24%0.082.8100.015.1
c25%0.016.489.163.2
c26PLN·Mg−10.0767.82691.128.7
c27%0.63.411.648.4
c28pcs0.10.21.667.5
c29-5.39.519.216.5
c30%−25.4−2.112.6−172.0
d—(decision attribute) the unit indicator of municipal waste accumulation. * Coefficient of variation—defined as the quotient (expressed in %) of the absolute measure of variation (standard deviation) and the average level of the trait value (arithmetic mean).
Table 4. Characteristics of selected attributes by administrative type of municipality.
Symbol AttributeUnitAll MunicipalitiesUrban MunicipalityUrban–Rural MunicipalityRural Municipality
Xj avgV [%]Xj avgV [%]Xj avgV [%]Xj avgV [%]
dkg·(per·year)−1264.345.5386.730.9293.329.3229.649.3
c16PLN·per−124.5250.238.795.135.7155.217.5215.9
c8MWh10.8223.614.336.612.8133.79.4159.0
c4per·km−2218.7209.91208.162.4104.492.172.295.2
c30%−2.0−172.0−2.7−112.8−2.1−140.8−1.9−199.5
c7%11.8127.517.972.714.497.09.7159.3
c11%26.7117.763.051.533.286.917.2151.1
c28pcs0.267.50.550.40.233.00.224.0
c25%16.563.121.851.217.751.915.068.7
c17PLN·per−1137.759.6185.050.8140.448.0127.663.8
c10%49.257.687.512.257.834.838.566.9
c22per−0.6−56.9−2.1−43.20.01616.7−1.3−333.3
c23%30.055.030.049.230.955.327.756.6
c6ha9.953.66.238.29.779.912.280.5
c15PLN638.151.2746.664.7597.750.6688.638.7
c27%3.448.43.142.83.449.53.446.8
c26PLN·Mg−1767.828.8647.424.8810.528.6717.225.3
c20per108.527.4136.720.5102.028.2111.421.5
c14%82.519.964.030.585.816.383.117.1
c9%87.719.795.18.785.322.790.114.4
c21per32.518.238.413.431.218.832.913.2
c29-9.616.58.917.39.816.39.315.5
c24%82.815.178.214.383.916.382.311.1
c5per·apartment−13.115.02.511.73.213.73.011.6
c13%83.812.394.54.280.512.787.18.8
c12%87.311.196.53.584.311.690.57.8
c19per63.37.366.96.362.77.663.05.5
c18per102.14.4109.63.0100.33.4103.03.0
d—(decision attribute) the unit indicator of municipal waste accumulation; Xj avg—average value of the trait; V—coefficient of variation.
Table 5. Selected conditional attributes for each type of administrative unit of municipalities which can be used to build sets of variables.
Categories of Communes in PolandVariable Selection SubmethodConditional Attribute
c0c2c3c5c6c9c12c13c15c16c17c22c26c27c28
urban municipalityI 11 1 11 1
II1 1 1111
III 1 1 1111
IV1 11 111
V1 11 11 1
urban–rural municipalityI 1 1111 11 11
II111111 1 1
III 1111 1 1111
IV11 11 111 11
V111 111 1 1 1
rural municipalityI 11 1111 11
II 11111 1 11
III 1 1111 1 111
IV 111 11 1
V 11 1 111111
where: I—strength of the linear correlation; II—progressive regression; III—regressive regression; IV—ANNs (artificial neural networks); V—data mining variable selection and elimination.
Table 6. Sets of input variables for analyzed predictive models.
Categories of Communes in PolandSets of VariablesAttribute
c0c2c3c5c6c12c13c15c17c22c26c27
urban municipalitySet 11 111 1111
Set 2 1 1111
Set 3 1 11
urban–rural municipalitySet 1 11 111 11
Set 2 1 111 1
Set 3 111 1
rural municipalitySet 1 1 111111
Set 2 1 1111
Set 3 1111
Table 7. Evaluation of the predictive model of the municipal waste accumulation rate based on the tested sets of conditional attributes emerged by the attribute selection methods.
Categories of Communes in PolandSets of VariablesAssessment Parameters
MAE kg·(per·Year)−1MBE%CVRSME%MAPE%
urban municipalitySet 142.11.45.611.7
Set 237.8−0.3510.4
Set 333.80.44.79.3
urban–rural municipalitySet 152.3−0.6414.7518.9
Set 247.9−0.6913.0417
Set 347.3−3.113.517.5
rural municipalitySet 130.50.6814.9214.4
Set 240.1−1.5119.8119.8
Set 341.4−2.6920.7021
Disclaimer/Publisher’s Note: The statements, opinions and data contained in all publications are solely those of the individual author(s) and contributor(s) and not of MDPI and/or the editor(s). MDPI and/or the editor(s) disclaim responsibility for any injury to people or property resulting from any ideas, methods, instructions or products referred to in the content.

