Article

Petroleum System Modeling of a Fold and Thrust Belt: A Case Study from the Bannu Basin, Pakistan

1
Institute of Geology, University of Azad Jammu and Kashmir, Muzaffarabad 13100, Pakistan
2
Department of Petroleum Engineering, Western Australia School of Mines: Minerals, Energy and Chemical Engineering, Curtin University, 26 Dick Perry Avenue, Kensington, WA 6151, Australia
3
Department of Earth Sciences, University of Sargodha, Sargodha 40100, Pakistan
4
Turkish Petroleum Corporation, Ankara 06510, Turkey
*
Authors to whom correspondence should be addressed.
Energies 2023, 16(12), 4710; https://doi.org/10.3390/en16124710
Submission received: 30 April 2023 / Revised: 31 May 2023 / Accepted: 12 June 2023 / Published: 14 June 2023

Abstract

:
This study focused on analyzing the petroleum system of the Bannu Basin, which is the foreland basin of the Himalayan fold and thrust belts in Pakistan. The objectives of this study were achieved by dividing the study area into three zones, namely, the Southwestern zone, Southeastern zone, and Northeastern zone. The regional 2D seismic lines and well log data, including the bore hole temperature (BHT) and petrophysical and geochemical data, were integrated. The seismic interpretations and geohistory plots indicate higher levels of sedimentation and abrupt sedimentation from the Miocene until the Recent era due to the initiation of Himalayan orogeny. The thermal modeling indicates that potential source rocks are present in the basin, whereas the local faults in the Southwestern and Southeastern zones act as potential traps for the preservation of hydrocarbons. It is assumed that the Tredian Formation and Lumshiwal Formation are the potential reservoir rocks in the Southwestern zone, whereas the Warcha Formation and Tredian Formation are the economic reservoirs in the Southeastern zone. However, in the Northeastern zone, no major accumulation is present. The significant sedimentation of post-Miocene formations was the major event for the generation of hydrocarbons and a critical moment for the accumulation of hydrocarbons in the study area.

1. Introduction

At present, the identification and characterization of new energy prospects are crucial due to the increase in society’s demand for energy. The approach of integrating depth-based geological interpretations with geochemical analyses can be useful for understanding complex scenarios for hydrocarbon explorations [1]. The analyses of geohistory, subsurface basin architecture, heat flow conditions, source rock thermal maturation, and hydrocarbon migration in the sedimentary basins are important parameters for this approach [2,3,4,5,6,7,8,9,10], which helps to understand the deposition of different formations within the geological time scale and contributes to understanding the major depositional phases during basin development. In contrast, depth-based horizon modeling helps to identify present-day basin architecture, including the tectonic development, depositional style, and physical properties of each horizon [11,12]. Hence, it has a different impact on the maturation of individual source rock laterally and vertically [13]. Furthermore, subsurface modeling is particularly important and relevant in the case of fold and thrust belts where most of the hydrocarbons are stored in structural traps. Heat flow is one of the most important boundary conditions in basin modeling as it aids in understanding the thermal maturity of the basin [14,15]. It is the critical parameter for the maturation of organic matter and the generation of hydrocarbons and their migration [16,17]. The subsurface temperature is also largely dependent on the heat flow condition and thermal conductivity of the deposited sediments [18]. In contrast, geochemical analyses, in addition to kinetic parameters, are important for quantifying the source rock properties, which can aid in understanding the potential for hydrocarbon generation in any sedimentary basin [19,20,21]. Furthermore, the migration pathways of the hydrocarbons can be constructed by incorporating the permeabilities of the lithological units and their geometric variations through time [22]. The integration of subsurface modeling, heat flow analysis, and geochemical analysis are incorporated into basin modeling simulations to understand the generation of hydrocarbons and the expulsion and migration scenarios for different source rocks within the basin [23]. It helps to describe the essential petroleum system elements comprising the time interval and the critical moment for the generation of hydrocarbons [24]. Mostly, the hydrocarbons migrate and accumulate in anticlinal structures under the influence of buoyancy [25].
The Bannu Basin formed in the northwest foreland basin of the Himalaya Fold and Thrust belt in Pakistan [26]. Worldwide, the foreland sedimentary basins formed along the fold and thrust belts are considered the best targets for the exploration of hydrocarbons. The Bannu Basin has undergone major episodes of thrust and strike-slip faults and is filled with thick molasse strata of 5–6 km [27]. It can be divided into three main regions: its northern and southern parts are known as the thrusted regions, whereas the central part is the major depression of the basin [27]. The basin is comprised of a wedge of sediments that slide northwest–southeast on a weak salt detachment. Regionally, the structural geology and stratigraphy indicate that the Bannu Basin is the western extension of the Potwar Basin [28] and is located adjacent to the Kohat Basin. Several hydrocarbon fields, namely, the Manzalai Gas Field, Mela Oil Field, Nashpa Oil Field, Chanda, and Makori, have been discovered in both basins [29]. However, several hydrocarbon wells have been drilled in the Bannu Basin since 1968 (Pezu-01 well), but no major discovery was reported until 2021. The existence of salt, as well as many hydrocarbon seepages in the area, increases the probability of hydrocarbon accumulation, which suggests significant future exploration potential. Recently, the two economic hydrocarbon discoveries from the Wali-01 well in 2021 and the Bannu West-1 well in 2022 increased the probability of hydrocarbon accumulation and the high possibility for future exploration in the basin.
Various multidisciplinary studies have been carried out in the Bannu Basin in recent years. These studies majorly focused on the tectonic and sedimentary evolution of the basin [27,30,31,32,33] and the structural evolution of the Trans Indus Ranges [34,35,36]. Generally, these studies were based on outcrop data and subsurface modeling using 2D seismic sections. However, the detailed petroleum system of the basin is not well documented. The present study attempts to improve the understanding of the petroleum generation, migration, and accumulation history of the Bannu Basin by dividing the basin into three zones. The objectives of this study are achieved by integrating the multidisciplinary data, including the subsurface models, heat flow conditions, and geochemical analysis, incorporated into each divided zone. Two- and three-dimensional petroleum system models were constructed in profile and planar views by (i) generating the subsurface models to define the chronological order of the horizons in each zone; (ii) defining the conditions of hydrocarbon maturation, the transformation ratio, and their expulsion in different source rocks in each zone; (iii) identifying the migration pathways and the major accumulation zones in reservoir rocks.

2. Study Area and Geological Setting

This research work was carried out in the Bannu Basin which is situated along the Trans Indus Ranges and part of the Upper Indus Basin in northern Pakistan. The Trans Indus Ranges are tectonically active fold and thrust belts. These east–west-trending mountain ranges are the most prominent geological features along the Bannu Basin, are 85 km wide, and extend over almost 200 km [30,37].
Geologically, the Bannu Basin is bordered by high topographic features, namely, the Marwat–Khisor Ranges to the south, Kohat Basin to the north, Surghar Range to the east, and Pezu-Bhittani Range to the west [38]. The western boundary of the Bannu Basin is delineated by the transpressive Kurram Fault. The structural trends of the Marwat–Khisor Ranges extended from east–west to east–northeast. The Kohat Basin has an east–west extension with several developed hydrocarbon fields [29]. Furthermore, the Surghar Range trends north–south along the eastern flank of the Bannu Basin (Figure 1a). Moreover, the westernmost part of the Trans Indus Ranges consists of the Pezu Bhittani Range. The Kalabagh Fault (KF) is the major geological feature that separates the Trans Indus Ranges from the western Salt Range [39]. Overall, these ranges are the result of Himalayan orogeny formed due to the ongoing subduction of the Indian plate under the Eurasian plate [40,41,42]. As a result of the collision and the presence of Precambrian evaporates, thin-skinned tectonic features overthrust and pushed southward along the decollement zone in the south of the fold belt in the form of the Salt Range and the Trans-Indus Ranges [43,44]. Moreover, the Bannu Basin witnessed two significant deformation stages based on conglomerate and paleo-current directions. The first phase was initiated during the Miocene to Pliocene period and resulted in normal faulting. Further, the second phase consisted of southward thrusting from the Pliocene to the present [45].
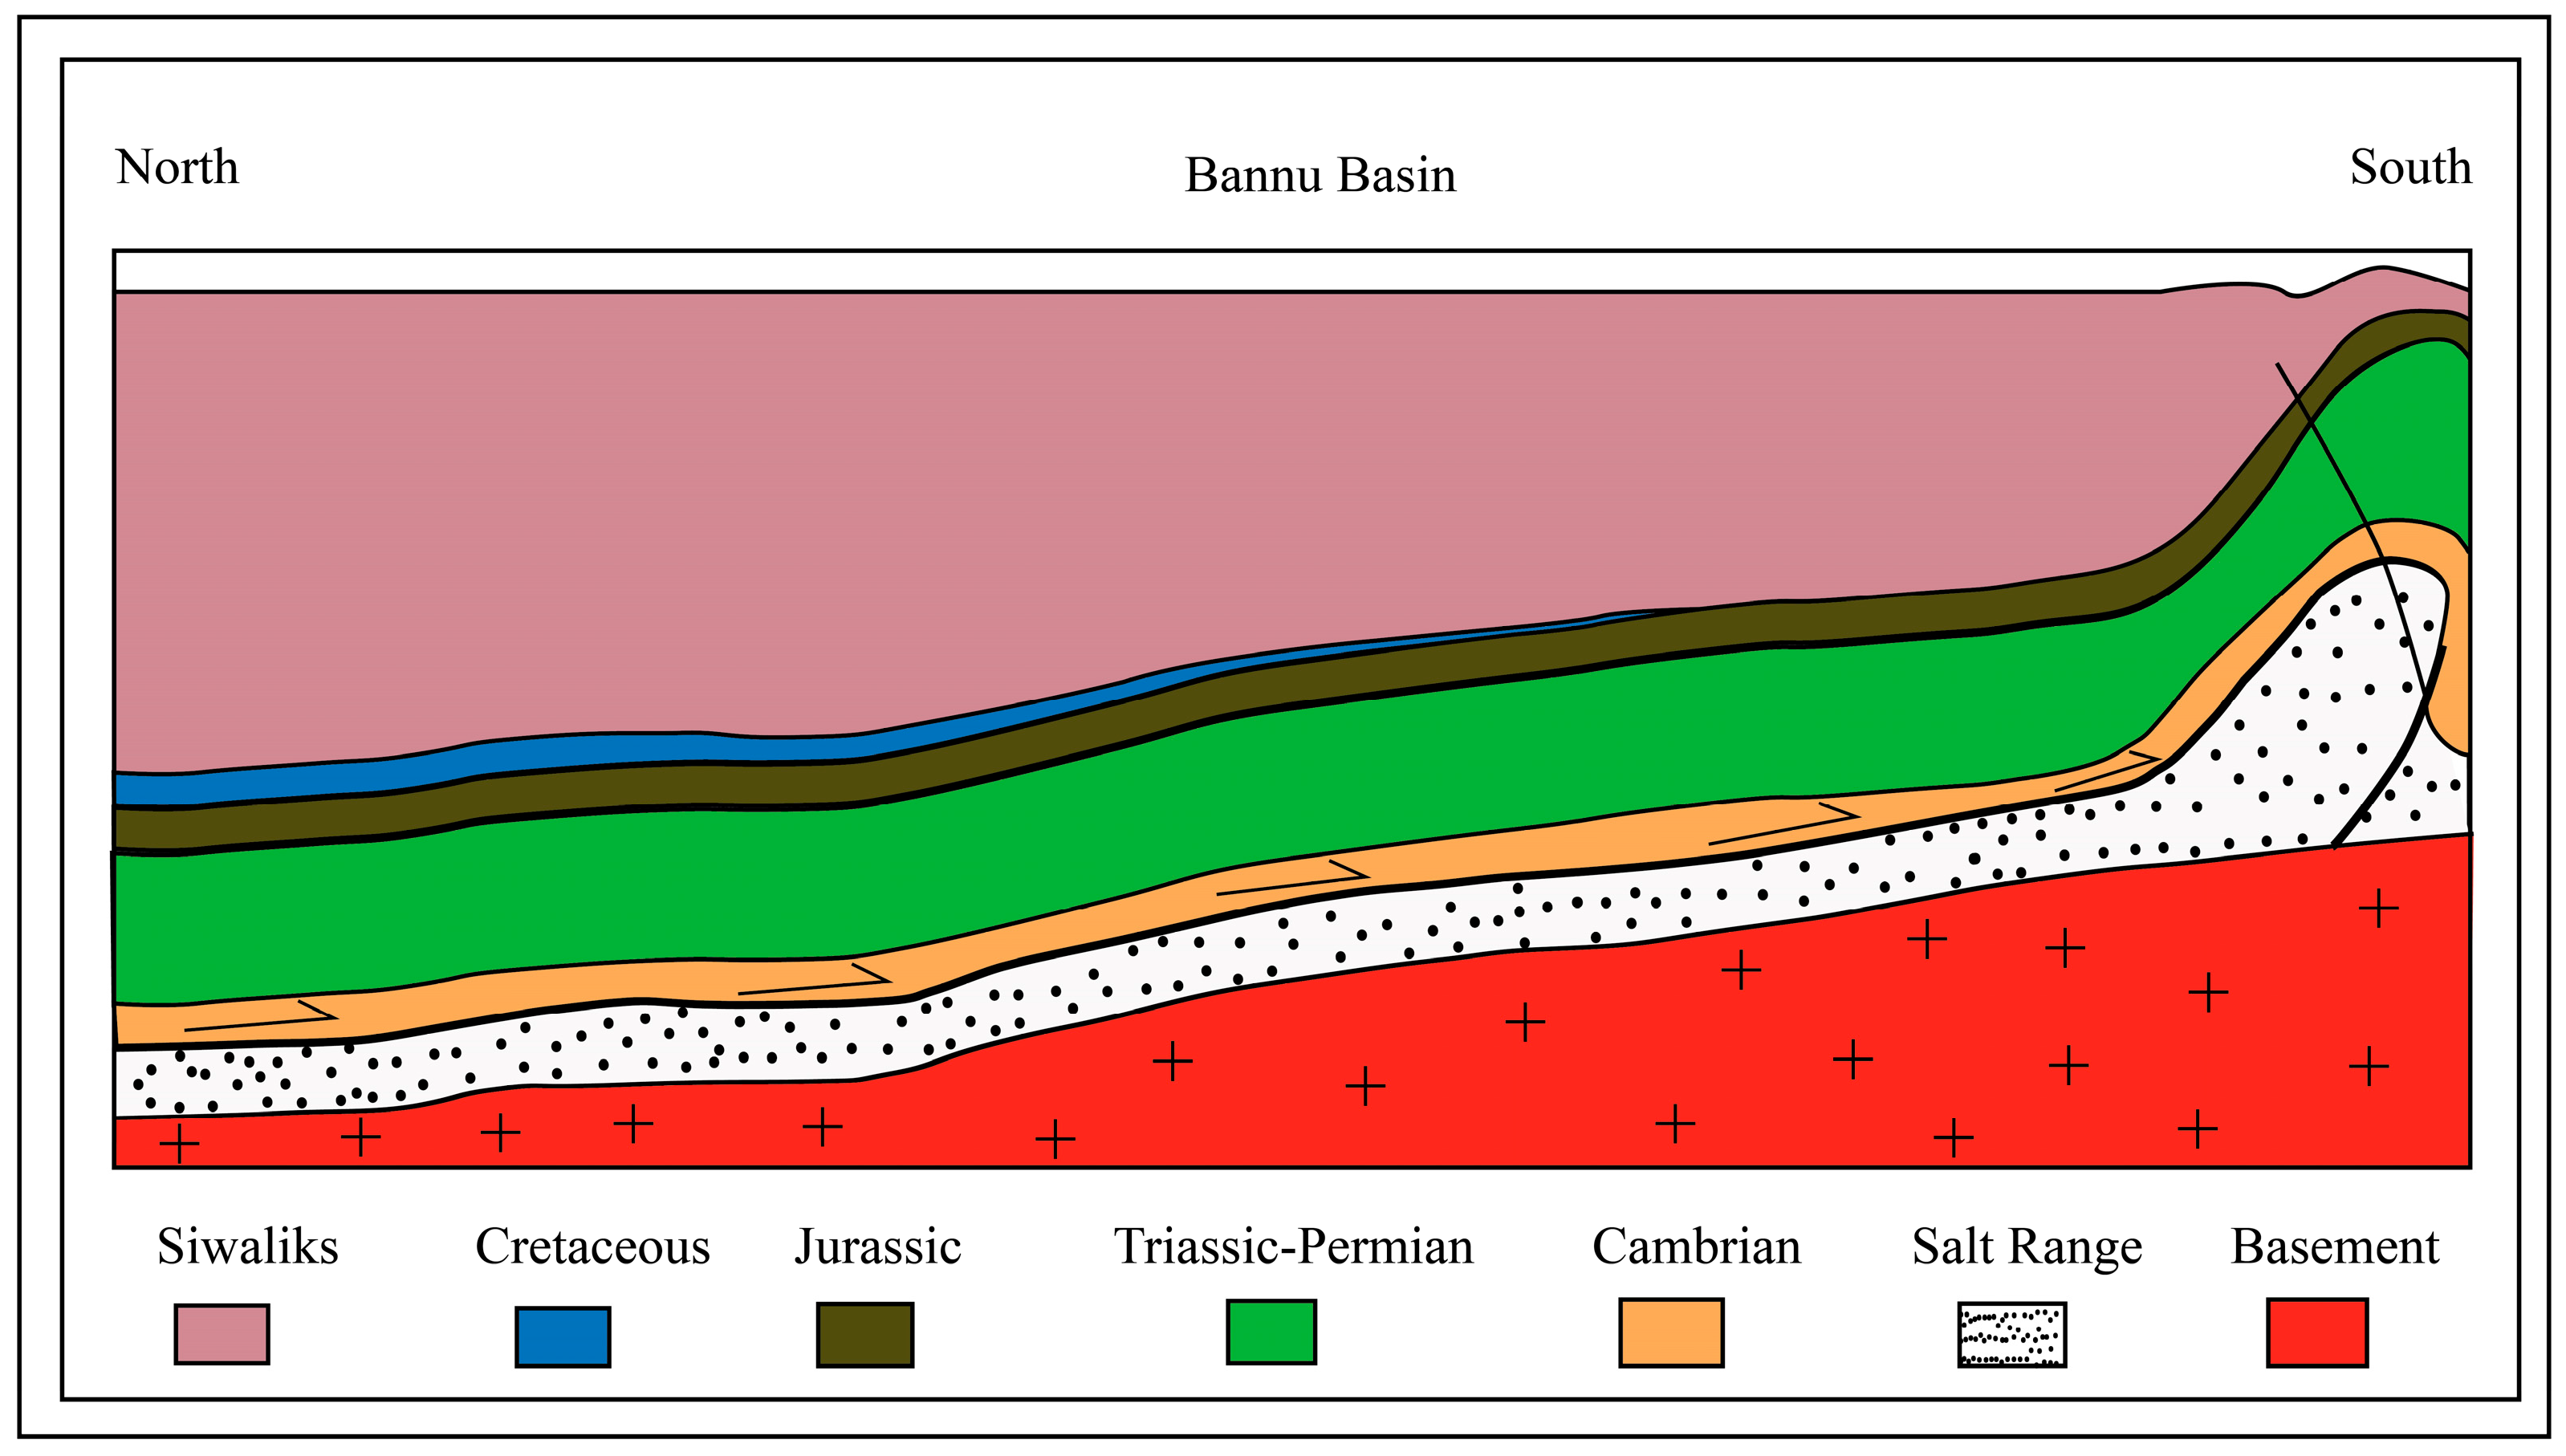
To understand the basin architecture of the Bannu Basin, a conceptual model based on the north–south geological cross-section was constructed and was presented by [27]. The model was developed to understand the deformation style and tectonics of the basin in relation to the fold and thrust belt of northern Pakistan. The Himalayan orogeny formed due to the collision of the Indian and Eurasian plates had a direct impact on basin development [31]. It is indicated that the Bannu Basin experienced different phases of tectonic activities [27,30,31]. Before the collision, it was considered a passive margin basin, with Salt Range Formation of the pre-Cambrian age at its base [27]. During the formation of the Himalayas, the compressional tectonics resulted in an uplifting and rapid fluvial sedimentation of the Rawalpindi Group and Siwalik deposits in the basin from the north. This abrupt sedimentation may have also influenced the salt movement toward the south of the basin [27]. Furthermore, it might have been responsible for the major detachment layer (the pre-Cambrian Salt Range Formation) at the base of the basin. As a result, the compressional tectonic produced the recent folds and thrusts that also deformed all the sedimentary units deposited in the basin [30]. Currently, the study area has a high level of sedimentation of Molasse deposits toward the north and center which thins toward the south. The salt diapirism and active tectonics pushed the rocks upward in the south of the basin (Figure 2).
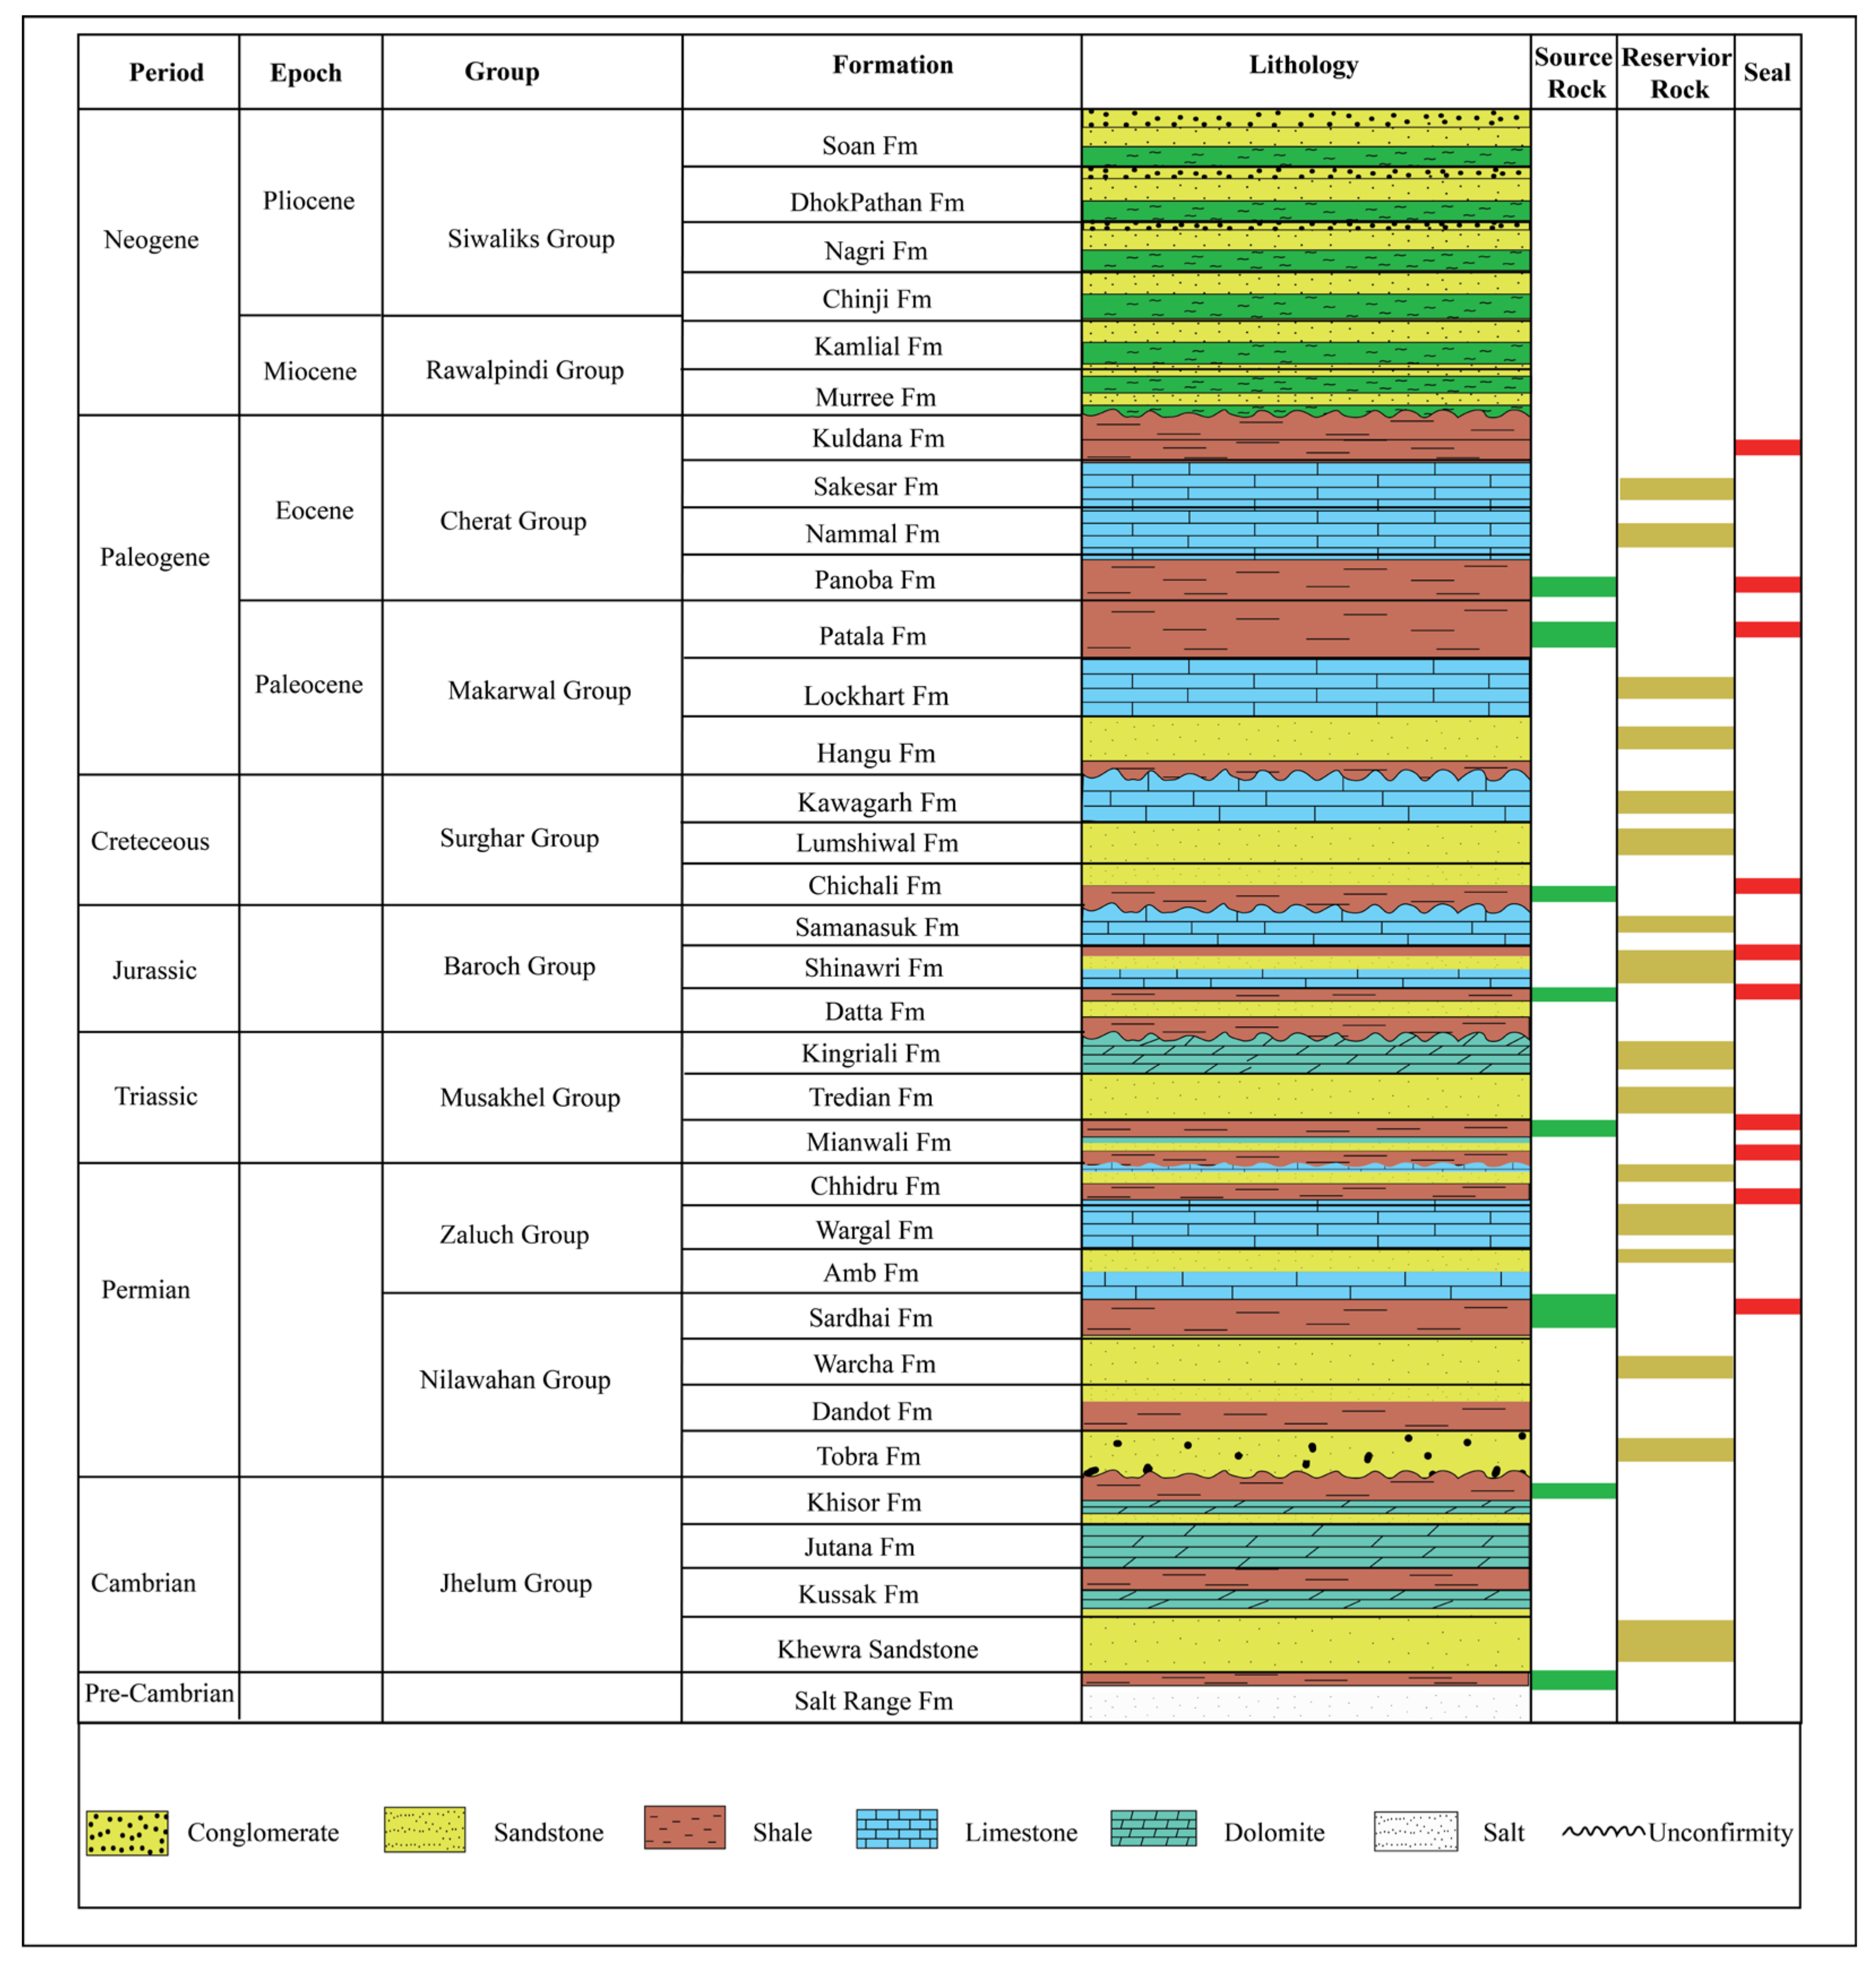
The stratigraphy of Bannu Basin overlies the Neo-Proterozoic basement and is divided into three main groups: the Salt Range Formation (Neo-Proterozoic), the sedimentary units of the Cambrian–Eocene platform, and the fluviatile sedimentary units of the Miocene–Pleistocene. Furthermore, the uplift and erosion indicate the unconformities in the Cambrian–Permian and Eocene–Miocene [28,51,52]. The deposition of thick sedimentary units of the Miocene–Pleistocene overlying the Cambrian–Eocene platform is the result of orogenic processes of the Himalayas [27]. The outcrop of these rocks surrounds the Bannu Basin, which is exposed along the Surghar, Khisor and Pezu–Bhittani ranges [53]. Furthermore, the exposed surface of the basin consists of mostly alluvial sediments of the Quaternary age. The generalized stratigraphic chart of the Bannu Basin along the major source, reservoir, and seal rocks is shown in Figure 3.
In this research, the Bannu Basin was divided into three zones, namely, the Southwestern zone, Southeastern zone, and the Northeastern zone (Figure 1b). This division was defined based on the tectono-stratigraphic evolution in each zone in the basin. The Southwestern zone mostly consists of sedimentary units from the Triassic era to the Recent era. The Southeastern zone consists of Cambrian–Recent deposition in which Cretaceous to Miocene sedimentary units are missing, whereas the Northeastern zone consists of Eocene to Recent stratigraphic units.

3. Petroleum System of Bannu Basin

The petroleum system of the Bannu Basin is mostly derived from the Kohat and Potwar basins situated on the northern and eastern sides of the studied basin, respectively. Many source and reservoir rocks, in addition to associated seal horizons, are identified in the petroleum system of the Bannu Basin [54]. To be precise, the petroleum system of the basin is considered similar to the Potwar Basin as they both have identical geological structures and stratigraphic units [27]. Based on the literature, it is indicated that the possible hydrocarbon traps are structural traps (e.g., thrust faults and anticlines) in the study area [27].
For this research study, source rocks of the Cambrian, Permian, Triassic, Cretaceous and Paleocene age were studied based on formations encountered in representative wells drilled at maximum depths in the basin of each zone (Table 1). The Khisor Formation of the Cambrian age is the source rock in the Southeastern zone. The Chhidru Formation of the Permian is considered to be a reservoir of this source. However, the shales of the Permian age are considered the seal of this formation. The initial total organic carbon (TOC) and hydrogen index (HI) of the Khisor Formation are 0.90% and 210 mg HC/g TOC, respectively, in the Southeastern zone (Table 2) [30,55]. The shales of the upper part of the Mianwali Formation of the Triassic act as the source rock for the sandstone of the Tredian Formation reservoir. The TOC and HI of this source rock range from 0.50 to 1.68% and from 254 to 380 mg HC/g TOC in the Southwestern and Southeastern zones, respectively, whereas the shales of the Kingriali Formation act as the seal of the Tredian Formation reservoir. The shales of the Jurassic Datta Formation act as the source rock in the Southwestern and Southeastern zones. The TOC ranges of the Datta Formation range from 0.67 to 2.65% in the basin. The HI ranges from 130 to 140 mg HC/g TOC. The limestones of the Shinawari and Samanasuk formations are the reservoir rocks in the basin, whereas the intra-formational shales of the Shinawari Formation and the base shale of Chichali Formation act as the seal for the carbonate reservoirs of the Jurassic age. The Cretaceous Chichali Formation has TOC values in the range of 1.10-1.24% and is another source rock in the area. The HI ranges between 180 and 247 mg HC/g TOC in the Southwestern and Northeastern zones (Table 2). The Lumshiwal Formation is the reservoir rock of the Chichali Formation, whereas the Panoba Formation of the Paleocene is also considered a source rock in the Northeast zone, with a TOC of 0.61 and an HI value of 98 mg HC/g TOC. Overall, all the potential source rocks in Bannu Basin consist of Type II-III kerogen [56].

4. Materials and Methods

This study was based on numerical basin modeling via a reconstruction of the thermal history and a prediction of the timing of the generation and expulsion of hydrocarbons from possible source rocks in the different zones. Keeping this in mind, the subsurface modeling and geochemical data were integrated via PetroMod software (Version 2019, Schlumberger). In this research, three representative wells were selected for 1D modeling. The Chonai-01 well was selected from the Southwestern zone, the Isa Khel-01 well was selected from the Southeastern zone, and the Kundi-X1 well was selected from the Northeastern zone. Firstly, these wells were used to reconstruct the burial history of the basin. The reconstruction was based on a conceptual model (Figure 2) which mostly included the geological information and tectono-stratigraphic history. The other wells used in this research are not disclosed in this paper due to commercial confidentiality. However, the representative wells shown in this paper were drilled down to a significant part of the source rocks and had geochemical reports which were needed for petroleum system modeling. Furthermore, the 2D and 3D models were generated using the 2D seismic lines. For this purpose, 10 regional seismic lines and several wells were acquired from the Directorate General of Petroleum Concession (DGPC), Pakistan. By using the 2D seismic sections, the horizons and faults were interpreted based on different formations encountered in each zone by incorporating well tops and seismic reflectors in the Petrel software (Version 2017, Schlumberger). Further, the time and depth contour maps were generated via interpolating horizons [57]. The formula used for the conversion of time contour maps into depth contour maps [58] is shown in Equation (1).
D = Vavg × TWTmsec
where D is the depth of the horizon, Vavg is the average velocity of the horizon, and TWTmsec is the two-way time in milliseconds.
To better understand the thermal histories of different zones, the wells data were used to perform 1D simulations. The calculated and calibrated results of 1D modeling were then input into 2D and 3D models generated by the 2D seismic lines. The modeling package [59], based on the lithological distributions, was used to define the initial porosity, density, permeability, heat capacity, and thermal conductivity of each lithological unit, which are shown in Table 1.
The heat flow, paleo-water depth, and surface water interface temperature (SWIT) are important boundary conditions required for petroleum system modeling. The heat flow is considered the most important condition defined in each zone to generate the heat flow scenario at the base of each model. Due to the continental to shallow marine deposition of the formations in the study area, the paleo-water depth corrections were not considered in the research. However, the SWIT was calculated via software and was based on the evolution of sea level temperature, considering the global mean surface temperature variations and latitudinal variation through geological time [60]. The heat flow was calculated via the heat flow Equation (2), whereas the temperature was calculated [61,62] using the average surface temperatures and bottom hole temperatures (BHTs) of different wells via Equation (3). In this research, the Horner plot was used to find the corrected temperature as it is one of the simplest and most reliable indicators of equilibrium temperature. The results of the corrected temperature show the best match with the models. However, there are other advanced methods (e.g., artificial neural networks) that can be used to find a reliable prediction of the BHT [63]. For the heat flow and temperature calculations, the following formulas were used:
Q = λ   Δ T f m Δ Z ,
Tfm = Ts + Df × (BHT − Ts/TD)
where Q is the heat flow, λ is the thermal conductivity of a formation, and Δ T f m Δ Z is the geothermal gradient in which Tfm is the temperature and Z is depth, whereas Ts is the average surface temperature, Df is the formation depth, BHT is the bottom hole temperature (found on the log header), and TD is the total depth of the well.
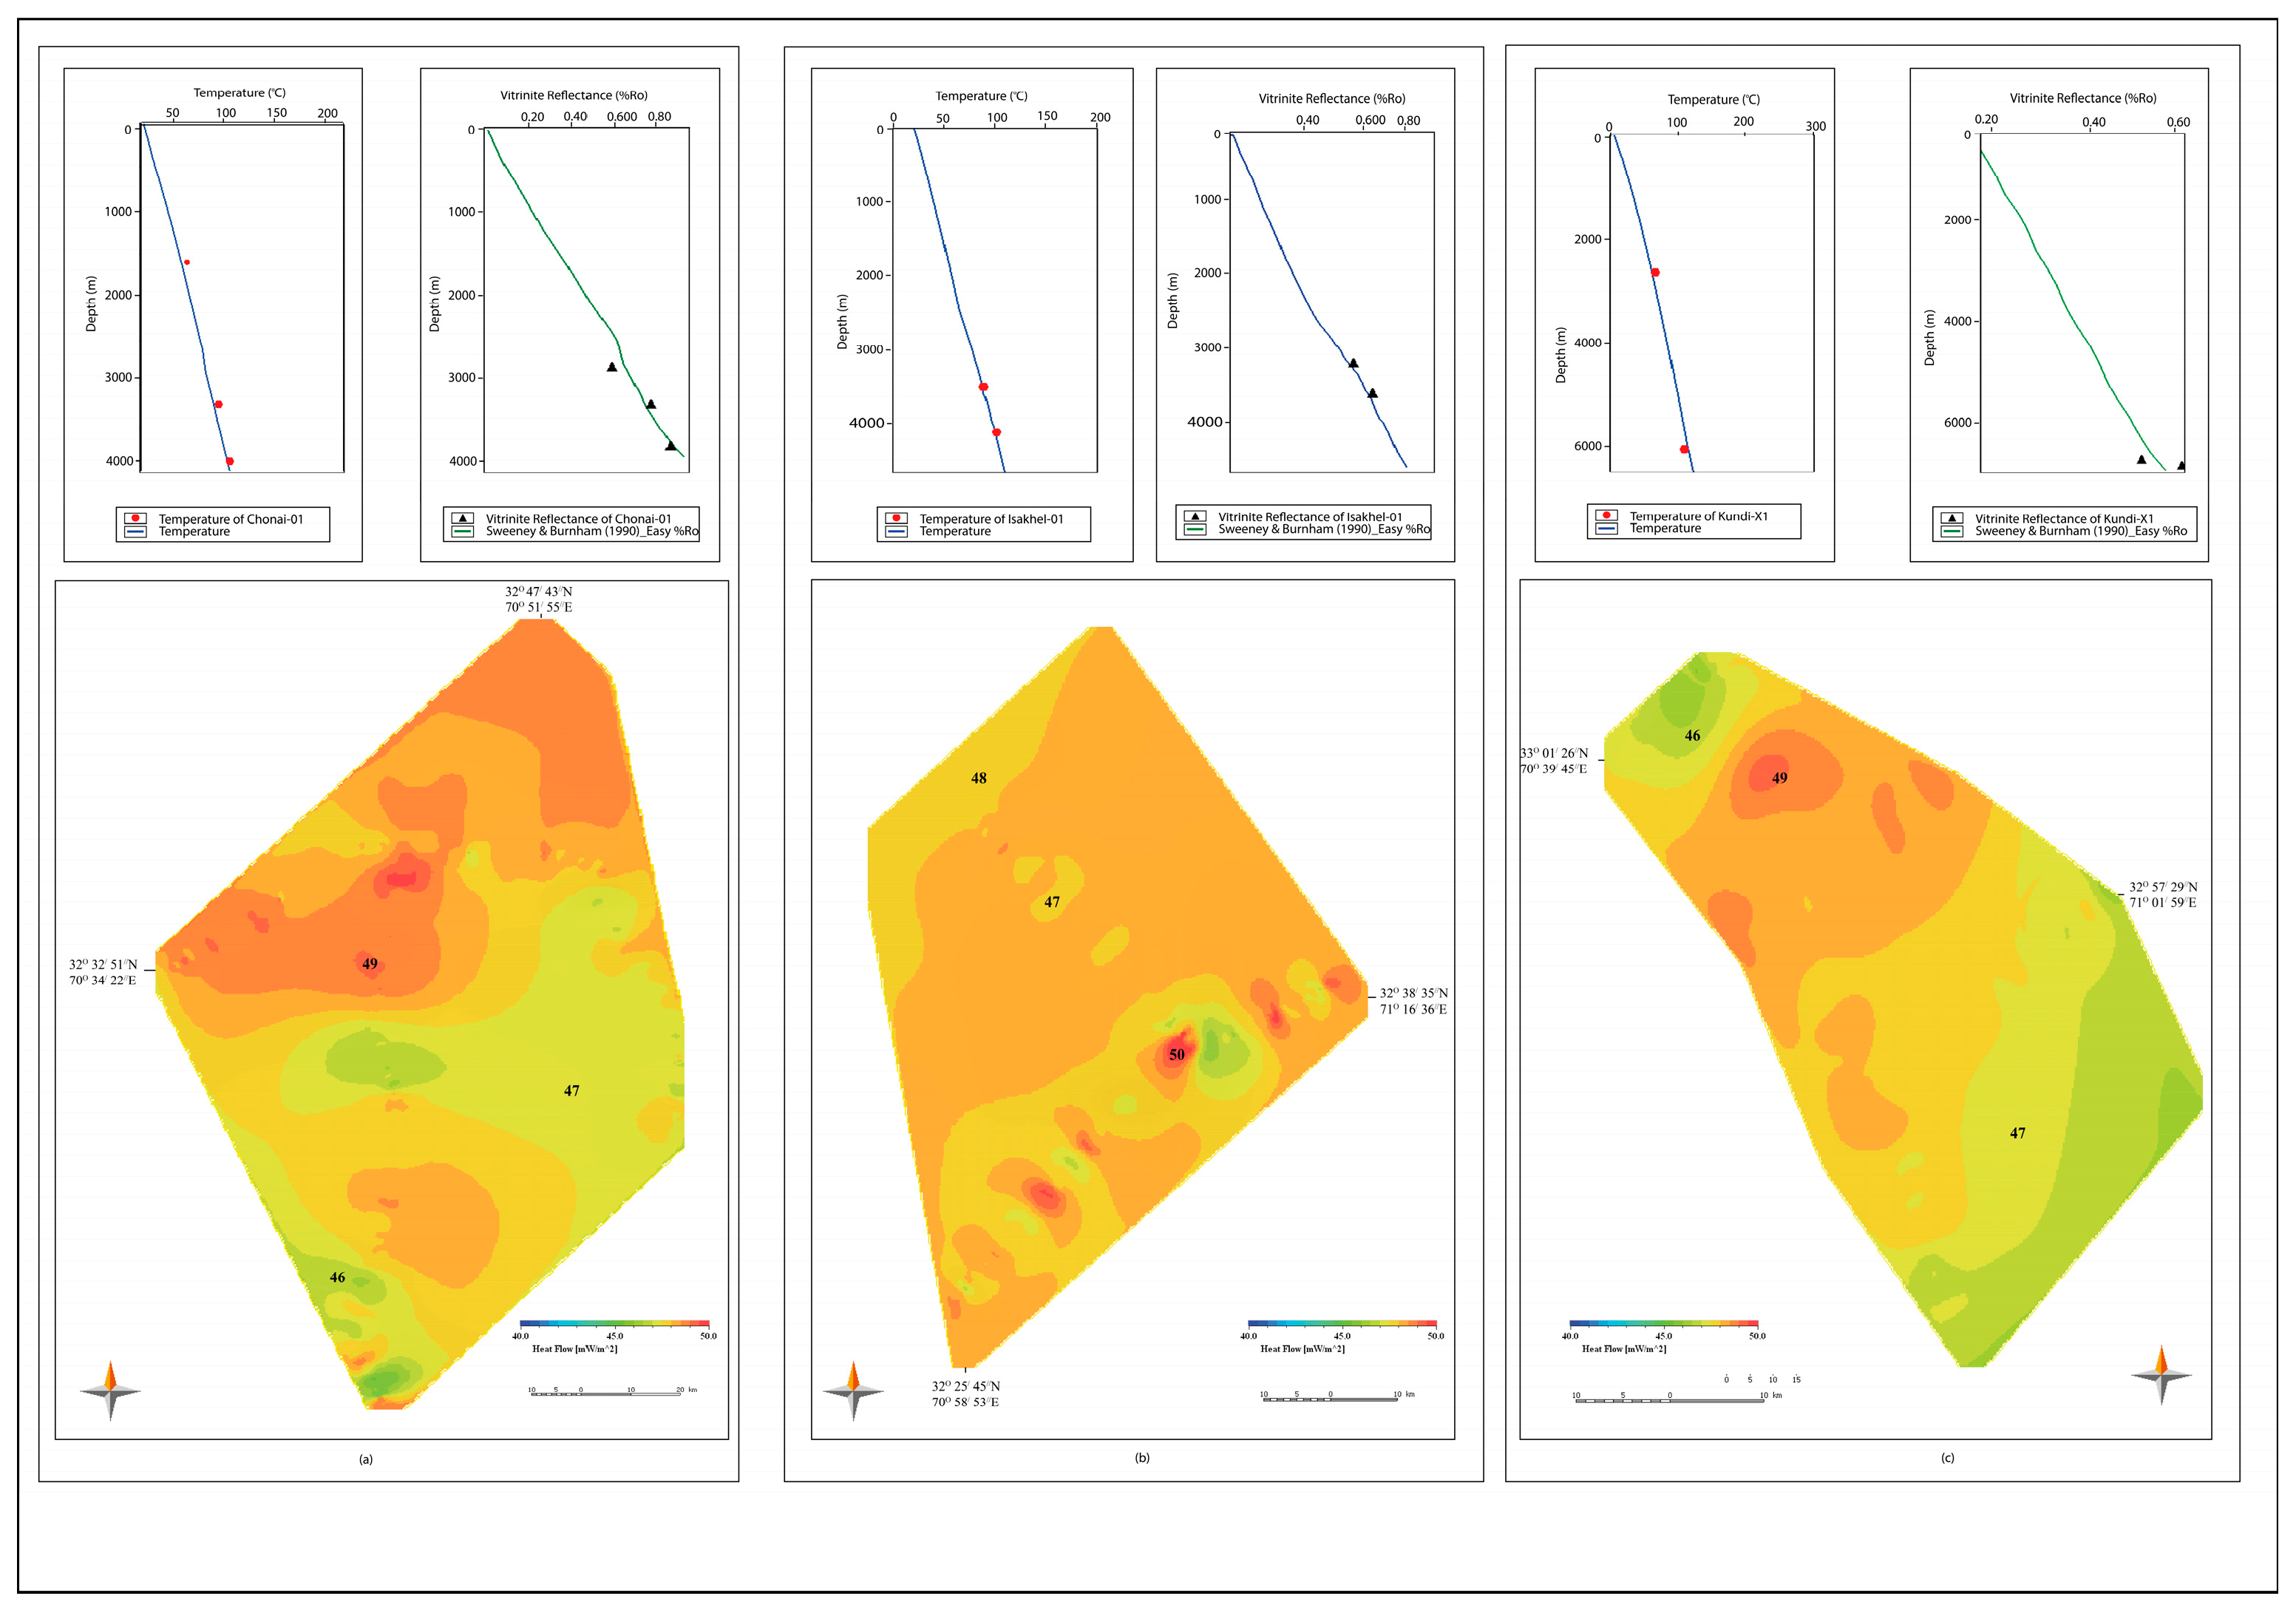
The heat flow models were thermally calibrated against measured vitrinite reflectances derived from geochemical reports [30] of the studied wells and previous studies via the [64] kinetic model. The heat flow calibration tool (PetroMod software) was used to best fit the calculated values and the measured vitrinite reflectance data. Further, the calculated heat flow maps were exported into PetroBuilder 3D and assigned as boundary conditions. The many simulations for the good fit between the measured and calculated values of the vitrinite reflectance enhanced the accuracy of the modeling results of this study. The heat flow ranged from 40 to 50 mW/m2 (±2 mW/m2), showing a good thermal calibration with the vitrinite reflectance data. The validated maturity modeling was used to identify the potential and physical states of the preserved hydrocarbons in each source rock via the chemical kinetic model [64]. Furthermore, the transformation ratios (TR%) were used to estimate the timing of hydrocarbon generation and expulsion. For this purpose, a 10% TR was used to assess the timing of early oil generation and a 50% TR was considered to define peak oil generation in which the hydrocarbons reached their expulsion stage in source rocks [59].
Lastly, the migration of the hydrocarbons was calculated via the hybrid (Darcy and flow path) method. The capillary pressures for the petroleum–water system were considered based on defined lithological distributions in each formation at numerous porosities using the bilinear interpolation scheme (Table 2) [58,59]. Hence, the bilinear interpolation is helpful in cellular grid modeling to handle complex geometries. In basin modeling, the primary migration in source rock and secondary migration in reservoir and carrier rocks is considered the same as hydrocarbon migration collectively based on the free pore spaces [59]. The migration pathways were generated based on the permeability of the lithological units with geometric variations.

5. Results and Discussions

5.1. Burial History

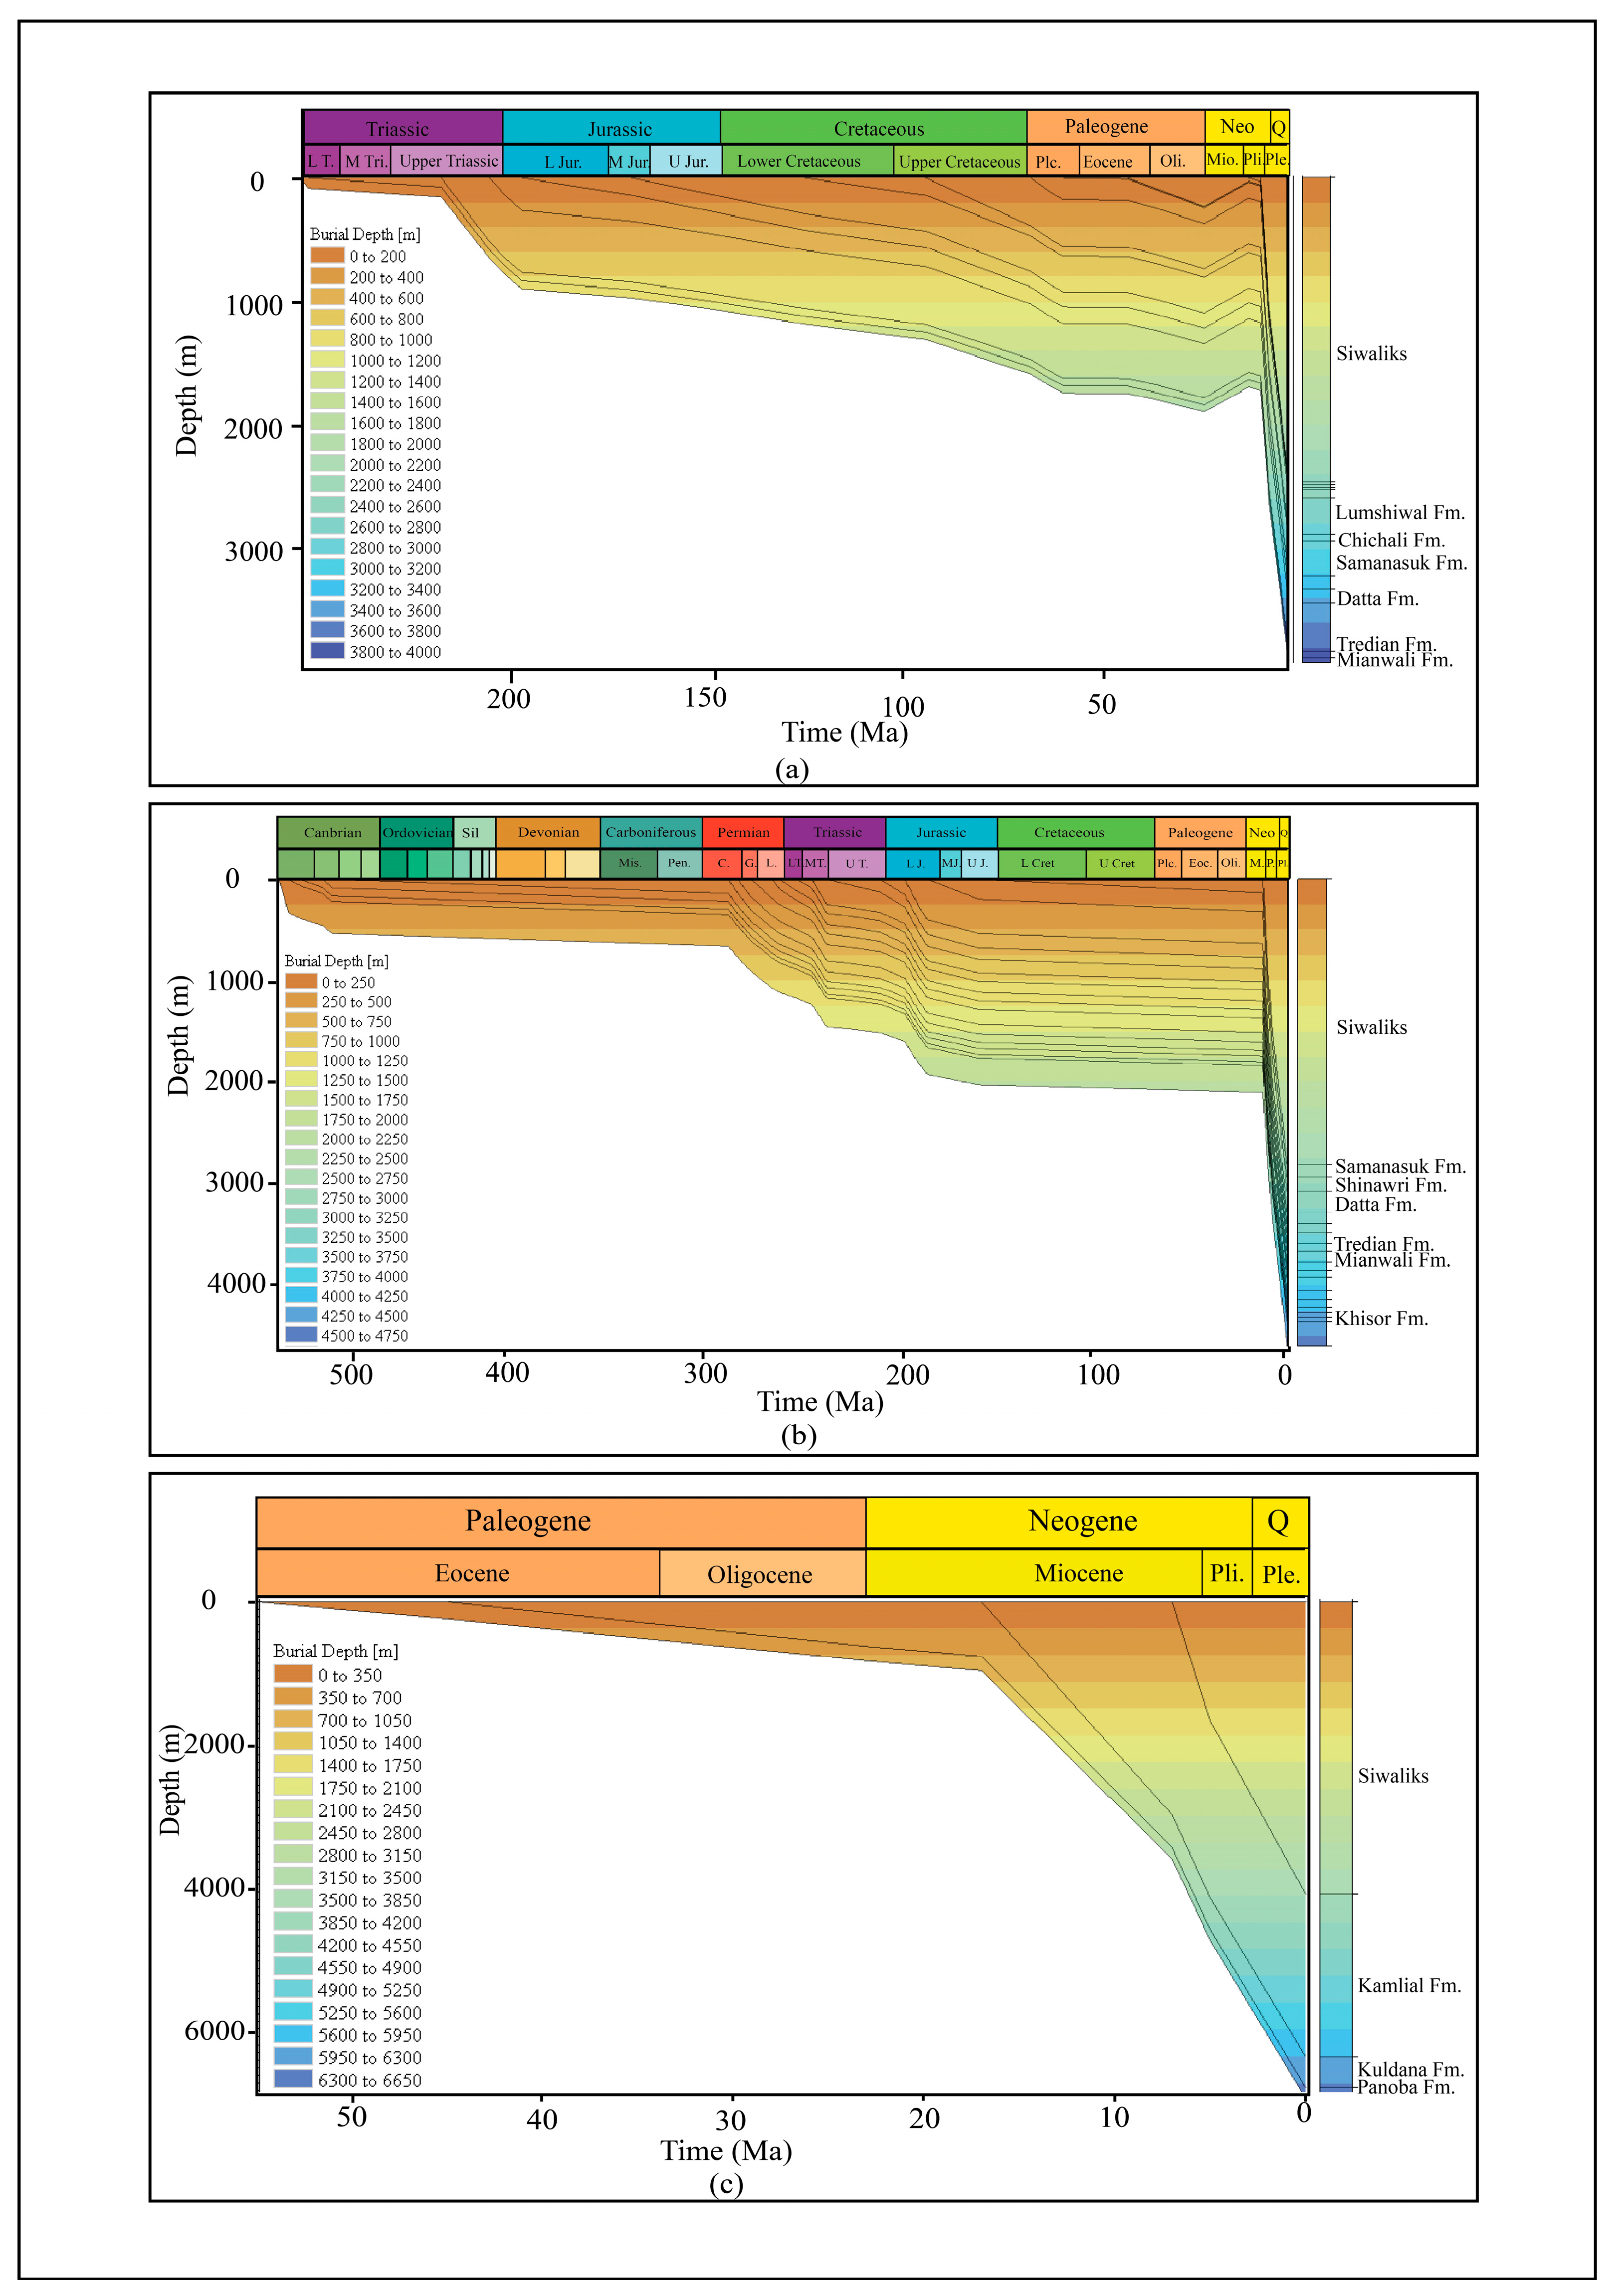
The burial history plots of the Chonai-01 well, Isa Khel-01 well, and Kundi-X1 well were generated to understand the geohistory of the basin development in all the zones. In the Southwestern zone, the Chonai-01 well was drilled up to 3900 m, and the Mianwali Formation of the Lower Triassic was encountered at the base (Figure 4a). During the Jurassic age, the Datta Formation, Shinawari Formation, and Samanasuk Formation were deposited. The deposition of the Jurassic formations generated the overburden in this part of the basin, which resulted in subsidence. Until that time, the basin reached a thickness of up to 1000 m. During the Lower and Upper Cretaceous, the Chichali and Lumshiwal formations were deposited, and the basin reached a depth of up to 1800 m. The sediment deposition was continuous until the Paleogene, which increased the thickness of the basin by 500 m. However, from the Miocene to the Recent age, the basin experienced major subsidence and uplift due to abrupt and higher depositions (approximately 2000 m) of the Murree Formation, Kamlial Formation, and Siwaliks. Based on the conceptual model, it is interpreted that the uplift was due to the upward movement of salt in this zone, whereas abrupt and high deposition increased the burial depth by almost 4000 m in this part of the basin.
In the Southeastern zone, the Isa Khel-01 well was used to understand the burial history of this zone. The well was drilled up to 4700 m, and Khewra sandstone of the Cambrian age was encountered at the bottom. During the period of the Cambrian to the Carboniferous age, the Kussak, Jutana, Khisor, and Dandot formations were deposited (Figure 4b). Due to the deposition, the basin reached a depth of 700 m. Furthermore, the Permian and Triassic formations were deposited, which increased the subsidence, and the basin reached a depth of 2000 m. During the Jurassic depositions, the basin was buried to a depth of 2400 m. In the Oligocene, the basin experienced an uplift which might have been due to the influence of the Salt Range Formation at the base of the basin. The burial model indicates a rapid, high, and abrupt sedimentation (almost 1900 m) from the Miocene to Recent times. This high sedimentation rate is due to the deposition of Rawalpindi and Siwalik deposits from the north as a result of the formation of Himalayan orogeny. The basin deposited up to the depth of 4700 m.
In the Northeastern zone, the Kundi-X1 well was studied and was drilled up to a depth of 6400 m (Figure 4c). The higher rate of these formations buried the basin up to 5500 m deep, whereas the Panoba Formation and the Kuldana Formation of the Eocene age were deposited up to a depth of 910 m during the basin filling. The higher depositional rates of Miocene and Quaternary sediments were also the result of the Himalayan orogeny during the collision of the Indian and Eurasian plates. This zone of the basin has been under the major influence of these formations. It is assumed that the complete sequences of Cambrian to Cretaceous rocks might also be buried at higher depths encountered in the Southeastern and Southwestern zones of the Bannu Basin.

5.2. Basin Architecture

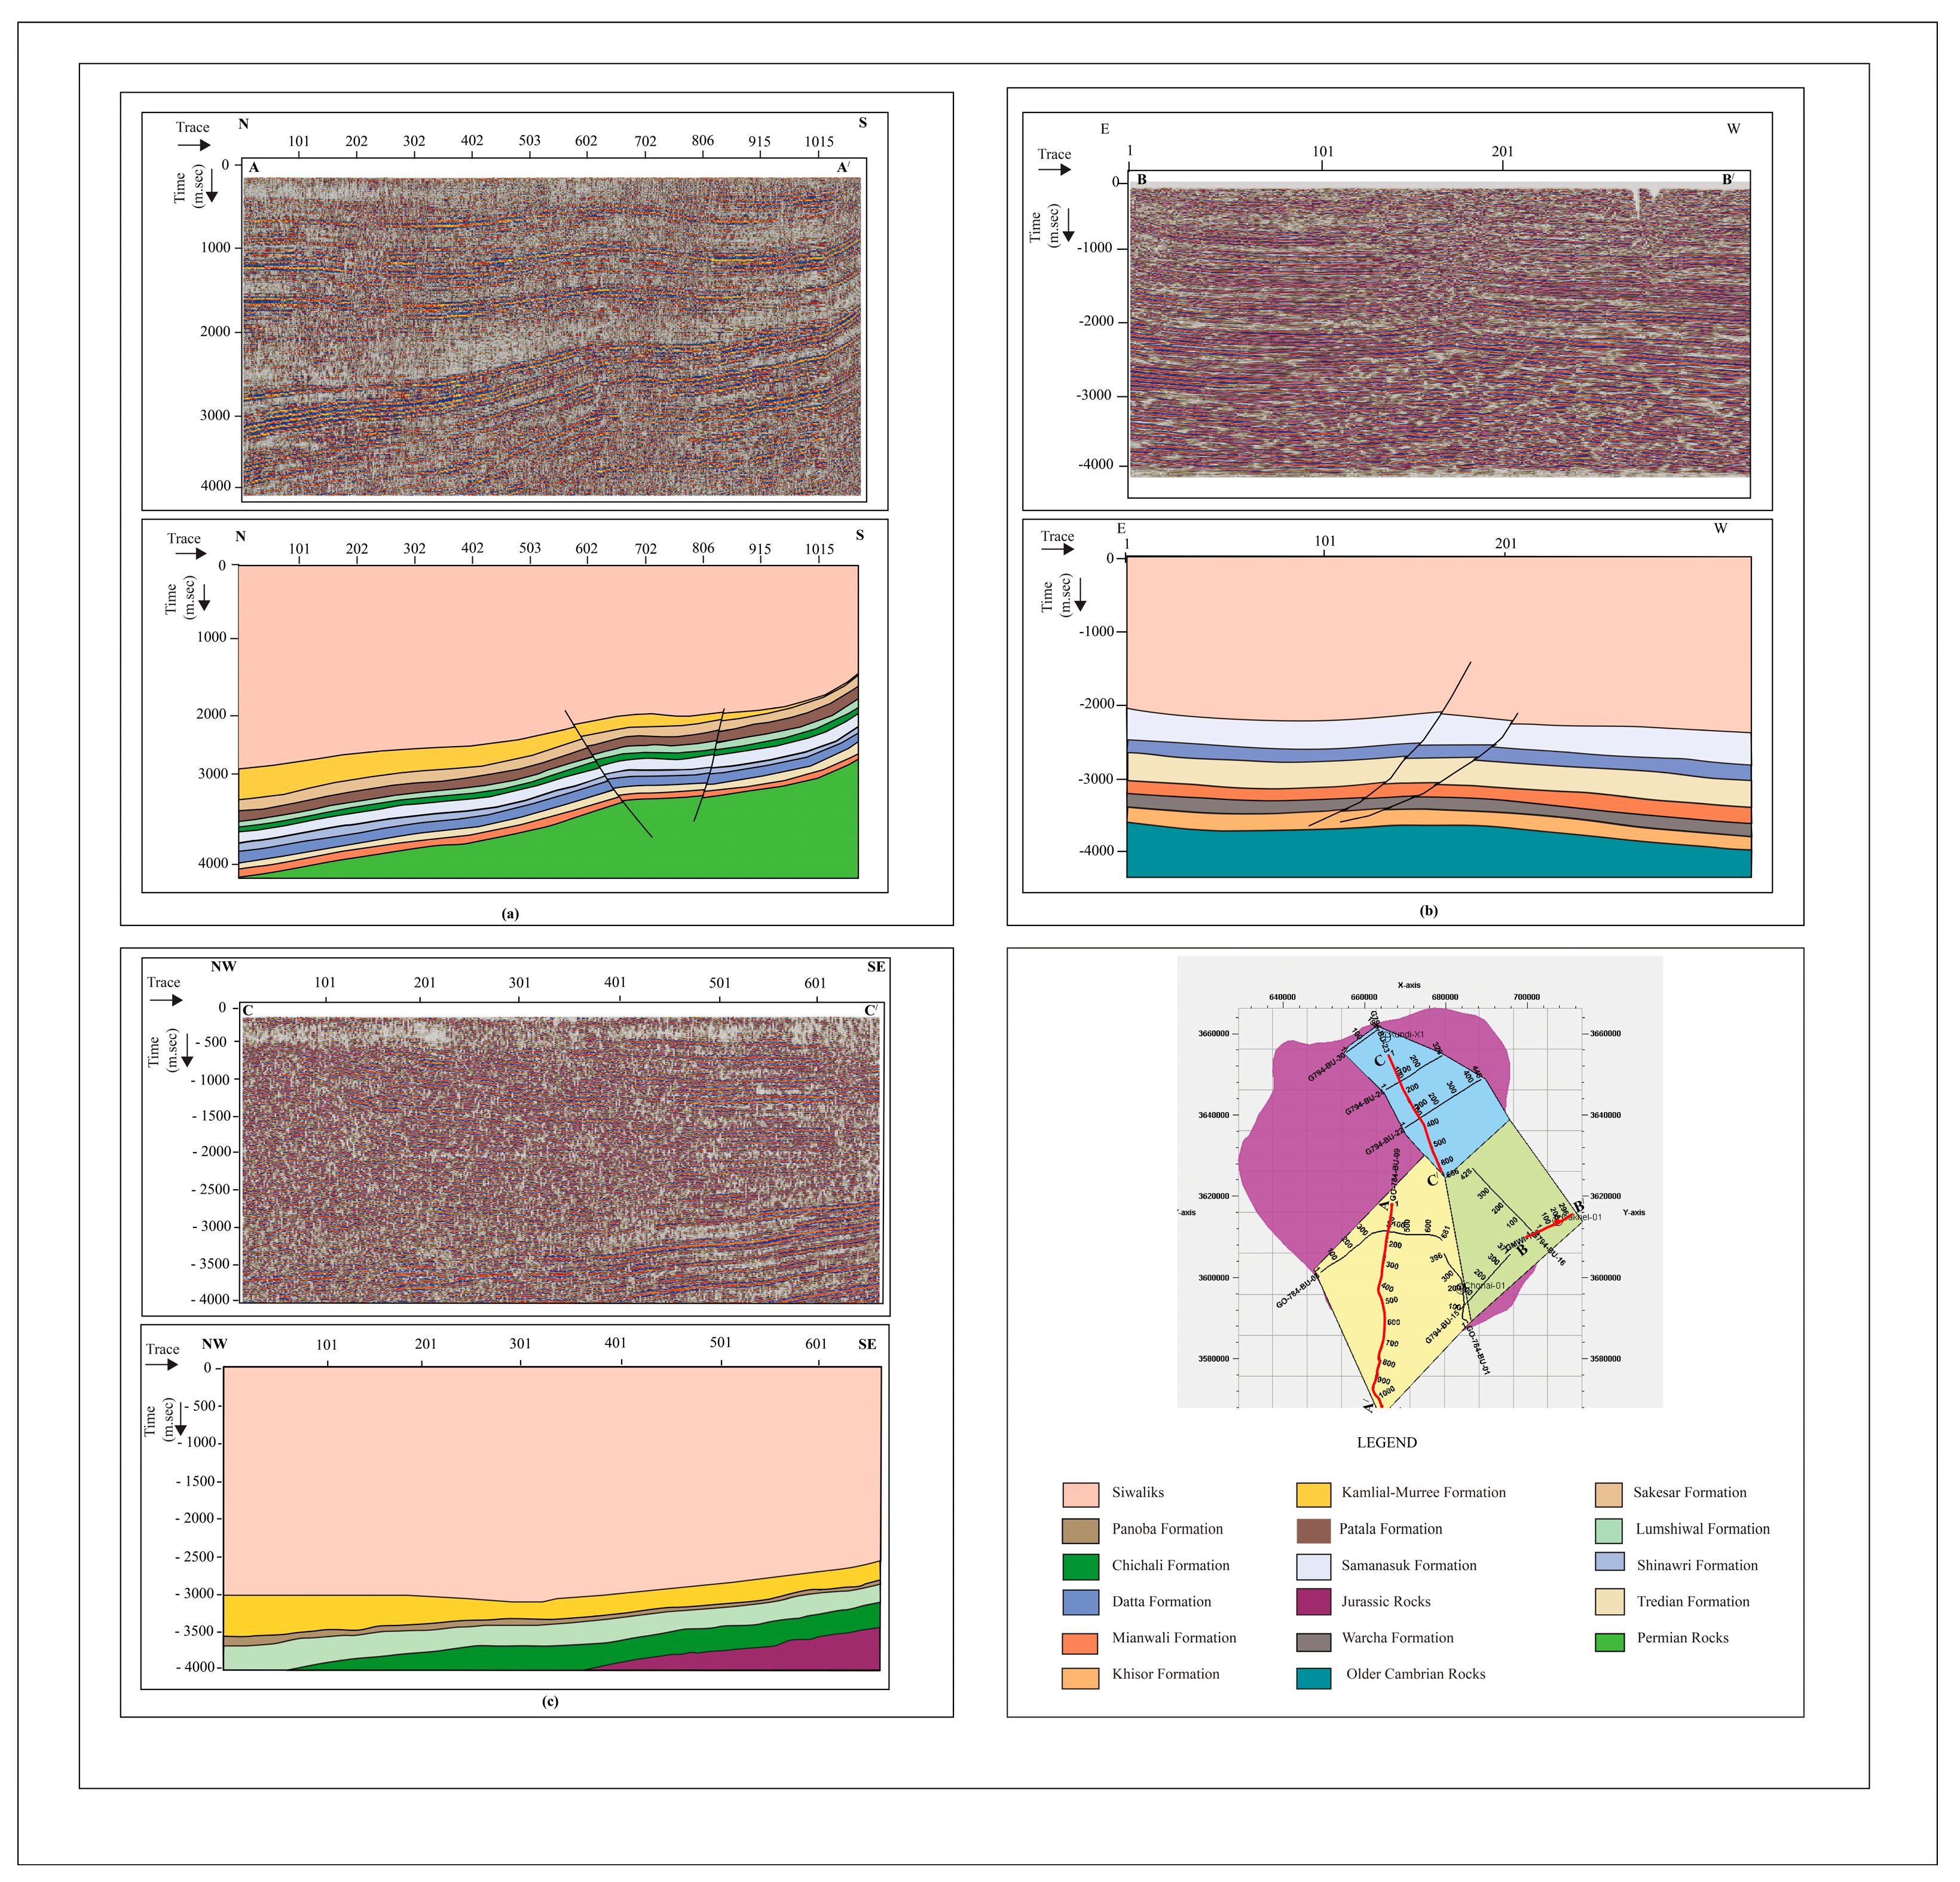
Seismic interpretation helped to generate the subsurface imaging of the three studied zones. The subsurface interpretation was based on the selected formations which contribute to the petroleum system (source, reservoir, seal, and overburden rocks) of the study area. In the Southwestern zone, the regional 2D seismic line A-A′ (Figure 5a) with a Northeast to Southwest profile is discussed. This zone is bounded by the Marwat and Pezu–Bhittani Ranges toward its Southwest. In this zone, the Chonai-01 well was drilled, and the Mianwali Formation of the Triassic age was encountered at its maximum depth. The Mianwali Formation was interpreted at the base of the seismic section deposited over the Permian rocks. The parallel to sub-parallel continuous seismic reflectors were categorized to interpret the Mianwali Formation having continuous reflections on the top of the formation. The continuous reflectors indicate the occurrence of Tredian Formation sandstone, whereas the Jurassic age Datta Formation was interpreted on top of the Triassic rocks. The shales of the Datta Formation can act as the source rock for the overlying Shinawari Formation and Samanasuk Formation. These formations were interpreted as sub-parallel to parallel seismic reflections. Moreover, the Samanasuk Formation is interpreted on the basis of parallel high-amplitude reflections due to the presence of massive carbonates in the formation. The Chichali Formation of the Cretaceous age is interpreted on top of the Samanasuk Formation. It is considered another source rock in this zone. The overlying Lumshiwal Formation is the reservoir rock of this formation, whereas the Patala Formation is the source rock of the Paleocene age in this zone. These clastic sedimentary rocks are interpreted based on parallel seismic reflections with weak to moderate amplitudes. The Sakesar Formation overlies the Patala Formation and acts as the reservoir rock. The Miocene to Recent sequence is present on top of the Sakesar Formation. The Miocene–Recent Murree Formation, Kamlial Formation, and Siwaliks were interpreted based on parallel to sub-parallel seismic reflections. The conglomerate beds in the Siwaliks are indicated with brighter reflections in the seismic section. Overall, in this zone, the sequences are deformed and inclined toward its south. It is interpreted that the uplift of the southern part is due to the presence of a right lateral transpressive fault along the Pezu Bhittani Ranges. Moreover, it is assumed that this uplift might be the cause of the salt diapirism of the Salt Range Formation (SRF). Hence the SRF is also encountered in Marwat 01 well at about 2200 m.
The Southeastern zone of the research is at the western border of the Potwar Basin. The regional 2D seismic line B-B′ (Figure 5b) trending west to east is discussed for this zone. The Isa Khel-01 well was used to interpret horizons as this well is the deepest well drilled up to the Cambrian age. The late Cambrian Khisor Formation was the source of Permian reservoirs. It was categorized by parallel to sub-parallel continuous reflectors on the seismic section. The Triassic-age Mianwali Formation is also considered the source of the Triassic Tredian Formation and Kingriali Formation reservoirs. It was interpreted as parallel to sub-parallel reflectors with carbonate occurrences at the top, which are indicated by the bright seismic reflections. Moreover, the Datta shales of the Jurassic age could be the kitchen of Jurassic-age reservoirs. These reservoirs were characterized as sub-parallel to parallel strong seismic reflections. Furthermore, the Cretaceous–Miocene formations are missing, as indicated by the drilled well in the study area. Truncated reflectors on Jurassic formations indicated the unconformity in the zone. The thick deposits of intraformational shales can act as seal-provided overburden of Siwaliks of the Pleistocene age. The studied 2D seismic profile indicates that the area is under the influence of thrust faults and popup structures with compressional tectonics which might be due to the anti-clockwise strike-slip movement of the Kalabagh Fault (KF), followed by the Himalayan orogeny.
The Northeastern zone majorly consists of the deposition of Siwaliks which was due to the transportation of sediments from the Higher Himalayas toward the south. The Kundi-X1 well, which is the deepest well in this zone, also indicates the thickness of the Siwaliks (almost 3.8 km). The Murree and Kamlial formations of the Miocene age were transported from the Higher Himalayas and were encountered in thicknesses of almost 2 km in the well. The seismic reflections indicate the thinning of the formations toward the south. Moreover, the well was drilled up to 6.4 km, at which point the Panoba Formation of the Eocene up to the Recent sequence was encountered. By using seismic reflections of weak to moderate amplitudes below the Eocene formations, the Cretaceous age Chichali Formation and Lumshiwal Formation were interpreted in the seismic section (Figure 5c). In this zone, the Chichali and Panoba Formations are the major source rocks for the Lumshiwal and sands of Murree Formation reservoirs, respectively. Furthermore, the shale of the Murree Formation can act as a seal rock in the study area. The high and abrupt deposition of Siwaliks and their overburden can mature the source rocks, which helps in the kerogen conversion into hydrocarbons.
Overall, the seismic interpretation indicates over-thrusted thin-skinned tectonics in all the zones of the study area, which might be due to the collision of the Indian and Eurasian plates. Furthermore, the existence of Precambrian evaporites supports the tectonic features along the decollement zone toward the extreme south and resulted in the Trans Indus Ranges and Salt Range.

5.3. Heat Flow and Thermal History Modeling

The heat flow values were acquired from the thermal conductivities of the rock units and subsurface geothermal gradients, calculated from the present-day corrected temperatures measured in different wells. These values were calibrated with thermal maturity parameters, such as vitrinite reflectance [65,66,67,68,69,70,71,72]. The 3D maps were generated based on the best fit results of the measured vitrinite reflectance (VR) and temperature data with the modeled temperature and VR data curves. In this study, basal heat (crust) and radiogenic heat were considered the major sources of modeled heat flow. Hence, no local igneous activities and hydrothermal veins were previously identified in the region. Based on the above scenarios, the heat flow ranged from 40 to 50 mW/m2 in the study area (Figure 6). Models of all different geological ages are not represented here. The discussed models indicate variations in the basal heat flow in all the studied zones. In the Southwestern zone, the increase in the temperature gradient occurs up to 27 °C/km. The Southeastern zone has an increase in temperature with depth of 25 °C/km, whereas the Northeastern zone has a temperature gradient of 18 °C/km. The temperature gradient is low in the Northeastern zone compared to the other zones due to the rapid and high sedimentation of the Rawalpindi Group and Siwaliks deposits of almost 6 km. The Southwestern zone (49 mW/m2) and Southeastern zone (50 mW/m2) have high heat flow trends toward the north. The high heat flow anomalies identified in the Southeastern zone might be due to the impact of salt in its base. The thermal conductivity of salt is higher, which contributes to the increase in heat flow in the south of the Southeastern zone. Furthermore, the Northeastern zone has basal heat flow ranges (46–49 mW/m2). Locally, erosion and rapid sedimentation increase the heat flow to the deeper central part of the basin in this zone, which might be induced by deep processes (mantle or crust).
Active tectonics likely played vital role in the increase in heat flow in the area.

5.4. Petroleum System Modeling

The generation of hydrocarbons is majorly dependent on the thermal maturity of the organic matter in the source rocks. The linear profile of the vitrinite reflectance data indicates the burial-driven diagenesis of the organic matter in all zones. In this research, the 2D and 3D profiles were incorporated to understand the lateral and vertical source rock maturity, kerogen transformation ratio, and timing of hydrocarbon expulsion in each zone. However, due to the challenging nature of this calibration, there is also always a chance of model accuracy. Despite these challenges, the 2D and 3D models still provide valuable information regarding hydrocarbon generation and migration and accumulation processes based on various scenarios generated in boundary conditions and simulations. The current models were finalized on the most acceptable scenario based on the calibration data.
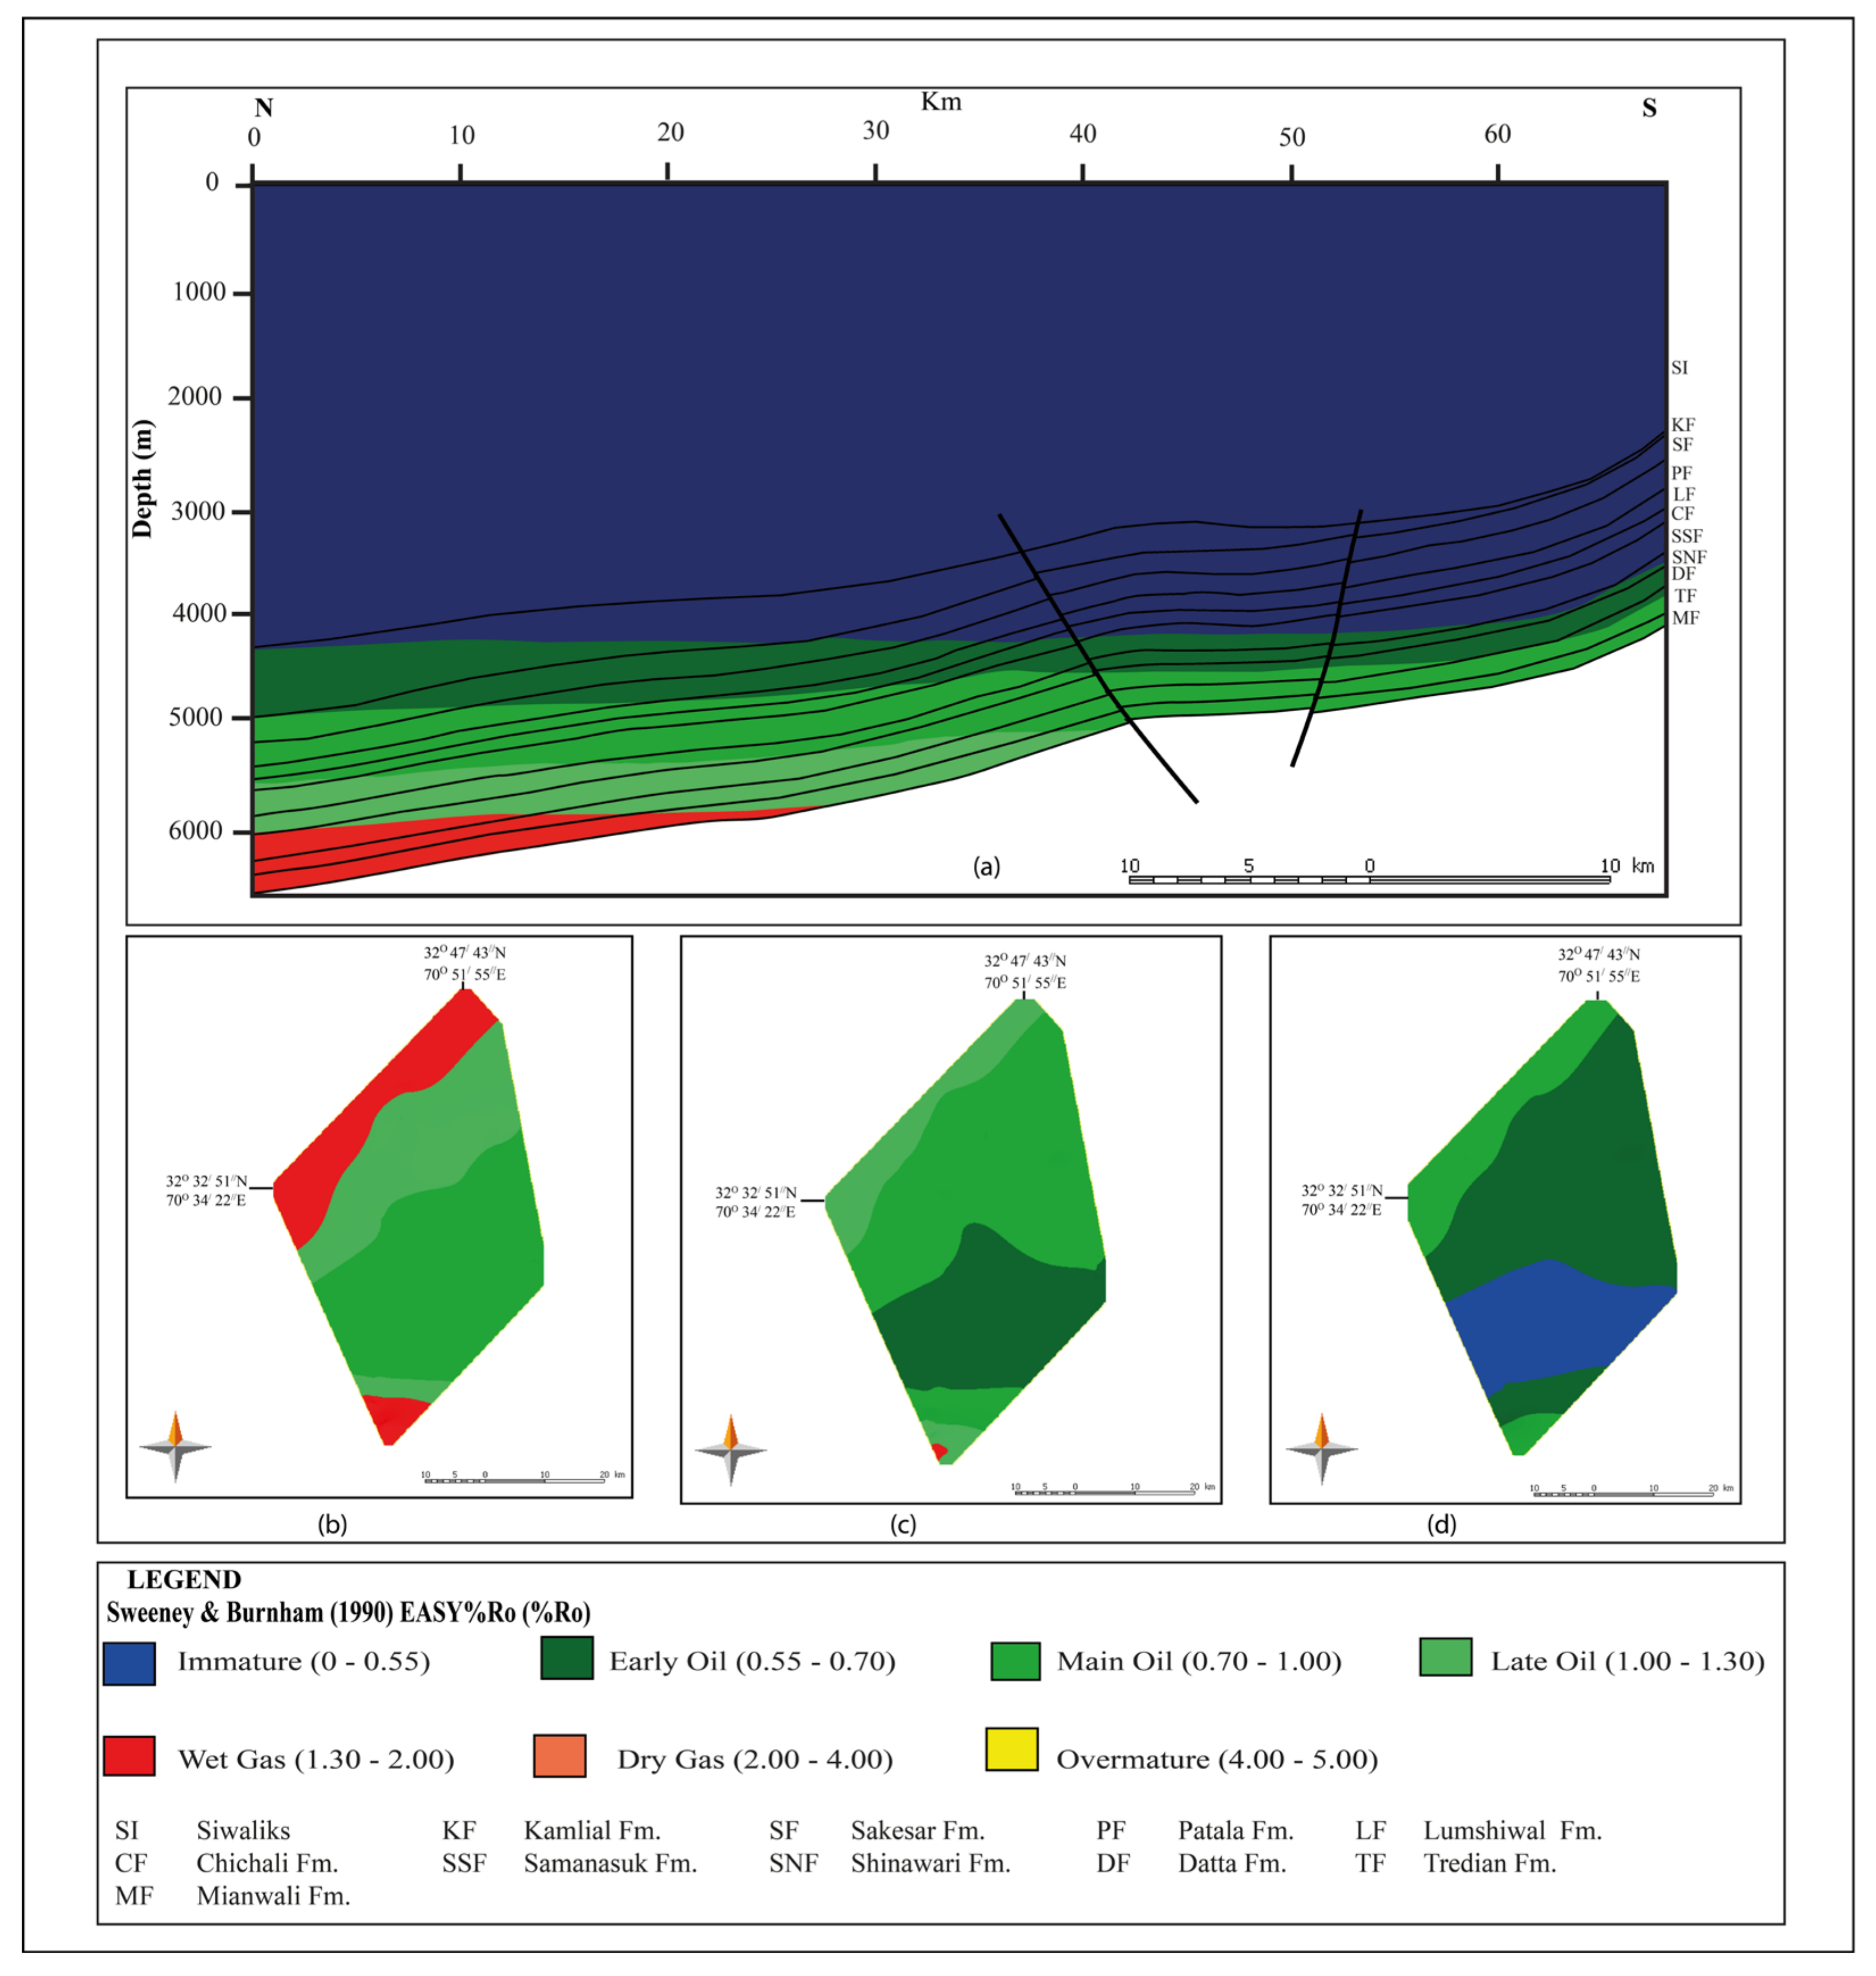
In the Southwestern zone, the 2D and 3D maturity models suggest that all three source rocks entered the hydrocarbon generation window (Figure 7). The 2D profile indicates that Triassic Mianwali Formation has the potential to generate main oil (0.70–1.00%VR) in its shallower part toward the south of the study area and enters the wet gas (1.30–2.00%VR) window toward its deeper northern part (Figure 7a). In contrast, the plan view indicates the formation reaches the main oil window and enters the late oil (1.00–1.30%VR) to wet gas window toward its deeper part (Figure 7b). The Datta Formation of the Jurassic age attained a majorly late to main oil window toward the deepest part and an early oil window toward the shallowest part (Figure 7c). The aerial view of this formation also indicates the increase in maturity toward the higher depth. The Chichali Formation is majorly immature toward the south of the study area; however, it enters into early and main oil windows toward the deeper part of the Southwestern zone (Figure 7d).
On the other hand, the thermal maturity in the Southeastern zone of the three source rocks (Figure 8a), namely, the Khisor Formation (Figure 8b), Mianwali Formation (Figure 8c), and Datta Formation (Figure 8d), was analyzed. The Khisor Formation enters a wet gas window toward the western part of the study area, whereas the plan view indicates that it majorly attains a late oil window. The Datta Formation is mostly immature and reaches up to an early oil window toward the deeper part of the studied zone.
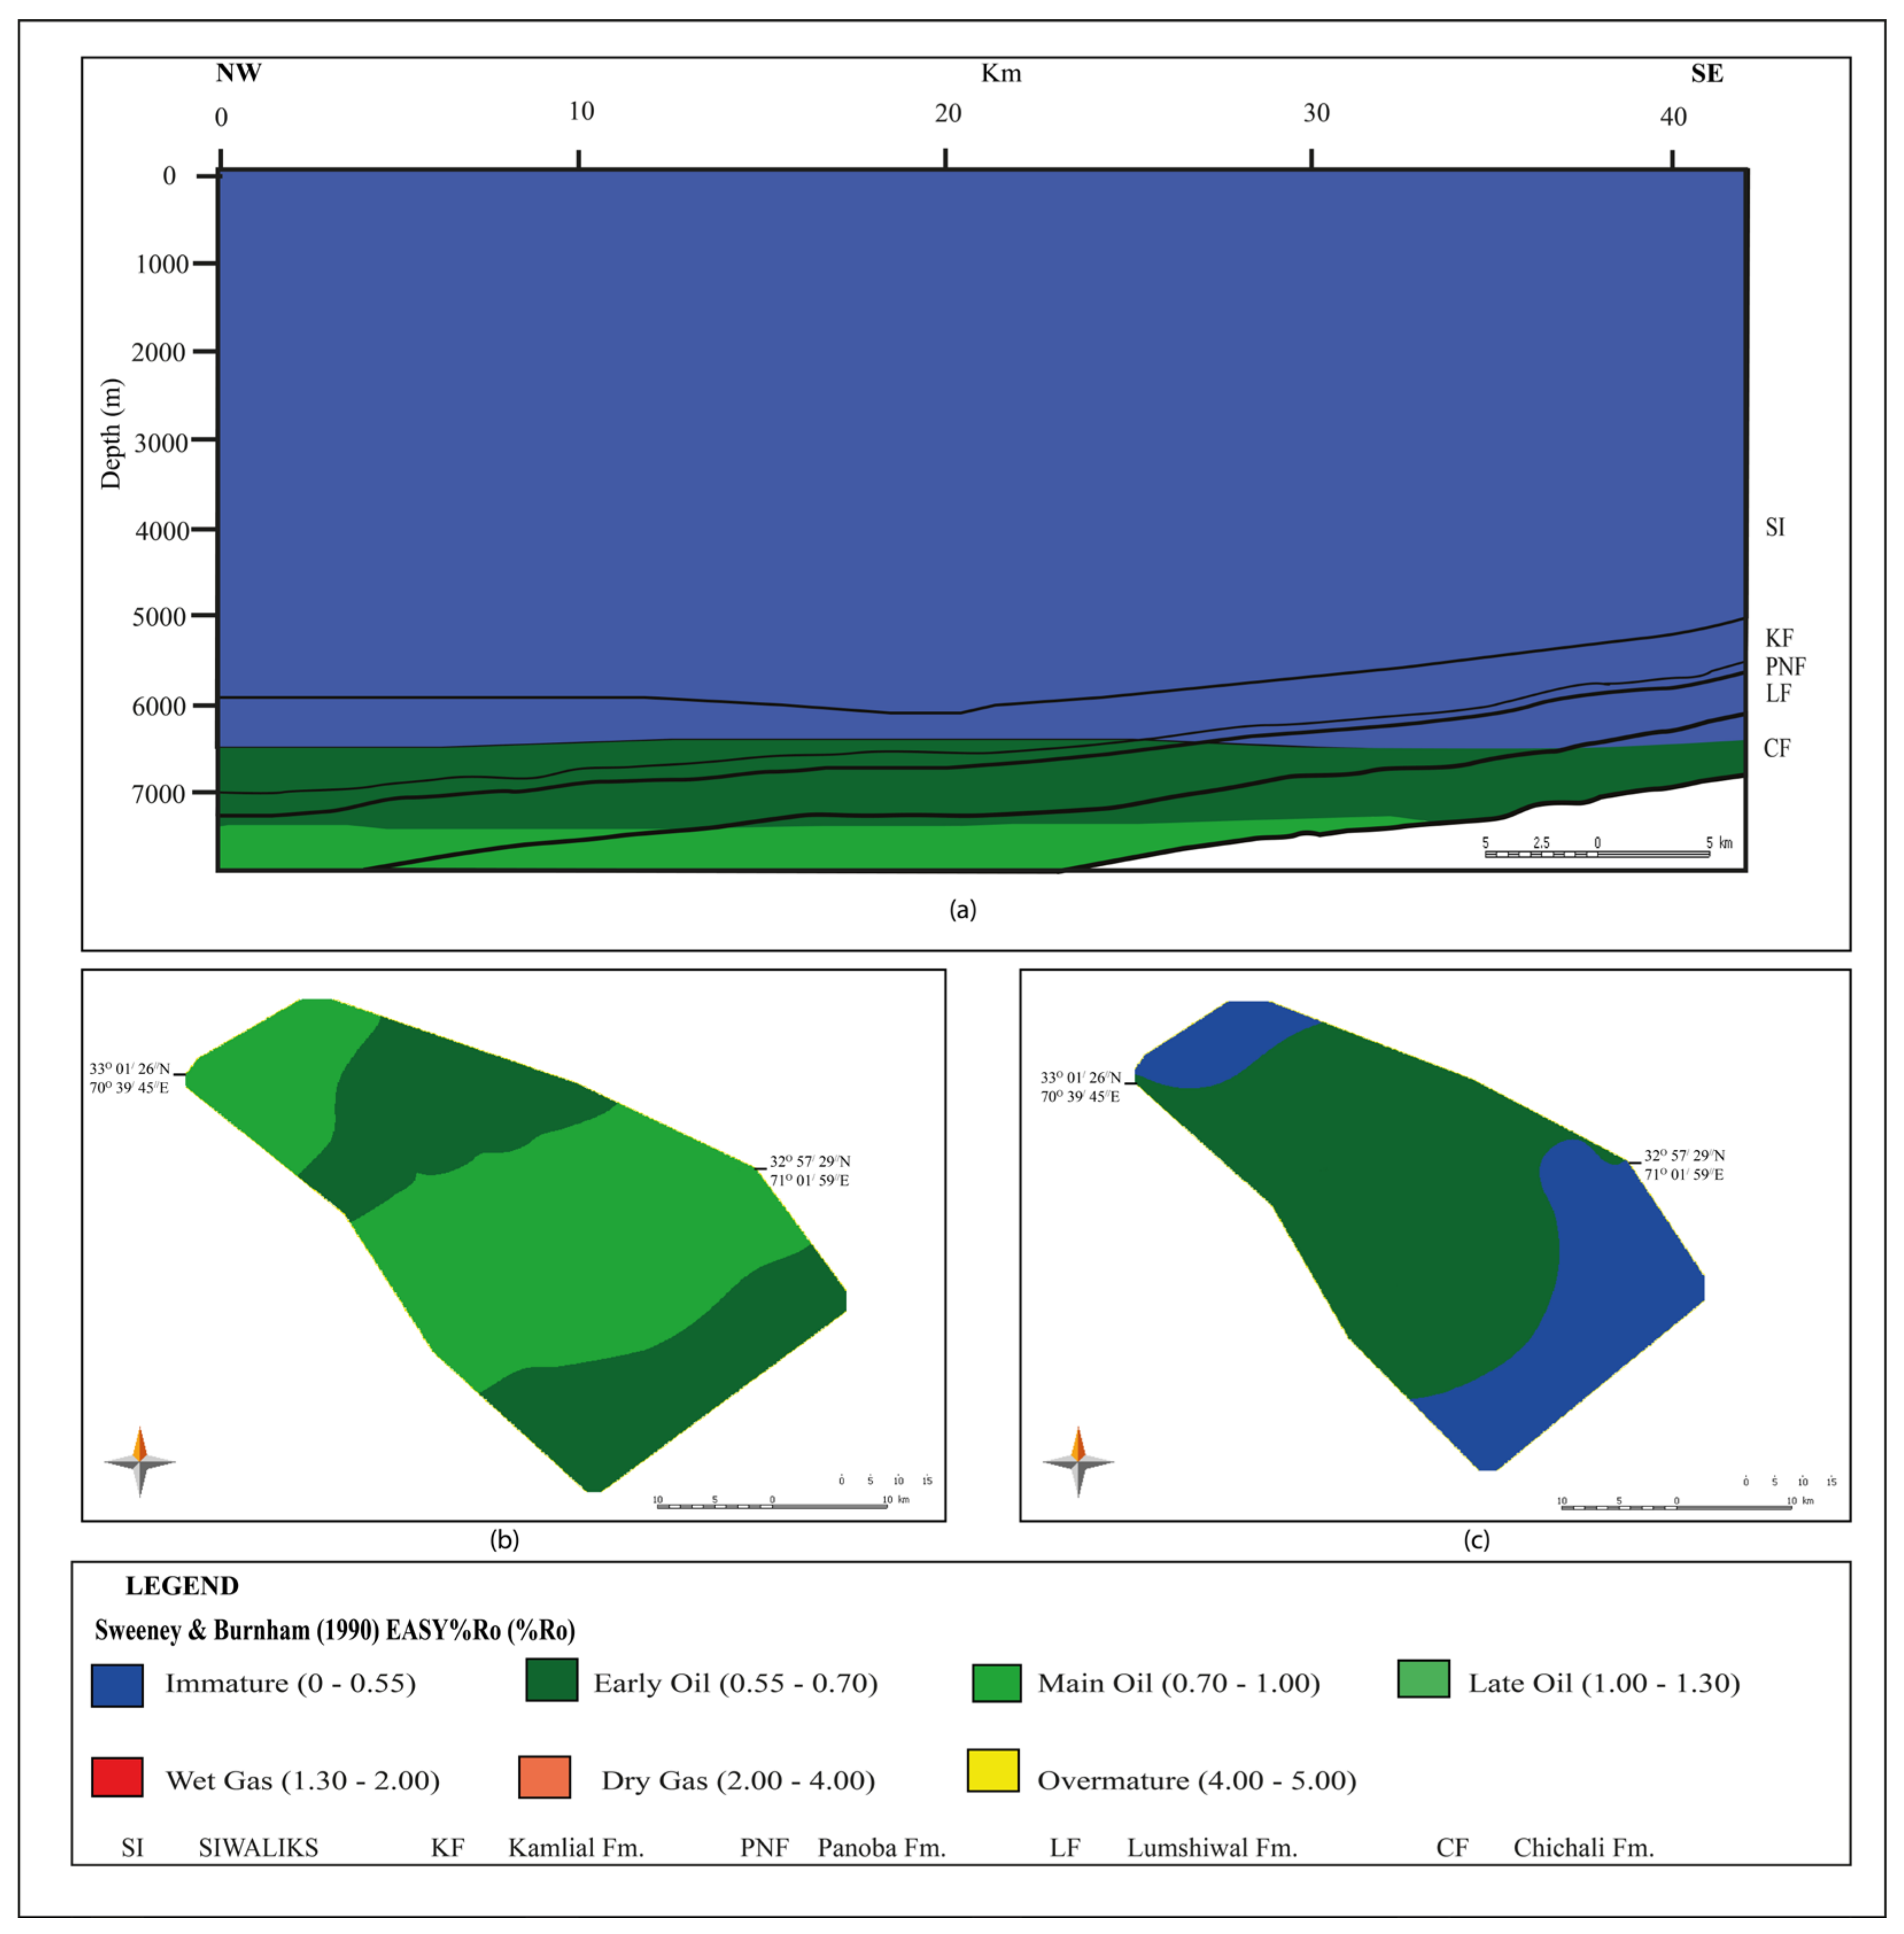
Lastly, the Chichali Formation and Panoba Formation were studied as potential source rocks in the Northeastern zone of the Bannu Basin (Figure 9a). The thermal maturity model indicates the Chichali Formation enters the main oil to the early oil window (Figure 9b), whereas the Panoba Formation attains the early oil window toward its deeper part (Figure 9c). The Chichali Formation was deposited during the passive margin basin before the collision of the Indian and Eurasian plates; however, the Northeastern zone entered the maturity window after the collision due to the higher sedimentation rate and abrupt sedimentation of Neogene sediments, which increased the overburden pressure and temperature.
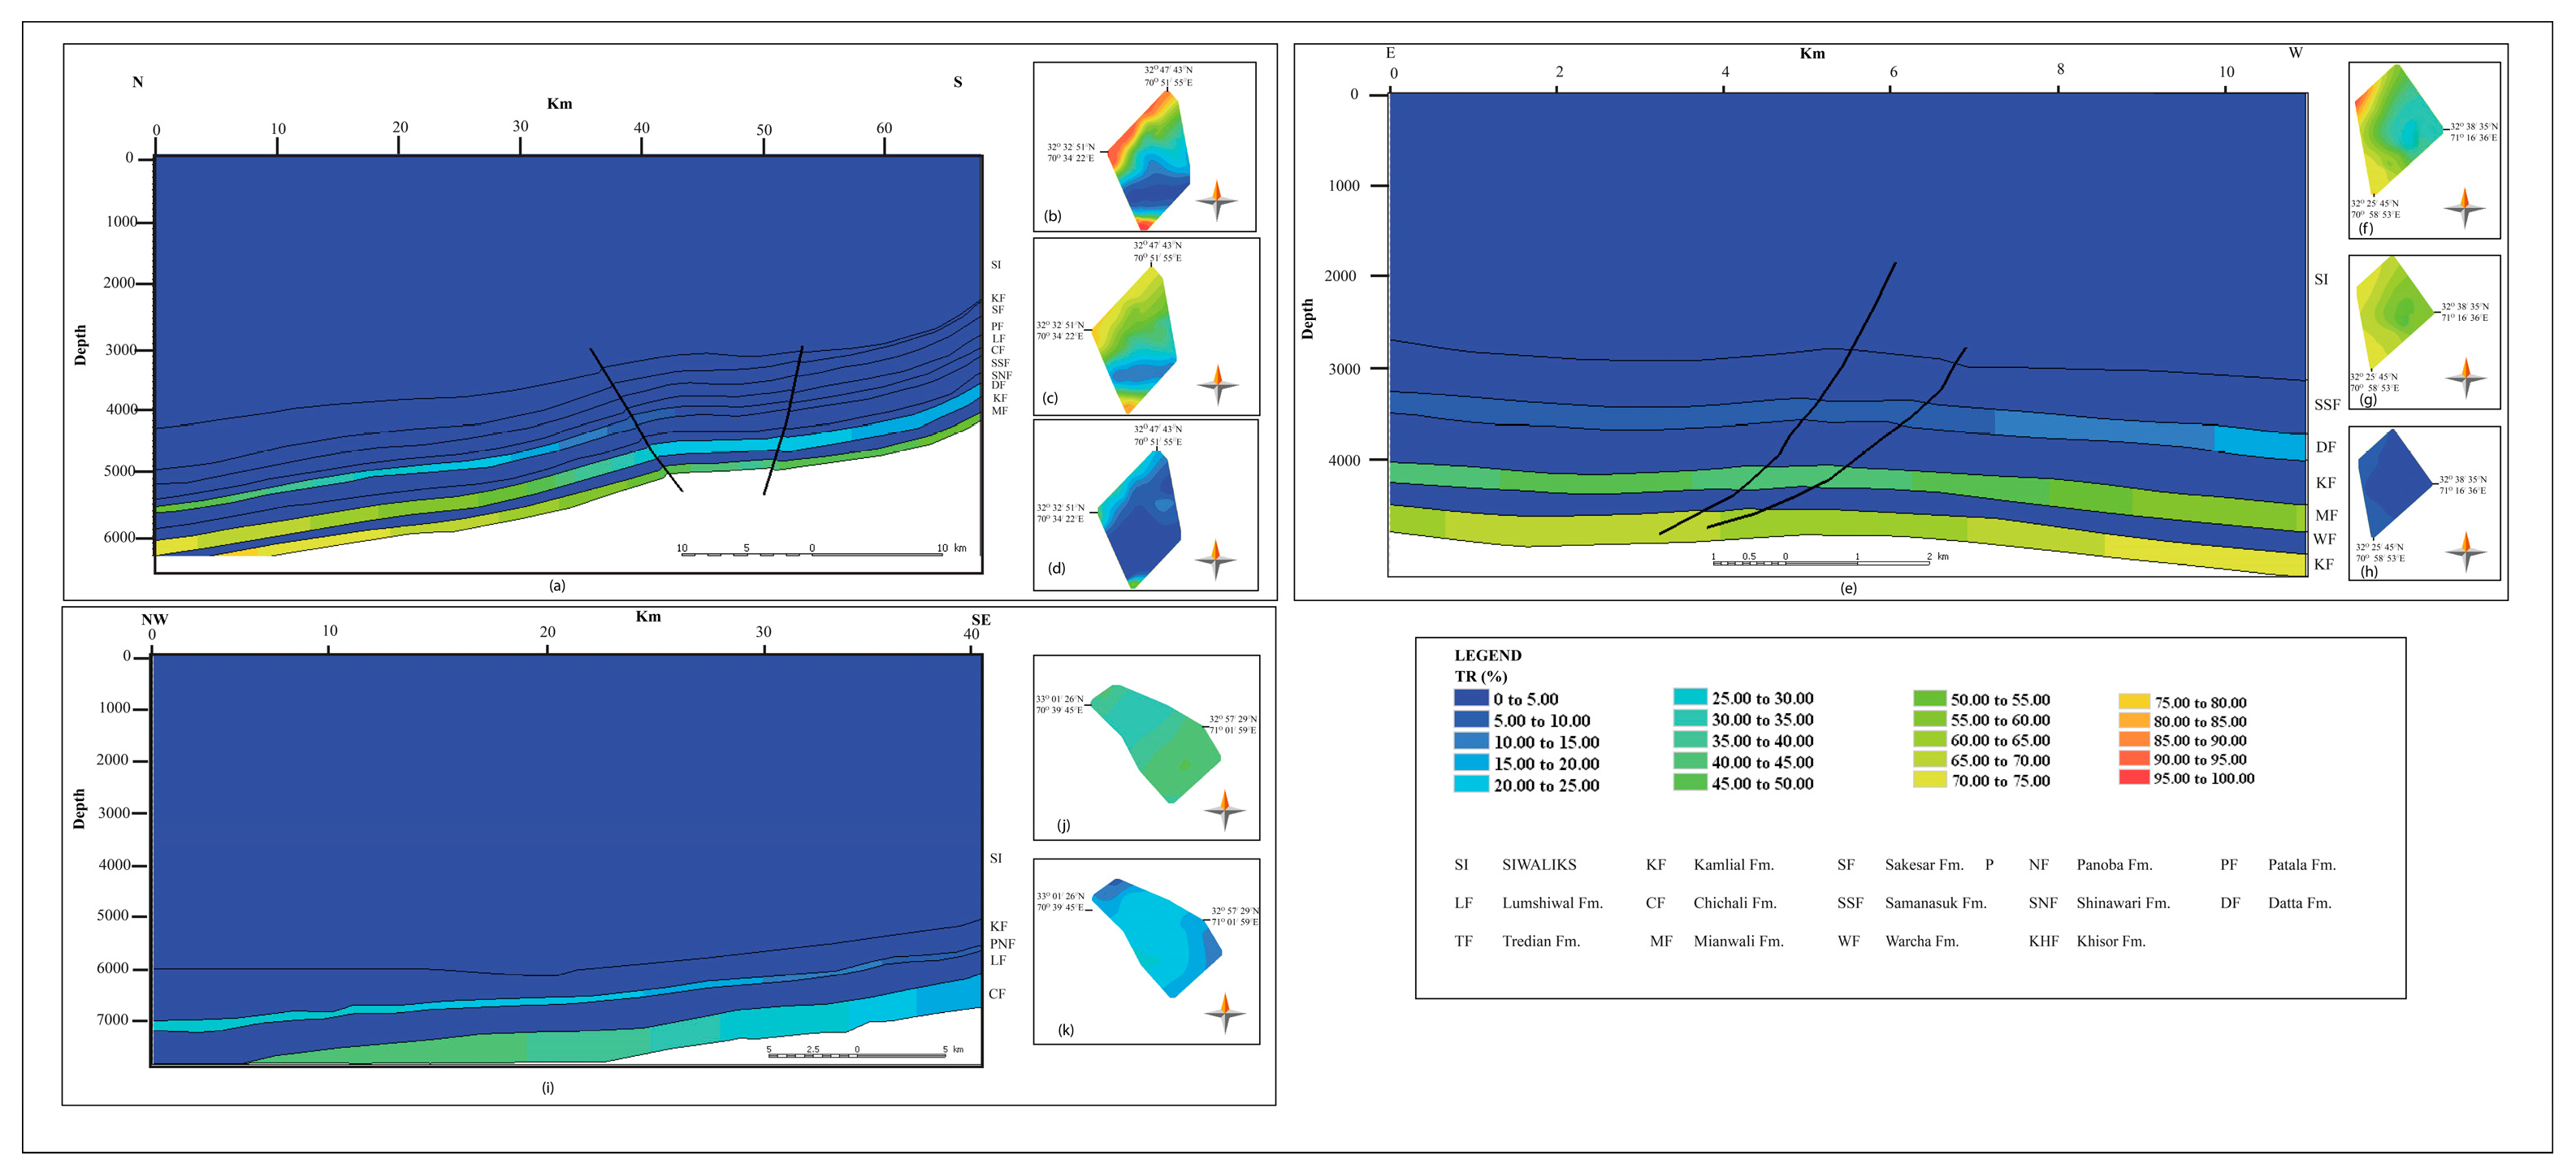
The timing of the generation and expulsion of hydrocarbons in the three divided zones of the Bannu Basin were also quantified based on the transformation ratio. The transformation ratio is defined as the ratio of the amount of hydrocarbons generated versus the total amount of remaining kerogen [23]. It majorly depends on the maturation history of the source rock after its deposition. In this study, the TR was divided into three stages in which a TR 10–30% was used to predict the timing of the early generation of oil. A TR of 30–70% was used to define the main phase of oil generation, and a TR >70% was considered for the late generation of gas in the study area. Hence, the studied source rocks in the Bannu Basin are type-II/III kerogen [30,50]. The 2D profile indicates that most of the source rocks generated oil as the main product of hydrocarbons with some amount of gas (Figure 10a,e,i) in the study area. The Mianwali Formation in the Southwestern zones (Figure 10b) and the Khisor Formation in the Southeastern zone (Figure 10f) indicate the transformation of oil into gas toward the north of the study area. Presently, the transformation potentials of both formations indicate that they are mostly transformed into hydrocarbon into the second (TR 30–70%) and third (>70%) stages. In the Southwestern zone, the kerogen in the Datta Formation (Figure 10c) majorly generate oil with minor gas in the deeper part. The shallowest Chichali Formation (Figure 10d) in this zone also generates early to main oil (TR 10–70%), whereas in the southeastern zone, the kerogen transforms into the main phase of oil generation in the Mianwali Formation (Figure 10g) and early oil generation (first phase) in the Datta Formation (Figure 10h). In the northeastern zone, the Chichali Formation (Figure 10j) and Panoba Formation (Figure 10k) generated main oil and early oil in their deeper parts, respectively.
Overall, the trend of hydrocarbon expulsion and migration from source rock is vertical in the study area. The generated hydrocarbons are further migrated upright in relation to the topographic high (Figure 11). It is believed that the hydrocarbon movement is mostly because of overburden. However, the general trend of hydrocarbons in reservoir rocks is both vertical and lateral. In the Southwestern zone, the local faults interpreted in the 2D section act as a barrier for the movement of hydrocarbons. In this zone, the hydrocarbons accumulated in the Tredian Formation and the Lumshiwal Formation along the local fault-bounded structure (Figure 11a), whereas the movement of gas is also observed in Sakesar Formation. It is believed that this gas might be generated from the Palata Formation below or the deeper source rocks. In the Southeastern zone, the hydrocarbons generated by the Khisor Formation and Mianwali Formation are accumulated in the Warcha Formation and Tredian Formation, respectively (Figure 11b). The hydrocarbon accumulations are also along the faults in this zone, which act as the seal. The migration of the hydrocarbon in the Samanasuk Formation is also toward the faults (updip direction). However, the modeling results showed no major accumulation in this reservoir. There is no indication of hydrocarbon accumulation in northeastern zone. However, the abrupt and high rate of sedimentation in this zone is responsible for the thermal maturity of the Chichali Formation and Panoba Formation, but the reservoirs of these formations do not have traps to accumulate hydrocarbons in the study area (Figure 11c). It is possible that these reservoirs can accumulate hydrocarbons if any structural trap is present toward the north.
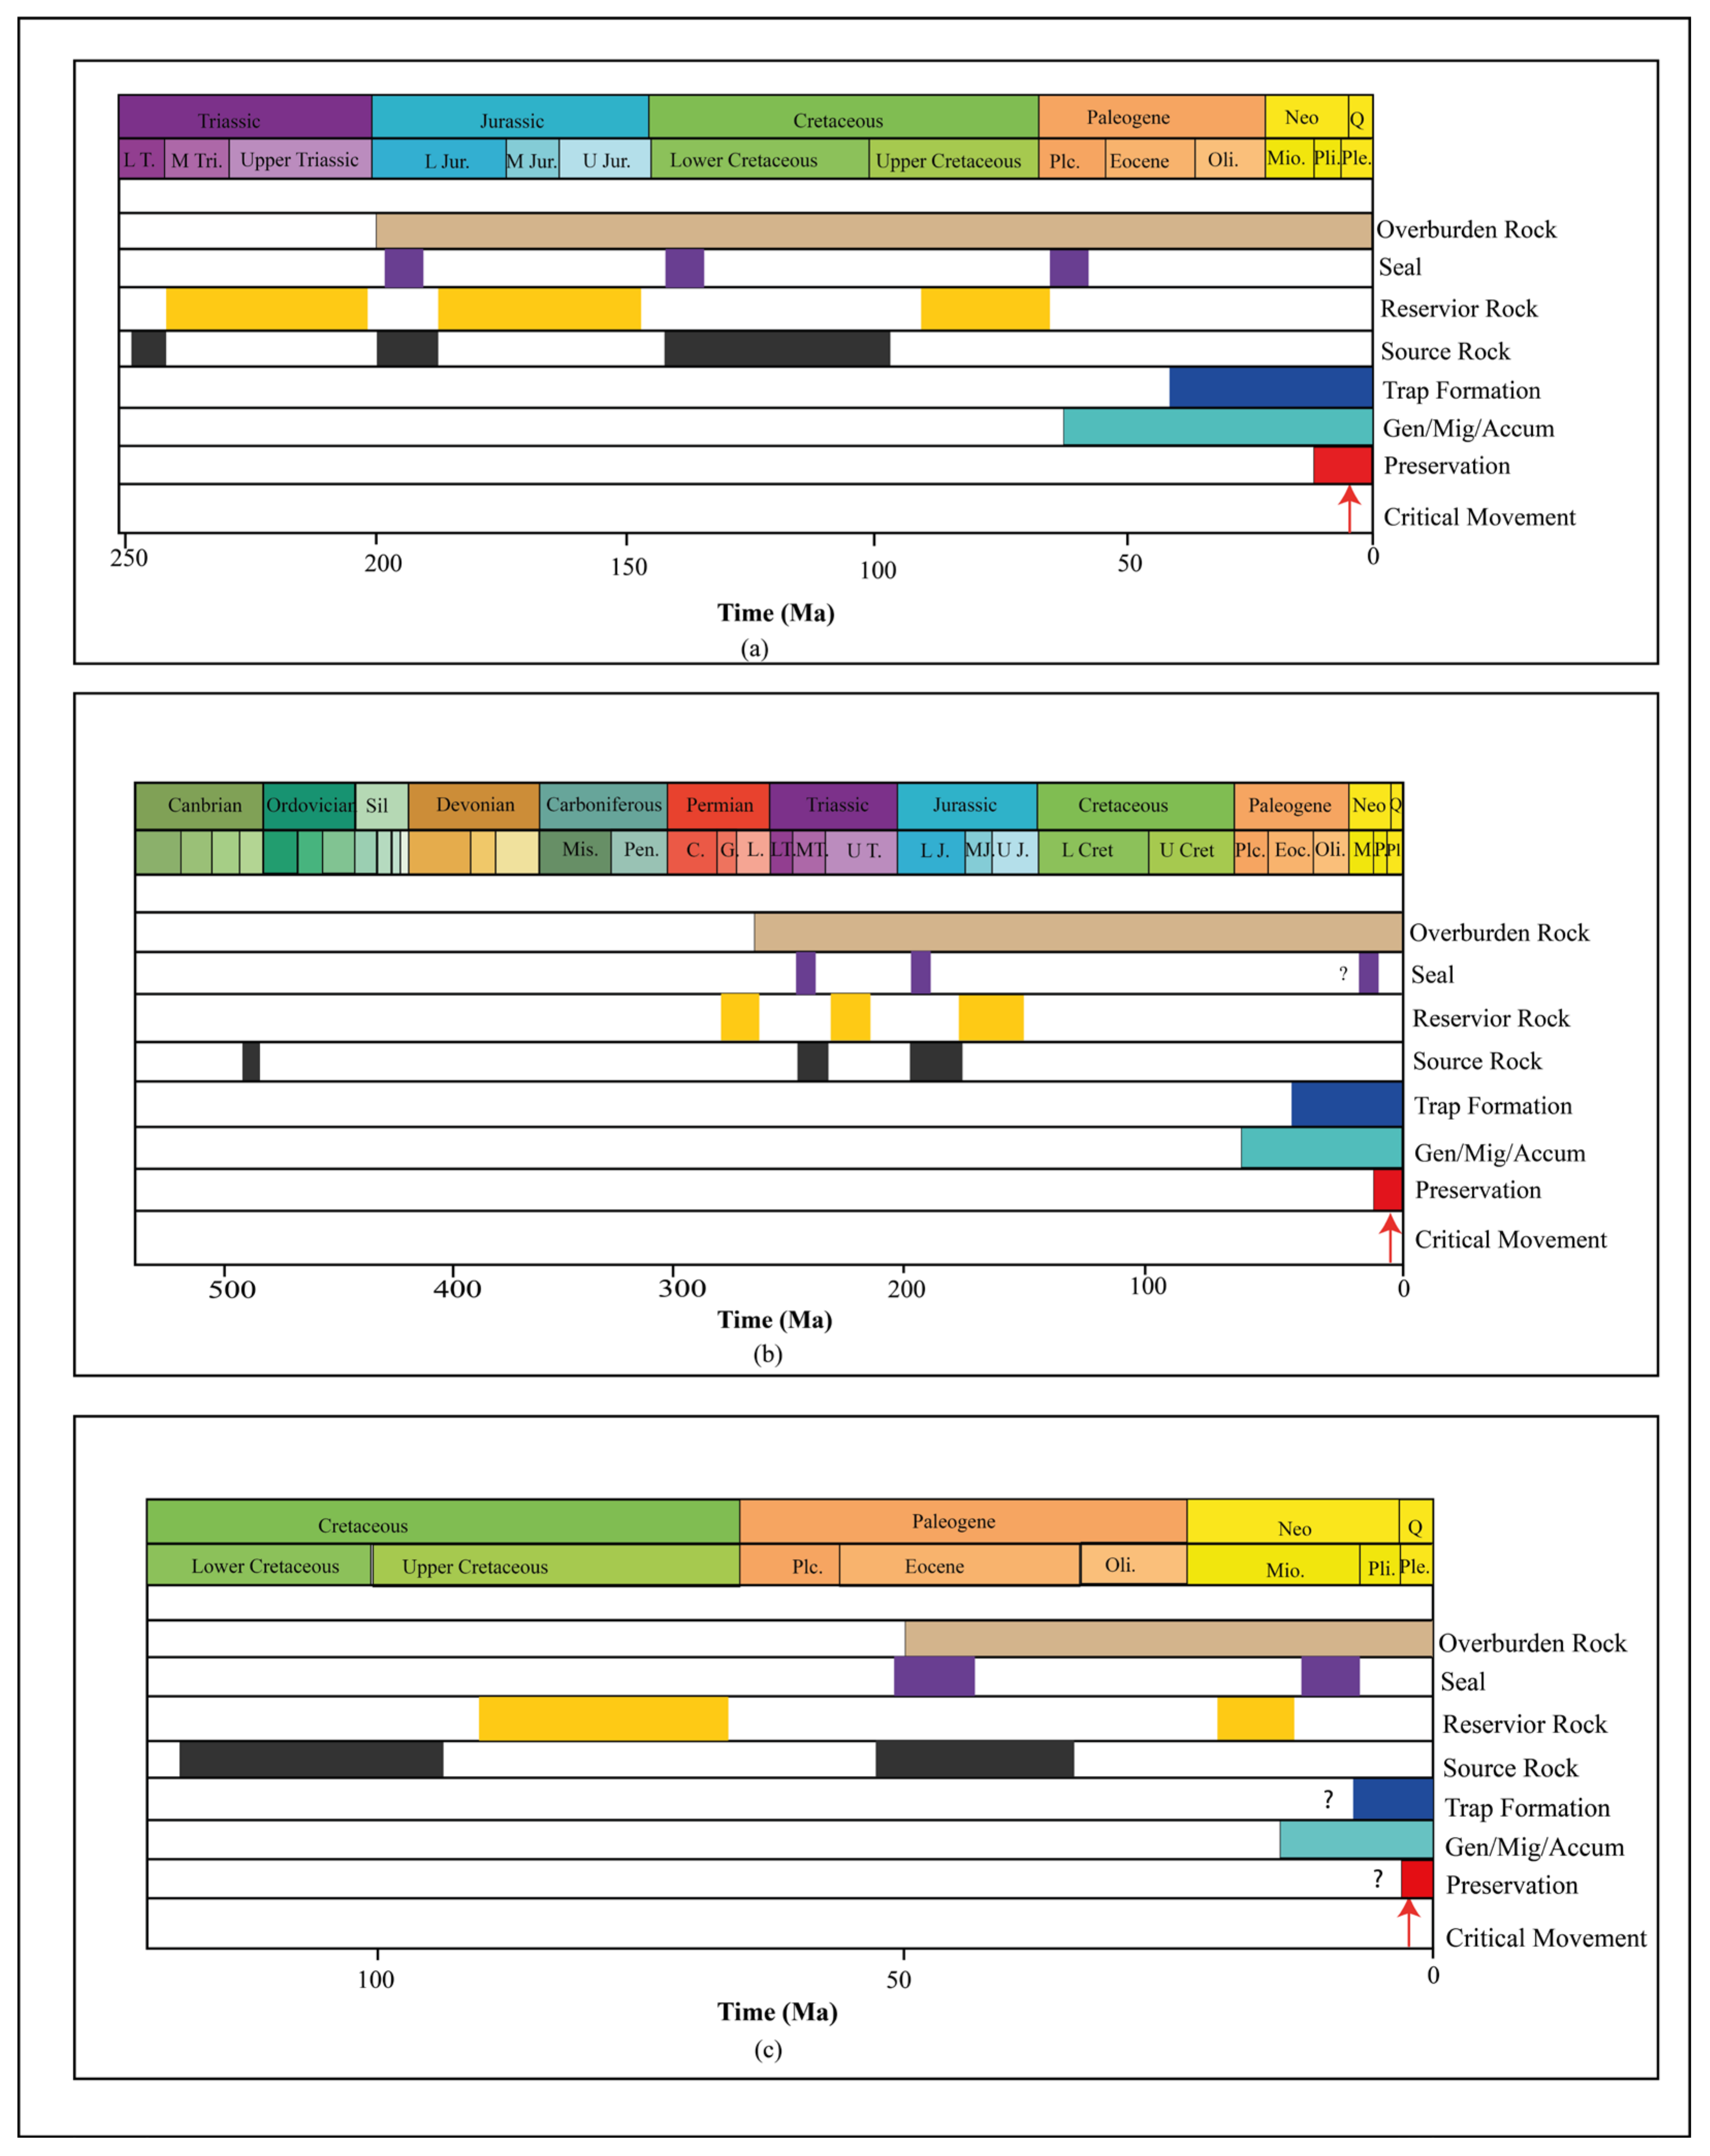
Based on this research, the three different petroleum system element charts were generated in each divided zone. For this purpose, the peak time for the generation of hydrocarbons from kerogen was considered the critical moment, whereas the time interval in which the hydrocarbons were preserved in reservoir traps was defined as the preservation time. In all the zones of the Bannu Basin, the intraformational shales act as the seals of the underlying reservoirs. In the Southwestern and Southeastern zones, the generation of hydrocarbons began at 62 My (Figure 12a) and 51 Mya (Figure 12b), respectively. The generation was due to the overburden rocks of Cretaceous–Paleogene formations. However, in the Northeastern zone, the generation of hydrocarbons began at 17 Mya (Figure 12c). It is believed that the transformation of kerogen into hydrocarbon in the source rocks in this zone was due to the higher and abrupt sedimentation of overlying formations deposited as a result of the Himalayan orogeny. The formation of the Himalayas was also responsible for the structural traps in the Southwestern and Southeastern zones. In the Northeastern zone, source and reservoir rocks are present. The thermal history and source rock maturation also indicate the presence of hydrocarbons in the zone, whereas the vertical migration of hydrocarbons from source rocks and their lateral movement toward the shallower part in reservoir rocks are evident. The structural trap is missing in the study area, however. It is assumed that the traps of these reservoirs should be available toward the north of this zone, and these reservoirs can preserve hydrocarbons. In the Southwestern and Southeastern zones, the hydrocarbon preservation began at 4.2 Mya and 3.8 Mya, respectively. In the Northeastern zone, the preservation is unknown due to the absence of structural or stratigraphic traps.

5.5. Controlling Factors for the Petroleum System of the Bannu Basin

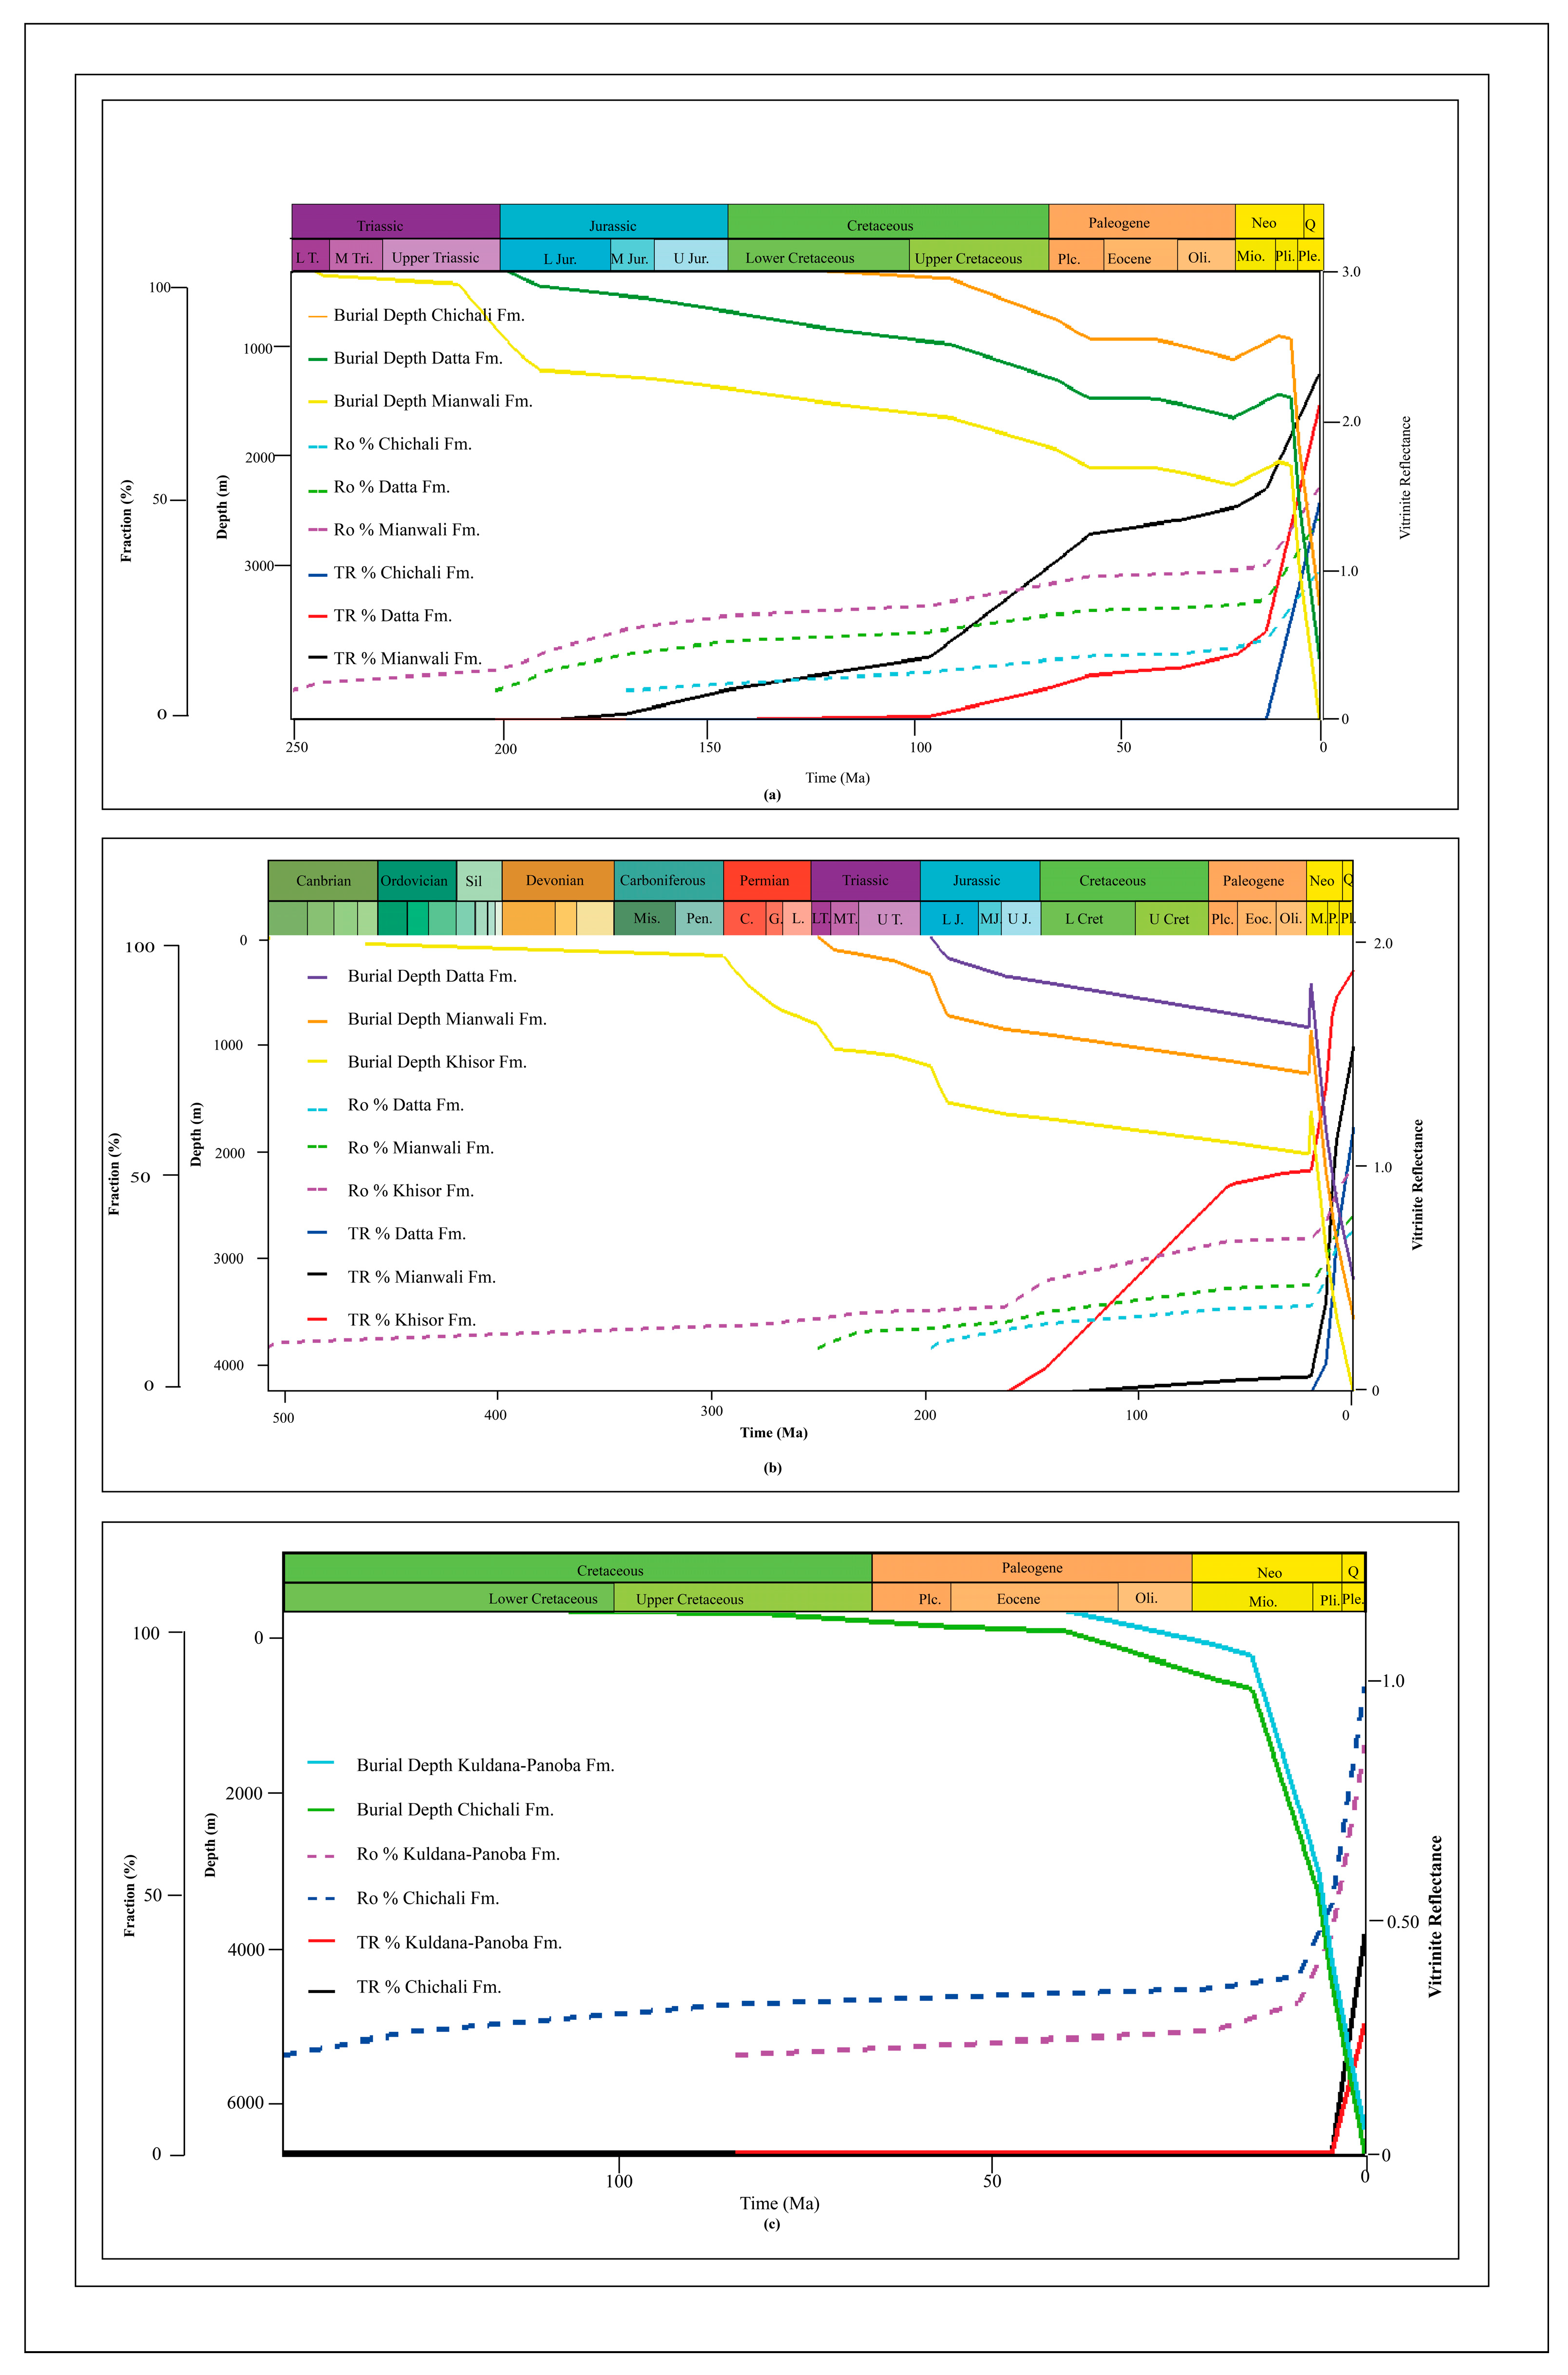
The collision of the Indian and Eurasian plates changed the dynamics of the Bannu Basin. It resulted in the high, abrupt deposition of Miocene to Recent sediments, which increased the burial depth of the basin. This event, in addition to the salt movement toward the south, is considered the major controlling factor for the development of the petroleum system in the basin. The increase in the burial depth is responsible for the thermal maturity and the transformation ratios of the source rocks in the studied zones (Figure 13). In the Cretaceous age, the transformation ratio of the Mianwali Formation reached up to 40% TR, which further increased to almost 76% TR until recent times in the Southwestern zone (Figure 13a). The transformation ratios of the Datta and Chichali formations also reached 65% TR and 40% TR, respectively. In the Southeastern zone, the Khisor Formation reached a transformation ratio of 90% TR, whereas the Mianwali and Datta formations reached 70% TR and 50% TR hydrocarbon transformation, respectively (Figure 13b). On the other hand, in the Northeastern zone, the deepest well was drilled up to 6500 m. However, the higher deposition of almost 5500 m buried the source rocks of this zone (Panoba and Chichali formations) abruptly. Both source rocks show the transformation of hydrocarbons, but due to the shorter burial time, the transformations reached 30%TR and 15%TR, respectively (Figure 13c). In the Northeastern zone, minor gases were reported during the drilling of the Kundi-X1 well. It is believed that these minor gases belong to the early-stage maturation of the Panoba Formation or the existence of mature source rock below [27,30]. The generation and expulsion of hydrocarbons from the source rocks accumulated in the reservoir rocks along the local faults in the Southwestern and Southeastern zones, whereas no accumulation is present in the Northeastern zone.

6. Summary

The seismic interpretation and burial history modeling of different formations in the Bannu Basin indicate that the thicknesses of Siwaliks and Miocene formations decrease from the Northeastern toward Southwestern and Southeastern zones. These depositions are the result of the formation of the Himalayan orogeny toward the north of the study area. On the other hand, the presence of Pre-Cambrian salt in the base is another important factor that caused the uplifting at the south of the basin. These two events are also responsible for the active thrust and fold belt system developed in this region. These deformations caused the localized structural highs to parallel soon after the deposition of source rocks in the basin [27,73]. Furthermore, the heat flow maps indicate that the basin remains under a significant amount of heat. The burial history curves of different source rocks are integrated with the thermal maturity and transformation ratio of each source to understand the phases of maturation with geological time. In the south of the study area, the deposition of overlying formations enhanced the thermal maturity of the source rocks of the Southwestern (Mianwali Formation, Datta Formation, and Chichali Formation) and Southeastern zones (Khisor Formation, Mianwali Formation, and Datta Formation).
The Bannu Basin is considered the western extension of the Potwar Basin in the region [28]. Both basins have wider deformational belts and slides along the salt detachment due to the formation of Himalayan orogeny [74,75]. The Potwar basin has several hydrocarbon-developed fields, mostly along the drag folds and fault-bounded traps [73,76,77]. Due to their similarity, the petroleum system of the Bannu Basin is validated by the Potwar Basin. The sShale formations from the Cambrian, Triassic, Cretaceous, and Eocene periods are also the major source rocks in the Potwar basin [54]. Based on this research, it is assumed that the similarities in the stratigraphy and structures with the Potwar Basin and the occurrence of oil seeps in the Bannu Basin contain a complete petroleum system in its Southwestern and Southeastern zones. However, the Northeastern zone also has potential source and reservoir rocks, but the hydrocarbon traps are missing in this study area. There may be a possibility of these traps toward the north of this zone.

7. Conclusions

Based on this research study, the following conclusions are drawn.
  • The burial history plot indicates the higher subsidence of the basin, mostly toward north. The subsurface modeling based on seismic interpretation indicates the presence of potential source, reservoir, seal and overburden rocks in the region.
  • The thermal maturity of the basin indicates that the basal Mianwali Formation in the Southwestern zone and the Khisor Formation in the Southeastern zone enter into anearly gas window toward their deeper parts, whereas the upper source rocks enter into late oil to early oil windows in both zones. The deeper Chichali Formation of the Cretaceous age and the Panoba Formation of the Eocene age in the Northeastern zone mostly enter into main oil to early oil windows, respectively.
  • The transformation ratio suggests that the Khisor Formation in the Southeastern and the Mianwali Formation in the Southeastern and Southwestern zones have been mostly transformed into hydrocarbons toward their deeper parts, whereas the kerogen in the Chichali Formation in the Southwestern and the Datta Formation in the Southeastern also partially transformed into hydrocarbons. In the northern zone, the transformation ratio is higher in the Chichali Formation when compared to Panoba Formation. Based on thermal maturity, it is assumed that all the source rocks have the potential to generate hydrocarbons.
  • The migration pathways indicate a vertical trend which further moved upright toward the surface as a result of overburden rocks. In the Southwestern and Southeastern zones, the local faults act as barriers for hydrocarbon accumulation. In these zones, the Tredian, Lumshiwal, and Warcha Formations have good potential to act as reservoirs sealed by intraformational shales. However, in the Northeastern zone, the faults were not identified; as a result, no hydrocarbon accumulation is present in this study area.
  • Lastly, the critical moments for peak hydrocarbon generation in all zones were in the Pliocene time as a result of post-Himalayan deposition from the north in the study area.

Author Contributions

Conceptualization, A.M., A.W. and R.R.; methodology, A.M., A.W. and M.R.K.; software, A.M., A.W., Y.D.E. and M.A.I.; validation, A.W., Y.D.E. and S.H.A.; formal analysis, A.W., R.R. and Y.D.E.; investigation, A.W. and A.M. and S.H.A.; resources, M.A.I., Y.D.E. and A.W.; data curation, M.R.K. and A.W.; writing—original draft preparation, A.W., A.M. and M.A.I.; writing—review and editing, S.H.A. and R.R.; visualization, A.W. and Y.D.E.; supervision, A.W., R.R. and M.R.K.; project administration, A.W. and S.H.A.; funding acquisition, A.W. and A.M. All authors have read and agreed to the published version of the manuscript.

Funding

This research received no external funding.

Institutional Review Board Statement

Not applicable.

Informed Consent Statement

Not applicable.

Data Availability Statement

The data that support the findings of this study are available from the corresponding author upon reasonable request.

Acknowledgments

We are thankful to the Institute of Geology, University of Azad Jammu and Kashmir, Muzaffarabad, Pakistan, for providing the facilities to complete this research. Thanks are also extended to the Directorate General of Petroleum Concession (DGPC), Ministry of Energy, Petroleum Division, Pakistan, for providing the data for this research. Schlumberger is thanked for providing an academic license for the PetroMod software.

Conflicts of Interest

The authors declare no conflict of interest.

References

  1. Lampe, C.; Kornpihl, K.; Sciamanna, S.; Zapata, T.; Zamora, G.; Varadé, R. Petroleum systems modeling in tectonically complex areas—A 2D migration study from the Neuquen Basin, Argentina. J. Geochem. Explor. 2006, 89, 201–204. [Google Scholar] [CrossRef]
  2. Espitalié, J.; Ungerer, P.H.; Irwin, I.; Marquis, F. Primary cracking of kerogens. Experimenting and modelling C1, C2–C5, C6–C15 and C15+ classes of hydrocarbons formed. Org. Geochem. 1988, 13, 893–899. [Google Scholar] [CrossRef]
  3. Galushkin, Y.I.; Ushakov, S.A.; Zhizn, Z. Thermal regime and location of zones for hydrocarbon generation during basin evolution: Description of the methods and computer program. In Earth Life, Evolution of Earth and Planets; Moscow University Press: Moscow, Russia, 1990; pp. 102–108. [Google Scholar]
  4. Tissot, B.P.; Pelet, R.; Ungerer, P.H. Thermal history of sedimentary basins, maturation indices, and kinetics of oil and gas generation. AAPG Bull. 1987, 71, 1445–1466. [Google Scholar]
  5. Lopatin, N.V.; Galushkin, Y.I.; Makhous, M. Evolution of sedimentary basins and petroleum formation. In Geodynamic Evolution of Sedimentary Basins; Rouze, F., Ellouz, N., Shein, V.S., Skvortsov, I.I., Eds.; Editions Technip: Paris, France, 1996. [Google Scholar]
  6. Hu, D.; Rao, S.; Wang, Z.-T.; Hu, S.-B. Thermal and maturation history for Carboniferous source rocks in the Junggar Basin, Northwest China: Implications for hydrocarbon exploration. Pet. Sci. 2020, 17, 36–50. [Google Scholar] [CrossRef] [Green Version]
  7. Mashhadi, Z.S.; Rabbani, A.R.; Kamali, M.R.; Mirshahani, M.; Khajehzadeh, A. Burial and thermal maturity modeling of the Middle Cretaceous–Early Miocene petroleum system, Iranian sector of the Persian Gulf. Pet. Sci. 2015, 12, 367–390. [Google Scholar] [CrossRef] [Green Version]
  8. Zhang, J.; Guo, J.; Liu, J.; Shen, W.; Li, N.; Xu, G. 3D-basin modelling of the Lishui Sag: Research of hydrocarbon potential, petroleum generation and migration. Energies 2019, 12, 650. [Google Scholar] [CrossRef] [Green Version]
  9. Su, P.; Liang, J.; Qiu, H.; Xu, J.; Ma, F.; Li, T.; Wang, X.; Zhang, J.; Wan, Z.; Wang, F. Quantitative Simulation of Gas Hydrate Formation and Accumulation with 3D Petroleum System Modeling in the Shenhu Area, Northern South China Sea. Energies 2022, 16, 99. [Google Scholar]
  10. Iqbal, M.A.; Rezaee, R. Porosity and Water Saturation Estimation for Shale Reservoirs: An Example from Goldwyer Formation Shale, Canning Basin, Western Australia. Energies 2020, 13, 6294. [Google Scholar] [CrossRef]
  11. Wahid, A.; Salim, A.M.A.; Gaafar, G.R.; Yusoff, A.W.I.W. Tectonic development of the Northwest Bonaparte Basin, Australia by using Digital Elevation Model (DEM). In Proceedings of the IOP Conference Series: Earth and Environmental Science, Beijing, China, 7–8 July 2016; p. 012005. [Google Scholar]
  12. Casallas-Moreno, K.; González-Escobar, M.; Gómez-Arias, E.; Mastache-Román, E.; Gallegos-Castillo, C.; González-Fernández, A. Analysis of subsurface structures based on seismic and gravimetric exploration methods in the Las Tres Vírgenes volcanic complex and geothermal field, Baja California Sur, Mexico. Geothermics 2021, 92, 102026. [Google Scholar] [CrossRef]
  13. Baur, F.; Di Benedetto, M.; Fuchs, T.; Lampe, C.; Sciamanna, S. Integrating structural geology and petroleum systems modeling–A pilot project from Bolivia’s fold and thrust belt. Mar. Pet. Geol. 2009, 26, 573–579. [Google Scholar]
  14. Ungerer, P.; Burrus, J.; Doligez, B.; Chenet, P.Y.; Bessis, F. Basin evaluation by integrated two-dimensional modeling of heat transfer, fluid flow, hydrocarbon generation, and migration. AAPG Bull. 1990, 74, 309–335. [Google Scholar]
  15. Kutovaya, A.; Kroeger, K.F.; Seebeck, H.; Back, S.; Littke, R. Thermal effects of magmatism on surrounding sediments and petroleum systems in the northern offshore Taranaki Basin, New Zealand. Geosciences 2019, 9, 288. [Google Scholar] [CrossRef] [Green Version]
  16. Iqbal, M.A.; Salim, A.M.A.; Baioumy, H.; Gaafar, G.R.; Wahid, A. Identification and characterization of low resistivity low contrast zones in a clastic outcrop from Sarawak, Malaysia. J. Appl. Geophys. 2019, 160, 207–217. [Google Scholar] [CrossRef]
  17. Welte, D.H.; Tissot, P. Petroleum Formation and Occurrence; Springer: Berlin/Heidelberg, Germany, 1984. [Google Scholar]
  18. Emujakporue, G.O. Subsurface temperature distribution from heat flow conduction equation in part of chad sedimentary basin, Nigeria. Egypt. J. Pet. 2017, 26, 519–524. [Google Scholar] [CrossRef] [Green Version]
  19. Khalil Khan, H.; Ehsan, M.; Ali, A.; Amer, M.A.; Aziz, H.; Khan, A.; Bashir, Y.; Abu-Alam, T.; Abioui, M. Source rock geochemical assessment and estimation of TOC using well logs and geochemical data of Talhar Shale, Southern Indus Basin, Pakistan. Front. Earth Sci. 2022, 10, 1593. [Google Scholar] [CrossRef]
  20. Mani, D.; Patil, D.J.; Dayal, A.M.; Prasad, B.N. Thermal maturity, source rock potential and kinetics of hydrocarbon generation in Permian shales from the Damodar Valley basin, Eastern India. Mar. Pet. Geol. 2015, 66, 1056–1072. [Google Scholar] [CrossRef]
  21. Zhang, J.; Guo, J.; Li, Y.; Sun, Z. 3D-Basin Modeling of the Changling Depression, NE China: Exploring Petroleum Evolution in Deep Tight Sandstone Reservoirs. Energies 2019, 12, 1043. [Google Scholar] [CrossRef] [Green Version]
  22. Omodeo-Salé, S.; Ondrak, R.; Arribas, J.; Mas, R.; Guimerà, J.; Martínez, L. Petroleum systems modelling in a fold-and-thrust belt setting: The inverted cameros basin, north-central Spain. J. Pet. Geol. 2019, 42, 145–171. [Google Scholar] [CrossRef]
  23. Hadad, Y.T.; Hakimi, M.H.; Abdullah, W.H.; Makeen, Y.M. Thermal maturity history reconstruction and hydrocarbon generation/expulsion modeling of the syn-rift Rudeis and Kareem source rocks in the Red Sea Rift Basin, Sudan. Arab. J. Geosci. 2016, 9, 1–17. [Google Scholar] [CrossRef]
  24. Peters, K.E.; Curry, D.J.; Kacewicz, M. An overview of basin and petroleum system modeling: Definitions and concepts. In Basin Modeling: New Horizons in Research and Applications; AAPG Hedberg Series; Datapages, Inc.: Tulsa, OK, USA, 2012. [Google Scholar]
  25. Xiang, C.; Pang, X.; Yang, W.; Wang, J.; Li, Q.; Liu, L.; Li, Y. Hydrocarbon migration and accumulation along the fault intersection zone—A case study on the reef-flat systems of the No. 1 slope break zone in the Tazhong area, Tarim Basin. Pet. Sci. 2010, 7, 211–225. [Google Scholar] [CrossRef] [Green Version]
  26. Ahmad, N.; Khan, M.R. Evaluation of a distinct sub-play for enhanced exploration in an emerging petroleum province, Bannu-Kohat sub-basin, Pakistan. In Proceedings of the Oral Presentation at AAPG International Conference and Exhibition, Milan, Italy, 23–26 October 2011. [Google Scholar]
  27. Abir, I.A.; Khan, S.D.; Aziz, G.M.; Tariq, S. Bannu Basin, fold-and-thrust belt of northern Pakistan: Subsurface imaging and its implications for hydrocarbon exploration. Mar. Pet. Geol. 2017, 85, 242–258. [Google Scholar] [CrossRef]
  28. Khan, A.A. Bhittani Range, North Pakistan: The Tectonic Evolution and Hydrocarbon Prospectivity–a Geological and Geophysical Approach. Pak. J. Hydrocarb. Res. 2012, 22, 1–22. [Google Scholar]
  29. Zeb, S.F.; Zafar, M.; Jehandad, S.; Khan, T.; Siyar, S.M.; Qadir, A. Integrated geochemical study of Chichali Formation from Kohat sub-basin, Khyber Pakhtunkhwa, Pakistan. J. Pet. Explor. Prod. Technol. 2020, 10, 2737–2752. [Google Scholar] [CrossRef]
  30. Ali, A. Structural Analysis of the Trans-Indus Ranges: Implications for the Hydrocarbon Potential of the NW Himalayas, Pakistan. Ph.D. Thesis, Univeristy of Peshawar, Peshawar, Pakistan, 2010. [Google Scholar]
  31. Farid, A.; Khalid, P.; Ali, M.Y.; Iqbal, M.A.; Jadoon, K.Z. Seismic stratigraphy of the Mianwali and Bannu depressions, north-western Indus foreland basin. Int. J. Earth Sci. 2018, 107, 1557–1578. [Google Scholar] [CrossRef]
  32. Hemphill, W.R.; Kidwai, A.H. Stratigraphy of the Bannu and Dera Ismail Khan areas, Pakistan; USGS: Lakewood, CO, USA, 1973; pp. 2330–7102.
  33. Ishaq, K.; Wahid, S.; Yaseen, M.; Hanif, M.; Ali, S.; Ahmad, J.; Mehmood, M. Analysis of subsurface structural trend and stratigraphic architecture using 2D seismic data: A case study from Bannu Basin, Pakistan. J. Pet. Explor. Prod. 2021, 11, 1019–1036. [Google Scholar] [CrossRef]
  34. McDougall, J.W.; Khan, S.H. Strike-slip faulting in a foreland fold-thrust belt: The Kalabagh Fault and Western Salt Range, Pakistan. Tectonics 1990, 9, 1061–1075. [Google Scholar] [CrossRef]
  35. Sayab, M.; Khan, M.A.; Butt, K.A.; Pervaiz, K. Analyses of joints and associated neo-tectonic deformation band shear zones in the Siwalik Group of southern Surghar-Shingar Range, Trans-Indus Ranges, Pakistan. Geol. Bull. Univ. Peshawar 1999, 32, 25–39. [Google Scholar]
  36. Pivnik, D.A.; Khan, M.J. Transition from foreland-to piggyback-basin deposition, Plio-Pleistocene Upper Siwalik Group, Shinghar Range, NW Pakistan. Sedimentology 1996, 43, 631–646. [Google Scholar] [CrossRef]
  37. Kazmi, A.H.; Jan, M.Q. Geology and Tectonics of Pakistan; Graphic Publishers: Karachi, Pakistan, 1997. [Google Scholar]
  38. Qadri, H.A.; Wahid, A.; Siddiqui, N.A.; Ali, S.H.; El Aal, A.A.; Rashid, A.Q.B.A.; Temizi, M.N.B. Prospect Analysis of Paleocene Coalbed Methane: A Case Study of Hangu Formation, Trans-Indus Ranges, Pakistan. Geofluids 2022, 2022, 8313048. [Google Scholar] [CrossRef]
  39. Kazmi, A.H. Active fault systems in Pakistan. Geodyn. Pak. 1979, 12, 285. [Google Scholar]
  40. Mateen, A.; Wahid, A.; Janjuhah, H.T.; Mughal, M.S.; Ali, S.H.; Siddiqui, N.A.; Shafique, M.A.; Koumoutsakou, O.; Kontakiotis, G. Petrographic and geochemical analysis of Indus sediments: Implications for placer gold deposits, Peshawar Basin, NW Himalaya, Pakistan. Minerals 2022, 12, 1059. [Google Scholar] [CrossRef]
  41. Ghazi, S.; Ali, S.H.; Shahzad, T.; Ahmed, N.; Khalid, P.; Akram, S.; Ali, S.; Sami, J. Sedimentary, structural and salt tectonic evolution of Karoli-Nilawahan area, Central Salt Range and its impact for the Potwar Province. Himal. Geol. 2020, 41, 145–156. [Google Scholar]
  42. Ahmed, N.; Ali, S.H.; Ahmad, M.; Khalid, P.; Ahmad, B.; Akram, M.S.; Farooq, S.; Din, Z.U. Subsurface Structural Investigation Based on Seismic Data of the North-Eastern Potwar Basin, Pakistan. Indian J. Geo-Mar. Sci. 2022, 49, 1258–1268. [Google Scholar]
  43. Butler, R.W.H.; Coward, M.P.; Harwood, G.M.; Knipe, R.J. Salt control on thrust geometry, structural style and gravitational collapse along the Himalayan mountain front in the Salt Range of northern Pakistan. In Dynamical Geology of Salt and Related Structures; Elsevier: Amsterdam, The Netherlands, 1987; pp. 339–418. [Google Scholar]
  44. Lillie, R.J.; Johnson, G.D.; Yousuf, M.; Zamin, A.S.H.; Yeats, R.S. Structural Development within the Himalayan Foreland Fold-and-Thrust Belt of Pakistan; Datapages, Inc.: Tulsa, OK, USA, 1987. [Google Scholar]
  45. Blisniuk, P.M.; Sonder, L.J.; Lillie, R.J. Foreland normal fault control on northwest Himalayan thrust front development. Tectonics 1998, 17, 766–779. [Google Scholar] [CrossRef]
  46. Wahid, A.; Rauf, A.; Ali, S.H.; Khan, J.; Iqbal, M.A.; Haseeb, A. Impact of complex tectonics on the development of geo-pressured zones: A case study from petroliferous Sub-Himalayan Basin, Pakistan. Geopersia 2022, 12, 89–106. [Google Scholar]
  47. Kazmi, A.H.; Rana, R.A. Tectonic Map of Pakistan, Geological Survey of Pakistan; Graphic Publishers: Karachi, Pakistan, 1982. [Google Scholar]
  48. Ali, S.H.; Shoukat, N.; Bashir, Y.; Qadri, S.M.T.; Wahid, A.; Iqbal, M.A. Industrial Research Lithofacies and Sedimentology of Baghanwala Formation (Early-Middle Cambrian), Eastern Salt Range, Pakistan. Pak. J. Sci. Ind. Res. 2021, 65, 159–168. [Google Scholar]
  49. Yasin, Q.; Baklouti, S.; Khalid, P.; Ali, S.H.; Boateng, C.D.; Du, Q. Evaluation of shale gas reservoirs in complex structural enclosures: A case study from Patala Formation in the Kohat-Potwar Plateau, Pakistan. J. Pet. Sci. Eng. 2021, 198, 108225. [Google Scholar] [CrossRef]
  50. Ghazi, S.; Ali, S.H.; Sahraeyan, M.; Hanif, T. An overview of tectonosedimentary framework of the Salt Range, northwestern Himalayan fold and thrust belt, Pakistan. Arab. J. Geosci. 2015, 8, 1635–1651. [Google Scholar] [CrossRef]
  51. Alam, I.; Azhar, A.M.; Khan, M.W. Frontal structural style of the Khisor Range, northwest of Bilot: Implications for hydrocarbon potential of the north-western Punjab fore deep, Pakistan. J. Himal. Earth Sci. 2014, 47, 87–98. [Google Scholar]
  52. Javed, A.; Wahid, A.; Mughal, M.S.; Khan, M.S.; Qammar, R.S.; Ali, S.H.; Siddiqui, N.A.; Iqbal, M.A. Geological and petrographic investigations of the Miocene Molasse deposits in sub-Himalayas, district Sudhnati, Pakistan. Arab. J. Geosci. 2021, 14, 1–24. [Google Scholar] [CrossRef]
  53. Khan, M.A.; Ahmed, R.; Raza, H.A.; Kemal, A. Geology of petroleum in Kohat-Potwar depression, Pakistan. AAPG Bull. 1986, 70, 396–414. [Google Scholar]
  54. Wandrey, C.J.; Law, B.E.; Shah, H.A. Patala-Nammal Composite Total Petroleum System, Kohat-Potwar Geologic Province, Pakistan; US Department of the Interior, US Geological Survey Reston: Lakewood, CO, USA, 2004.
  55. Quad Consulting Limited. Geological and Geophysical Evaluation of Block-35 and Adjacent Areas, Northern Pakistan for Pakistan Petroleum Limited. J. King Saud Univ. Sci. 1996, 33, 101235. [Google Scholar]
  56. Khan, M.Z.; Khan, M.R.; Raza, A. Reservoir Potential of Marwat and Khisor Trans Indus Ranges, Northwest Pakistan. In Proceedings of the AAPG, Istanbul, Turkey, 14–17 September 2014. [Google Scholar]
  57. Wahid, A.; Salim, A.M.A.; Gaafar, G.R.; Yusoff, W.I.W. The geostatistical approach for structural and stratigraphic framework analysis of offshore NW Bonaparte Basin, Australia. In AIP Conference Proceedings; AIP Publishing: Melville, NY, USA, 2016; p. 020030. [Google Scholar]
  58. Janjua, O.A.; Wahid, A.; Salim, A.M.A.; Rahman, M.N.B.A. Prospect evaluation of shallow I-35 reservoir of NE Malay Basin offshore, Terengganu, Malaysia. In AIP Conference Proceedings; AIP Publishing: Melville, NY, USA, 2016; p. 020019. [Google Scholar]
  59. Hantschel, T.; Kauerauf, A.I. Fundamentals of Basin and Petroleum Systems Modeling; Springer: Berlin/Heidelberg, Germany, 2009. [Google Scholar]
  60. Wygrala, B.P. Integrated Study of an Oil Field in the Southern Po Basin, Northern Italy; Kernforschungsanlage Jülich GmbH, Zentralbiliothek, Verlag: Jülich, Germany, 1989. [Google Scholar]
  61. Gallagher, K.; Sambridge, M. The resolution of past heat flow in sedimentary basins from non-linear inversion of geochemical data: The smoothest model approach, with synthetic examples. Geophys. J. Int. 1992, 109, 78–95. [Google Scholar] [CrossRef] [Green Version]
  62. Shah, S.B.A.; Abdullah, W.H. Structural interpretation and hydrocarbon potential of Balkassar oil field, eastern Potwar, Pakistan, using seismic 2D data and petrophysical analysis. J. Geol. Soc. India 2017, 90, 323–328. [Google Scholar] [CrossRef]
  63. Bassam, A.; Santoyo, E.; Andaverde, J.; Hernández, J.; Espinoza-Ojeda, O.J.C. Estimation of static formation temperatures in geothermal wells by using an artificial neural network approach. Comput. Geosci. 2010, 36, 1191–1199. [Google Scholar] [CrossRef]
  64. Sweeney, J.J.; Burnham, A.K. Evaluation of a simple model of vitrinite reflectance based on chemical kinetics. AAPG Bull. 1990, 74, 1559–1570. [Google Scholar]
  65. Hakimi, M.H.; Abdulah, W.H.; Shalaby, M.R. Organic geochemistry, burial history and hydrocarbon generation modelling of the Upper Jurassic Madbi Formation, Masila Basin, Yemen. J. Pet. Geol. 2010, 33, 299–318. [Google Scholar] [CrossRef]
  66. He, S.; Middleton, M. Heat flow and thermal maturity modelling in the northern Carnarvon Basin, North West Shelf, Australia. Mar. Pet. Geol. 2002, 19, 1073–1088. [Google Scholar] [CrossRef]
  67. Li, M.; Wang, T.; Chen, J.; He, F.; Yun, L.; Akbar, S.; Zhang, W. Paleo-heat flow evolution of the Tabei Uplift in Tarim Basin, northwest China. J. Asian Earth Sci. 2010, 37, 52–66. [Google Scholar] [CrossRef]
  68. Poelchau, H.S.; Baker, D.R.; Hantschel, T.; Horsfield, B.; Wygrala, B. Basin simulation and the design of the conceptual basin model. In Petroleum and Basin Evolution; Springer: Berlin/Heidelberg, Germany, 1997; pp. 3–70. [Google Scholar]
  69. Shalaby, M.R.; Hakimi, M.H.; Abdullah, W.H. Geochemical characteristics and hydrocarbon generation modeling of the Jurassic source rocks in the Shoushan Basin, north Western Desert, Egypt. Mar. Pet. Geol. 2011, 28, 1611–1624. [Google Scholar] [CrossRef]
  70. Shalaby, M.R.; Hakimi, M.H.; Abdullah, W.H. Modeling of gas generation from the Alam El-Bueib formation in the Shoushan Basin, northern Western Desert of Egypt. Int. J. Earth Sci. 2013, 102, 319–332. [Google Scholar] [CrossRef]
  71. Welte, D.; Yukler, M. Petroleum origin and accumulation in basin evolution—A quantitative model. AAPG Bull. 1981, 65, 1387–1396. [Google Scholar]
  72. Welte, D.H.; Yalcin, M.N. Basin modelling—A new comprehensive method in petroleum geology. In Organic Geochemistry in Petroleum Exploration; Elsevier: Amsterdam, The Netherlands, 1988; pp. 141–151. [Google Scholar]
  73. Moody, J.D. Petroleum exploration aspects of wrench-fault tectonics. AAPG Bull. 1973, 57, 449–476. [Google Scholar]
  74. Chapple, W.M. Mechanics of thin-skinned fold-and-thrust belts. Geol. Soc. Am. Bull. 1978, 89, 1189–1198. [Google Scholar] [CrossRef]
  75. Davis, D.M.; Engelder, T. The role of salt in fold-and-thrust belts. Tectonophysics 1985, 119, 67–88. [Google Scholar] [CrossRef]
  76. Parvez, M.K. Petroleum Geology of Kohat-Bannu Plateau, Northwest Frontier Province, Pakistan; University of South Carolina: Columbia, SC, US, 1992. [Google Scholar]
  77. Sercombe, W.J.; Pivnik, D.A.; Wilson, W.P.; Albertin, M.L.; Beck, R.A.; Stratton, M.A. Wrench faulting in the northern Pakistan foreland. AAPG Bull. 1998, 82, 2003–2030. [Google Scholar] [CrossRef]
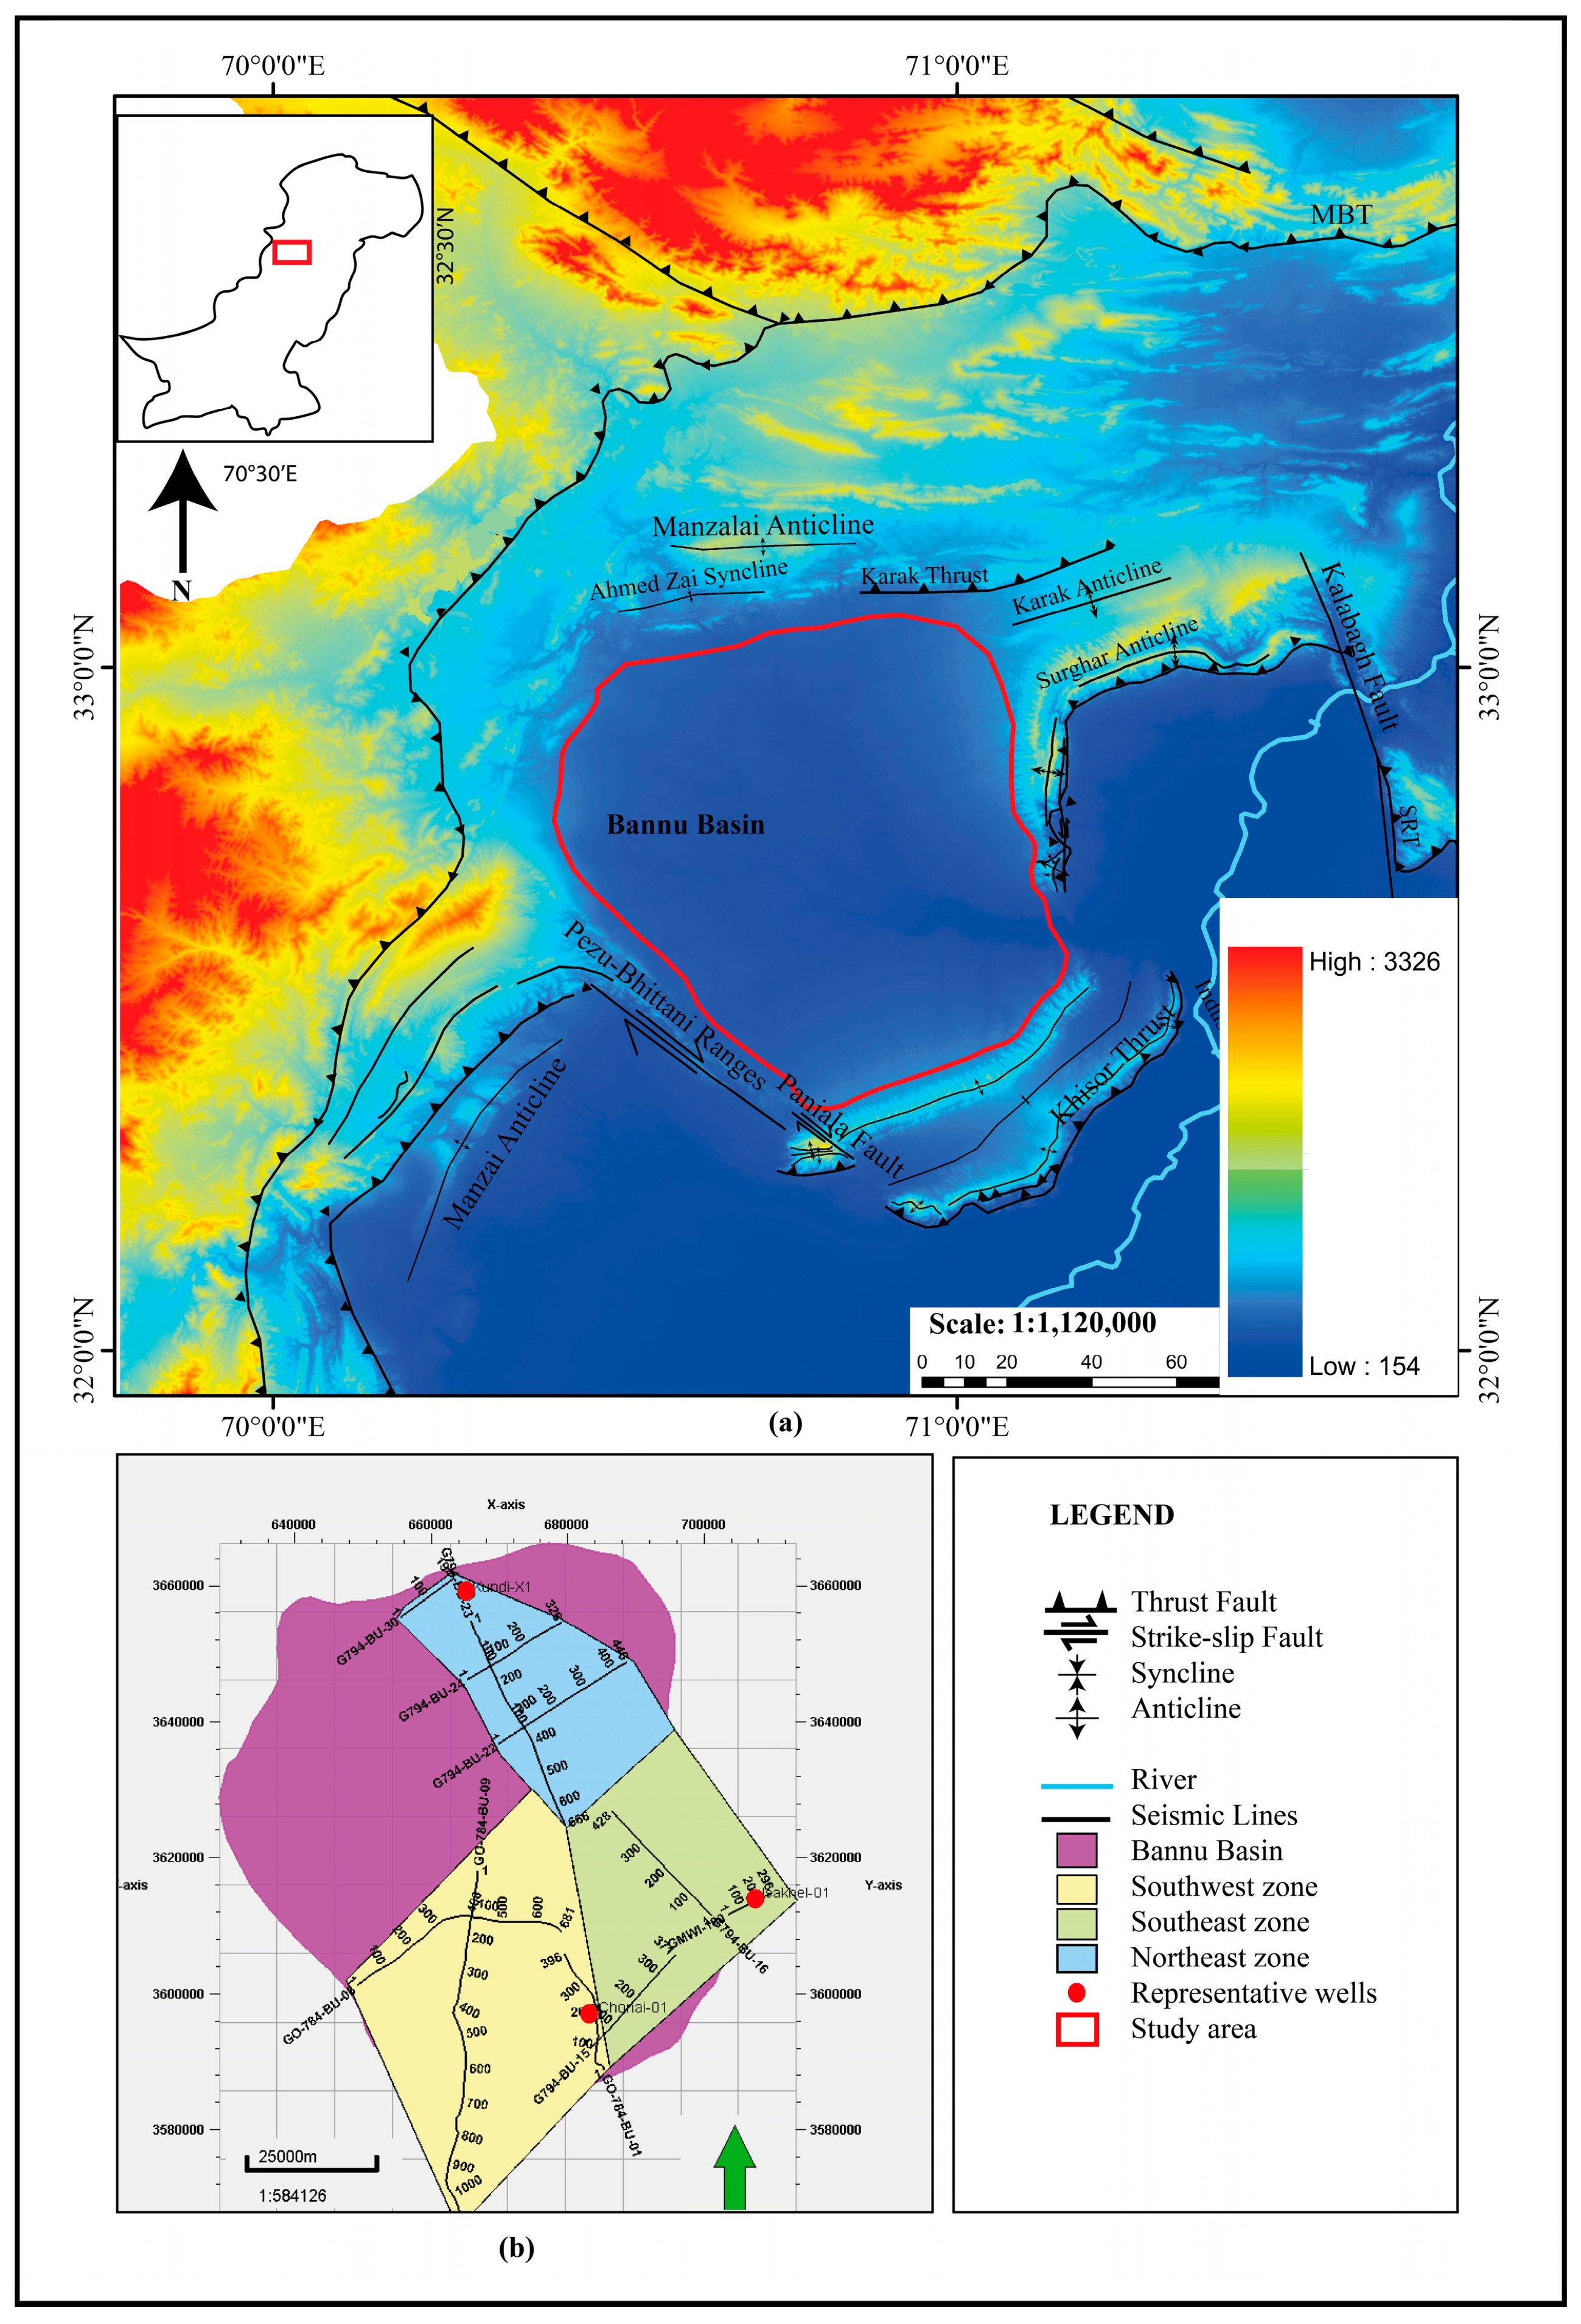
Figure 1. (a) The tectonic map of Bannu Basin and its surrounding Trans Indus Ranges after [46,47,48,49,50]; (b) base map of the study area showing the divided zones, seismic lines, and wells used for this research work.
Energies 16 04710 g001
Figure 2. The north–south conceptual model of the Bannu Basin indicates its deformation style and salt movement toward the south, after [27,30].
Energies 16 04710 g002
Figure 3. The stratigraphic column and the petroleum system elements of Bannu Basin, after [30].
Energies 16 04710 g003
Figure 4. Burial history plots of (a) the Chonai-01 well of the Southwestern zone, (b) Isa Khel-01 well of the Southeastern zone, and (c) the Kundi-X1 well of the Northeastern zone indicate the highest subsidence in Miocene to Recent times in the study area.
Energies 16 04710 g004
Figure 5. Two-dimensional seismic sections of (a) Southwestern zone A-A′, (b) Southeastern zone B-B′, and (c) Northeastern zone C-C′, indicating different interpreted horizons which contribute to the petroleum system of the study area.
Energies 16 04710 g005
Figure 6. Basal heat flow maps of (a) Southwestern zone, (b) Southeastern zone, and (c) Northeastern zone based on the integration of modeled vitrinite and temperature data with measured data.
Energies 16 04710 g006
Figure 7. (a) Two-dimensional north–south profiles and plan views of (b) the Mianwali Formation, (c) the Datta Formation, and (d) the Chichali Formation, indicating the thermal maturity of the source rocks in the Southwestern zone.
Energies 16 04710 g007
Figure 8. (a) Two-dimensional east–west profiles and plan views of (b) the Tredian Formation, (c) the Mianwali Formation, and (d) the Chichali Formation indicating the thermal maturity of the source rocks in the Southeastern zone.
Energies 16 04710 g008
Figure 9. (a) Two-dimensional north–south profiles and plan views of (b) the Chichali Formation and (c) the Panoba Formation, suggesting the thermal maturity of the source rocks in the Northeastern zone.
Energies 16 04710 g009
Figure 10. Transformation ratio of hydrocarbons into different source rocks of the Southwestern zone: (a) north–east profile, (b) plan view of Mianwali Formation, (c) plan view of Datta Formation and (d) Chichali Formation; Southeastern zone: (e) east–west profile, (f) Khisor Formation, (g) Mianwali Formation, and (h) Datta Formation; Northeastern zone: (i) north–south profile view, (j) plan view of Chichali Formation, and (k) Panoba Formation.
Energies 16 04710 g010
Figure 11. Two-dimensional profile views of hydrocarbon migration pathways and hydrocarbon accumulations in the (a) Southwestern zone, (b) Southeastern zone, and (c) Northeastern zone.
Energies 16 04710 g011
Figure 12. Petroleum system charts of three divided zones (a) Southwestern, (b) Southeastern, and (c) Northeastern, indicating the petroleum system elements (source, reservoir, and seal), the timing of hydrocarbon generation and hydrocarbon migration, accumulation, and critical moment in the study area.
Energies 16 04710 g012
Figure 13. The integrated curves indicate the relationships among the burial depths, thermal maturities, and transformation ratios of different source rocks in the (a) Southwestern zone, (b) Southeastern zone, and (c) Northeastern zone.
Energies 16 04710 g013
Table 1. Petrophysical properties assigned based on the lithological distributions of bulk formations encountered in each zone.
ZonesFormationsLithology (%)Initial Por. (%)Density
(kg m−3)
Perm. at
Porosity of (log mD *)
Heat Capacity
(Kcal Kg−1 K−1)
Thermal
Conductivity
(W m−1 K−1)
Lm. *Ss. *Sh. *25%45%20 °C100 °C20 °C100 °C
Southwestern ZoneSiwaliks-386258.92707.6−0.70.80.200.242.22.1
Kamlial Fm-425857.42725.2−0.90.60.210.242.22.1
Sakesar Fm90-1038.52736.02.22.40.200.232.82.5
Patala Fm −1.3
Lumshiwal Fm-92844.22700.02.54.40.200.235.34.4
Chichali Fm-59568.52617.5−2.7−1.00.210.241.51.6
Samanasuk Fm95-536.62738.02.52.80.200.232.92.6
Shinawari Fm8015540.52720.01.92.40.200.232.62.4
Datta Fm-406058.82646.0−0.61.10.200.242.52.3
Tredian Fm-851546.22700.02.13.80.200.234.94.0
Mianwali Fm-356559.52662.5−1.20.30.210.241.91.9
Southeastern ZoneSiwaliks-485256.02709.6−0.11.30.200.242.52.3
Samanasuk Fm93-737.22737.22.42.80.200.232.82.6
Datta Fm-425858.22647.8−0.41.20.200.242.62.4
Tredian Fm-891145.02700.02.33.80.200.235.14.2
Mianwali Fm-376358.92665.5−1.10.40.210.241.91.9
Warcha Fm -901044.82700.02.44.10.200.235.24.3
Khisor Fm-188264.62637.0−2.1−0.30.210.241.61.7
Northeastern ZoneSiwaliks-514955.22710.200.01.40.200.242.52.3
Kamlial Fm-455556.52727.0−0.70.90.210.242.22.1
Kuldana/Panoba Fm10-90532623.0−2.4−1.00.210.241.51.6
Lumshiwal Fm-871345.62700.02.24.00.200.235.04.1
Chichali Fm-89267.62622.0−2.6−1.00.210.241.51.6
* Lm.: limestone; * Ss.: sandstone; * Sh.: shale; * mD: millidarcy.
Table 2. Geochemical and kinetic parameters assigned to source rocks in different zones in the model.
ZonesAgeSource RockTOC (%)HI
(mg HC/g TOC)
VRKerogen TypeCapillary Pressure Petroleum-Water (MPa)
60% por. (Khisor Fm, Mianwali Fm)
53% por.
(Datta Fm, Chichali Fm, Panoba Fm)
25% por.5% por.
Southwestern
Zone
TriassicMianwali Fm0.503800.93Type II/III00.141.2
JurassicDatta Fm2.651300.800.121.01
CretaceousChichali Fm1.242470.600.251.63
Southeastern ZonePermianKhisor Fm0.902100.700.221.41
TriassicMianwali Fm1.682540.6400.141.04
JurassicDatta Fm0.67140 00.130.90
Northeastern ZoneCretaceousChichali Fm1.101800.6200.251.55
PaleocenePanoba Fm0.61980.5100.221.53
Disclaimer/Publisher’s Note: The statements, opinions and data contained in all publications are solely those of the individual author(s) and contributor(s) and not of MDPI and/or the editor(s). MDPI and/or the editor(s) disclaim responsibility for any injury to people or property resulting from any ideas, methods, instructions or products referred to in the content.