Article

Analysis of Changes in Electricity Generation from Renewable Energy Sources after Poland’s Accession to Structures of the European Union

by
Daniel Zbroński
1,
Henryk Otwinowski
1,
Aleksandra Górecka-Zbrońska
1,
Dariusz Urbaniak
1 and
Tomasz Wyleciał
2,*
1
Faculty of Mechanical Engineering and Computer Science, Czestochowa University of Technology, Armii Krajowej 21, 42-200 Częstochowa, Poland
2
Faculty of Production Engineering and Materials Technology, Czestochowa University of Technology, Armii Krajowej 19, 42-200 Częstochowa, Poland
*
Author to whom correspondence should be addressed.
Energies 2023, 16(12), 4794; https://doi.org/10.3390/en16124794
Submission received: 18 May 2023 / Revised: 11 June 2023 / Accepted: 16 June 2023 / Published: 19 June 2023

Abstract

:
Poland, which has been a European Union member since 2004, has undertaken compliance with its commitments to increase its share in the generation of energy from renewable sources. The target set for 2020, which is to attain a share of 15 percent of the gross final consumption of energy coming from renewable sources, has been met by Poland. The new targets for 2030, incorporated in the draft the Energy Policy of Poland 2040, assume an increase to at least 23 percent of the proportion of energy obtained from renewable sources in the gross final energy consumption. On the basis of data from the Central Statistical Office, the authors of this work analysed the changes in electricity generation based on renewable energy sources. In the period of 2004–2021, it was stated that the percentages of individual renewable sources constitute 43.7% for wind energy, 35.3% for solid biofuels, 14% for hydropower, 4.2% for biogas, 2.5% for solar energy, and 0.3% for other sources (municipal waste and liquid biofuels). In addition, this work indicates the maximal relative changes in production and the maximal changes in the portion of production, in addition to the annual and periodic rate of changes in the production of these energy sources in Poland.

1. Introduction

Primary energy is the energy contained in primary energy carriers received directly from natural renewable and non-renewable resources. In 2020, the most commonly utilised primary sources of non-renewable energy in Poland were bituminous coal, lignite, natural gas, and petroleum, whose total part in the acquisition of primary energy amounted to 78.9% [1]. On the other hand, energy from renewable sources is the energy originating from constantly recurring natural processes, and it is received from non-fossil renewable energy sources (RES) and the environment, as well as energy generated from solid, liquid, and gaseous biofuels, whose total share in the acquisition of primary energy equalled 21.1% in 2021 [1]. Many countries are developing the renewable energy sector using public support. The aim of [2] was to investigate the function of public support in renewable energy technologies in the setting of the emerging market of Poland. Public aid also has an effect on local authorities’ behaviour [3]. Local governments play a very important role in the process of raising the production and utilisation of renewable energy at the local level. This applies to economic, social, and political conditions. The standing of the RES sector in Poland in the context of development tendencies around the world is presented in [4]. In [5], the forecasts for energy production from RES in Poland are presented. Artificial neural networks were employed to create the forecasts. The knowledge presented in this study can be utilised to formulate and execute climate policies in Europe and Poland. Investing in renewable energy sources can reduce energy poverty. To present changes in the degree of energy poverty in 2010–2018 in Poland, the authors of [6] proposed the unification of various measures employed by researchers to create a new synthetic measure. The authors of [7] aimed to illustrate the development of the renewable energy sector in Europe in the context of sustainable development in 2004–2019. The development of renewable energy sources concerns mainly solar energy and photovoltaics. The authors of [8] presented a multivariate analysis comparing EU countries regarding renewable energy use. Seven variables were employed in the empirical research, defining the investigated complex phenomenon, gathered between 2011 and 2020 from 27 EU countries. The use of renewable energy in EU countries is quite diverse. However, there are natural limitations to green energy, meaning that there need to be other alternative sources of energy. A comparative analysis of the development of renewable energy is also presented in [9] (Poland and Sweden) and [10] (Poland and Lithuania).
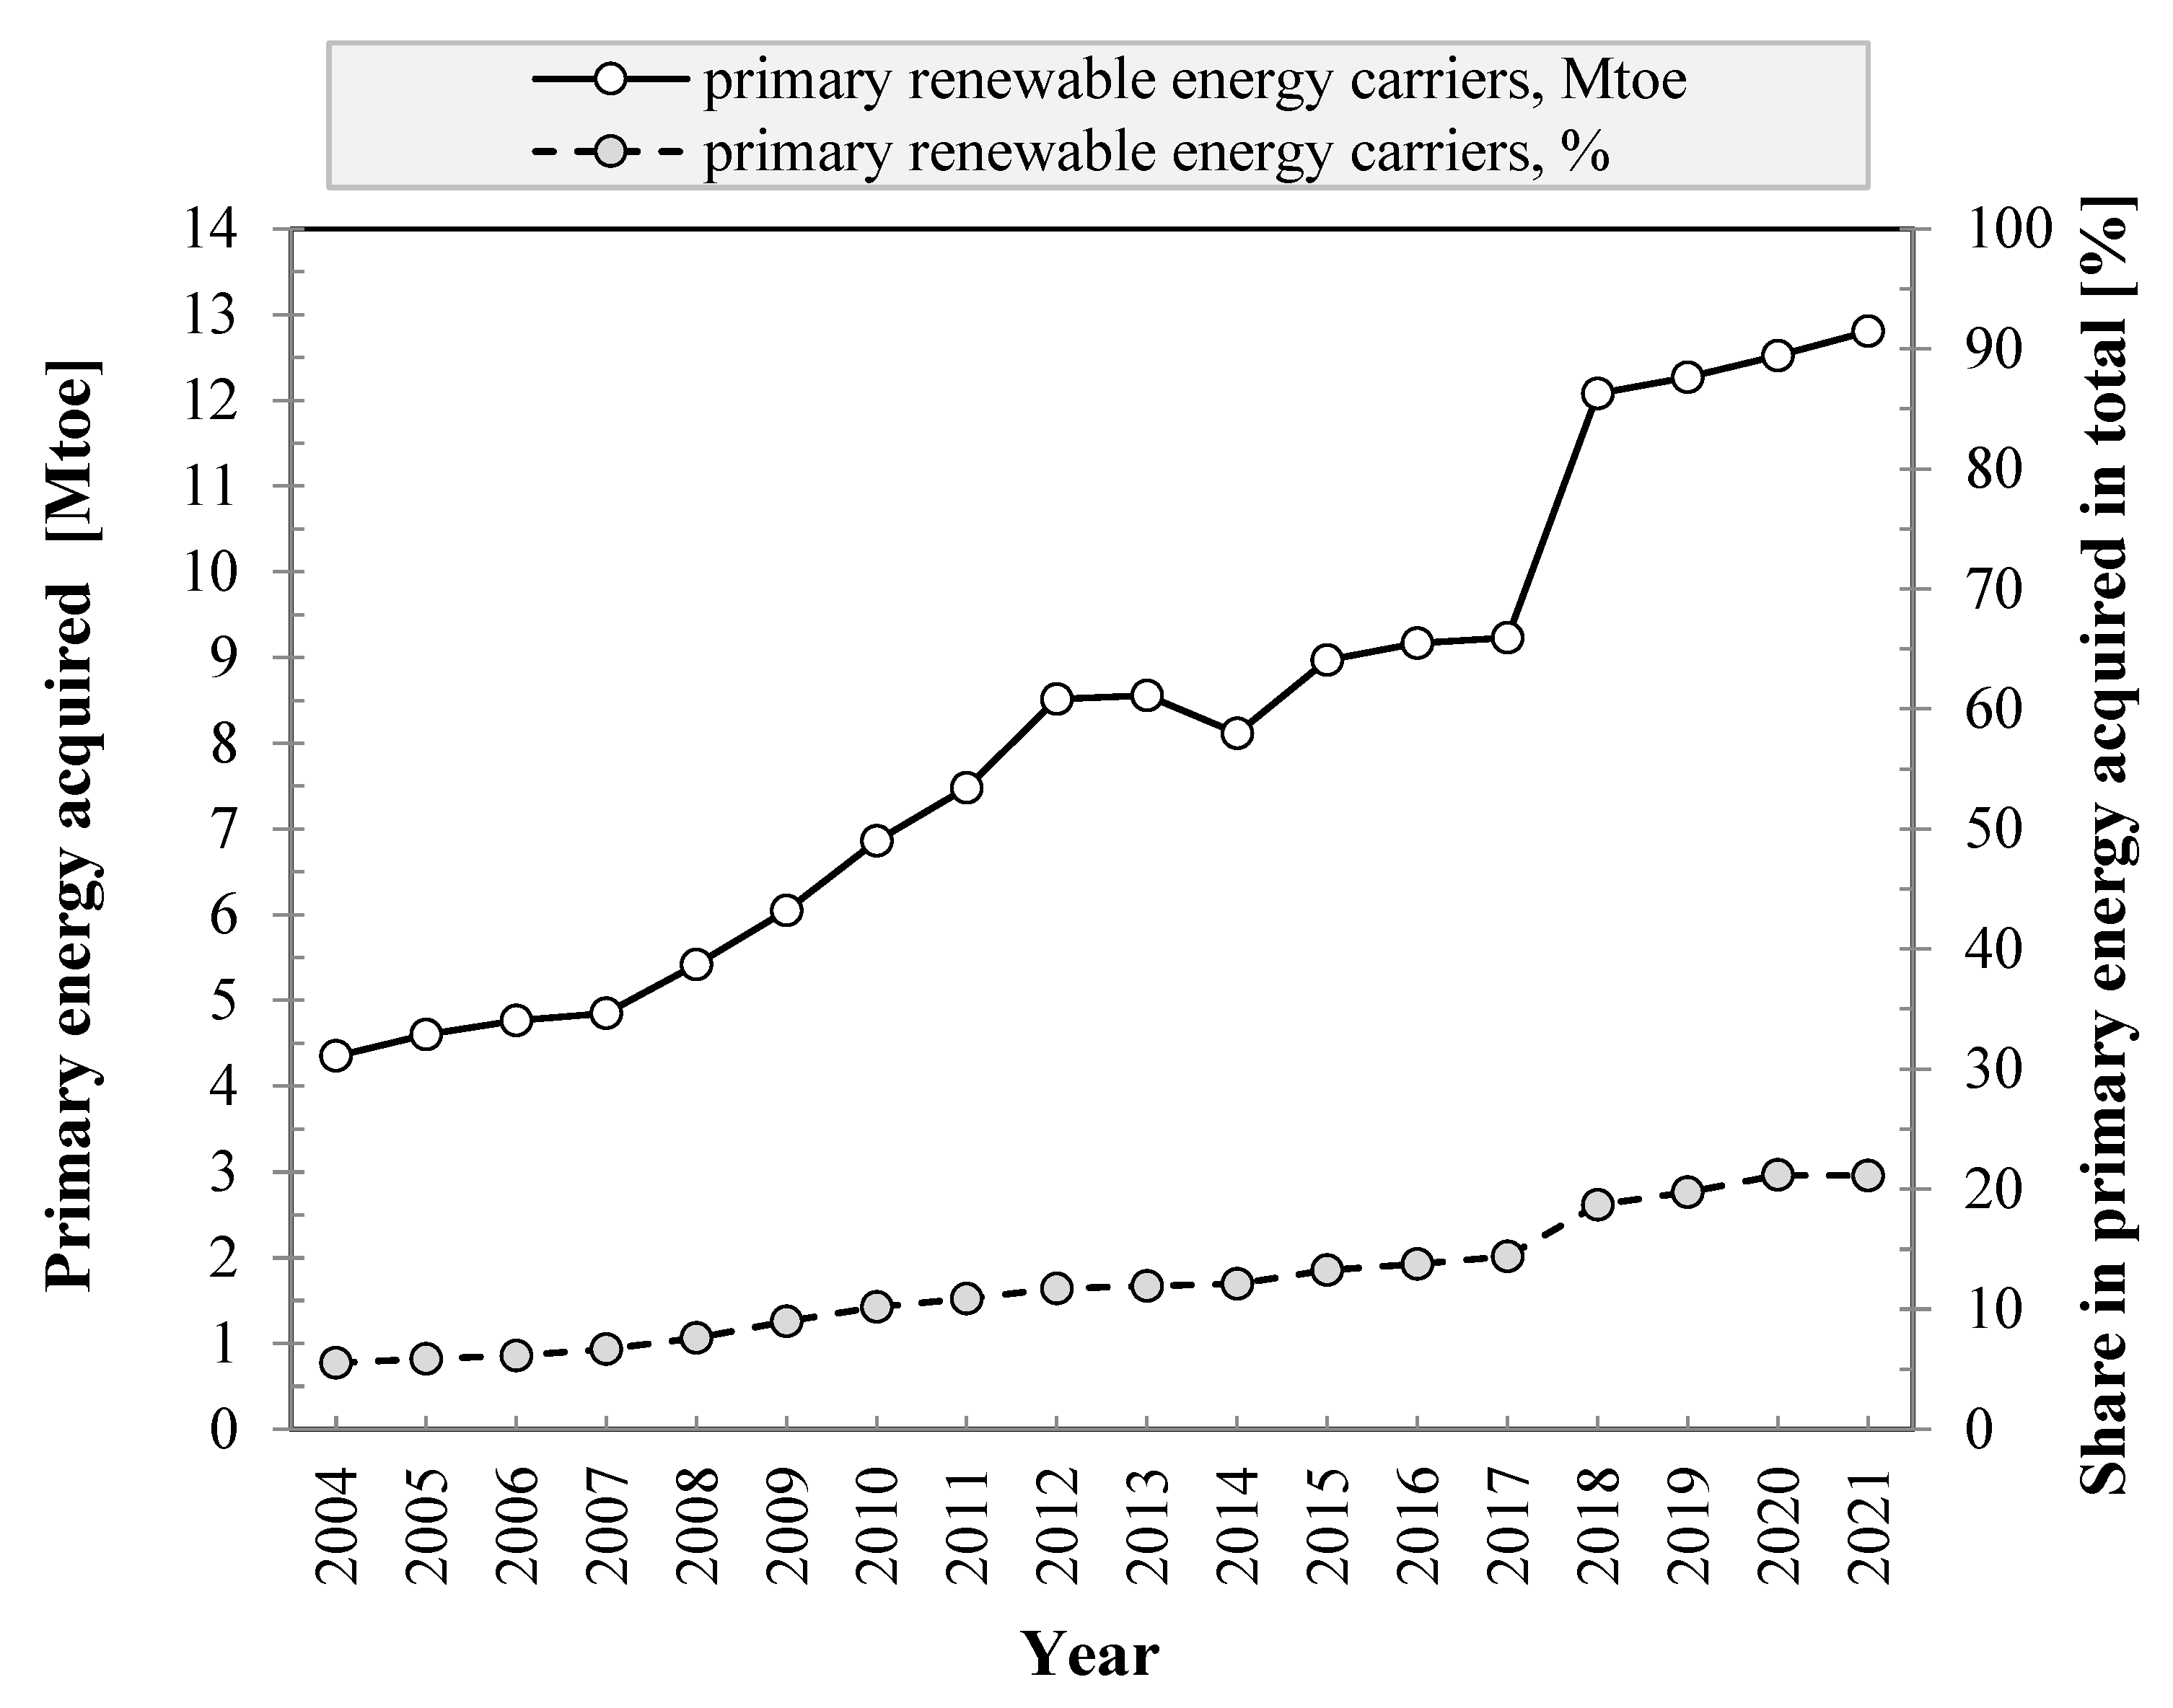
Throughout the period of 2004–2021, a rising trend in the amount of primary energy derived from renewable sources was established in the context of the total primary energy in Poland (Figure 1). The highest energy generation amounting to 12,804 Mtoe was indicated in 2021, whereas the lowest was 4354 Mtoe in 2004, meaning that the maximal relative change in energy production in this period was as much as 194%. The largest contribution of energy obtained from renewable sources in the context of the total primary energy in the country was indicated at the level of 21.2% in 2020, and the lowest was at 5.5% in 2004. The maximal change in the part of energy obtained in this period was 15.7 percentage points (p.p.).

2. Objective, Scope and Methodology of the Analysis

The objective of this analysis is to compare and evaluate the national generation of electricity from renewable energy sources in 2004–2021.
The scope of the analysis regards the main renewable energy sources used in Poland for generating energy, i.e., wind energy, solid biofuels, hydroelectricity, biogas, solar energy, municipal biodegradable waste, and liquid biofuels. The levels of obtaining electricity from these sources are continuously studied by the Production Department of the Central Statistical Office, and since 2015, they have been studied by the Energy Market Agency and the competent Ministry of Energy, based on reports gathered as part of the programme of statistical surveys of official statistics [1].
The energy received from renewable sources is used in the production of electricity and heat. The studies prepared by the Central Statistical Office [1] cover energy produced from wind, solid, liquid and gaseous biofuels, water, solar radiation, biodegradable municipal waste, geothermal resources, and the environment (heat pumps). The levels of electricity generation from individual renewable energy sources in Poland vary depending on the analysed year. The change in the electricity production structure divided into the used renewable energy sources was compared for the initial year (2004), the intermediate year (2013), and the final year (2021) of the conducted analysis (Figure 2). In 2021, in comparison to 2004, there was an increment in the level of the production of electricity from all renewable energy sources, including the greatest for wind energy (w.e.), solid biofuels (s.b.), solar energy (s.e.), and biogas (g.b.), whereas the smallest was for liquid biofuels (l.b.) and biodegradable municipal waste (b.m.w.), with an almost unchanged level for hydropower (h.p.).
Overall, in the analysed period, the proportions of individual renewable energy sources in electricity production constituted (Table 1) 43.67% for wind energy, 35.29% for solid biofuels, 14.4% for hydropower, 4.16% for biogas, 2.55% for solar energy, and less than 0.3% for other renewable energy sources, with 0.29% being biodegradable municipal waste and 0.01% being liquid biofuels.
The strategic aim of the Polish energy policy is to raise the contribution of energy obtained from renewable sources in the gross final consumption of energy to at least 23% in 2030, as stated in the adopted document on the Polish energy policy until 2040 [11], and the index of energy obtained must not be less than 28% for heating and cooling, 32% for electricity, and 14% for transport. From the technical and economic points of view, it is possible to achieve the assumed goals when using proven and safe solutions in the area of renewable energy sourced primarily from biomass, hydropower, wind energy, and solar radiation [12,13,14,15,16]. Incrementing the portion of renewable energy in the fuel structure lowers greenhouse gas emissions considerably, improves the security of the energy supply, contributes to supporting innovative sectors of the economy, and raises employment and development in every region of Poland.
The analysis makes it possible to establish the following, on a national scale, for each renewable energy source:
Maximum relative change in electricity production
R C P m a x = ( P m a x / P m i n 1 )   ,   [ ] ,
where Pmax and Pmin constitute the largest and smallest levels of production from an energy source [toe].
Maximum change in the share of electricity production
C S P m a x = S P m a x S P m i n   ,   [ p . p . ]
where SPmax and SPmin represent the highest and lowest share of production from an energy source [%].
Periodic electricity production
P p = P 2021 P 2004   ,   [ toe ]
where P2004 and P2021 constitute the national energy production in 2004 and 2021 [toe].
Periodic rate of changes in electricity production
R C P p = P p / P 2004   ,   [ ]
Annual rate of changes in electricity production
R C P a = 100 [ P i + 1 / P i 1 ]   ,   i = 2004 2020 ,   [ % ]
where Pi constitutes the production in the given (i-th) calendar year, and Pi+1 constitutes the production in the subsequent (i + 1) calendar year [toe].
As there was no electricity generation for three sources of renewable energy in 2004, the analysis adopted the following as the relevant base year: 2009 for liquid biofuels, 2011 for solar energy, and 2016 for biodegradable municipal waste, for which the Central Statistical Office provided data confirming the production.
The analysis methodology adopted in this study regarding the method of gathering and processing information about annual levels of electricity production from the selected sources of renewable energy corresponds to the methodology proposed in [1,17,18]. A Microsoft Excel spreadsheet was used to calculate the above indicators.

3. Analysis of Electricity Production Results

3.1. Wind Energy

The history and scheme of the evolution of the Polish wind power sector are presented in [19]. Because the potentiality of wind farms is governed by the prospects of producing electricity by systems, this energy constitutes the whole source of changes in the energy sector [20]. In 2004–2021, a dynamic rise in the production of electricity from wind energy was seen in Poland (Figure 3).
The largest production of electricity from wind energy equalling 1395.8 toe was recorded in 2021, and the lowest of 11.7 ktoe was recorded in 2005. Therefore, a 119-fold rise in the maximal relative change in production (RCPmax) was recorded in the analysed period. The highest share of electricity production on the basis of wind energy in the context of the production of electricity from renewable sources in Poland was established at 61.8% in 2017, and the lowest was at 3.5% in 2005. This means that the maximal change in the share of production (CSPmax) in the analysed period was 58.3 pp (Table 2). The periodic production of electricity from wind energy (Pp) in the country grew by 1383.6 ktoe, which is a 113-fold increment in the periodic rate of change in production (RCPp) in 2021 when compared to the level of production from 2004.
In 2005 and 2018, a negative annual rate of change in electricity production based on wind energy (RCPa) was recorded in the country, with the highest decrease of 14.2% recorded in 2018 (Table 3). A positive annual rate of change in production was recorded in the remaining period, with the highest increase of 103.7% recorded in 2007.

3.2. Solid Biofuels

Solid biofuels comprise organic non-fossil biofuels that can be used to produce electricity and/or heat. These fuels are commonly composed of forest biomass, paper and wood industry waste, fuels from plantations for energy purposes, organic residues coming from horticulture and agriculture, and charcoal [13,21]. In 2004–2012, a dynamic rise in the production of electricity from solid biofuels in Poland was observed (Figure 4). In 2013 and in 2015–2017, a significant decrease was observed, and in the remaining period, the stabilisation or slight increase in production was observed.
The largest production of electricity from solid biofuels, equalling 819.3 ktoe, was recorded in 2012, whereas the lowest production of 66.1 ktoe was established in 2004. Therefore, a 12-fold growth in the maximal relative change in production (RCPmax) was recorded in the analysed period. The highest contribution of electricity production based on solid biofuels in relation to electricity generation from renewable sources in Poland was recorded at 56.5% in 2009 and 2012, and the lowest was at 20.9% in 2021. Therefore, the maximal change in the share of production (CSPmax) in the analysed period was 35.6 pp (Table 4). Periodic electricity production from solid biofuels (Pp) in the country increased by 484.1 ktoe, which constitutes more than an 7-fold rise in the periodic rate of change in production (RCPp) in 2021 compared to the level of production achieved in 2004.
In 2013, in 2015–2017, and in 2021, a negative annual rate of change in electricity production based on solid biofuels was recorded in the country (RCPa), with the highest decrease of 23.4% in 2016 (Table 5). A positive annual rate of change in production was established in the remaining period, with the largest increment of 82.2% recorded in 2005.

3.3. Hydropower

Hydropower can be defined as the kinetic and potential energy of inland surface water converted into electricity through hydroelectric plants. In general, renewable energy consists only of electricity generation in flow-through power plants. As a whole, this energy is a source of change in the professional and industrial energy sectors [21,22]. Electricity production in professional hydroelectric power plants amounted to 58% from plants having a capacity of more than 10 MW, 27% for plants with a capacity from 1 to 10 MW, and 15% from plants possessing a capacity of below 1 MW [1]. In 2004–2021, the variability of electricity generation from hydropower in Poland was observed (Figure 5), with an upward trend prevailing in 2004–2010, 2015–2017, and 2021 and a downward trend in the remaining period.
The highest electricity production from hydropower amounting to 251.1 ktoe was recorded in 2010, and the lowest of 157.5 ktoe was recorded in 2015. Hence, the maximal relative change in production (RCPmax) in the analysed period was 0.59. The highest share of electricity generation based on hydropower in the context of the production of electricity from renewable sources in Poland was ascertained at the level of 67.7% in 2004, and the lowest was 7.5% in 2020. Therefore, the maximum change in the share of production (CSPmax) in the analysed period was 60.2 percentage points (Table 6). Periodic electricity production from hydropower (Pp) in the country increased by only 22.1 ktoe, which was a rise in the periodic rate of change in production (RCPp) by 0.1 in 2021 compared to the level of production in 2004.
In 2006, 2008, 2011–2012, 2014–2015, and 2018–2019, a negative annual rate of change in electricity production based on hydropower (RCPa) was recorded in the country, with the highest decrease of 23% recorded in 2018 (Table 7). A positive annual rate of change in production was determined in the remaining period, with the largest increase of 22.9% recorded in 2010.

3.4. Biogas

Biogas is a flammable gas that primarily consists of methane and carbon dioxide, received as a consequence of the oxygen-free fermentation of sewage sludge and biomass of agri-food origin in addition to waste deposited in landfills [13,21]. A total of 46% of the biogas obtained is derived from sewage treatment plants, and 22% is from landfills. A total of 32% comes from agriculture, food, as well as forestry activities. This gas was used for alternating loads during the generation of electricity and heat in cogeneration in commercial and industrial CHP plants as well as in trade and services, in the food, paper and mineral industries, and in agriculture and forestry [1]. In 2004–2021, a dynamic increase in the production of electricity from biogas in Poland was observed (Figure 6).
The largest production of electricity from biogas, amounting to 112.4 ktoe, was recorded in 2021, and the lowest of 7.1 ktoe was determined in 2004. Therefore, an almost 15-fold increase in the maximum relative change in production (RCPmax) was determined in the analysed period. The greatest share of electricity production based on biogas in the context of the production of electricity from renewable sources in Poland was established at the level of 5.2% in 2018, and the lowest was at 2.7% in 2004. Therefore, the maximal change in the share of production (CSPmax) in the analysed period was 2.5 pp (Table 8). Periodic electricity production from biogas (Pp) in the country grew by 105.3 ktoe, which was almost a 15-fold rise in the periodic rate of change in production (RCPp) in 2021 compared to the level of production in 2004.
Over the entire analysed period, a positive annual rate of change in electricity production based on biogas (RCPa) was recorded in the country, with the highest increase of 43.8% recorded in 2006 (Table 9).

3.5. Solar Energy

Solar energy is the energy of solar radiation converted into heat (solar collectors) or electricity (photovoltaic cells) [14]. The statistical reports prepared by the Central Statistical Office do not include solar energy used in reactive heating, cooling, and indoor lighting systems [1]. Because the generation of electricity from solar energy did not appear in studies prepared by the Central Statistical Office in 2004–2010, the analysis assumes 2011 as the relevant base year, in which data confirming the production are provided. Since 2011, there has been a slow increase in the generation of electricity from solar energy in Poland to the level of 14.2 ktoe in 2017, and since 2018, it has been increasing very dynamically (Figure 7).
The highest electricity production from solar energy amounting to 338.3 ktoe was recorded in 2021, and the lowest of 17.2 toe was determined in 2011. Therefore, an almost 20-fold increment in the maximal relative change in production (RCPmax) was established in the analysed period. The highest share of electricity production based on solar energy in relation to electricity generation from renewable sources in Poland was determined at the level of 12.9% in 2021, and the lowest was at 0.01% in 2011. Therefore, the maximal change in the share of production (CSPmax) in the analysed period was 12.9 pp (Table 10). The periodic production of electricity from solar energy (Pp) in the country increased by 338.3 ktoe, which was an almost 20-fold rise in the periodic rate of change in production (RCPp) in 2021 compared to the level of production in 2011.
In 2012–2021, a positive annual rate of change in electricity production based on solar energy (RCPa) was recorded in the country, with the greatest 8-fold growth recorded in 2015 (Table 11).

3.6. Biodegradable Municipal Waste

Biodegradable municipal waste constitutes combustible waste of biological origin (waste biomass, waste oils, kitchen waste, paper, foil, etc.), which is combusted in dedicated systems and originates from households, hospitals, and the service sector. Renewable fuels include those combustible wastes in a solid or liquid form, which are biodegradable and are destined for the generation of electricity and/or heat [21]. Because in 2004–2015 electricity production from biodegradable municipal waste has not been included in studies prepared by the Central Statistical Office, this analysis assumes 2016 as the appropriate base year, in which data confirming production are provided. Over the period of 2016–2021, a significant increase in the production of electricity in Poland from biodegradable municipal waste was observed (Figure 8).
The largest production of electricity from biodegradable municipal waste amounting to 30.4 ktoe was recorded in 2021, and the lowest of 1.1 ktoe was determined in 2016. Therefore, in the analysed period an almost 27-fold increment in the maximal relative change in production (RCPmax) was established. The highest share of electricity generation based on biodegradable municipal waste in relation to electricity production from renewable sources in Poland was recorded at 1.16 in 2021, and the lowest was at 0.06% in 2016. Therefore, the maximal change in the share of production (CSPmax) in the analysed period was 1.1 pp (Table 12). Periodic electricity production from biodegradable municipal waste (Pp) in the country grew by 29.3 ktoe, which was an almost 27-fold rise in the periodic rate of production change (RCPp) in 2021 compared to the level of production in 2016.
In 2017–2021, a positive annual rate of change in electricity production based on biodegradable municipal waste (RCPa) was recorded in the country, with the highest 6-fold increase recorded in 2017 (Table 13).

3.7. Liquid Biofuels

Liquid biofuels are defined as fuels produced from raw materials of organic origin (biodegradable waste or biomass), intended for transport or energy purposes (bioliquids) [21]. Natural vegetable oils and bio-components added to motor fuels produced from petroleum, such as bioethanol (for motor gasoline) and biodiesel (for diesel), can also be used as liquid biofuels [13]. Because the generation of electricity from liquid biofuels was not included in the studies prepared by the Central Statistical Office in 2004–2008, this analysis assumes 2009 as the relevant base year, in which data confirming production are provided. Throughout the period of 2009–2021, changes in the level of electricity production from liquid biofuels in Poland were observed. In 2009 and 2015, there were dynamic increases, and in the remaining period, downward trends dominated (Figure 9).
The highest generation of electricity from liquid biofuels, equalling 326.7 toe, was recorded in 2015, and the lowest generation of 17.2 toe was determined in 2012. Therefore, in the analysed period, a more than 18-fold increment in the maximal relative change in production (RCPmax) was found. The highest contribution of electricity production based on liquid biofuels in relation to electricity generation from renewable sources in Poland was determined at the level of 0.035% in 2009, and the lowest was at 0.001% in 2012. Therefore, the maximal change in the share of production (CSPmax) in the analysed period was 0.034 p.p. (Table 14). The periodic production of electricity from liquid biofuels (Pp) in the country dropped by 111.8 toe, which was a decrease by 0.4 in the periodic rate of change in production (RCPp) in 2021 compared to the level of production in 2009.
In 2010, 2012, 2014, and 2016–2021, a negative annual rate of change in electricity production based on liquid biofuels was recorded in the country, with the highest decrease of 85.7% recorded in 2012 (Table 15). A positive annual rate of change in production (RCPa) was established in the remaining period, with the greatest 12-fold rise recorded in 2015.

4. Conclusions

The authors of this work determined an increase in the acquisition of primary energy coming from renewable sources in the context of the total primary energy in Poland, from the level of 4354 Mtoe (5.5%) in 2004 to the level of 12,804 Mtoe (21.1%) in 2021. In 2004–2021, a total of 24.5 Mtoe of electricity from renewable sources was produced, including 10.71 Mtoe (43.7%) from wind energy, 8.66 Mtoe (35.3%) from solid biofuels, 3.44 Mtoe (14.0%) from hydropower, 1 Mtoe (4.2%) from biogas, 624 ktoe (2.5%) from solar energy, and 72 ktoe (0.3%) from other sources. Over the years, a change in the contribution of a given source to electricity production was established in relation to the total generation of electricity from renewable sources in Poland for wind energy (3.5 ÷ 61.8)%, solid biofuels (56.5 ÷ 21) %, hydropower (67.7 ÷ 7.5)%, biogas (2.7 ÷ 5.2)%, solar energy (0.01 ÷ 12.9)%, biodegradable municipal waste (0.06 ÷ 1.16)%, and liquid biofuels (0.035 ÷ 0.001)%. In the analysed period, the highest levels of the maximal relative change in electricity production (RCPmax) from renewable energy sources in Poland were found for solar energy and wind energy, whereas they were the lowest levels for hydroelectricity and solid biofuels. In the analysed period, the highest levels of the maximal change in the portion of electricity production (CSPmax) from renewable energy sources in Poland were found for hydropower, wind energy, and solid biofuels, whereas they were the lowest for liquid and biodegradable municipal waste biofuels. In the analysed period, the largest increments in periodic electricity production (Pp) from renewable energy sources in Poland were found for wind energy, solid biofuels, and solar energy, and the smallest were for liquid biofuels, hydropower, and biodegradable municipal waste. In the analysed period, the largest increases in the periodic rate of electricity generation changes (RCPp) from renewable energy sources in Poland were found for solar energy and wind energy, whereas they were the lowest for liquid biofuels and hydropower. In the analysed period, only positive values of the annual rate of changes in electricity production (RCPa) from renewable energy sources in Poland were established for biogas, solar energy, and biodegradable municipal waste, with mostly positive values for wind energy as well as solid biofuels and negative values for liquid biofuels, retaining the balance for hydropower.
The conclusions presented above are an analysis of data from 2004 to 2021. This was a period when the geopolitical situation of the world, and especially Europe, was different compared to the state of that after Russia’s attack on Ukraine on 24 February 2022. Before that date, Europe was on the brink of what could be the biggest energy crisis in history [23]. Until recently, the European Union was dependent on Russian energy resources—EU countries for years withdrew from their own production and imported much cheaper, for those times, raw material from Russia. After the outbreak of hostilities, previous intentions became of little relevance.
In such circumstances, Poland also faced the problem of taking immediate action to solve the problem of energy security. Energy security concerns not only the generation of electricity but also the generation of heat. The lack of supplies of about 10 million tons of coal had to be covered overnight. The EU is currently not withdrawing from decarbonisation programs and reducing the part of fossil fuels in the energy industry. Implementing ambitious plans related to FIT for 55 activities may, however, affect the degree and scope of energy poverty. The costs of energy transformation are largely borne by individual recipients, and the implementation of decisions depends on rapidly and significantly changing global conditions and long-term financial risk. In this context, the energy mix plans [23] adopted by Polish governments may be difficult to implement. All plans and forecasts for the use of RES are not able to take into account unexpected global changes. An example is the coronavirus pandemic, which caused a significant economic slowdown and reduced demand for electricity.
According to the Directive on Renewable Energy Sources (RED II), by 2050, European Union countries should achieve climate neutrality, i.e., a balance between emitting and absorbing greenhouse gases. According to the forecasts of the International Energy Agency (IEA), the percentage of RES in global energy production will grow to 30% by 2025. In the most optimistic scenario, RES may provide up to 80% of energy capacity by 2050.
According to the draft of the national plan for energy and climate for 2021–2030 [24], the share of electricity in Poland generated from lignite and hard coal will gradually decrease (to 60% in 2030). Moreover, Poland will focus on the diversification of energy carriers, increasing the part of RES to 21% in the energy mix by 2025. In accordance with EU requirements, this plan will be updated in the near future. Currently, wind energy and photovoltaics are two segments of renewable energy sources that record the fastest development dynamics. In the longer term, biogas plants and biofuels, whose potential remains untapped, may gain a considerable portion in the mix.
Wind constitutes a source of energy independent of day and night or seasons, and wind turbine technology is becoming more and more advanced and efficient. In Poland, professional wind energy will be located in the form of offshore farms on the Baltic Sea. Around 2025, Polish wind farms on the Baltic Sea will start producing energy, according to government plans, and 10 GW of power will be installed in them. Optimistic forecasts assume that, in 2040, almost 60% of energy may come from offshore wind farms alone. In the case of offshore investments, changes in the way they are financed are crucial. Investors implementing offshore wind farm projects indicate the need to introduce certain mechanisms in the so-called offshore act to improve the economics of first projects. In the first phase of the system, which ended in mid-2021, support was granted for offshore wind farms having a total installed capacity of 5.9 GW by means of an administrative decision. These installations will be built in the period of 2026–2030 [25]. In order to attain the new targets concerning the part of RES in the Polish energy mix, it will also be necessary to launch further investments in onshore wind energy, which is currently the cheapest energy production technology. Onshore wind energy currently has over 8.3 GW of capacity [25].
Along with technological progress, the costs of photovoltaic installations have dropped significantly, and their efficiency has increased. For this reason, solar energy is becoming more and more competitive compared to traditional energy sources, even in countries with moderate insolation. The development of photovoltaics in Poland is mainly related to government financial programs. The use of photovoltaic panels integrated with buildings in prosumer installations is growing. This is a major contribution to the energy mix, as a result of which the efficiency of managing energy produced from RES increases. It is expected that interest in self-generation will continue to be high. Over the last 4 years, the number of PV micro-installations has increased from approx. 50,000 up to approx. 1.2 million. This is largely due to subsidies for prosumers. Today, the photovoltaic sector accounts for more than 12 GW of installed capacity [25].
In December 2022, the installed capacity of all the generation sources in Poland equalled 60.24 GW [26]. Renewable energy sources having a capacity of 22.67 GW already account for 37.6% of the installed capacity in the Polish energy mix. In December 2021, it was 16.9 GW. Currently, in the structure of the share in the installed capacity, the largest renewable source is photovoltaics (12,189 GW). Wind energy (8256 GW) is in second place, and hydro power plants (978 MW) come third, followed by biomass power plants (969 MW) and biogas power plants (279 MW).
Electricity production in Poland in 2022 reached a record level of 175 TWh. This was largely due to a large increase of almost 9 TWh in wind and solar power generation. In May 2023, solar and wind power plants accounted for 27.7% of electricity production in Poland [27]. It is estimated that, by 2030, as much as 50 percent of the electricity demand in the country could be covered from renewable energy sources. Offshore and onshore wind farms are able to achieve an annual production of 77 TWh, and photovoltaics achieve 21 TWh.
In order to use RES resources productively, cooperation and balance between entities that generate, consume, store, and sell energy are necessary. Hence, the progress of the renewable energy sector on a macro scale depends on effective market management on a micro scale. The high growth in the efficiency of renewable energy sources is closely connected with the need to modernise the power grid. This modernisation will guarantee the flexibility of the system, i.e., the ability to adjust production to demand. Future EU action plans to invest in trans-European energy networks. With the development of energy produced from renewable energy sources, investments in modern IT technologies are necessary. Appropriate technological facilities will allow the connection of distributed renewable energy sources into an efficient energy system. IT platforms will make it possible to monitor the operation of distant wind and solar farms on an ongoing basis, to detect disturbances early enough, and to optimise the utilisation of energy generated from RES.
When analysing the RES development strategy in Poland, taking a look at the current energy mix as a whole is necessary. One of the key issues will be dynamic energy management, which will enable the movement of existing resources in the context of introducing unstable renewable sources into the system. The development of energy storage systems will be equally important, e.g., high-efficiency hydro pumped-storage power plants, above 80%.
Based on the available energy development scenarios until 2050 [28], it can be concluded that further investments in renewable energy sources are justified and necessary. The outcomes of the current study demonstrate the need to conduct further research and analyses related to the energy mix of the European Union and Poland.

Author Contributions

Conceptualisation, D.Z. and H.O.; methodology, D.Z.; software, D.Z.; validation, A.G.-Z., D.U. and D.Z.; formal analysis, D.U.; investigation, A.G.-Z.; resources, T.W.; data curation, D.Z.; writing—original draft preparation, T.W.; writing—review and editing, D.Z.; visualization, D.U.; supervision, H.O. All authors have read and agreed to the published version of the manuscript.

Funding

This research received no external funding.

Data Availability Statement

Data are contained within the article.

Conflicts of Interest

The authors declare no conflict of interest.

References

  1. Energy from Renewable Sources in 2004-2021. (“Archive” Website Tab). Available online: https://stat.gov.pl/en/topics/environment-energy/energy/energy-from-renewable-sources-in-2021,3,14.html (accessed on 29 May 2023).
  2. Jankowska, B.; Staliński, A.; Trąpczyński, P. Public policy support and the competitiveness of the renewable energy sector–The case of Poland. Renew. Sustain. Energy Rev. 2021, 149, 111235. [Google Scholar] [CrossRef]
  3. Rakowska, J.; Ozimek, I. Renewable Energy Attitudes and Behaviour of Local Governments in Poland. Energies 2021, 14, 2765. [Google Scholar] [CrossRef]
  4. Igliński, B.; Pietrzak, M.B.; Kiełkowska, U.; Skrzatek, M.; Kumar, G.; Piechota, G. The assessment of renewable energy in Poland on the background of the world renewable energy sector. Energy 2022, 261 Pt B, 125319. [Google Scholar] [CrossRef]
  5. Brodny, J.; Tutak, M.; Saki, S.A. Forecasting the Structure of Energy Production from Renewable Energy Sources and Biofuels in Poland. Energies 2020, 13, 2539. [Google Scholar] [CrossRef]
  6. Biernat-Jarka, A.; Trębska, P.; Jarka, S. The Role of Renewable Energy Sources in Alleviating Energy Poverty in Households in Poland. Energies 2021, 14, 2957. [Google Scholar] [CrossRef]
  7. Bórawski, P.; Wyszomierski, R.; Bełdycka-Bórawska, A.; Mickiewicz, B.; Kalinowska, B.; Dunn, J.W.; Rokicki, T. Development of Renewable Energy Sources in the European Union in the Context of Sustainable Development Policy. Energies 2022, 15, 1545. [Google Scholar] [CrossRef]
  8. Stec, M.; Grzebyk, M. Statistical Analysis of the Level of Development of Renewable Energy Sources in the Countries of the European Union. Energies 2022, 15, 8278. [Google Scholar] [CrossRef]
  9. Ślusarczyk, B.; Żegleń, P.; Kluczek, A.; Nizioł, A.; Górka, M. The Impact of Renewable Energy Sources on the Economic Growth of Poland and Sweden Considering COVID-19 Times. Energies 2022, 15, 332. [Google Scholar] [CrossRef]
  10. Chomać-Pierzecka, E.; Sobczak, A.; Urbańczyk, E. RES Market Development and Public Awareness of the Economic and Environmental Dimension of the Energy Transformation in Poland and Lithuania. Energies 2022, 15, 5461. [Google Scholar] [CrossRef]
  11. Announcement of the Minister of Climate and Environment of March 2, 2021 on the State Energy Policy until 2040. Available online: https://isap.sejm.gov.pl/isap.nsf/download.xsp/WMP20210000264/O/M20210264.pdf (accessed on 29 May 2023). (In Polish)
  12. Kurowski, K. (red); New Selected Technologies in the Use of Renewable Energy Sources, 1st ed.; UKSW: Warszawa, Poland, 2015; ISBN 978-83-8090-058-5. (In Polish) [Google Scholar]
  13. Pokój, T.; Pawłowska, M.; Klimuk, E. Biofuels, 1st ed.; WN PWN: Warszawa, Poland, 2012; ISBN 978-83-0117-170-4. (In Polish) [Google Scholar]
  14. Sibiński, M.; Znajdek, K. Photovoltaic Devices and Installations, 1st ed.; WN PWN: Warszawa, Poland, 2016; ISBN 978-83-0118-837-5. (In Polish) [Google Scholar]
  15. Tytko, R. Renewable Energy Devices and Systems, 15th ed.; Eco Investment: Kraków, Poland, 2022; ISBN 978-83-8111-260-8. (In Polish) [Google Scholar]
  16. Paska, J.; Surma, T. Electricity generation from renewable energy sources in Poland. Renew. Energy 2014, 71, 286–294. [Google Scholar] [CrossRef]
  17. Consumption of Fuels and Energy Carriers in 2016. Available online: https://stat.gov.pl/obszary-tematyczne/srodowisko-energia/energia/zuzycie-paliw-i-nosnikow-energii-w-2016-roku,6,11.html (accessed on 29 May 2023). (In Polish)
  18. Methodical Rules for Collecting and Presenting Data on Energy from Renewable Sources. Available online: https://stat.gov.pl/obszary-tematyczne/srodowisko-energia/energia/zasady-metodyczne-badan-statystycznych-z-zakresu-energii-ze-zrodel-odnawialnych,8,1.html (accessed on 29 May 2023). (In Polish)
  19. Igliński, B.; Iglińska, A.; Koziński, G.; Skrzatek, M.; Buczkowski, R. Wind energy in Poland–History, current state, surveys, Renewable Energy Sources Act, SWOT analysis. Renew. Sustain. Energy Rev. 2016, 64, 19–33. [Google Scholar] [CrossRef]
  20. Maj, J.; Kwiatkiewicz, P. (red); Wind Energy in Selected Aspects, 1st ed.; Clean Energy Foundation: Poznań, Poland, 2016; ISBN 978-83-6454-106-3. (In Polish) [Google Scholar]
  21. Klugmann-Radziemska, E.; Lewandowski, W.M. Pro-Ecological Renewable Energy Sources, 1st ed.; WN PWN: Warszawa, Poland, 2017; ISBN 978-83-0119-067-5. (In Polish) [Google Scholar]
  22. Michałowski, S.; Plutecki, J. Hydropower, 1st ed.; WNT: Warszawa, Poland, 1975. (In Polish) [Google Scholar]
  23. Kryszk, H.; Kurowska, K.; Marks-Bielska, R.; Bielski, S.; Eźlakowski, B. Barriers and Prospects for the Development of Renewable Energy Sources in Poland during the Energy Crisis. Energies 2023, 16, 1724. [Google Scholar] [CrossRef]
  24. National Plan for Energy and Climate for 2021–2030. Available online: https://energy.ec.europa.eu/system/files/2019-02/poland_draftnecp_0.pdf (accessed on 9 June 2023). (In Polish).
  25. Energy Based on RES—Challenges and Prospects in the Coming Years. Available online: https://nowoczesny-przemysl.pl/energetyka-oparta-na-oze-konferencja/ (accessed on 9 June 2023). (In Polish).
  26. Over 21% of Energy Came from RES! Energy Mix and Structure of Energy Production in Poland in 2022. Available online: https://globenergia.pl/ponad-21-energii-pochodzilo-z-oze-miks-energetyczny-i-struktura-produkcji-energii-w-polsce-w-2022-r/ (accessed on 9 June 2023). (In Polish).
  27. For the First Time in the EU, Photovoltaics Overtook Coal-Fired Power Plants. Available online: https://swiatoze.pl/po-raz-pierwszy-w-ue-fotowoltaika-wyprzedzila-elektrownie-weglowe/ (accessed on 9 June 2023). (In Polish).
  28. Energy 2050. Available online: https://transformacja2050.pl//project/o-projekcie/ (accessed on 9 June 2023). (In Polish).
Figure 1. Changes in energy obtained from renewable energy sources in the context of total primary energy in Poland.
Energies 16 04794 g001
Figure 2. Changes in energy obtained from renewable energy sources in the context of total primary energy in Poland: w.e.: wind energy, s.b.: solid biofuels, h.p.: hydropower, g.b.: biogas, s.e.: solar energy, b.m.w.: biodegradable municipal waste, l.b.: liquid biofuels.
Energies 16 04794 g002
Figure 3. Results of changes in electricity generation from wind energy in Poland.
Energies 16 04794 g003
Figure 4. Results of changes in electricity production from solid biofuels in Poland.
Energies 16 04794 g004
Figure 5. Results of change in production of electricity from hydropower in Poland.
Energies 16 04794 g005
Figure 6. Results of changes in electricity production from biogas in Poland.
Energies 16 04794 g006
Figure 7. Results of changes in the production of electricity from solar energy in Poland.
Energies 16 04794 g007
Figure 8. Results of changes in electricity production from biodegradable municipal waste in Poland.
Energies 16 04794 g008
Figure 9. Results of changes in electricity generation from liquid biofuels in Poland.
Energies 16 04794 g009
Table 1. Electricity production in 2004–2021 according to renewable energy sources used in Poland.
Source of EnergyProduction
ktoe%
wind energyw.e.10,710.143.67
solid biofuelss.b.8655.135.29
hydropowerh.p.3442.114.04
biogasg.b.1021.04.16
solar energys.e.624.22.55
biodegradable municipal wasteb.m.w.70.40.29
liquid biofuelsl.b.02.00.01
Table 2. Maximal relative changes, maximal changes in share, and periodic rate of changes in electricity production in Poland from wind energy in 2004–2021.
RCPmaxCSPmaxPpRCPp
-p.p.ktoe -
118.858.31383.6113.1
Table 3. Annual rate of change in production of electricity in Poland from wind energy.
YearRCPaYearRCPaYearRCPaYearRCPa
%%%%
2005−4.8201054.5201541.520204.6
200689.0201192.5201615.920212.7
2007103.7201248.1201718.4
200860.4201326.52018−14.2
200928.7201427.8201918.0
Table 4. Maximal relative changes, maximal changes in share, and periodic rate of changes in production of electricity from solid biofuels in Poland in 2004–2021.
RCPmaxCSPmaxPpRCPp
-p.p.ktoe -
11.435.6484.17.3
Table 5. Annual rate of change in electricity production from solid biofuels in Poland.
YearRCPaYearRCPaYearRCPaYearRCPa
%%%%
200582.2201020.42015−1.520207.6
200630.9201121.12016−23.420217.7
200728.8201233.32017−23.2
200842.62013−16.820180.5
200945.7201415.5201920.8
Table 6. Maximal relative changes, maximal changes in share, and periodic rate of changes in production of electricity from hydropower in Poland in 2004–2020.
RCPmaxCSPmaxPpRCPp
-p.p.ktoe-
0.5960.222.10.1
Table 7. Annual rate of change in electricity production from hydropower in Poland.
YearRCPaYearRCPaYearRCPaYearRCPa
%%%%
20055.7201022.92015−16.120208.2
2006−7.22011−20.2201616.8202110.4
200715.22012−12.6201719.6
2008−8.5201319.72018−23.0
200910.42014−10.52019−0.6
Table 8. Maximal relative changes, maximal changes in share, and periodic rate of changes in production of electricity from biogas in Poland in 2004–2021.
RCPmaxCSPmaxPpRCPp
-p.p.ktoe-
14.92.5105.314.9
Table 9. Annual rate of change in electricity production from biogas in Poland.
YearRCPaYearRCPaYearRCPaYearRCPa
%%%%
200535.4201024.8201511.020208.7
200643.8201113.2201613.420215.9
200721.9201225.320176.7
200828.9201322.020182.8
200926.9201418.420190.7
Table 10. Maximal relative changes, maximal changes in share, and periodic rate of changes in electricity generation from solar energy in Poland over the period of 2011–2021.
RCPmaxCSPmaxPpRCPp
-p.p.ktoe-
19,67112.9338.319,671
Table 11. Annual rate of change in electricity production from solar energy in Poland.
YearRCPaYearRCPaYearRCPaYearRCPa
%%%%
200520102015720.32020175.5
200620112016118.92021100.9
20072012450.0201733.6
2008201336.4201881.6
20092014360.02019136.5
Table 12. Maximal relative changes, maximal changes in the share, and periodic rate of change in electricity production in Poland from biodegradable municipal waste over the period of 2016–2021.
RCPmaxCSPmaxPpRCPp
-p.p.ktoe-
26.91.129.326.9
Table 13. Annual rate of change in electricity production from biodegradable municipal waste in Poland.
YearRCPaYearRCPaYearRCPaYearRCPa
%%%%
200520102015202073.5
200620112016202194.6
200720122017535.4
2008201320185.3
20092014201923.3
Table 14. Maximal relative changes, maximal changes in share, and periodic rate of changes in electricity production from liquid biofuels in Poland in the period of 2009–2020.
RCPmaxCSPmaxPpRCPp
-p.p.toe-
18.00.034−111.8−0.4
Table 15. Annual rate of change in electricity production from liquid biofuels in Poland.
YearRCPaYearRCPaYearRCPaYearRCPa
%%%%
20052010−70.020151166.72020−5.0
2006201155.62016−10.52021−10.5
20072012−85.72017−29.4
20082013200.02018−16.7
20092014−50.020190.0
Disclaimer/Publisher’s Note: The statements, opinions and data contained in all publications are solely those of the individual author(s) and contributor(s) and not of MDPI and/or the editor(s). MDPI and/or the editor(s) disclaim responsibility for any injury to people or property resulting from any ideas, methods, instructions or products referred to in the content.

