Abstract
The electricity spot market plays a significant role in promoting the self-improvement of the overall resource utilization efficiency of the power system and advancing energy conservation and emission reduction. This paper analyzes and compares the potential impacts of spot market operations on system planning, considering the differences between planning methods in traditional and spot market environments through theoretical analysis and model comparison. Furthermore, we conduct research and analysis on grid planning methods under the spot market environment with the goal of maximizing social benefits. Unlike the pricing approach based on historical price data in traditional market simulation processes, a data-driven approach that combines experimental economics and machine learning is proposed, specifically using mixed empirical learning to simulate unit bidding strategies in market transactions. A simulation model for electricity spot market trading is constructed to analyze the performance of the planning results in the spot market environment. The case study results indicate that the proposed planning methods can enable the grid to operate well in the spot market environment, maintain relatively stable nodal prices, and ensure the integration of a high proportion of clean energy.
1. Introduction
Recently, referring to the experience of electricity market construction in developed countries such as the United States and the United Kingdom, China is also proactively facilitating the reform of power marketization. In the overall reform framework, the spot market, as a key connection part between the medium- and long-term electricity transactions and the real-time operation of the power grid, plays the role of restoring the commodity attributes of electricity, guiding the discovery of power prices, and promoting the optimal allocation of resources [1]. Compared with the power system operating conditions in the traditional centralized dispatching pattern, in the electricity spot market, the power system planning will be affected by several uncertain factors such as node electricity price fluctuation [2] and unit output adjustment [3]. Whether the existing power grid planning scheme can maintain a good operation state in a market-oriented environment needs to be verified urgently.
As a part of electricity market-oriented reformation, the electricity spot market has extensive advantages, such as encouraging demand response [4], promoting market competition [5], and optimizing resource allocation [6]. In recent studies focusing on the spot market, there is a growing interest in the involvement of virtual power plants (VPPs) and the concept of multimarket coupling. VPPs have the potential to generate revenue or mitigate risks through spot price arbitrage or frequency response support. Addressing the coordinated operation challenges of an active distribution network with multiple VPPs participating in a joint energy-reserve market, a two-level model was proposed in [7]. Furthermore, the authors of [8] introduced an optimal bidding strategy for VPPs in the frequency control ancillary service market, along with a joint bidding strategy for VPPs collaborating with wind farms. Employing a game-based approach, the cooperative benefits of both parties are maximized by ensuring fair benefit distribution. Additionally, the authors of [9] presented an analytical method for accurately calculating the cost of VPPs.
Regarding multimarket coupling, this concept can be categorized into various types based on different objectives, such as multilevel market coupling, multi-energy market coupling, or multiregional market coupling. To integrate wholesale and local markets while coordinating transmission system operators, distribution system operators, and distributed energy resources, a decentralized market trading strategy was proposed in [10]. The authors of [11] introduced a game theory-based analysis method to evaluate the impact on the multiarea electricity market through a coordinated transaction scheduling mechanism. To facilitate multi-energy collaborative optimization within local energy markets, the authors of [12] devised an indirect multi-energy transaction approach.
Moreover, market pricing and operating strategies have gained significant attention recently. The authors of [13] proposed an optimization strategy that incorporates thermal energy storage systems and concentrated solar power plants, aiming to stabilize and reduce electricity prices in the spot market. In the Australian national electricity spot and emergency reserve market, the authors of [14] presented a framework for analyzing battery operation and investigating different operating strategies across various states. Additionally, the authors of [15] proposed a selective learning scheme for bidding in the electricity spot market, while the authors of [16] designed a battery operating model that maximizes financial returns while considering battery cycle life costs and capacity degradation.
In the spot market, the issue of generation unit bidding strategy is one of the representative modeling problems in trading behavior. Bidding strategy greatly impacts multiple system state parameters including generation unit output, nodal electricity prices, and system power flows. At the same time, bidding strategy is also constrained by system safety constraints such as generator rated output and transmission line capacity. Traditional models for bidding strategy analysis mainly include experimental-based and machine learning-based methods. Experimental-based bidding strategy analysis models typically use optimization methods or game theory from economics. A stochastic optimization method was proposed in [17] to evaluate the strategies of agents in the market. They proposed a multiagent bidding strategy based on game theory to compute the market Nash equilibrium [18]. In addition, with the development of computer science, machine learning methods, particularly reinforcement learning, have been widely applied to modeling trading behaviors [19]. In the aforementioned methods, experimental-based analysis often relies on many assumptions and may not accurately reflect the true behavioral patterns of participants, while machine learning methods, due to their “black box” nature, have limitations in their application to engineering problems.
In the realm of power system planning, significant attention has been directed toward the transition to decarbonized systems and the optimization of integrated system coupling. The authors of [20] introduced the concept of optimizing emission reduction per unit cost, effectively balancing the tradeoff between cost and emission reduction in the planning process. Meanwhile, the authors of [21] proposed a method for collaborative planning of the electricity system and electric vehicle transportation network, aiming to enhance system flexibility.
Furthermore, in terms of verifying the effectiveness of planning schemes, the literature employs the empirical cumulative distribution function to assess the flexibility of the planning outcomes [22]. Addressing the grid planning process while considering time-varying or spurious electrical loads, the authors of [23] investigated the impact of grids with different sizes. Additionally, the authors of [24] utilized EnergyPLAN to model real-world data and validate planning schemes.
At present, most of the research related to the impact of the spot market on power system planning is still based on theoretical analysis and small-scale simulation. However, in the actual system operation process, more stakeholders are involved, and the system structure is more complicated. In addition, as the scale of the power system continues to enlarge, whether the planning scheme can maintain reliability and an economic requirement under a market-oriented environment still needs to be verified. This paper investigates the differences in planning methods between traditional and market environments through a comparison using mathematical models. Taking the real power system of southern China as an example, we study and analyze the actual performance of the planning schemes obtained through the proposed grid planning method in the electricity spot market environment. Meanwhile, using the hybrid experimental learning (HEL) approach, we simulate the bidding strategies of generating units during the simulation process. Lastly, through market simulation in the spot market environment, we analyze specific indicators, including the economic benefits, environmental benefits, and system reliability of various market entities. Compared to the existing research, the major contributions can be summarized as follows:
- The analysis of the market environment impact in this paper is grounded on the actual power grid conditions in southern China. Unlike traditional theoretical analysis or benchmark system simulations, this research closely aligns with real system operating conditions. It encompasses more intricate network structures and operational equipment, thereby offering precise guidance for future system planning.
- This paper utilizes the HEL approach to simulate generator bidding strategies. In contrast to the conventional method of predicting generator bidding prices solely on the basis of historical data, this approach incorporates human irrational factors. Moreover, computer agent quotations driven by data-driven techniques help maintain prices within a reasonable range.
- Through theoretical analysis and model comparisons, this paper examines and contrasts the disparities between traditional Chinese planning methods and market environmental planning methods. By combining the results of numerical cases, the economic and environmental benefits, as well as the reliability and other indicators for each market participant, are thoroughly analyzed.
The remainder of this paper is organized as follows: Section 2 introduces the possible impact of the spot market on grid planning in detail; Section 3 presents the hybrid experimental learning method; Section 4 constructs the Shenzhen China power grid planning schemes in the PROPHET 2018 software, and then analyzes the possible impact of the implementation of the spot market; Section 5 presents the conclusions.
2. Analysis of Impact on Power System Planning under Spot Market Environment
2.1. Impact Overview
Improving the efficiency and effectiveness of system operation is one of the main motivations for establishing a clean and well-equipped power market. For the current power market dispatch mode used in most countries, the system operator usually takes the power generation marginal cost of each unit as the priority parameter and calls the unit with the lowest marginal cost first. If the unit cannot meet the current demand, the unit with the next lowest marginal cost will be called in sequence. In the process of system optimization, the resources of units with high power generation efficiency will be dispatched preferentially. Therefore, due to the extremely low marginal cost of renewable energy entities, the utilization rate of high-efficiency units and renewable energy can be further improved through market dispatch, achieving the purpose of minimizing the system costs and emissions. On the other hand, these surpluses of discretionary costs can be distributed through the system, and part of them can be used to reduce the retail electricity prices of consumers, thus achieving a win–win situation.
In the spot market environment, locational marginal price (LMP), also named nodal price, serves as a critical indicator for assessing the effectiveness of the system planning scheme. LMP is influenced by various factors, such as supply and demand dynamics, transmission constraints, generation costs, and market regulations. It reflects the real-time equilibrium between electricity supply and demand at a specific location. Within the system, the occurrence of excessively high LMP can indicate the presence of underlying issues, such as escalating energy prices, transmission line congestion, and insufficient power supply capacity. Indeed, the spot market possesses commendable self-regulation capabilities. When consumers are unwilling to bear the high charges associated with the prevailing LMP, the LMP will decrease in response to reduced demand. This self-regulating mechanism ensures that the price aligns with market dynamics. In addition to the inherent self-regulation of the market, there are other crucial factors that can impact market operations. These factors include the retirement of aging generators and the installation of renewable energy sources. The retiring of aging generators plays a vital role in enhancing system efficiency, reducing overall costs, and expediting the transition toward a low-carbon system. By removing outdated and less efficient units from the system, resources can be allocated more effectively, enabling the integration of cleaner and more sustainable energy sources. This transition toward renewable energy is essential for achieving long-term environmental goals and ensuring a more sustainable energy landscape.
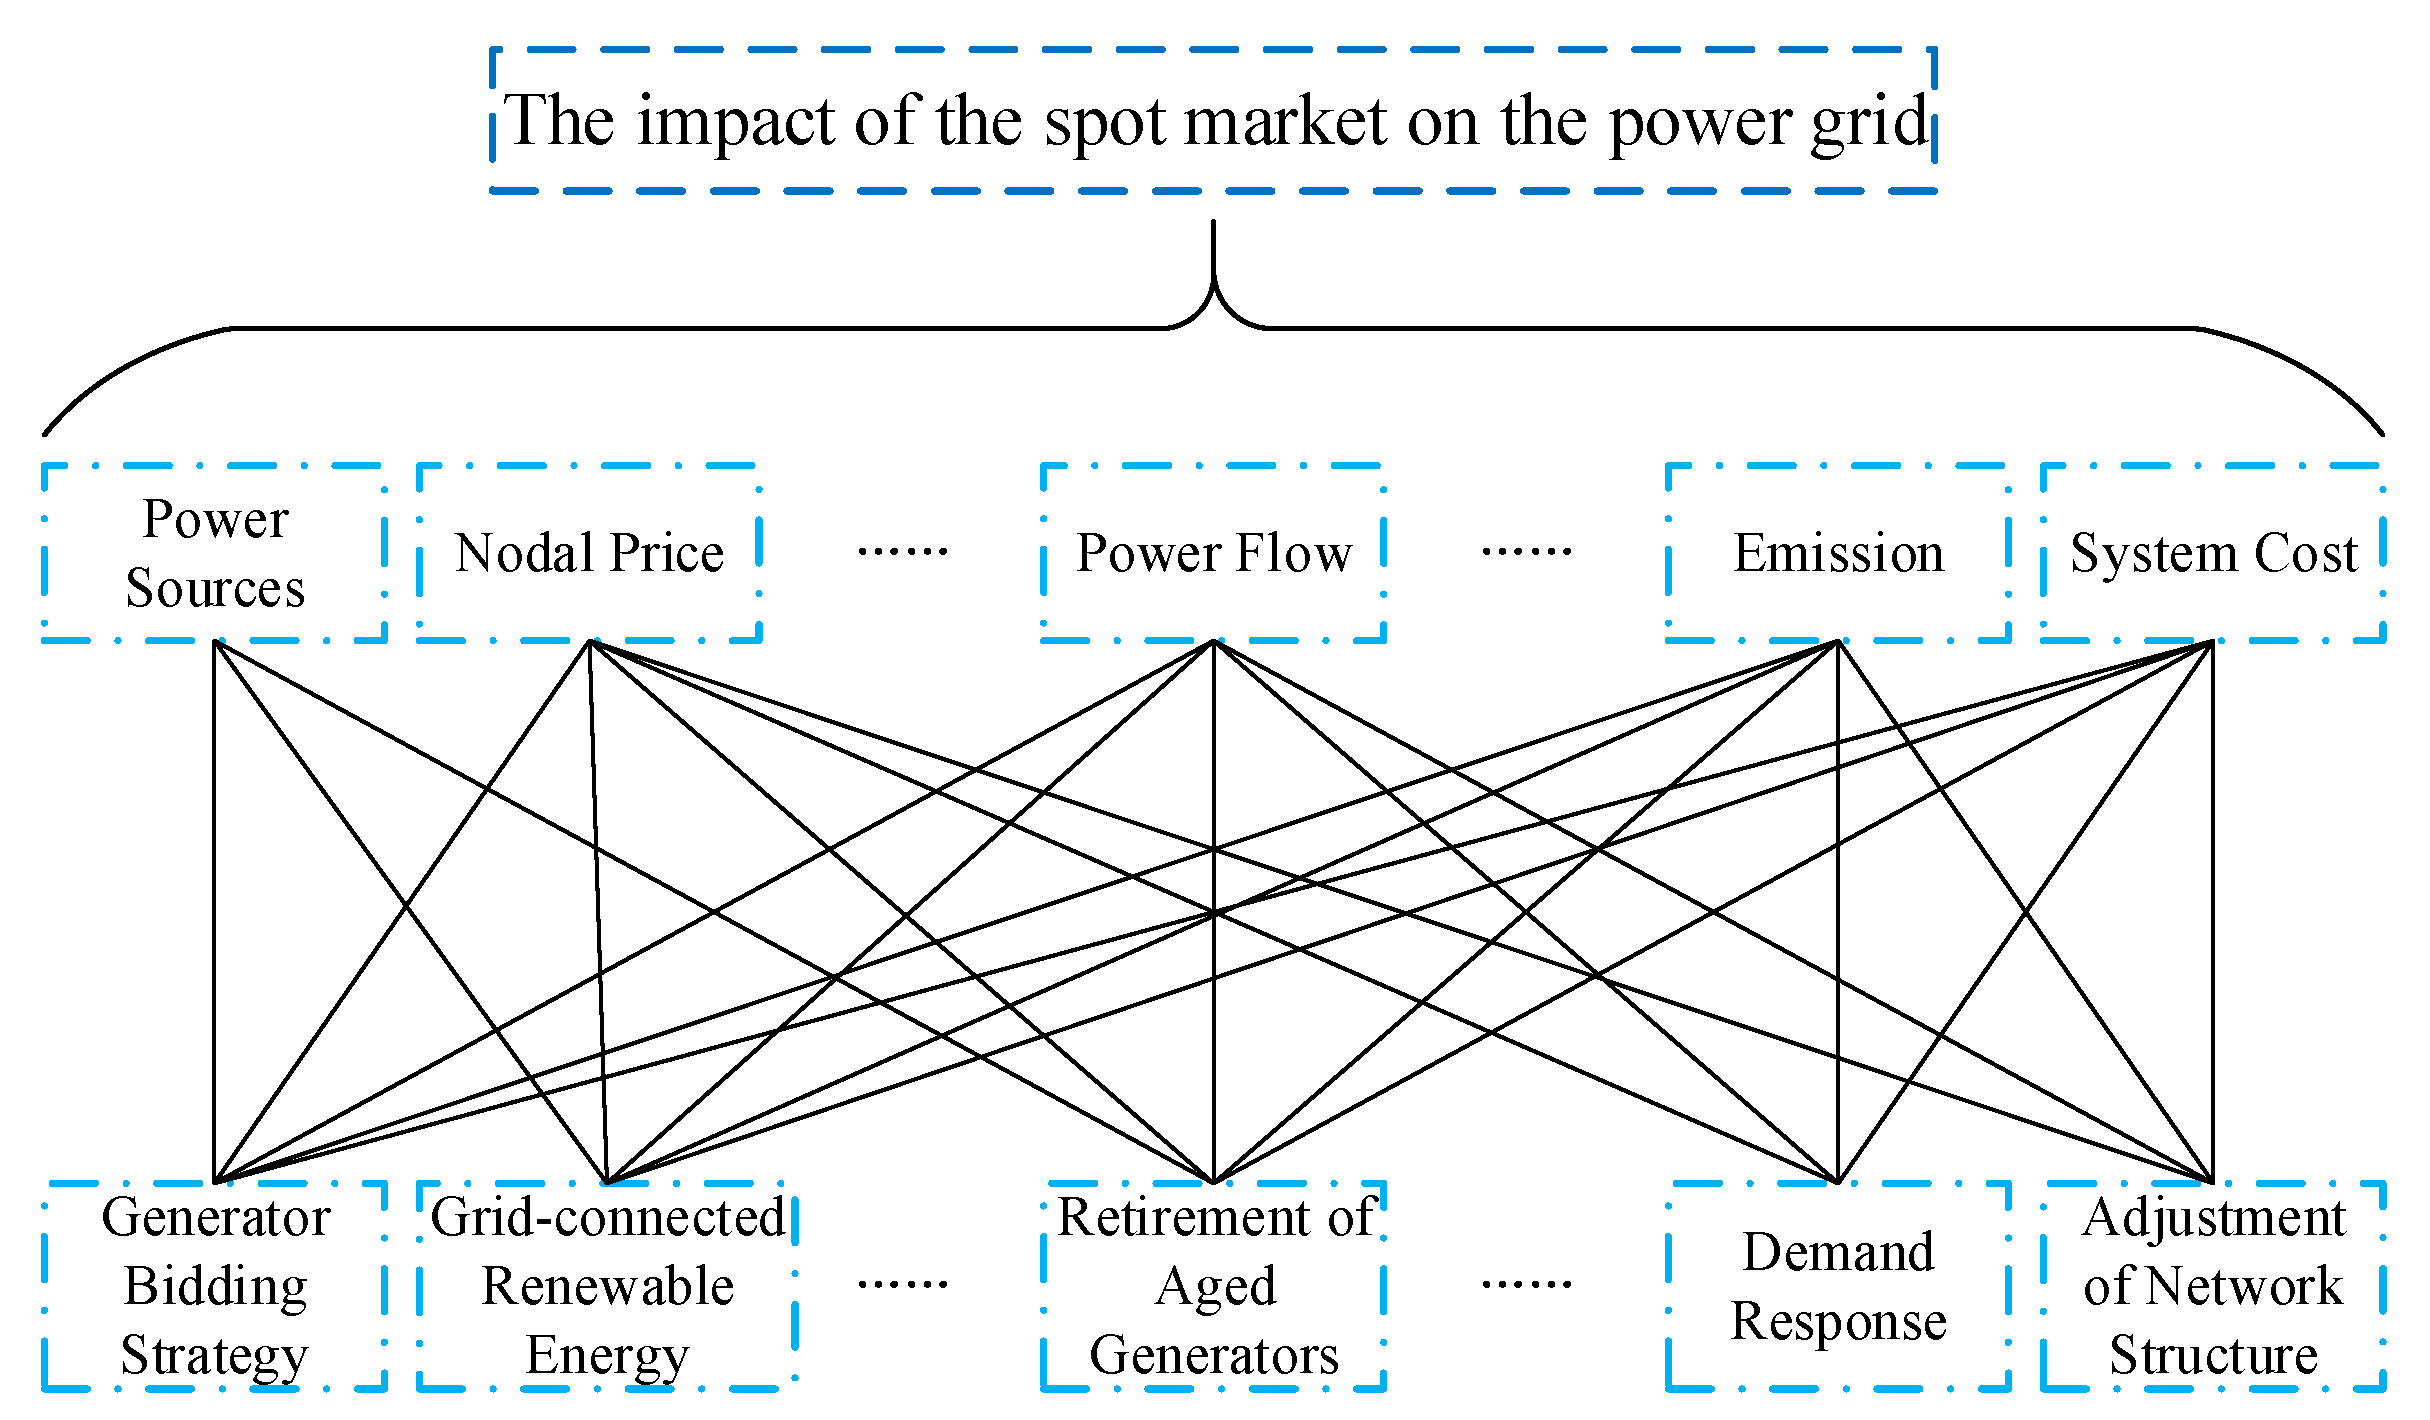
To sum up, the introduction of the electricity spot market can effectively improve system efficiency and resource allocation and reduce system costs and overall carbon emissions. However, it should be noticed that the construction of the power spot market will have an impact on the existing system planning methods. As shown in the Figure 1, after the spot market operation, compared with the original planning method, the impact can be summarized in terms of power supply, node price, power flow, emissions, and total system cost. Specifically, the reason can be further attributed to the change of unit bidding strategy, large-scale grid connection of renewable energy, the retirement of old generations, demand response, and grid layout adjustment.
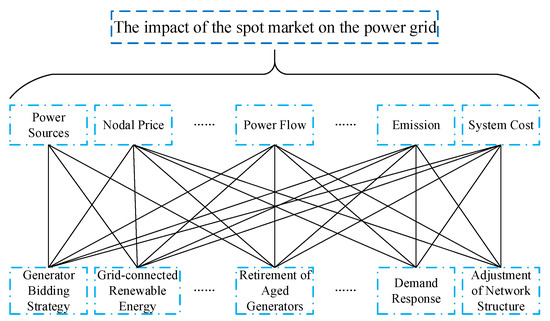
Figure 1.
Impact of spot market on power grid planning.
2.2. Power Network Expansion Planning Method
Essentially, network expansion planning methods can be expressed as minimizing the investment cost of adding transmission lines. The mathematical model of the planning objective function is usually a linear equation related to the new link, which can be expressed as follows:
where denotes the additional investment cost of the new power link , which is equal to the transmission line unit price (CNY/km) times its length (km), and indicate the numbers of newly added lines and existing transmission lines, and represent the power flow and susceptance of the link , and denote the generation output and load of bus , and represent the phase angle of bus and , and indicates the upper limit of variables. The number of adding lines should be integers, and buses and belong to the set , which are shown in Equations (8) and (9).
Transmission network expansion models can help system operators plan the power grid efficiently. However, with the increasingly serious environmental problems, this model has been unable to meet the low carbon demand of power system planning. Therefore, under the spot market environment, the grid expansion planning model needs to consider more factors such as unit cost and renewable energy utilization, so as to improve the efficiency of the system and reduce the overall carbon emissions as much as possible.
2.3. Proposed Network Expansion Planning Method under Spot Market Environment
More factors need to be considered in the planning process under spot market operation, such as unit operating costs, external power purchase costs, and installation costs for transmission lines. The introduction of different factors makes the system optimization objectives and constraints more complex.
Objective functions:
Constraints:
Under the spot market-oriented environment, some factors (e.g., the line construction cost , the unit generation cost , and the external electricity purchasing cost ) need to be further taken into consideration for the objective function, which is shown in Equation (10), where indicates the net present value (NPV), referring to the time value of funds, i.e., converting investment costs throughout the planning cycle to current prices. The generation relevance cost model is shown in Equation (12), which includes both operation cost and environmental cost, where , , and represent the generator operation cost coefficient. and depict the generation emission factor and emission cost coefficient of generators. The external electricity purchasing cost is equal to the external input power multiplied by the spot market electricity price . In addition, the constraints such as system power flow equations and unit output upper limits are the same as mentioned above, i.e., Equations (3) and (4), and (6)–(9).
Compared with traditional planning models, the constraints of the new planning method change to the forms in Equations (14)–(18). The solar power output constrains are shown in Equations (15)–(17). For photovoltaic systems, the probability density function of solar radiation can usually be represented by the beta distribution, as shown in Equation (15), where denotes the gramma function, and are parameters of Beta distribution, and and represent the solar radiation intensity and maximum intensity in the corresponding area. The solar power output is equal to the area of installed photovoltaic (PV) panels times the conversion efficiency times the solar radiation intensity.
Due to the clearing mechanism of the spot market, the main difference between the new planning method and the traditional approach is that the bidding price of various generators and the cost of purchasing external power need to be considered. The cost of the unit will greatly affect its bidding strategy in the spot market. Different bidding strategies lead to changes in the clearing results and eventually affect the network power flow.
Overall, in the traditional grid planning environment, the consideration of generating entities’ costs and their market bidding prices is not necessary. The planning scheme primarily relies on assessing the wiring costs associated with different candidate lines. Conversely, in the spot market environment, the system needs to take into account additional market factors such as power generation costs and external power purchase costs. From a policy perspective, the spot market environment introduces a decentralized decision-making process, diminishing the role of the system operators in direct planning and resource allocation. Instead, market participants respond to price signals and make decisions on the basis of their economic interests. The key distinction between planning approaches in traditional and market environments lies in the level of market competition. Traditional approaches prioritize long-term planning, while spot market environments foster market competition and decision making based on prices.
3. Unit Pricing Strategy Model Based on HEL
3.1. HEL
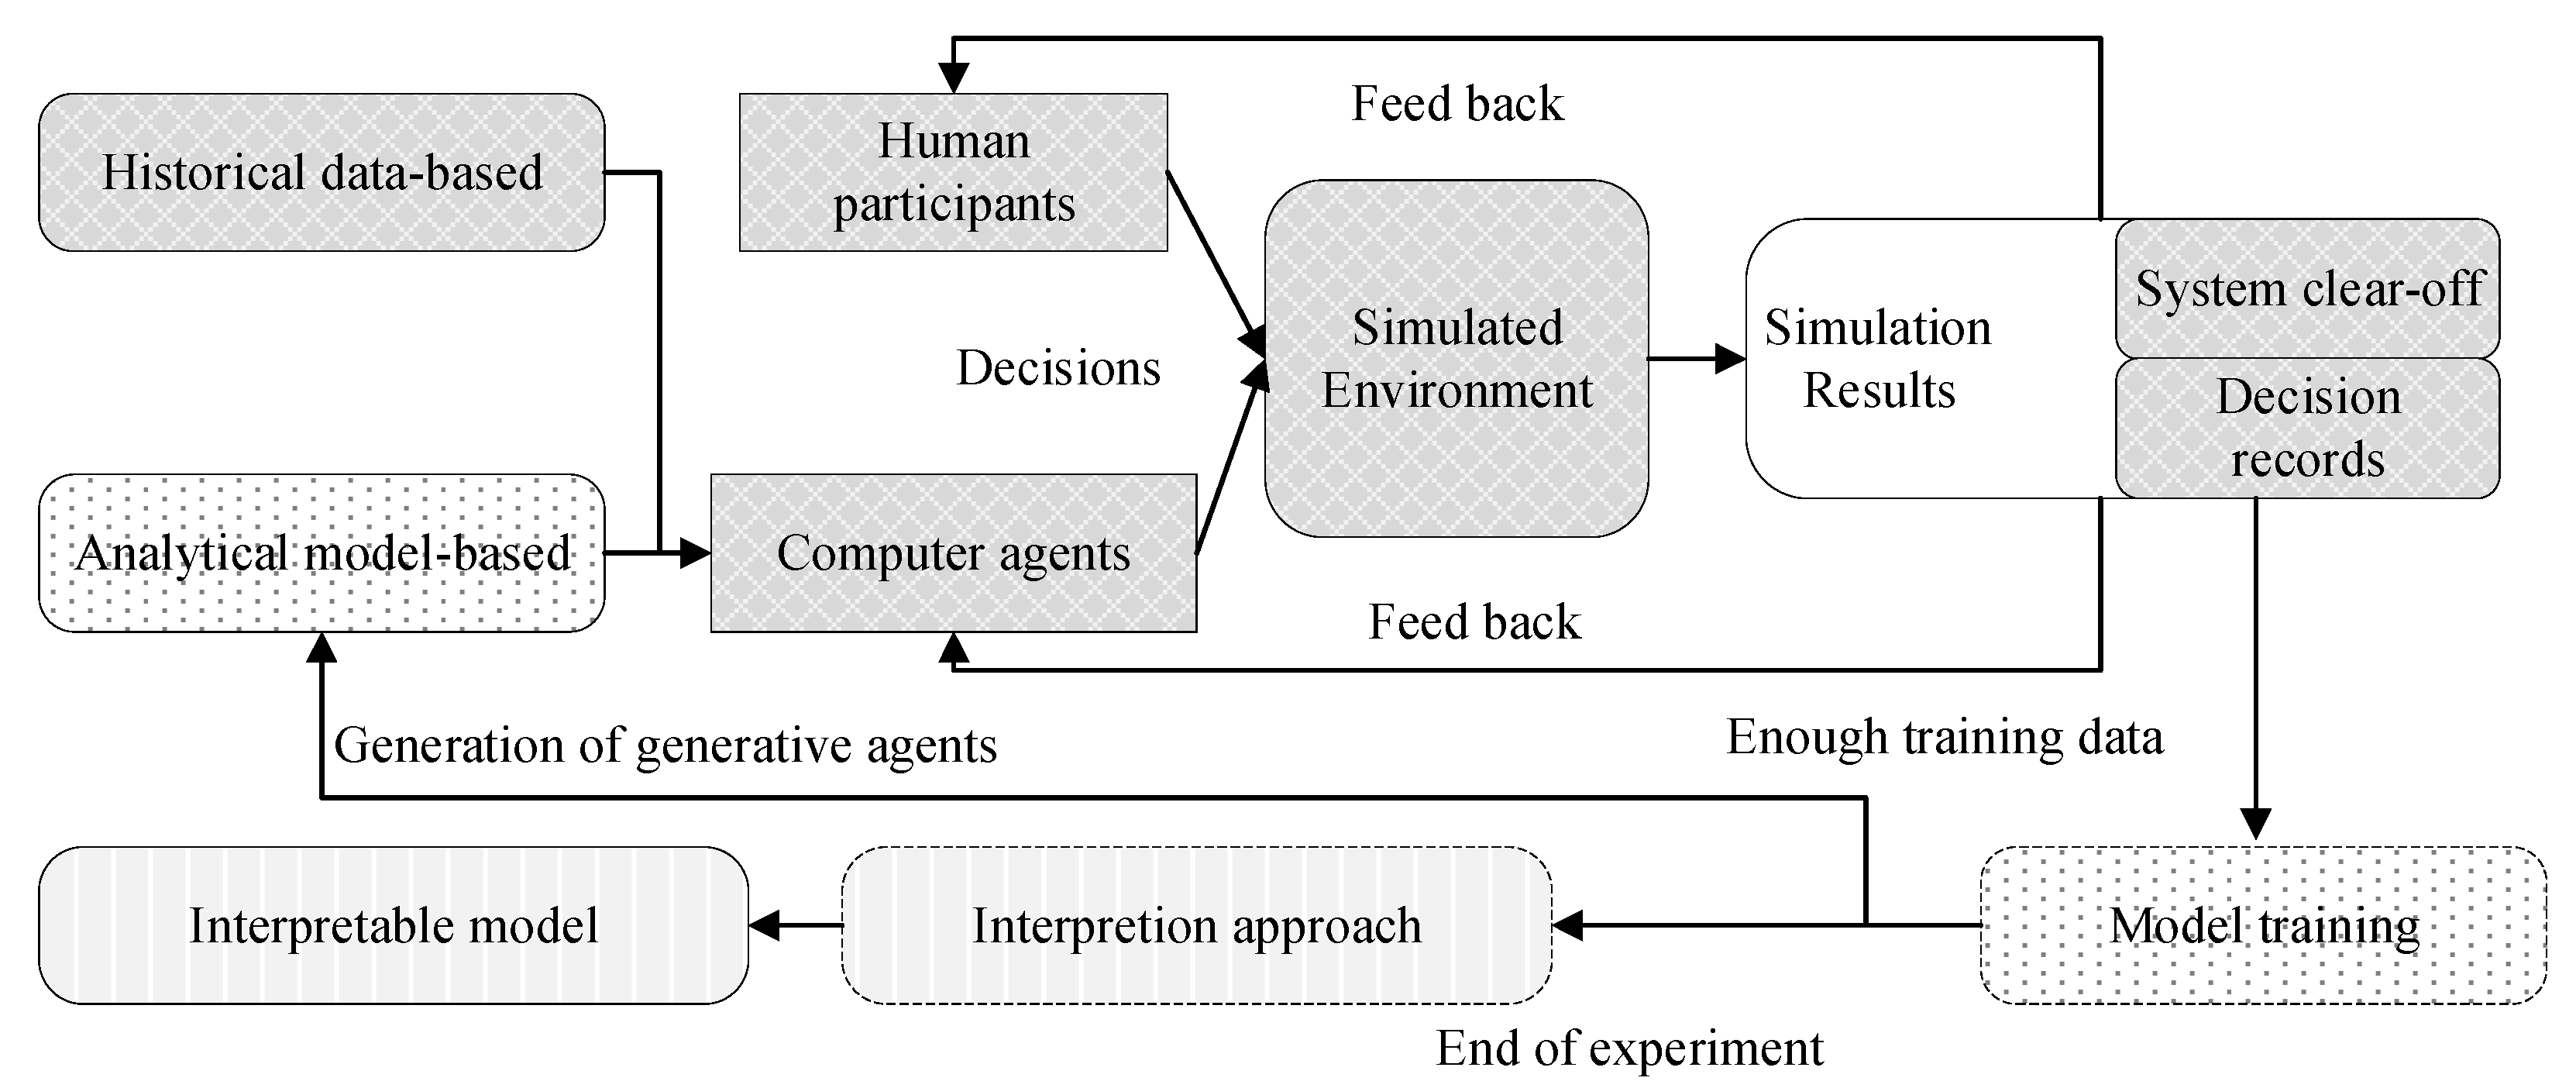
HEL mainly consists of three modules: a human–machine hybrid experiment, a generative model, and an interpretation approach [25]. As shown in Figure 2, participants in hybrid experiments include humans and computer agents. Human participants need to understand how the mechanism works, calculate profits, determine decision ranges, and anticipate potential transaction outcomes. During the experiment, all participants are required to maximize the profits of the roles they represent with a serious attitude. Computer agents are divided into two categories: based on historical data and based on experimental data for training generative models. Agents based on historical data are driven by actual historical data and act as experienced exogenous participants, participating in hybrid experiments with humans in a certain proportion. Generative models generating agents on the basis of experimental data should not join in the first round due to a lack of data. The training data for generative models mainly come from human participants and are adjusted with a small amount of actual data.
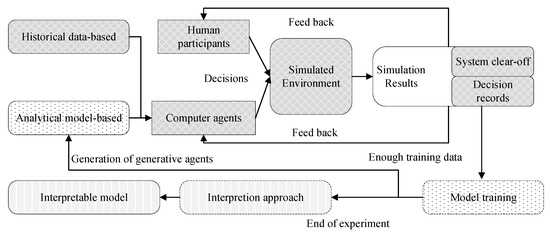
Figure 2.
Framework of hybrid experimental learning.
After collecting sufficient data from several rounds of mixed experiments, the generation model is trained using machine learning methods such as generative adversarial networks (GANs). Once trained, the human participants can be replaced by the model. When a specified number of human participants are replaced by the generation model, data-driven behavioral modeling is completed, resulting in a set of transactional behavioral models obtained from the experimental data. The advantages of mixed experimental learning are that the generation model ensures decision-making expertise while reducing the cost of economic experiments. Furthermore, due to the inexplicability of machine learning methods, which cannot be represented by explicit formulas, if some studies pursue the interpretability of behavioral models, interpretative methods can be employed after generation model training. If the purpose of mixed experiments is to simulate markets, explanatory methods and subsequent models can be omitted [25].
3.2. GAN
In this paper, a generative model’s machine learning approach using GAN is employed. GAN is an unsupervised learning method that consists of two neural networks competing in a zero-sum game. It can avoid the high-dimensional challenges encountered in classical probability density estimation, such as kernel density estimation. The pricing strategy for the electricity spot market can be generated by GAN, with the following formula:
where and represent the sample expectation of real samples and noise data samples, respectively; and denote the discriminator network and the generator network, respectively.
4. Case Study
4.1. Setup
According to the characteristics of the Shenzhen power grid, the Shenzhen regional power transmission network model was constructed according to the 14th Five Year Plan of China. The market clearing model can be solved by PROPHET software. Various parameters such as the load, upper limit of generation output, and solar output are substituted into the established Shenzhen regional grid framework of different years. The 2022–2025 typical daily load of the Shenzhen area is shown in Figure 3, and the load data came from the real data of the nonpublic database. Each unit is optimized and dispatched in the spot market, and then the optimization results, including real-time scheduling strategy, node electricity price, and generation output, can be obtained. Through the simulation analysis of the current planning scheme, it can be verified whether a reliable power system operating state can be maintained under the spot market-oriented environment. The basic parameters of the system are shown in Table 1. In order to verify the effectiveness of the current planning scheme, the following cases are designed:
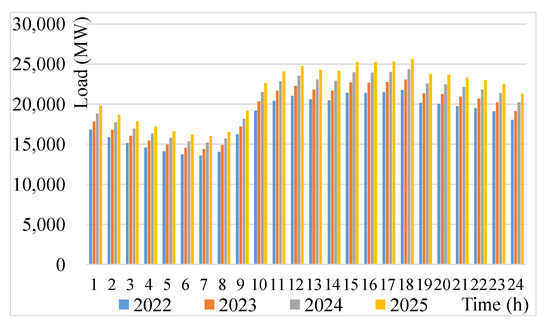
Figure 3.
Shenzhen total load bar chart in each year.

Table 1.
Basic parameters setting of system.
Case 1.1: The basic case with PV, considering the operation performance of Shenzhen power grid planning results in the spot market environment each year.
Case 1.2: The basic case without PV, considering the operation performance of Shenzhen power grid planning results in the spot market environment each year.
Case 2: The comparison case, where the external power supply is limited.
Case 3: The comparison case, where the energy prices are rising.
Among these cases, Case 1 serves as the base scenario for evaluating the operational performance of the existing system planning scheme in the spot market environment. It analyzes the node power price and various generator outputs to assess system performance according to different indicators. As the specific PV construction plan for the area where the system is situated has not been finalized, Case 1 is divided into two subcases: Case 1.1 and Case 1.2. These subcases compare system operation performance with and without PV, respectively, and analyze the impact of PV construction on system operation. To compare the system operating situations under various conditions, Case 2 and Case 3 are established. Considering the high dependence of the test system on the external power supply, Case 2 investigates system operation when the external power supply is limited. On the other hand, Case 3 considers the recent price fluctuations in energy supply for power generation. It examines system performance when energy prices rise.
Before commencing the experiment, it is essential to establish the basic parameter settings for the HEL approach, with the setting steps referring to [25]. Firstly, concerning the market rule parameterization, considering the operational rules of the specific region’s market, each generating unit is permitted to report five price–quantity pairs to construct its own supply curve [25]. This implies that, for five different output levels, corresponding unit electricity prices are quoted. This five-stage quotation strategy forms the foundation for bidding prices at each time point throughout the 24 h day-ahead trading period and cannot be altered during the process. The simulation mandates that the prices for the five-stage strategy must be monotonic, with the upper and lower limits of the unit electricity price set at 1000 and 100 CNY/MWh, respectively. The bidding power associated with each stage of the strategy must be greater than or equal to 0, and the sum of the bidding powers across all five stages must not exceed the upper limit of the generator output capacity, measured in MW.
The clearing rules of the simulated market align with the operational rules of the Guangdong power spot market in China, cleared by LMP. Each simulation simulates a 24 h day-ahead trading period; once completed, the income of each entity is calculated.
Secondly, with regard to the computer agent, all computer agent settings in this study are derived from historical data, specifically from the actual data during the trial operation of the Shenzhen market [25]. The study utilizes GANs to generate agents on the basis of both historical data and generative agents trained using a combination of human experimentation and practice. For the generator of GAN, the training data are divided into two parts; part 1 comprises data accumulated from human participants engaged in repeated mixing experiments, while part 2 consists of historical data recorded from real generating entities. A total of 12,000 five-segment biddings are employed to train the generator. The training bids are generated through a mixture method that combines 120 human participants’ experimental bids and 3000 historical bids in a 3:1 mixing ratio. This ratio means that, in this simulation, 9000 samples augment from experimental bids, and 3000 samples derive from historical bids. Furthermore, 20 GANs are trained during the experiments conducted in this study, and the output of the bidding strategy mentioned throughout the paper is randomly selected from the 20 GANs, ensuring a uniform distribution.
4.2. Case Study Results Analysis
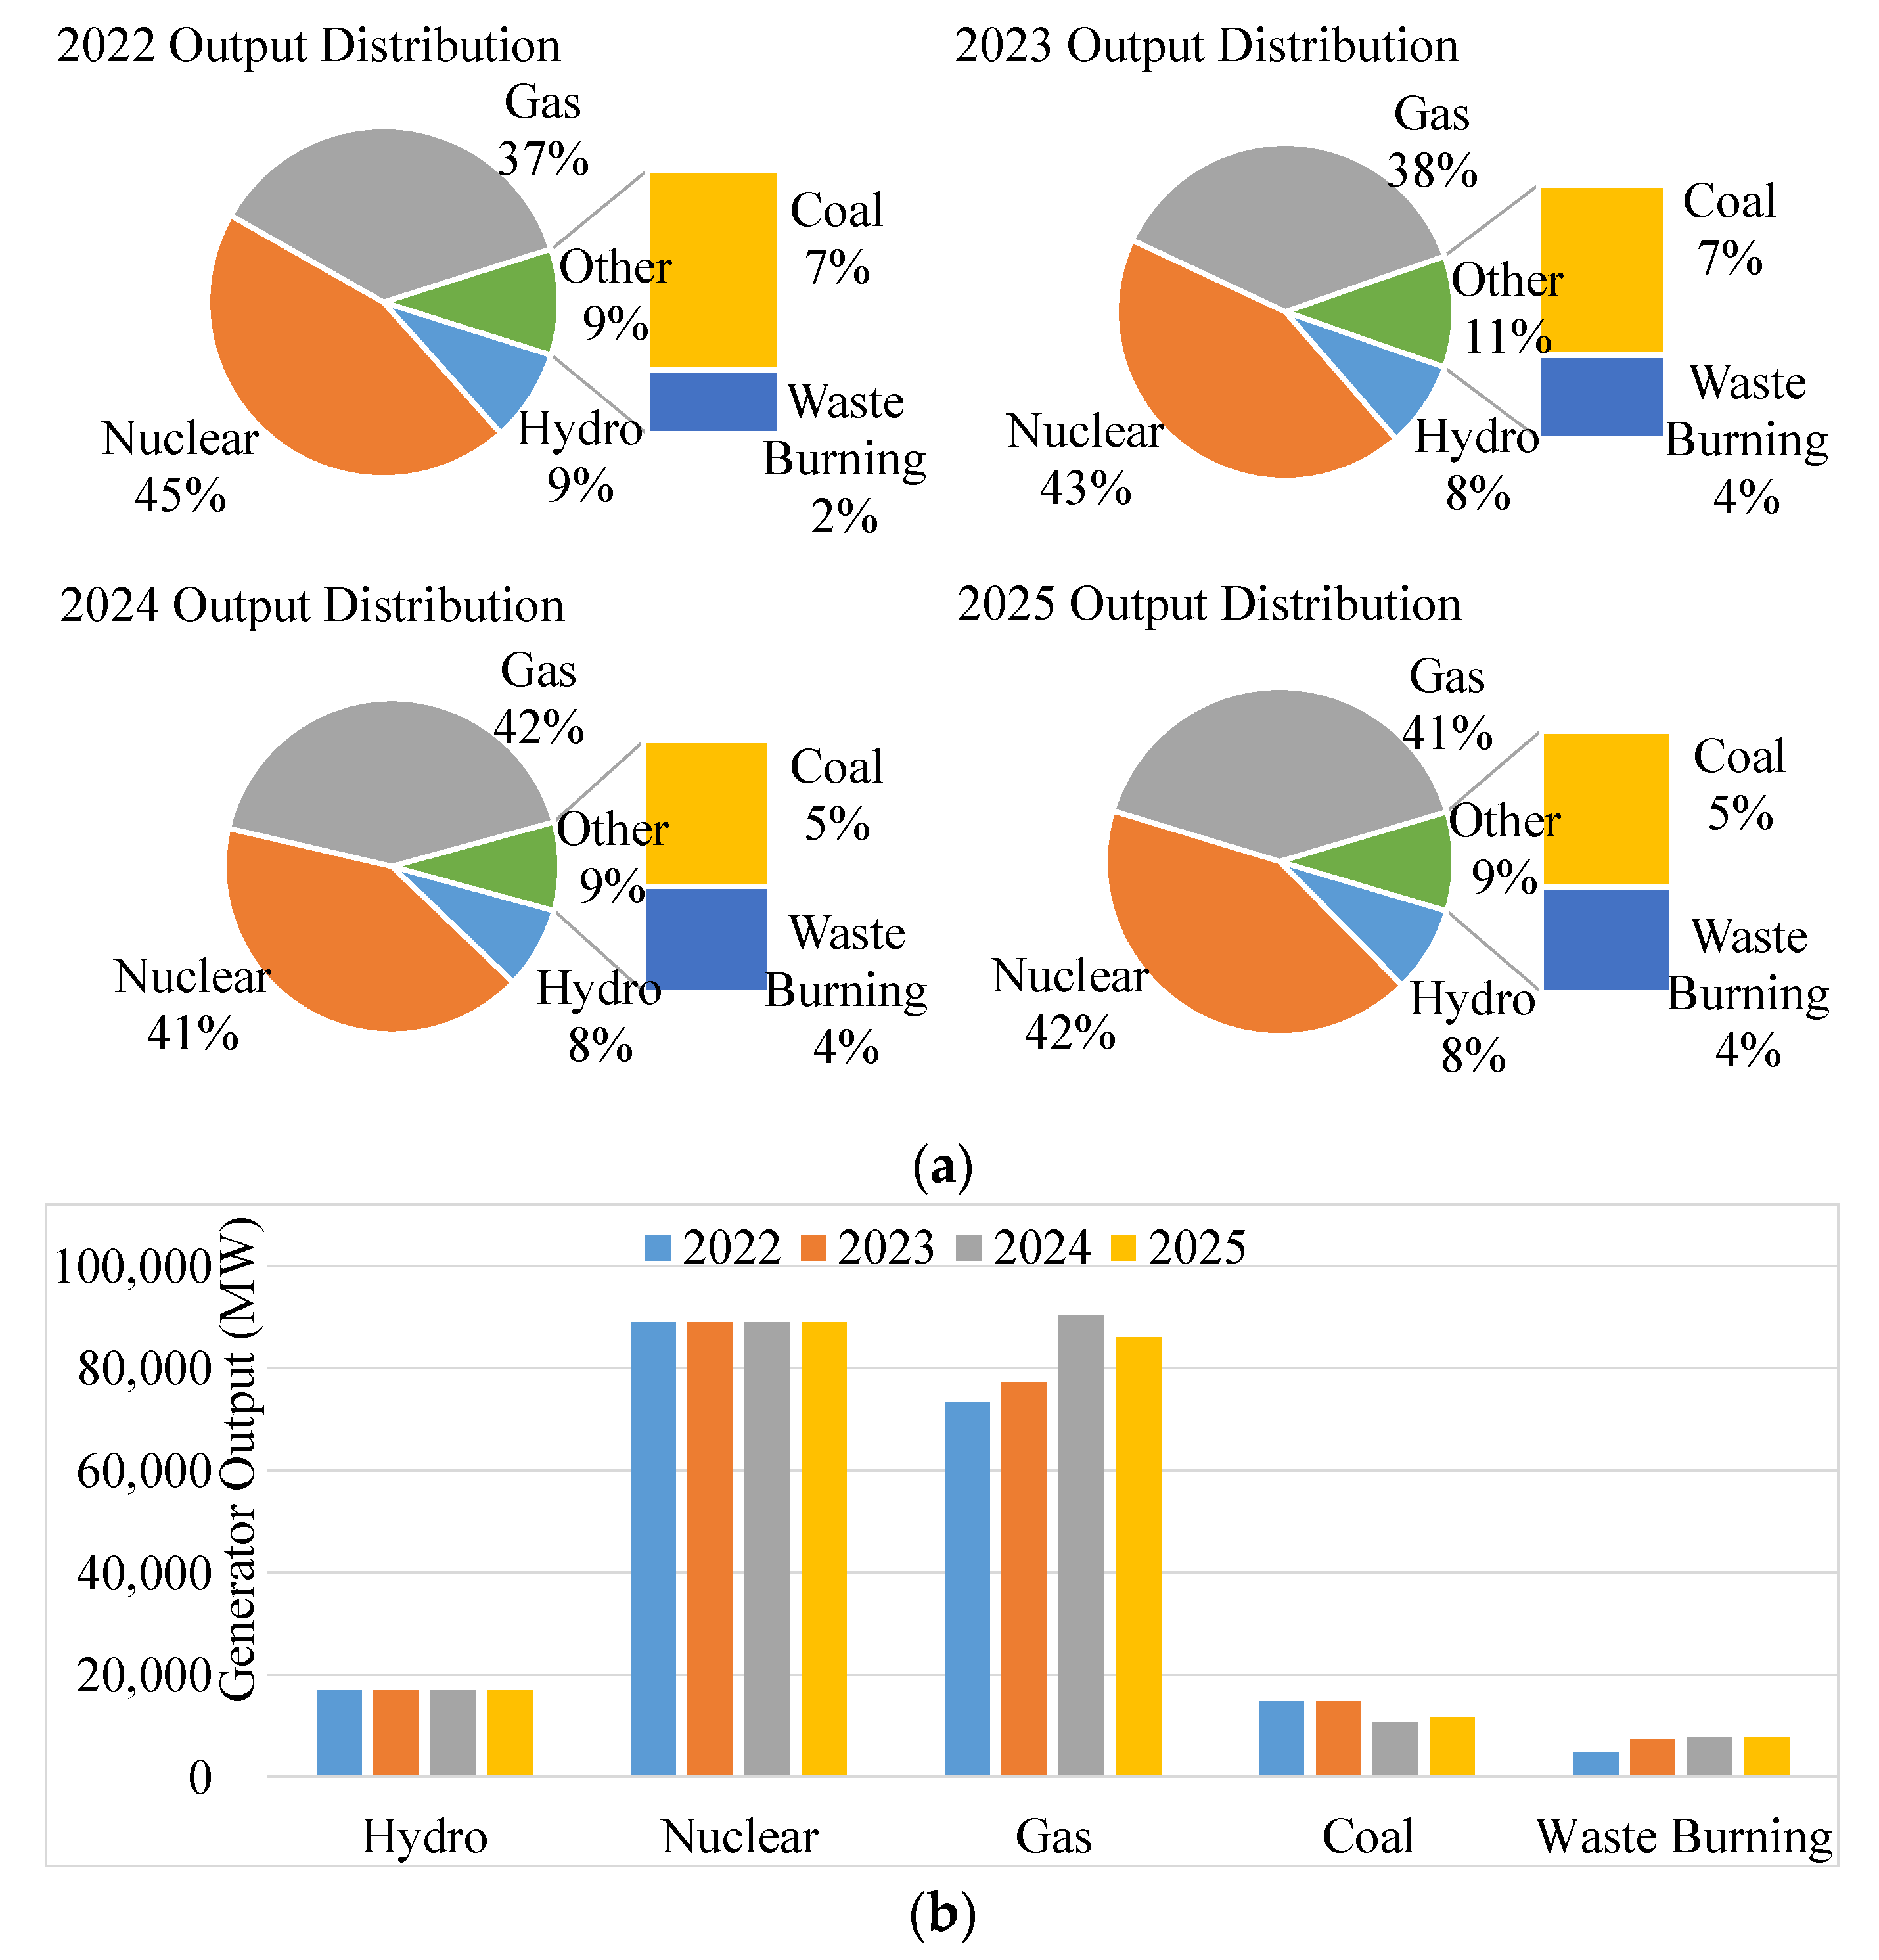
The operating results of the system in Case 1.1 in each year are shown in Figure 4. It can be seen that the output of nuclear power and hydropower has remained stable in each year due to relatively low marginal costs. The output of other types of generators is similar to the overall load curve, with a clear peak-to-valley gap. In addition, the output ratios of generators for each year are shown in Figure 5a,b. It can be observed that the output of nuclear and hydro power has remained stable over the years. Moreover, the coal-fired electricity generation will show a decreasing trend from 2022 to 2025, while the trend of the gas generator power output will be opposite. This is due to the coal-to-gas project conducted in Shenzhen and the continuous commissioning of new gas-fired power units. Overall, the Shenzhen power system can still maintain a relatively high proportion of clean energy output in the spot market environment; even with the increasing load, it can still reduce the output ratio of high-energy-consuming coal-fired power units through methods such as coal-to-gas conversion.
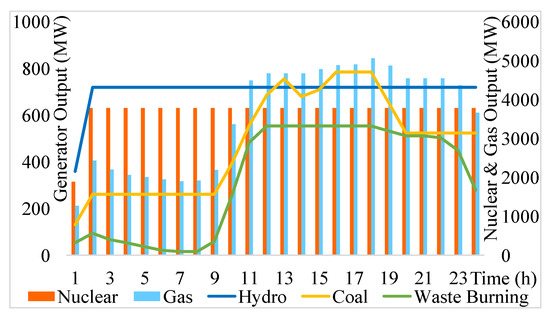
Figure 4.
Power output results of various types of generator sets.
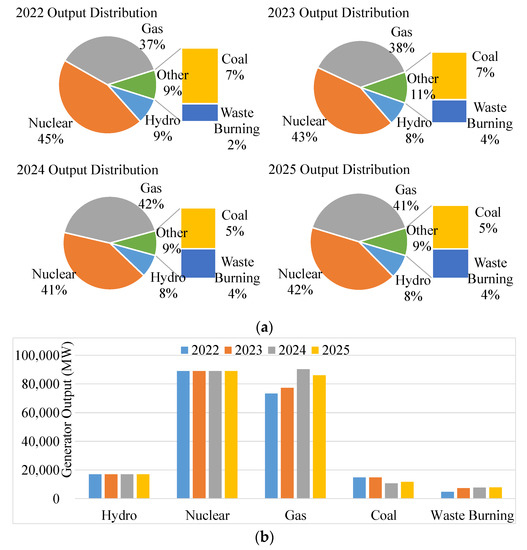
Figure 5.
(a) Case 1.1 power output proportion of generator sets in each year. (b) Case 1.1 power output of generator sets in each year.
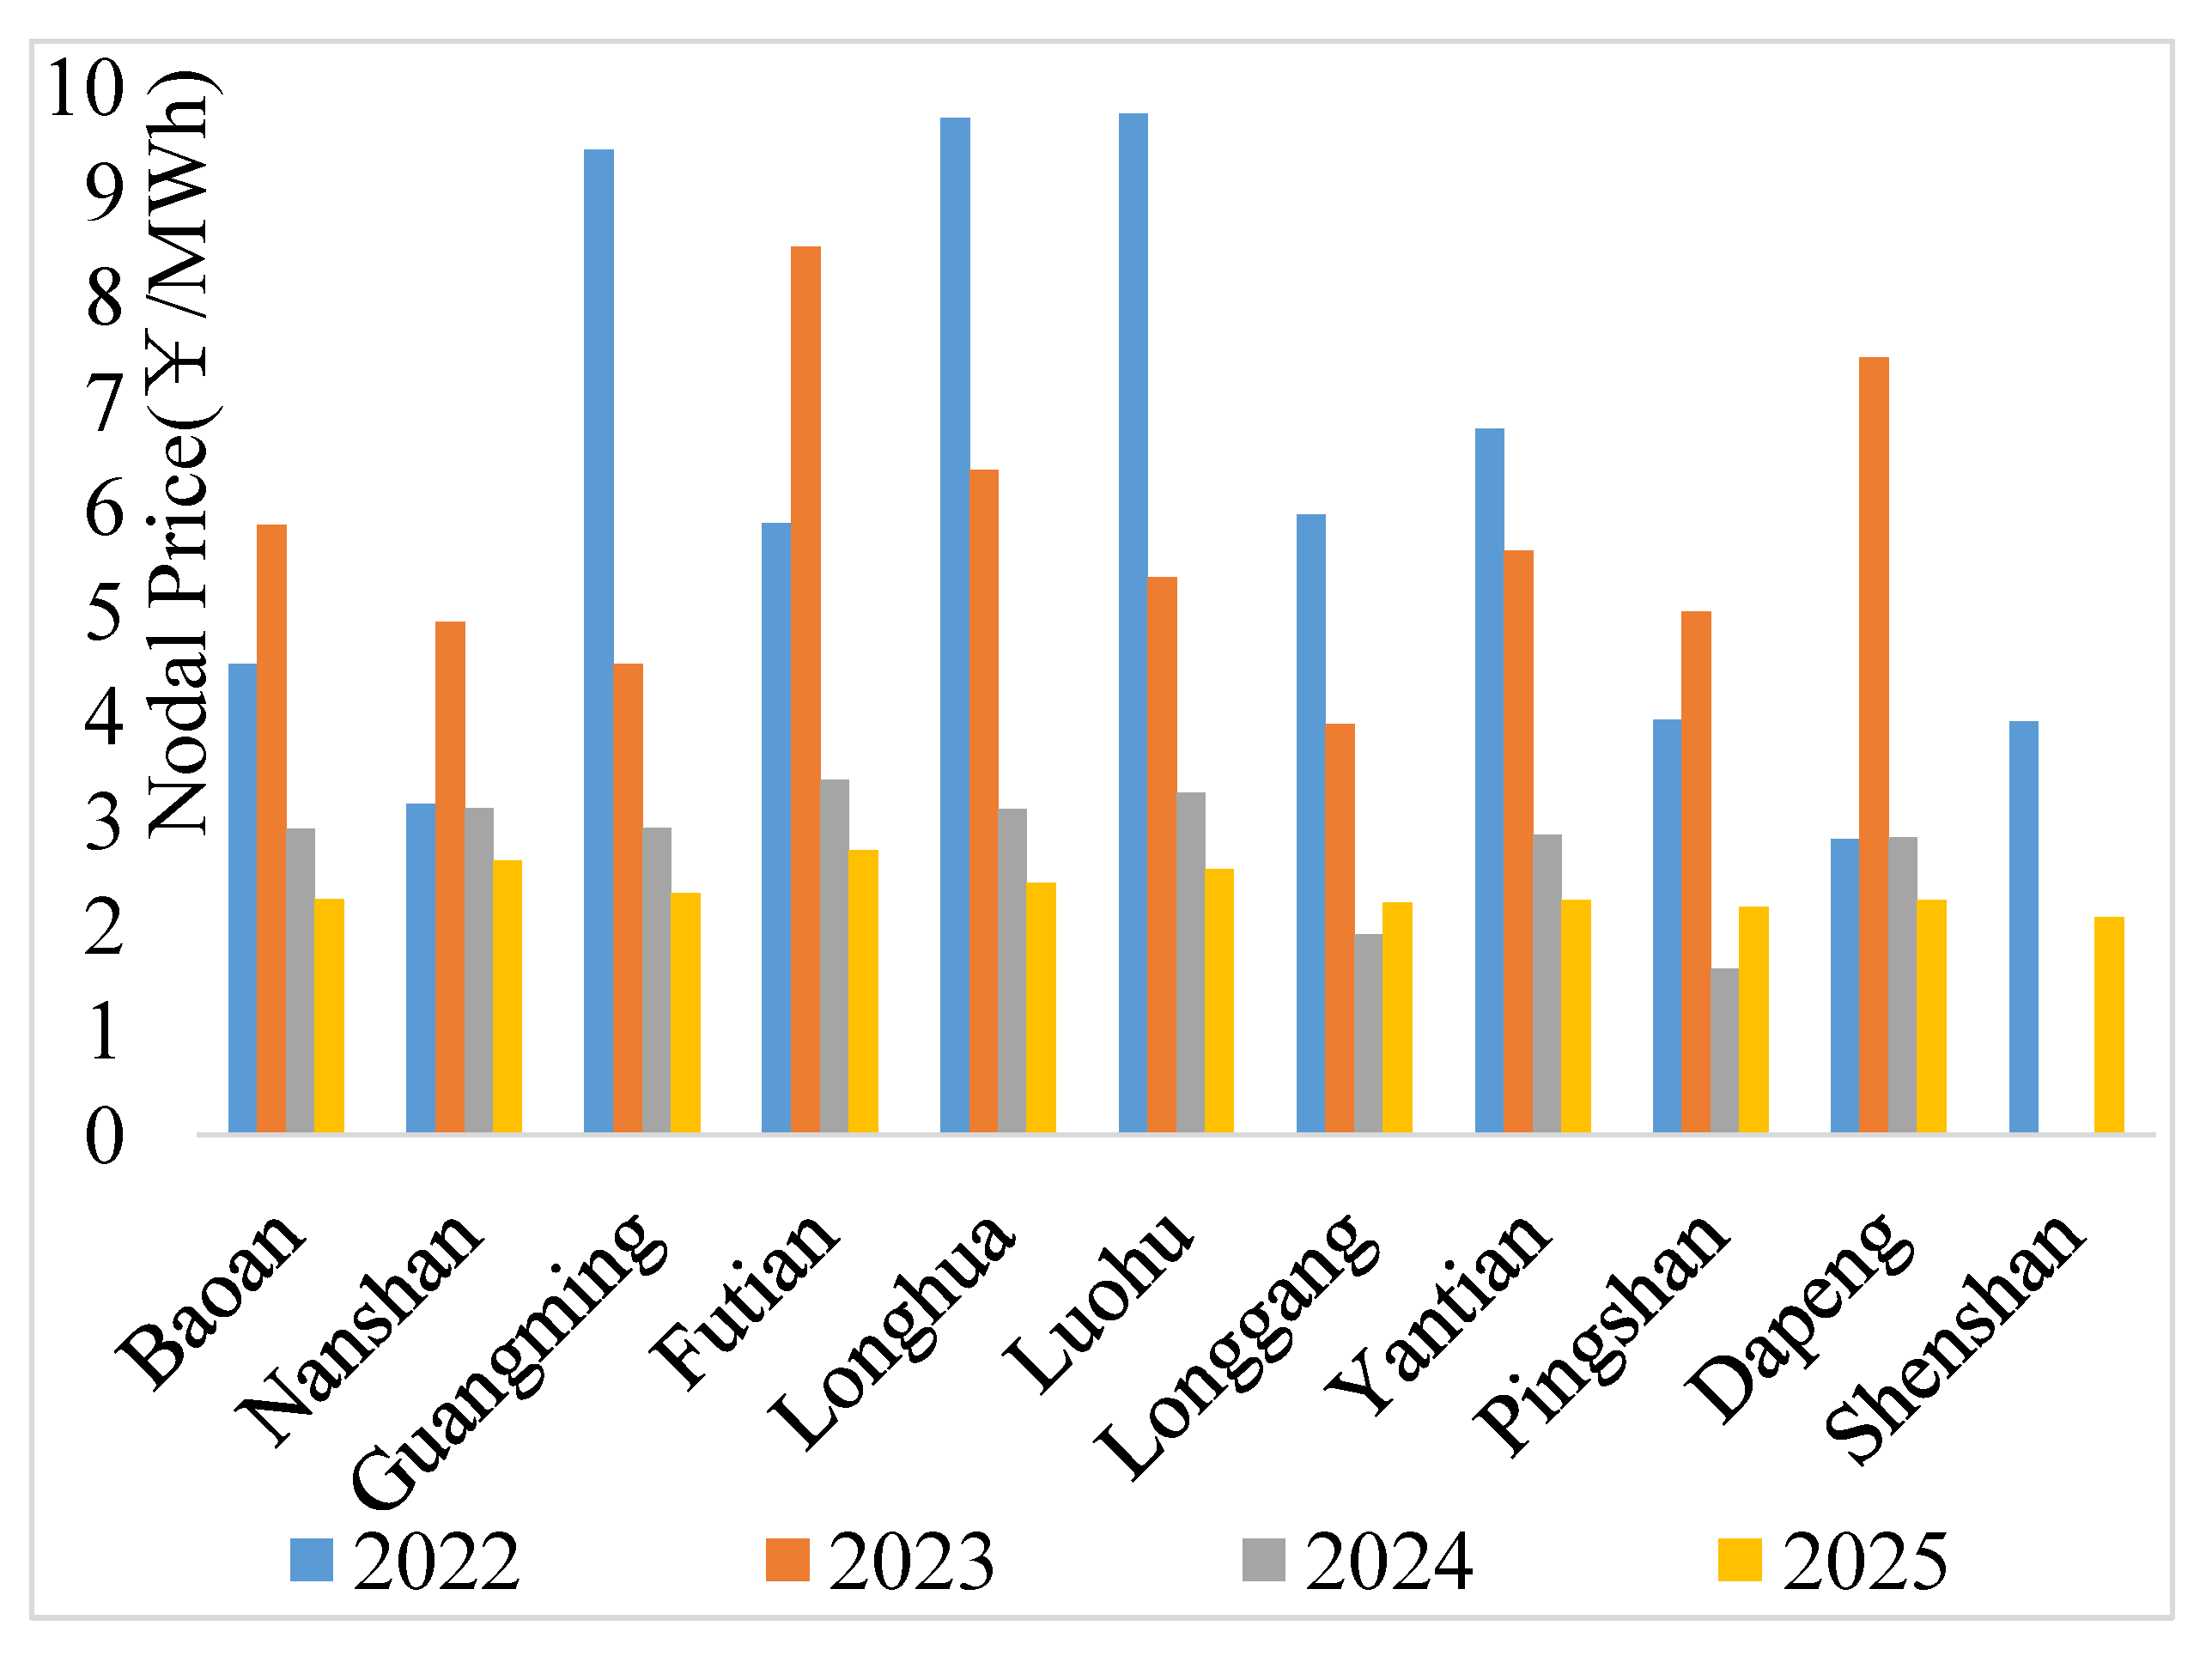
In the spot market, nodal electricity prices are an important indicator of system operation. As shown in Figure 6, nodal electricity prices in system simulation results are generally in the range of 400 CNY/MWh to 500 CNY/MWh. There was no significant upward trend in nodal electricity prices in different regions and years, and the average nodal electricity price in Nanshan District even showed a slight decrease over the years. Normally, if the transmission line planning is not adequate, nodal electricity prices in various regions should increase as the load increases year by year. However, the current experimental results reflect that the existing Shenzhen power grid planning for 2022 to 2025 can effectively cope with the increasing load year by year.
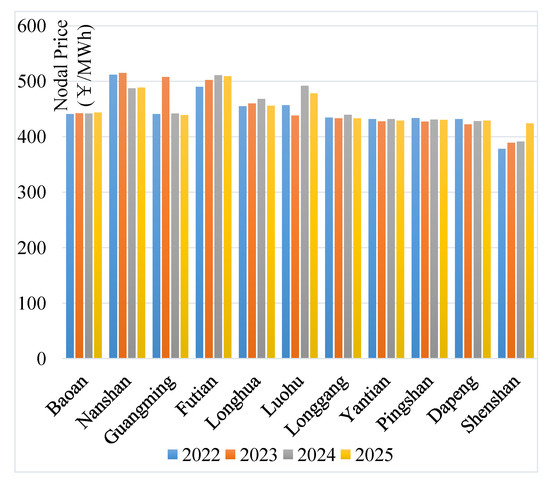
Figure 6.
Average electricity nodal price in each district over the years.
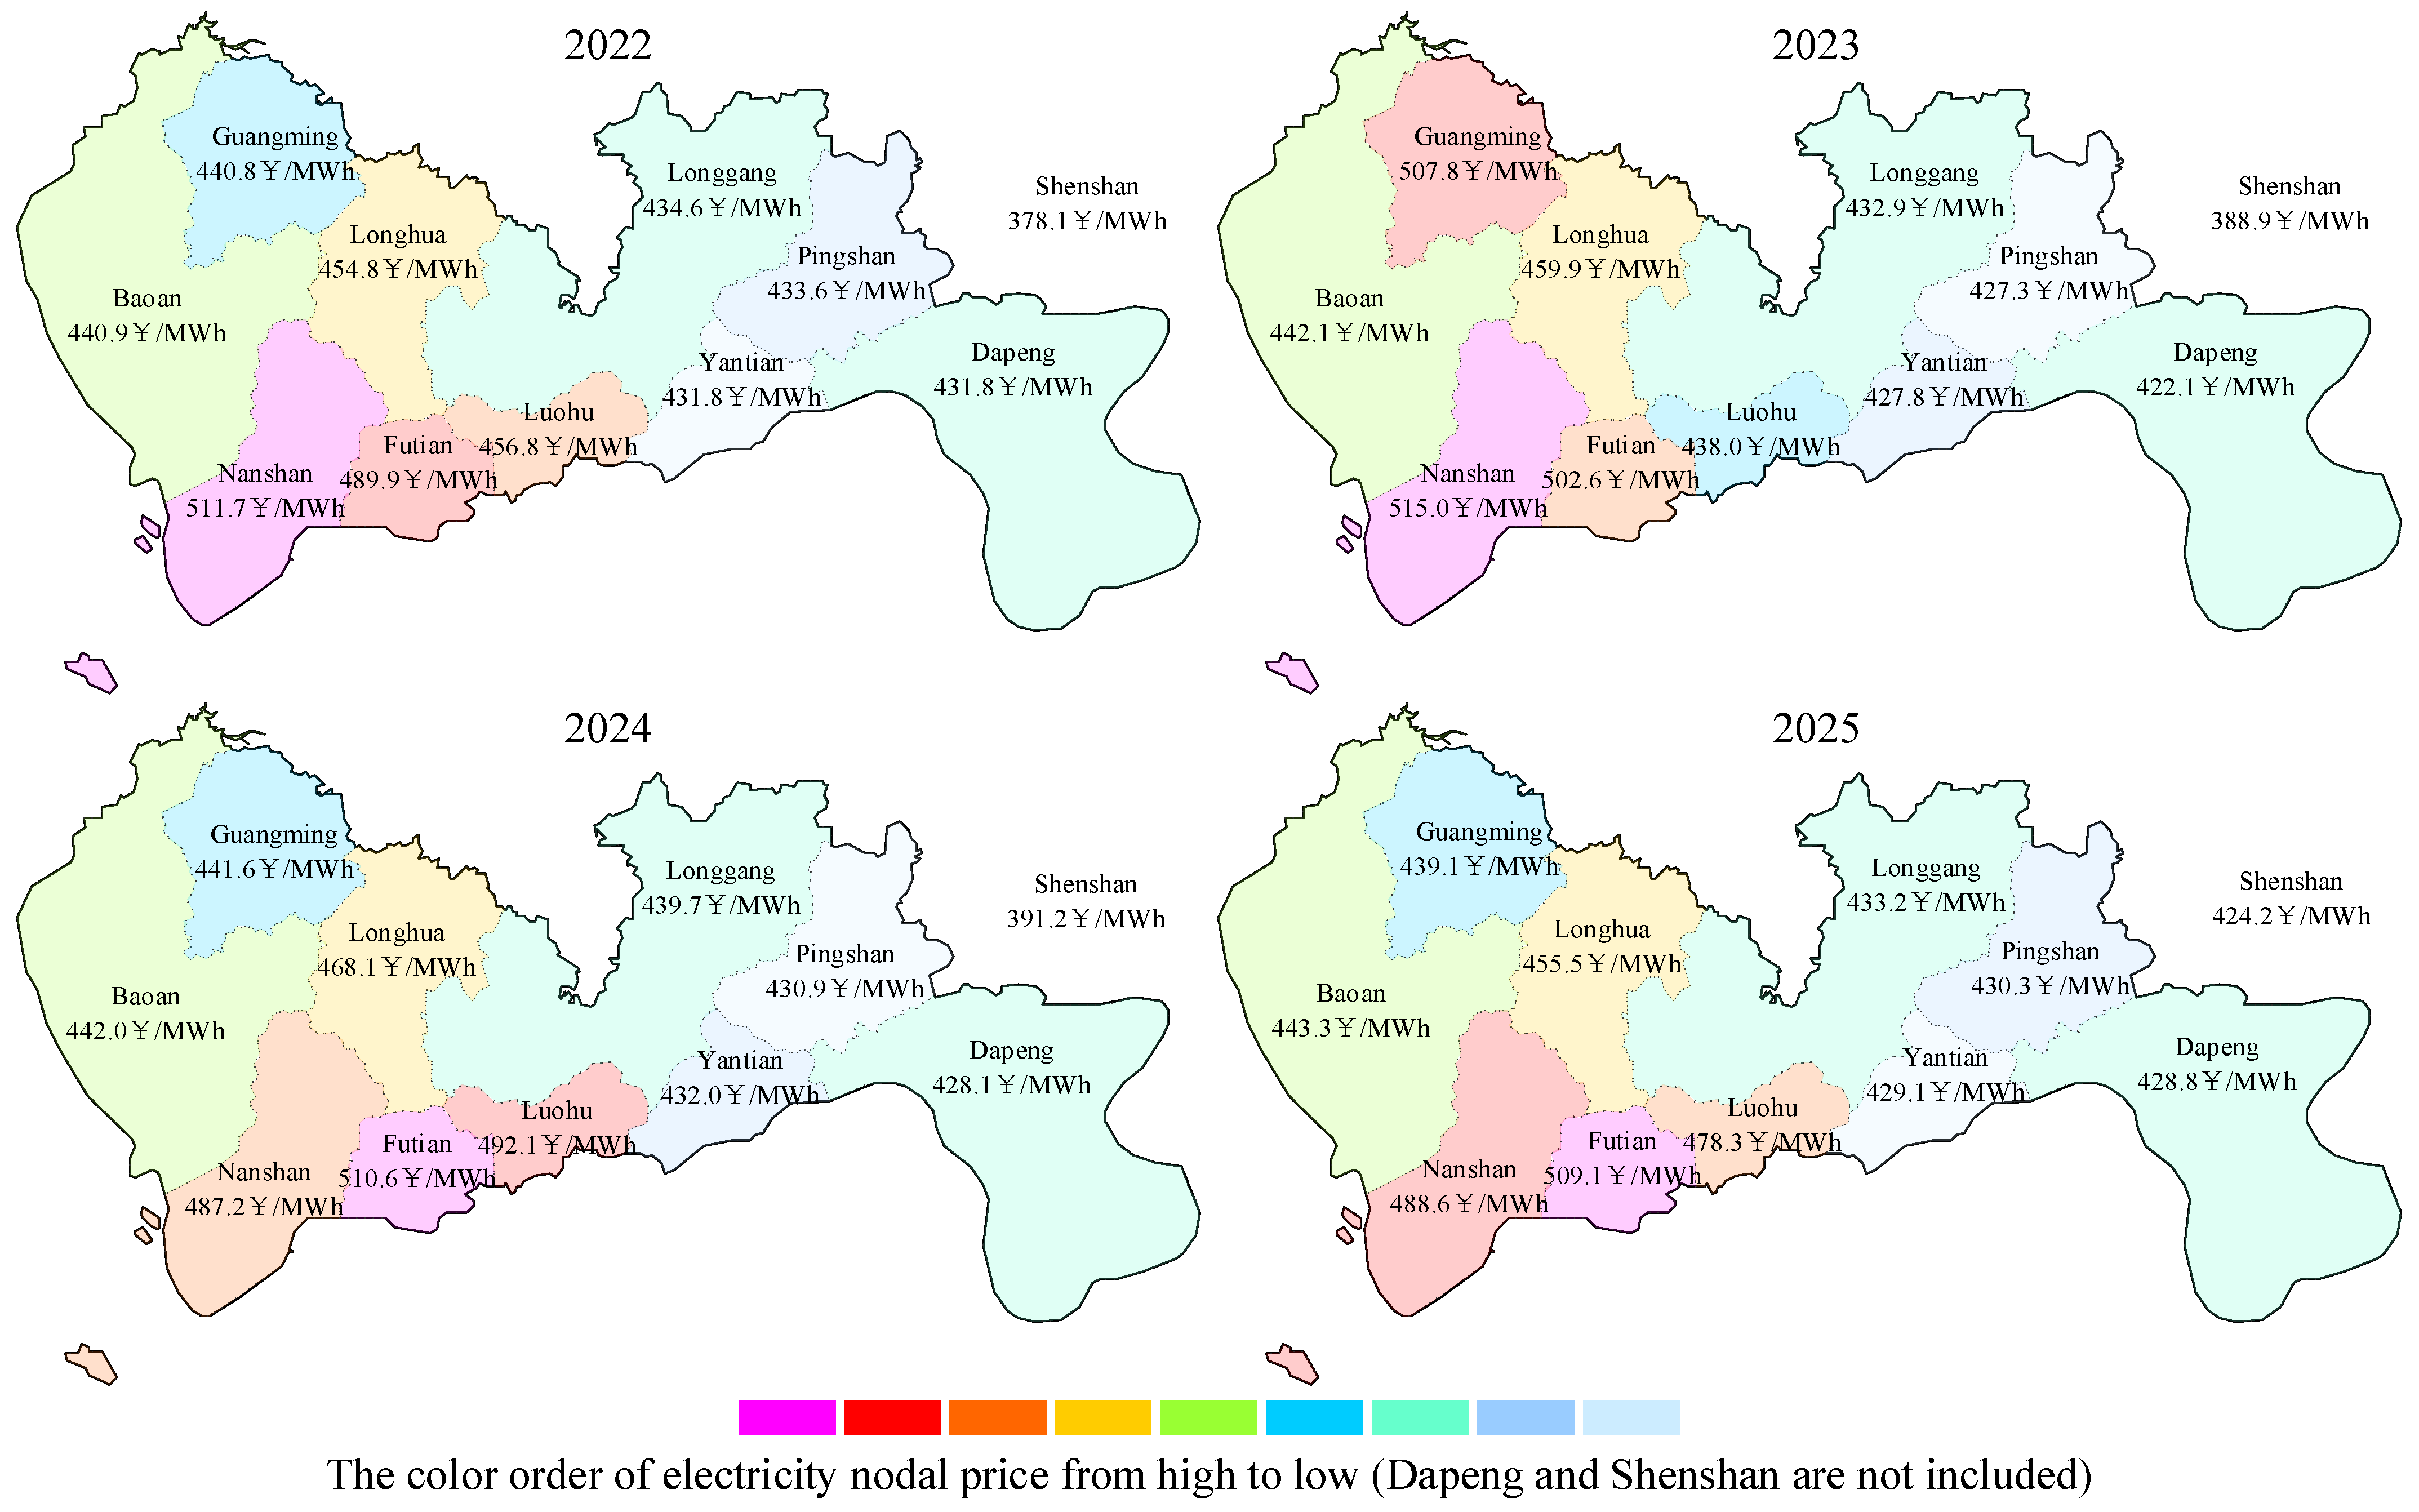
Meanwhile, the geographical distribution of nodal electricity prices in different years shown in Figure 7 clearly corresponds to the distribution of loads in Shenzhen. Nanshan, Futian, and Luohu districts have relatively dense populations and concentrated electricity loads, resulting in higher nodal electricity prices in these areas. In addition, average nodal electricity prices in Guangming, Baoan, and Longhua areas are generally higher than those in Longgang, Pingshan, and Yantian areas. Overall, there is a clear trend of higher nodal electricity prices in the southern and eastern areas of Shenzhen compared to the northern and western areas.
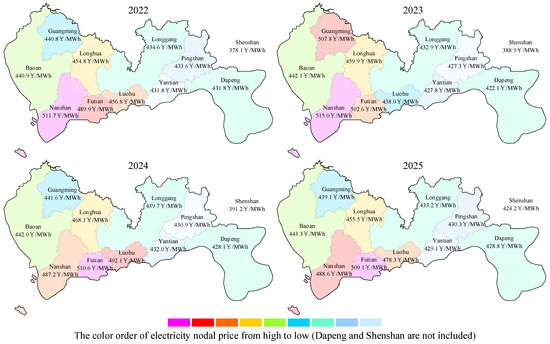
Figure 7.
Geographical distribution of electricity nodal prices in different districts and years.
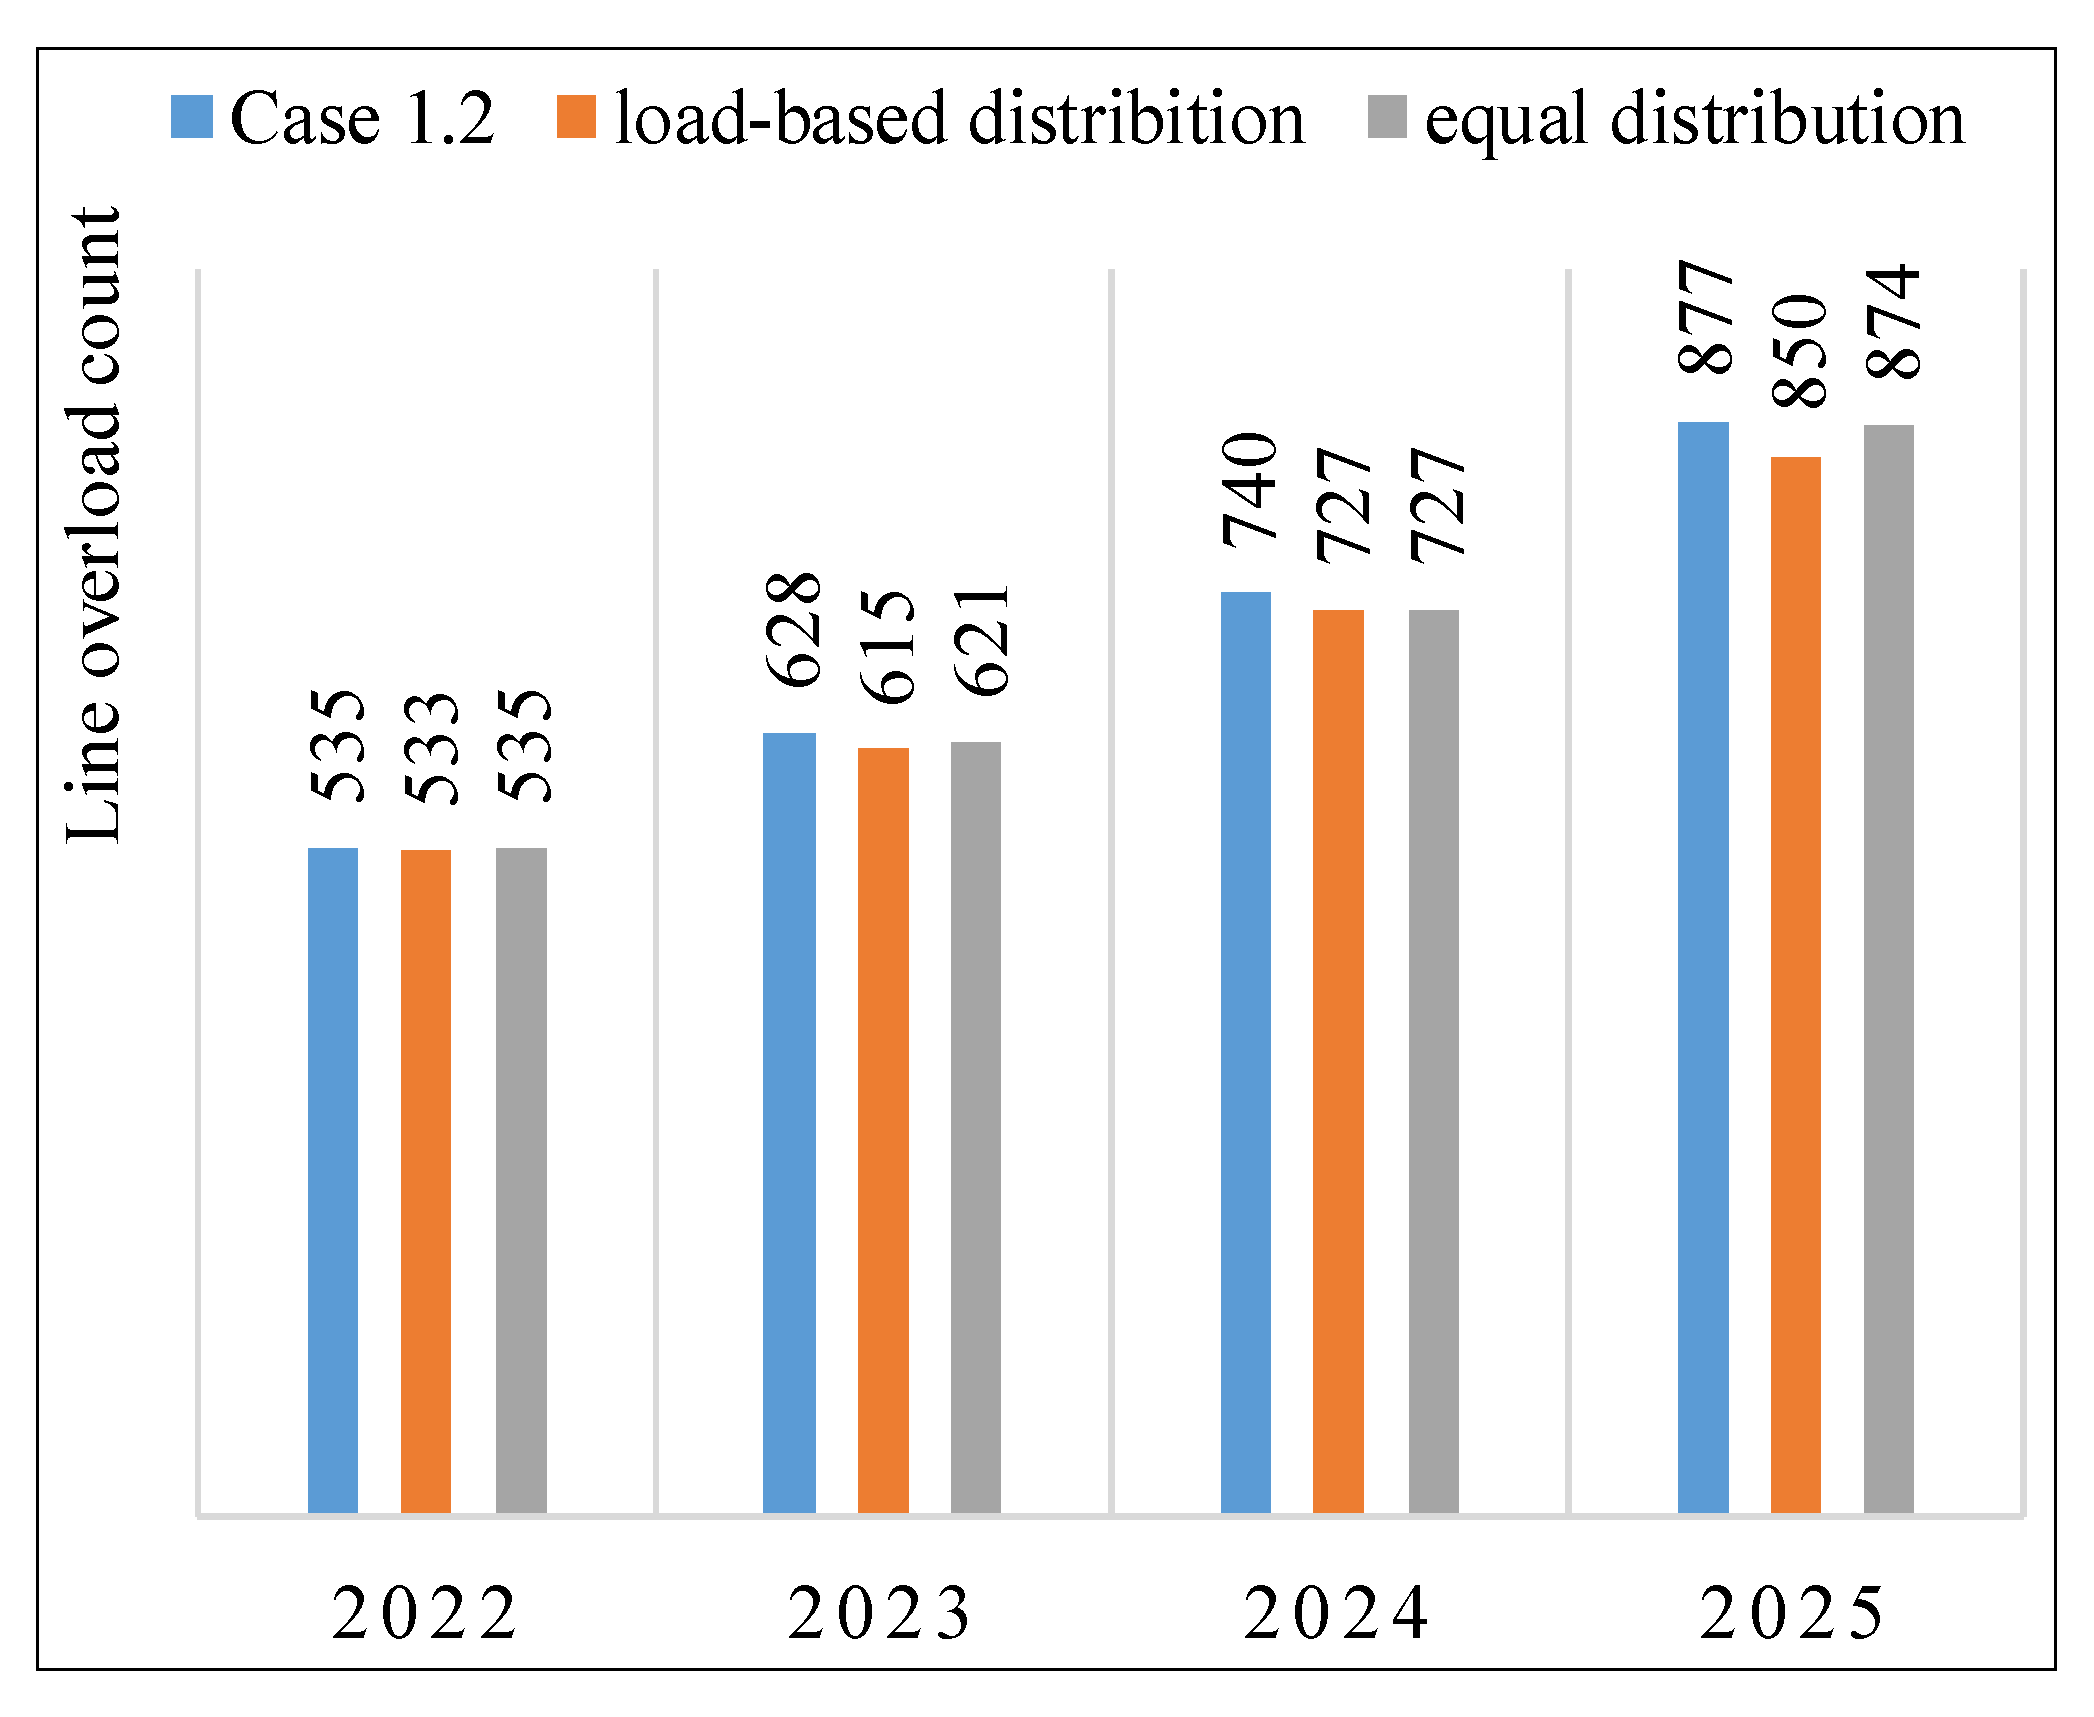
Table 2 presents the node electricity prices in different regions of Shenzhen under different PV distribution scenarios in 2025. Due to the low proportion of PV installed capacity in Shenzhen’s total installed capacity and the relatively low level of PV capacity until 2025, the impact of different scenarios on node electricity prices is not significant (about 5 CNY/MWh). The impact of different PV allocation methods on node electricity prices is also negligible. Therefore, this paper adopts the line overload frequency as another indicator to measure PV distribution methods, and the comparison results are shown in Figure 8.
Table 2.
Case 1.2 comparison of different PV distribution scenarios in 2025.
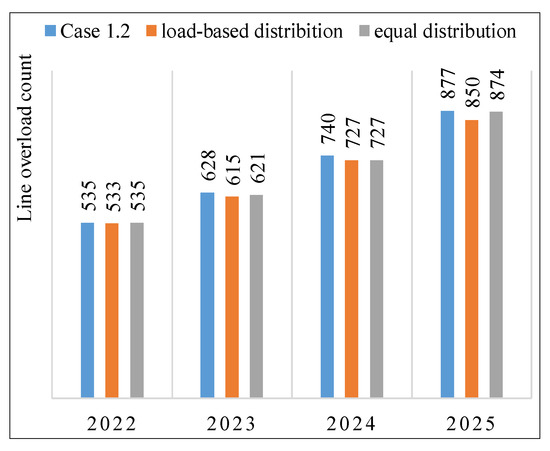
Figure 8.
Line heavy load frequency in different cases.
Assuming that a line is considered overloaded when its actual operating power exceeds 80% of its rated capacity, the results show that the occurrence of line overloads is less frequent in cases where there is PV power output compared to cases where there is no PV power. Moreover, when the PV installation is distributed evenly among nodes on the basis of load size, the probability of line overloads is even lower. Therefore, for Shenzhen, allocating the PV installation on the basis of load proportion is a more optimal configuration. Additionally, since the impact of PV installation on system operation results is minimal, the subsequent simulations will no longer consider the influence of PV.
4.3. Simulation Results Analysis of Extreme Conditions of the System
In the pressure test scenario, i.e., Case 2, the impact of the bidding strategy on node electricity prices is not significant when the external restricted input proportion is low. However, when this proportion increases to 40%, the changes in node electricity prices in different regions of Shenzhen in each year are shown in Figure 9, indicating a decreasing trend in the magnitude of changes in node electricity prices with the growth of years. The years 2022 and 2023 show a more noticeable impact of changes in external power transmission on node electricity prices, with changes generally exceeding 4 CNY/MWh. In comparison, the changes in node electricity prices in 2024 and 2025 are mostly below 3 CNY/MWh, indicating that the adjustments in the grid planning scheme play a positive role in effectively reducing the impact of changes in external power transmission on node electricity prices in the Shenzhen grid system, and the stability of node electricity prices also confirms the rationality and safety of the grid planning strategy from the side.

Figure 9.
Electricity nodal price growth with 40% restriction on external supply.
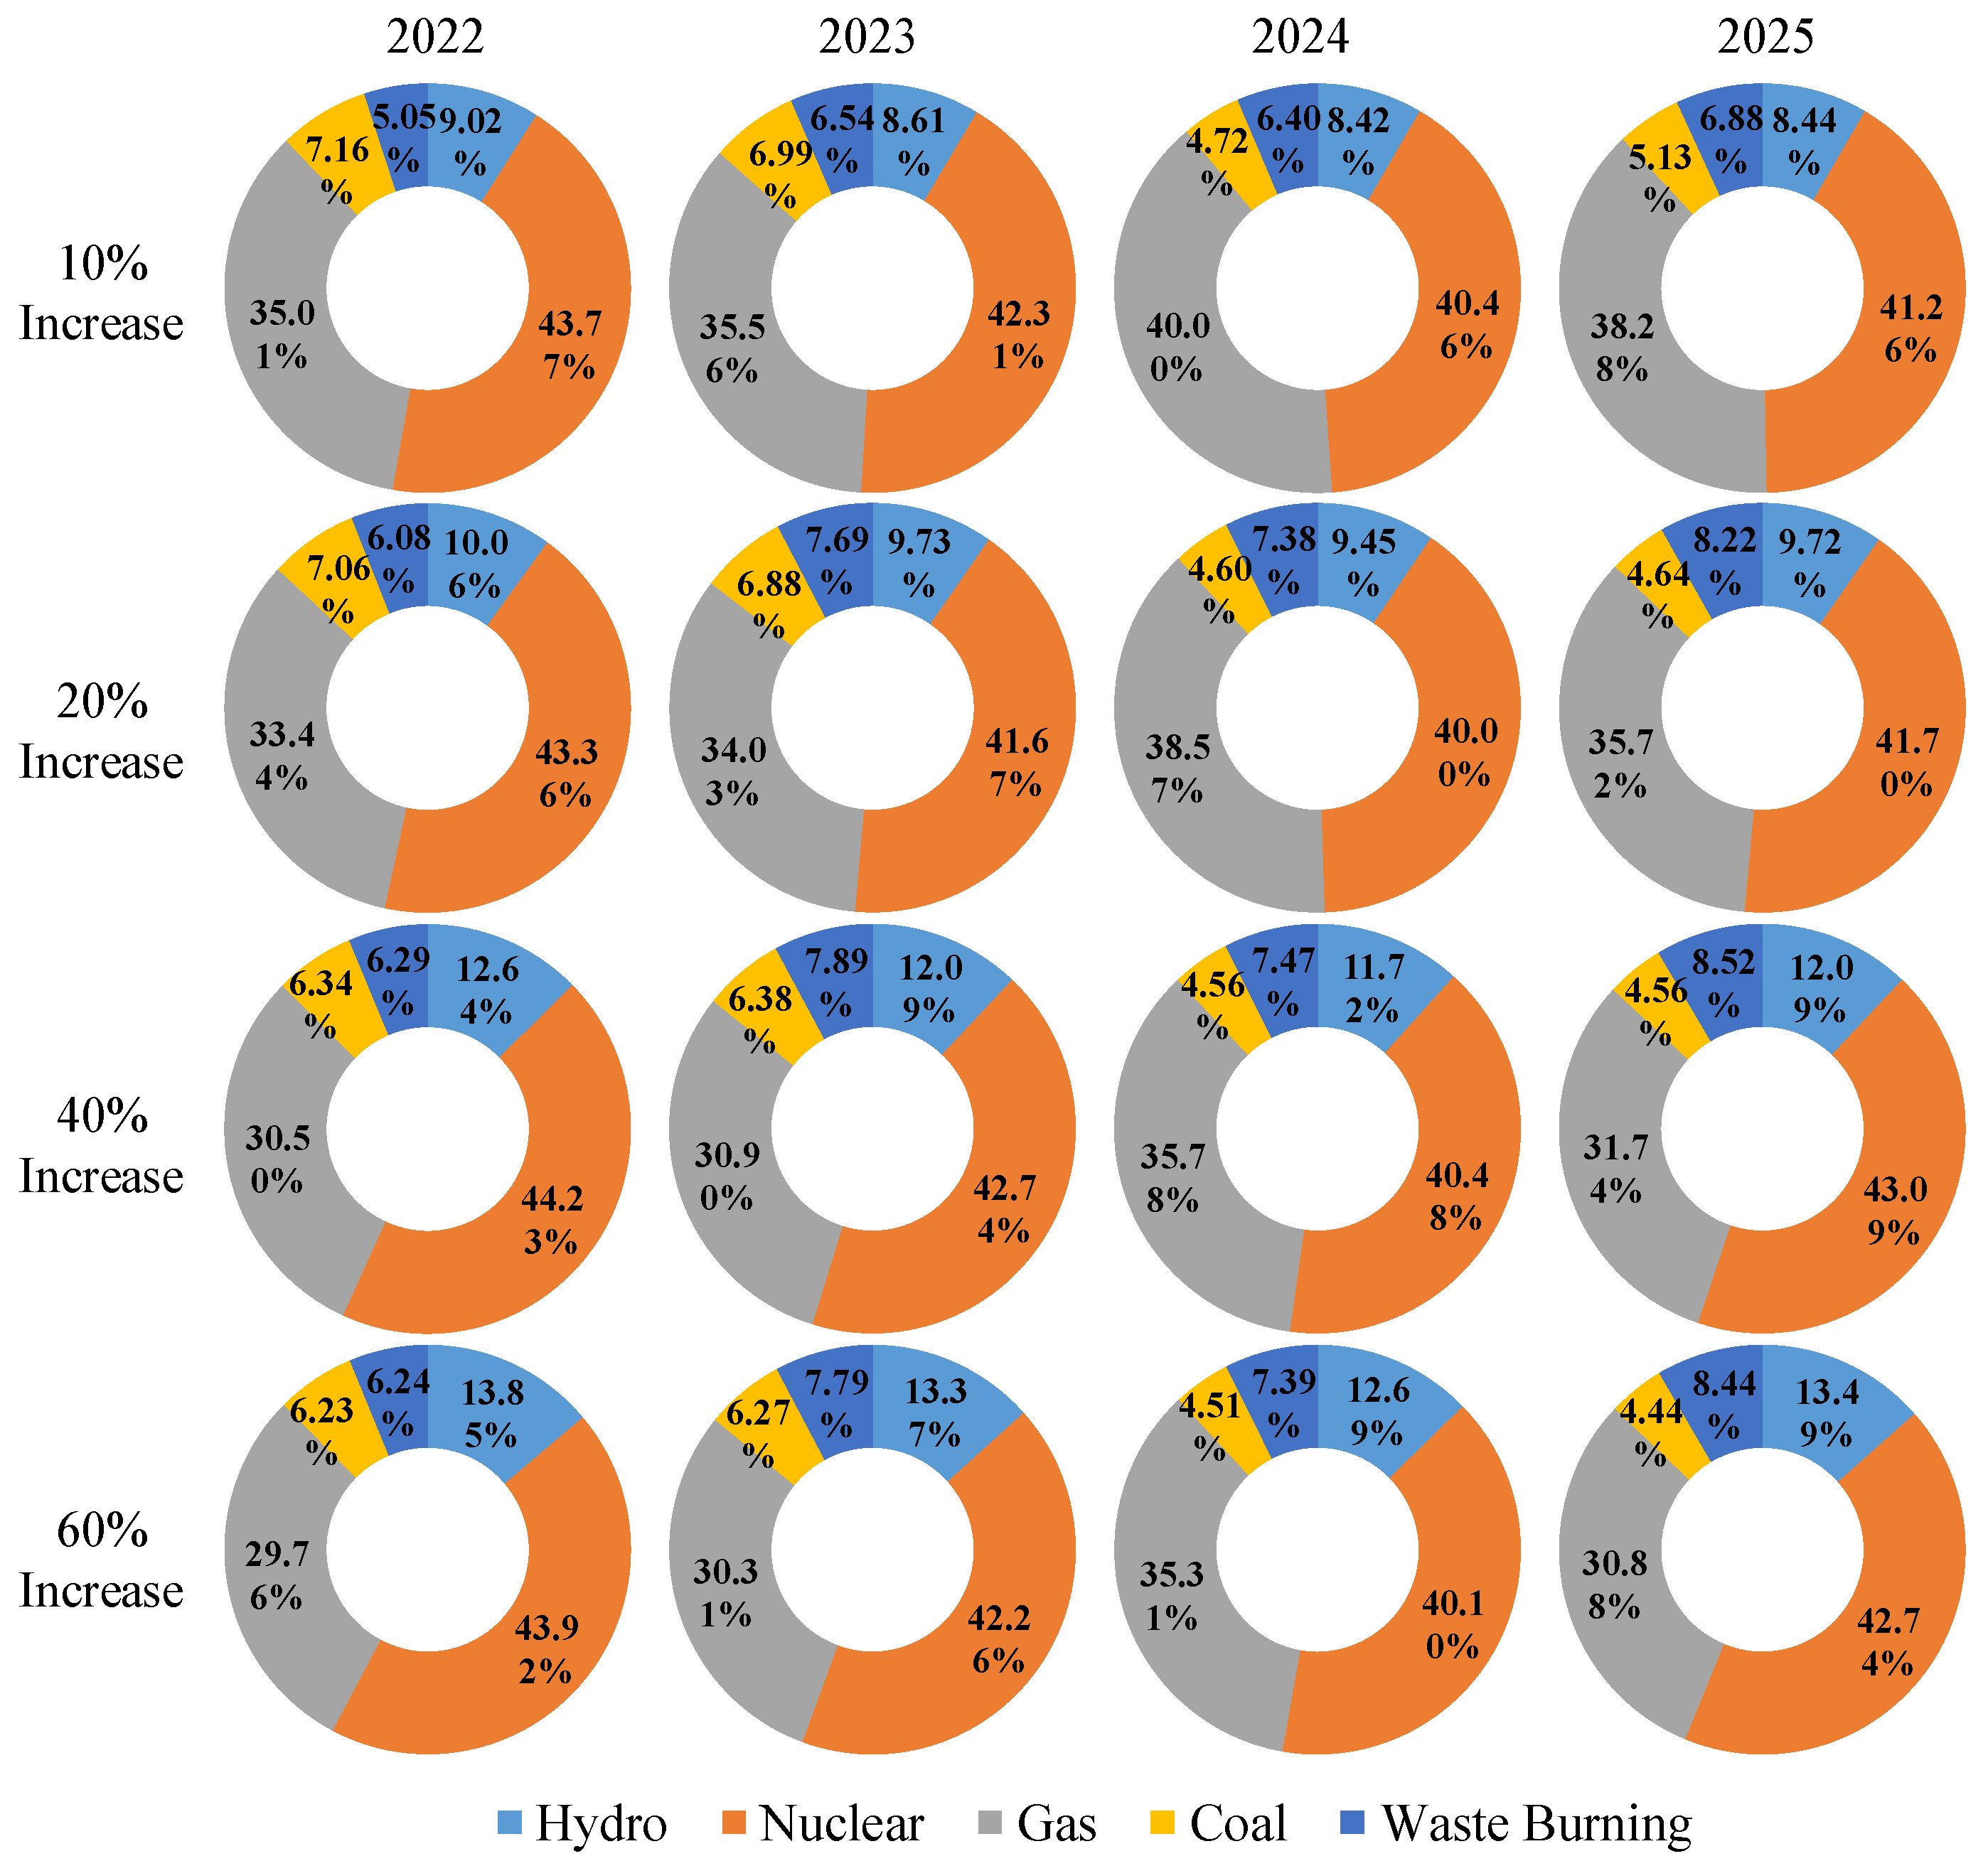
In Case 3, as the prices of natural gas and coal energy increase, the bidding prices of the generated units also increase, and the changes in output proportions of different units in different years are shown in Figure 10. Generally, the output proportions of gas-fired and coal-fired units show a decreasing trend as the bidding prices increase, while the output proportion of hydroelectric units shows an increasing trend, and the output proportions of nuclear and waste power plants fluctuate little.
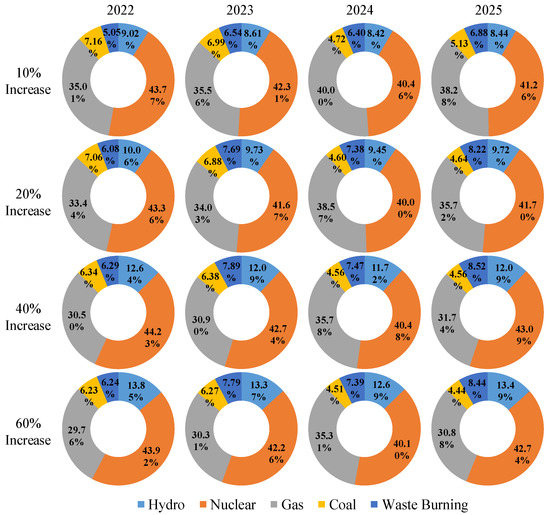
Figure 10.
Case 3: the increase in the bidding price of different proportions, and the output ratio of each generator.
The bidding prices of thermal and gas-fired units generated through HEL are significantly affected by changes in fuel costs, with overall price increases due to cost increases. However, hydroelectric units have lower marginal costs; thus, their cost advantage is reflected when fuel costs rise, resulting in an upward trend in generation proportions. On the other hand, gas-fired and coal-fired units show a decreasing trend in generation proportions. Nuclear power units have extremely low overall bidding prices and are given priority in the dispatch process, resulting in the highest generation proportion with little impact from bidding price fluctuations. Similarly, waste power plants have a relatively low proportion and maintain a low output level, with little noticeable impact from bidding price fluctuations.
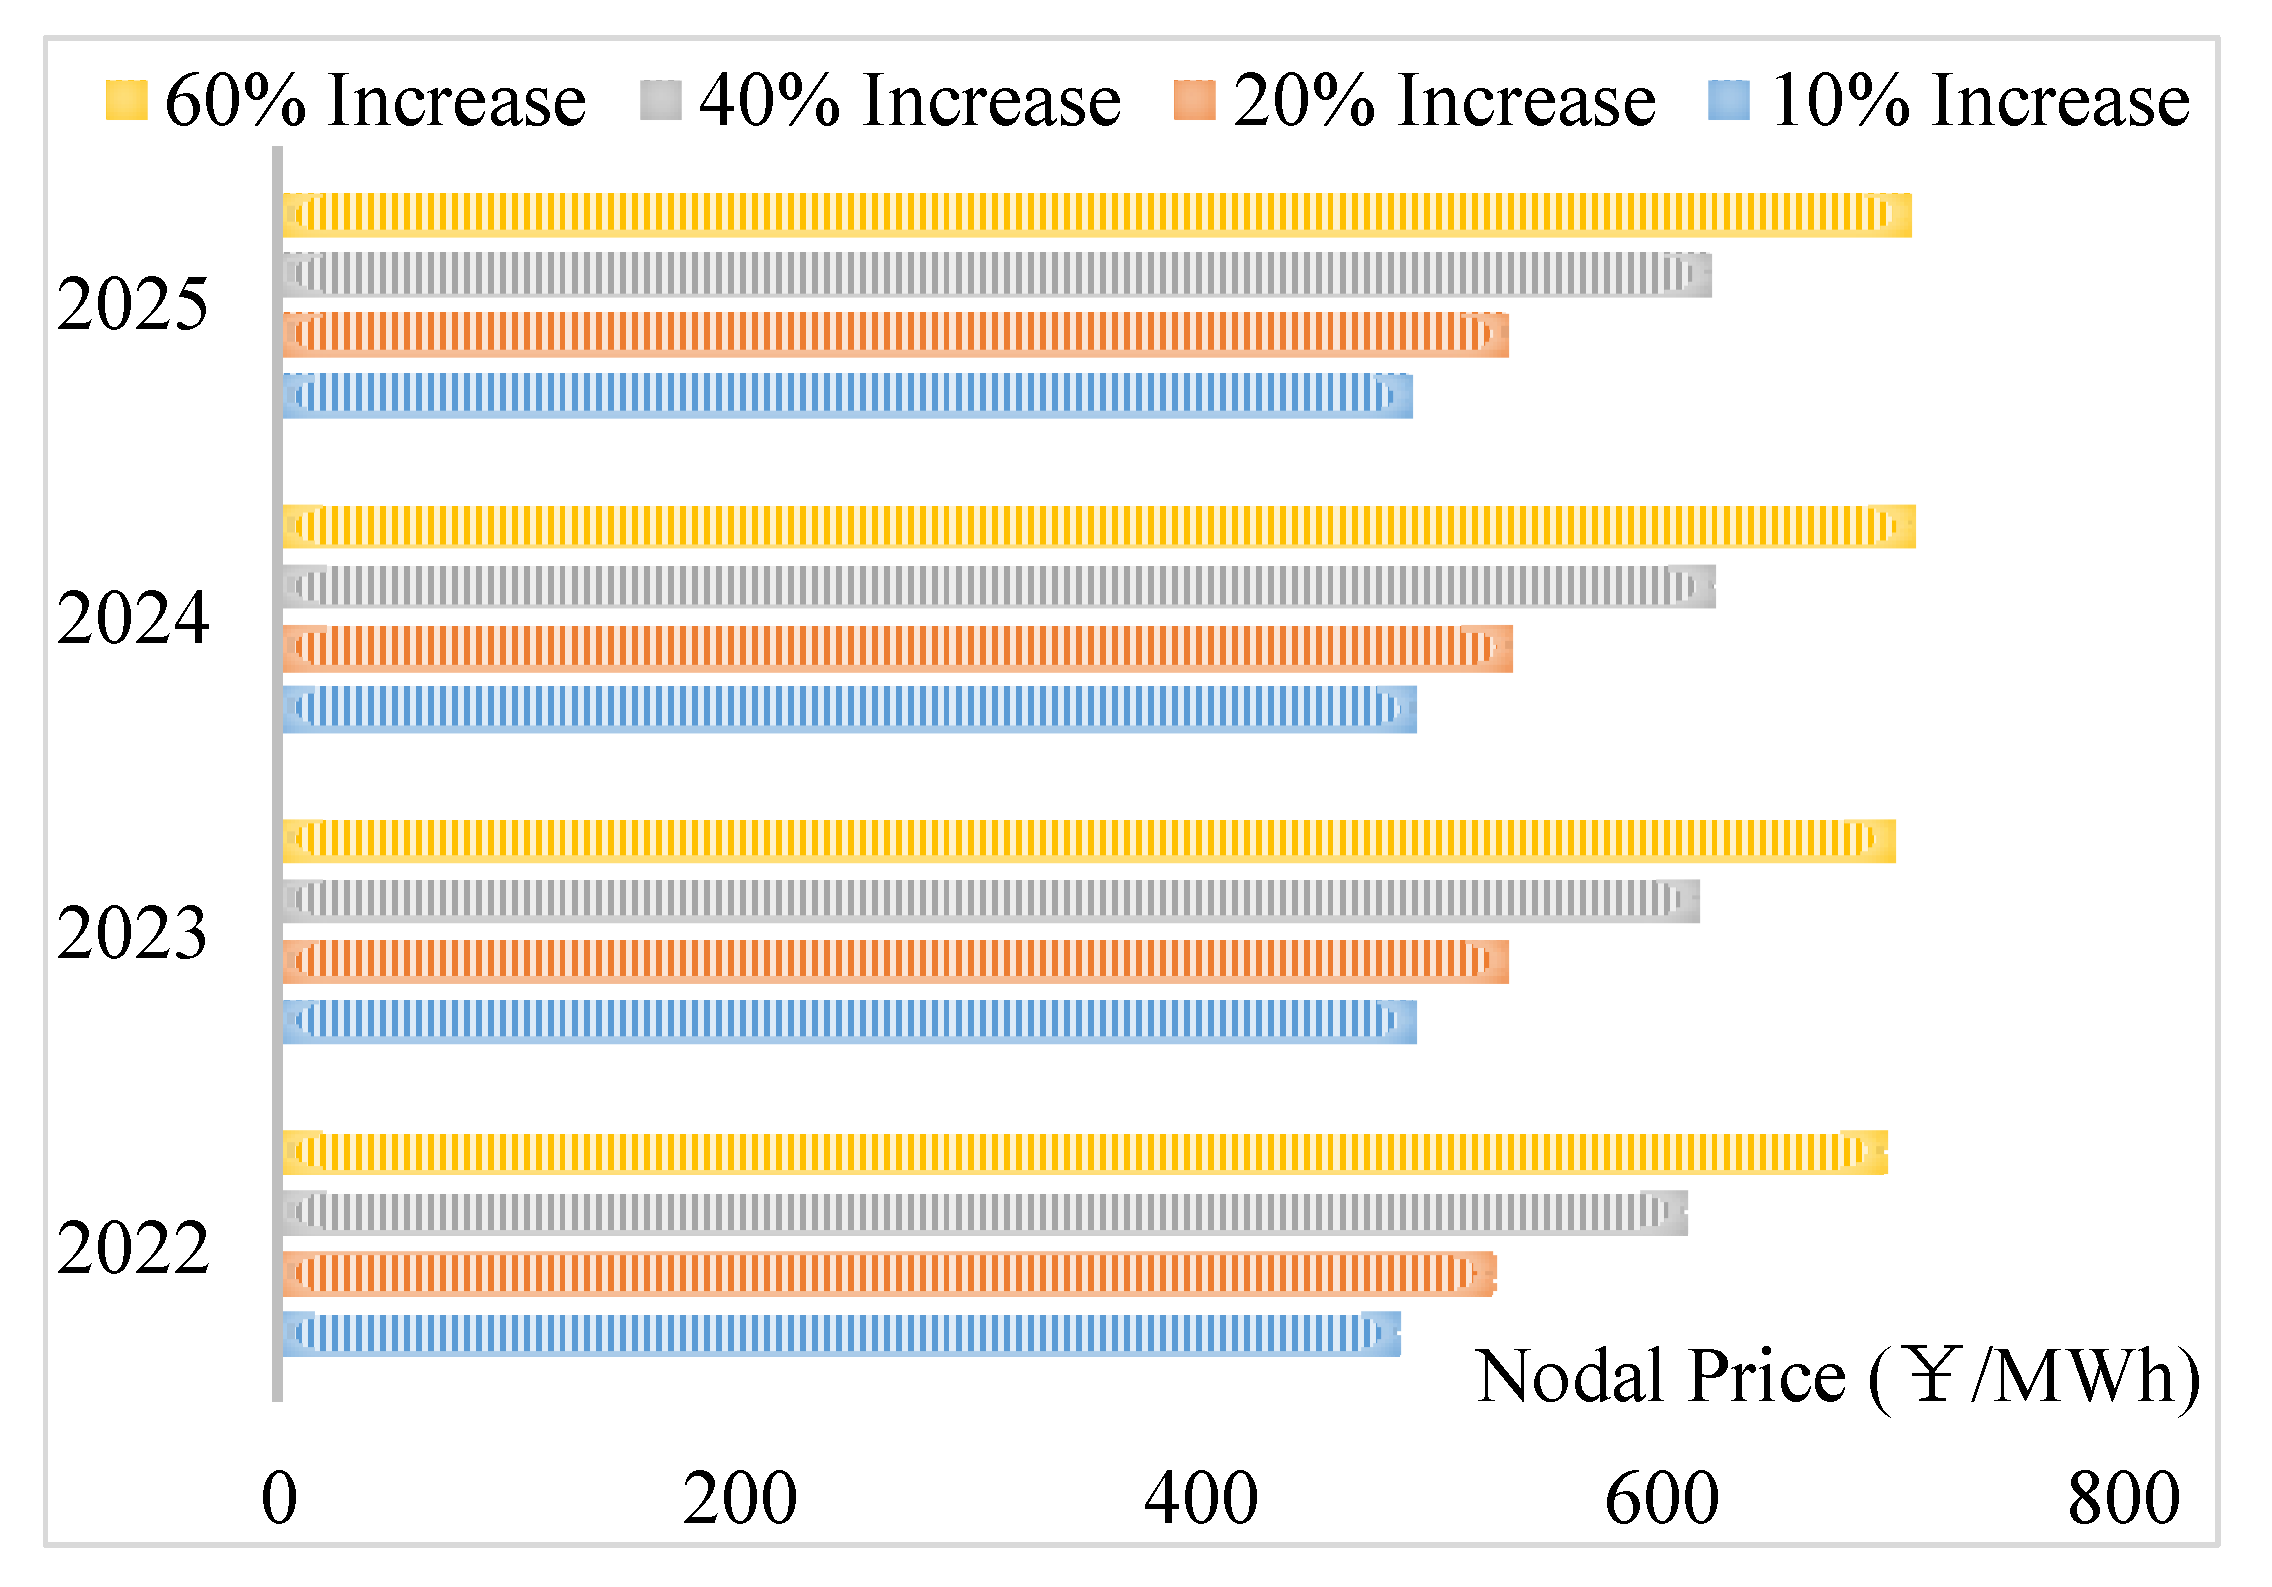
The changes in the city-wide average node electricity prices in each year due to bidding price fluctuations are shown in Figure 11. It can be observed that the fluctuations in unit bidding prices have a significant impact on node electricity prices, with a clear increase in city-wide average node electricity prices as the proportion of bidding price increases. This indicates that, under the current planning strategy, it is difficult to maintain stable node electricity prices when bidding prices increase due to changes in unit fuel costs. It is suggested that the situation could be improved by increasing the installation proportion of low-marginal-cost new energy sources such as solar and wind power.
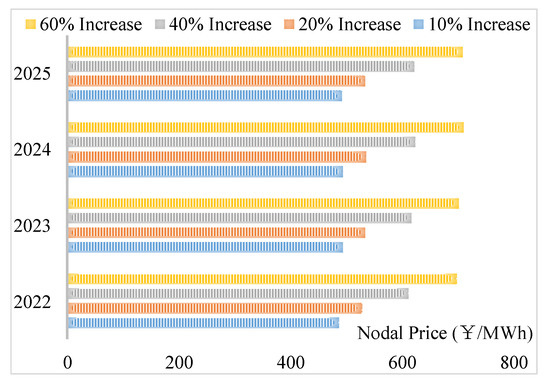
Figure 11.
The bidding price growth of different proportions, and the average nodal price of Shenzhen.
5. Conclusions
This paper aimed to analyze and compare the effects of the spot market environment on existing planning strategies. Firstly, mathematical formulas were employed to elucidate the disparities in planning methodologies under varying conditions. Secondly, this paper adopted an HEL approach to generator bidding strategies under different scenarios, thereby simulating the bidding process more accurately according to actual trading prices.
Furthermore, a spot market simulation was designed on the basis of the Shenzhen regional power grid in this paper. From the simulation results, some conclusions can be drawn. Under the spot market environment, the nodal electricity price in the planned area can be approximately maintained within the range of 400–500 CNY/MWh. This result means that there are no significant disparities in nodal prices among different regions attributed to the absence of line congestion, thereby confirming the efficacy of the planning scheme. Additionally, there is almost the same output of various types of generators compared to previous years, and the proportion of clean energy is relatively high. These results indicate that HEL can effectively simulate the bidding strategies of different generator types in a real market environment. Moreover, when the current system faces a limited external power supply, it exhibits minimal impact due to its ample power generation capacity redundancy. Conversely, a high percentage of gas-fired power generation renders the system highly sensitive to energy prices.
This paper holds significant implications for the future development of spot markets in the Shenzhen region. In future research, it is necessary to delve deeper into the bidding strategy of renewable energy in the spot market, aiming to mitigate the potential risk of inadequate system reliability that may arise from the near-term centralized retiring of coal-fired generators. Additionally, as the spot market evolves, conducting further analysis on market simulations encompassing a broader range of generation types and larger system scales becomes crucial.
Author Contributions
Conceptualization, W.L., Q.W., R.W., X.F. and Y.X.; methodology, W.L., J.Z., Q.W., R.W., X.F., Y.X. and Y.Y.; software, Y.Y.; validation, W.L.; formal analysis, W.L., Q.W., R.W., X.F. and Y.X.; investigation, W.L. and Y.Y.; resources, W.L., Q.W., R.W., X.F. and Y.X.; data curation, W.L. and Y.Y.; writing—original draft preparation, W.L. and Y.Y.; writing—review and editing, W.L., J.Z. and Y.Y.; visualization, Y.Y.; supervision, W.L., Q.W., R.W., X.F. and Y.X.; project administration, W.L. and Y.Y.; funding acquisition, W.L., Q.W., R.W., X.F. and Y.X. All authors have read and agreed to the published version of the manuscript.
Funding
This research was funded by a Special Planning Project by China Southern Power Grid Shenzhen Power Supply Co., Ltd.
Data Availability Statement
Not applicable.
Acknowledgments
This paper was supported in part by the Shenzhen Institute of Artificial Intelligence and Robotics for Society (AIRS).
Conflicts of Interest
The authors declare no conflict of interest.
Nomenclature
| Abbreviation | |
| VPPs | Virtual power plants |
| HEL | Hybrid experimental learning |
| LMP | Locational marginal price |
| NPV | Net present value |
| GANs | Generative adversarial networks |
| PV | Photovoltaic |
| Indices and Sets | |
| Index and set of bus locations | |
| Index of years | |
| Parameters | |
| Additional investment cost of the transmission lines | |
| Unit price of transmission lines | |
| Length of transmission lines | |
| Existing transmission lines | |
| Susceptance of the transmission lines | |
| Load of bus | |
| Upper limit of variables | |
| Discount rate | |
| ,, | Cost coefficient of generators |
| Generation emission factor | |
| Emission cost coefficient of generators | |
| Spot market electricity price | |
| Beta distribution parameters | |
| , | Solar radiation intensity and maximum intensity |
| Conversion efficiency | |
| Variables | |
| Numbers of newly added transmission lines | |
| Power flow on transmission line | |
| Generation output | |
| , | The voltage phase angle of bus and |
| Total planning cost | |
| Lines construction cost | |
| Unit generation cost | |
| External electricity purchasing cost | |
| External purchasing power | |
| , | Area of installed pv panels and pv power output |
| , | Sample expectation of real samples and noise data samples |
| , | Discriminator network and the generator network |
References
- Lu, T.; Zhang, W.; Wang, Y.; Xie, H.; Ding, X. Medium- and Long-Term Trading Strategies for Large Electricity Retailers in China’s Electricity Market. Energies 2022, 15, 3342. [Google Scholar] [CrossRef]
- Wang, M.; Song, Y.; Sui, B.; Wu, H.; Zhu, J.; Jing, Z.; Rong, Y. Comparative study of pricing mechanisms and settlement methods in electricity spot energy market based on multi-agent simulation. Energy Rep. 2022, 8, 1172–1182. [Google Scholar] [CrossRef]
- Yang, J.; Dong, Z.; Wen, F.; Chen, Q.; Liang, B. Spot electricity market design for a power system characterized by high penetration of renewable energy generation. Energy Convers. Econ. 2021, 2, 67–78. [Google Scholar] [CrossRef]
- Du, Z.; Zhang, C.; Li, Y.; Guo, B.; Sun, Q.; Zhang, Y. Trading Mechanism Design for Demand Response Resources Participating in Electricity Spot Market. In Proceedings of the 2021 International Conference on Power System Technology (POWERCON), Haikou, China, 8–9 December 2021; pp. 639–645. [Google Scholar] [CrossRef]
- Green, R.; Newbery, D.M. Competition in the British Electricity Spot Market. J. Political Econ. 1992, 100, 929–953. [Google Scholar] [CrossRef]
- Guan, X.; Wu, J.; Gao, F.; Sun, G. Optimization-Based Generation Asset Allocation for Forward and Spot Markets. IEEE Trans. Power Syst. 2008, 23, 1796–1808. [Google Scholar] [CrossRef]
- Zhang, M.; Xu, Y.; Sun, H. Optimal Coordinated Operation for a Distribution Network With Virtual Power Plants Considering Load Shaping. IEEE Trans. Sustain. Energy 2022, 14, 550–562. [Google Scholar] [CrossRef]
- Chen, W.; Qiu, J.; Zhao, J.; Chai, Q.; Dong, Z.Y. Bargaining Game-Based Profit Allocation of Virtual Power Plant in Frequency Regulation Market Considering Battery Cycle Life. IEEE Trans. Smart Grid 2021, 12, 2913–2928. [Google Scholar] [CrossRef]
- Qu, M.; Ding, T.; Wei, W.; Dong, Z.Y.; Shahidehpour, M.; Xia, S. An Analytical Method for Generation Unit Aggregation in Virtual Power Plants. IEEE Trans. Smart Grid 2020, 11, 5466–5469. [Google Scholar] [CrossRef]
- Ullah, M.H.; Park, J.-D. Transactive Energy Market Operation Through coordinated TSO-DSOs-DERs interactions. IEEE Trans. Power Syst. 2023, 38, 1978–1990. [Google Scholar] [CrossRef]
- Ndrio, M.; Bose, S.; Tong, L.; Guo, Y. Coordinated Transaction Scheduling in Multi-Area Electricity Markets: Equilibrium and Learning. IEEE Trans. Power Syst. 2022, 38, 996–1008. [Google Scholar] [CrossRef]
- Yang, L.; Sun, Q.; Zhang, N.; Li, Y. Indirect Multi-Energy Transactions of Energy Internet With Deep Reinforcement Learning Approach. IEEE Trans. Power Syst. 2022, 37, 4067–4077. [Google Scholar] [CrossRef]
- Borge-Diez, D.; Rosales-Asensio, E.; Palmero-Marrero, A.I.; Acikkalp, E. Optimization of CSP Plants with Thermal Energy Storage for Electricity Price Stability in Spot Markets. Energies 2022, 15, 1672. [Google Scholar] [CrossRef]
- Bayborodina, E.; Negnevitsky, M.; Franklin, E.; Washusen, A. Grid-Scale Battery Energy Storage Operation in Australian Electricity Spot and Contingency Reserve Markets. Energies 2021, 14, 8069. [Google Scholar] [CrossRef]
- Yang, Y.; Ji, T.; Jing, Z. Adaptive learning for strategic bidding in a uniform pricing electricity spot market. CSEE J. Power Energy Syst. 2021, 7, 1334–1344. [Google Scholar]
- Zhai, Q.; Meng, K.; Dong, Z.Y.; Ma, J. Modeling and Analysis of Lithium Battery Operations in Spot and Frequency Regulation Service Markets in Australia Electricity Market. IEEE Trans. Ind. Inform. 2017, 13, 2576–2586. [Google Scholar] [CrossRef]
- Ghorani, R.; Fotuhi-Firuzabad, M.; Moeini-Aghtaie, M. Optimal Bidding Strategy of Transactive Agents in Local Energy Markets. IEEE Trans. Smart Grid 2018, 10, 5152–5162. [Google Scholar] [CrossRef]
- Kanagaraj, A.; Raguru, K.D. Electricity economics for ex-ante double-sided auction mechanism in restructured power market. Energy Convers. Econ. 2021, 3, 31–37. [Google Scholar] [CrossRef]
- Sutton, R.S.; Barto, A.G. Reinforcement Learning: An Introduction; MIT Press: Cambridge, MA, USA, 2017. [Google Scholar]
- Yang, Y.; Qiu, J.; Ma, J.; Zhang, C. Integrated grid, coal-fired power generation retirement and GESS planning towards a low-carbon economy. Int. J. Electr. Power Energy Syst. 2020, 124, 106409. [Google Scholar] [CrossRef]
- Tao, Y.; Qiu, J.; Lai, S.; Zhang, X.; Wang, G. Collaborative Planning for Electricity Distribution Network and Transportation System Considering Hydrogen Fuel Cell Vehicles. IEEE Trans. Transp. Electrif. 2020, 6, 1211–1225. [Google Scholar] [CrossRef]
- Yang, Y.; Qiu, J.; Zhang, C.; Zhao, J.; Wang, G. Flexible Integrated Network Planning Considering Echelon Utilization of Second Life of Used Electric Vehicle Batteries. IEEE Trans. Transp. Electrif. 2021, 8, 263–276. [Google Scholar] [CrossRef]
- Ruan, J.; Liang, G.; Zhao, J.; Qiu, J.; Dong, Z.Y. An Inertia-Based Data Recovery Scheme for False Data Injection Attack. IEEE Trans. Ind. Inform. 2022, 18, 7814–7823. [Google Scholar] [CrossRef]
- Rana, A.; Gróf, G. Assessment of the Electricity System Transition towards High Share of Renewable Energy Sources in South Asian Countries. Energies 2022, 15, 1139. [Google Scholar] [CrossRef]
- Liu, W.; Zhao, J.; Qiu, J.; Dong, Z.Y. Interpretable hybrid experimental learning for trading behavior modeling in Electricity Market. IEEE Trans. Power Syst. 2023, 38, 1022–1032. [Google Scholar] [CrossRef]


Disclaimer/Publisher’s Note: The statements, opinions and data contained in all publications are solely those of the individual author(s) and contributor(s) and not of MDPI and/or the editor(s). MDPI and/or the editor(s) disclaim responsibility for any injury to people or property resulting from any ideas, methods, instructions or products referred to in the content. |
© 2023 by the authors. Licensee MDPI, Basel, Switzerland. This article is an open access article distributed under the terms and conditions of the Creative Commons Attribution (CC BY) license (https://creativecommons.org/licenses/by/4.0/).