Abstract
This work presents a steady-state one-dimensional model of the FCC riser considering the vaporisation of the gas oil feed and subsequent cracking reactions. The evaporation of droplets is studied using three models: the classical homogeneous model and the heterogeneous vaporisation models from the literature. Droplets are modelled using the Lagrangian framework model for particles moving through a fluid. This was coupled with the gas–solid flow field describing the catalyst particulate transport in the riser. Cracking reaction kinetics are modelled using a four-lumped model. The model was then validated against published plant data. The model performed well in terms of gas oil conversion, gasoline yield, pressure drop, and phase temperature profiles. Therefore, it is suitable for use in the design and optimisation of new and existing FCC unit risers, particularly in cost–benefit analysis considering the current push away from petroleum energy sources. It was found that vaporisation models are largely insignificant in terms of gas oil conversion profiles and gasoline yield for usual operation conditions of FCC risers, which is a finding that had yet to be proven in the literature. Vaporisation models are shown to only affect conversion and yield when the initial droplet exceeds .
1. Introduction
The fluid catalytic cracking (FCC) was the major source of gasoline in the refinery in the 1990s [1] and 2000s [2], but it remains an important unit in the operation of modern refineries [3]. Modelling and simulation are key tools used to understand and study the FCC unit in both industry and academic research. Models have been used for optimisation of the unit, to design controllers for the unit, and in critical hazard analysis [4]. We showed in a recent review [5] that the modelling of the reactive multiphase flow occurring in the FCC riser involves three main features: the modelling of the vaporisation phenomena in the inlet region of the riser, kinetic modelling to describe the reactions and reaction rates, and hydrodynamic modelling to describe the flow field and pressure drop.
Because of the relative maturity of the FCC unit technology, the literature on the kinetic modelling of the riser cracking reactions is quite vast. It is understood that the reactions occurring in the FCC riser are chain reactions that proceed via carbenium ion theory [6]. Because of the complex nature of the FCC riser gas oil feed, often consisting of several thousand component species and all involved in multiple reaction chains, it becomes too expensive, in terms of both time and computation, to generate the reaction network in its entirety so that reaction rate equations may be established. Additionally, the available analytical capability to characterise and quantify species in the reaction mixture hindered such an exercise [7]. Consequently, researchers have used the lumping technique to group components in the complex reaction mixture into lumps that act as individual components that can react to form or be formed by other lumps in a simplified reaction network. In this way, the full reaction network is not created, only the lumped version is utilised, and kinetic parameters for lump-to-lump conversions are determined in kinetic studies. One of the earliest applications of this technique for catalytic cracking was by Weekman Jr and Nace [8], which considered three lumps, where the reaction mixture was characterised into the distillation cuts of gas oil feed, gasoline, and ‘coke + gas’. As analytical and computational technology improved in the subsequent years, researchers managed to build upon the work of Weekman Jr and Nace [8] to develop more detailed lumped kinetic models for catalytic cracking [9,10,11,12,13,14,15,16,17] (see also reviews by [5,7,18] for summaries of lumped kinetic models published in the literature). As a result of the simplicity of this approach, it has become the most common kinetic modelling approach in the FCC riser modelling literature. However, because lumped models fail to predict the reaction at the molecular level, they may be inadequate when tighter composition and product constraints are in place. Additionally, kinetic parameters obtained from a priori lumped models have been reported to be feed- and catalyst-dependent, which means they extrapolate poorly when either the feed properties or the catalyst is changed, and new experimental work is required [19,20]. Thus, in view of these limitations, Froment and others [19,20,21] developed the single event kinetic modelling method. This method considers the carbenium ion chemistry at the acid sites of the catalyst by considering the rate expressions for the elementary steps involved in the transformations by the intermediate complexes adsorbed to the active sites [19]. Because the kinetic constants are the elementary steps, they are feedstock invariant for any given catalyst. The drawback of this method is that the full reaction network first has to be constructed, which is computationally expensive. Several researchers further applied the single-event kinetic modelling approach for the FCC riser for various purposes [22,23,24].
A vast amount of experimental and plant data has been published in the literature, giving insights into the hydrodynamics of the transport of catalyst particles in the riser reactor. Louge and Chang [25] and Rhodes and Geldart [26] have reported ‘S’-shaped axial profiles that show a high solid density at the bottom of the riser and low solid density at the top of the riser. A core-annular radial profile has also been reported by various researchers [27,28,29], comprising of the core, with low concentration and high velocities of solids in the central region of the riser, and the annulus, with a high concentration and low (often negative) solid velocities near the wall. Another key observation from the experimental/plant studies is the observation of clusters [30]. Clusters occur when the solid particles in the flow group together or segregate, resulting in non-uniform concentrations of solids in the riser. These clusters have been observed to form in both the annular region and the dilute core region [29]. The conclusion from these studies is a gas–solid flow in the riser that shows both temporally and spatially varying heterogeneity. The hydrodynamic modelling is concerned with the mathematical description of this flow field in the riser. Within the literature, these models are usually classified using the Harris and Davidson [31] classification: class (i) models that predict only axial variation; class (ii) models that predict radial variations, i.e., core-annular models; and class (iii) models employing fundamental fluid dynamics governing equations to describe gas–solid flow. Type (iii) models are usually three-dimensional (3D) CFD models and, because of their fundamental nature, have a high degree of generalisation and adaptability to various geometries [18]. However, the numerical and computational complexity of the models is often daunting for some applications. Type (ii) models are usually two-dimensional (2D) and describe the heterogeneity observed in the radial direction and often involve several empirical correlations (such as the thickness of the annulus) and some fundamental balance relations for continuity, momentum, and energy. Type (i) models are the simplest and most widely used, especially for modelling one-dimensional (1D) risers. Their simplicity and low computational cost make them ideal for design and optimisation applications to determine the effects of operating conditions [32]. For generality, 1D FCC riser models in the literature usually consist of balance equations for mass, momentum, and energy, which are averaged over the radial coordinate of the riser geometry, coupled with a kinetic model for the cracking reactions. Two broad formulations of these models exist in the literature: Eulerian–Eulerian (E–E) and Eulerian–Lagrangian (E–L). E–E models consider solid and gas phases to be an interpenetrating continuum, and the balance equations are written for each phase [4,33]. In this formulation, interphase gradients are considered via the description of gas–solid heat and mass transfer. However, some workers have assumed negligible heat transfer resistance between the phases as a simplification [34,35], owing to the high heat transfer and mixing in the fluidised bed. In these cases, only one energy balance equation for the mixture is considered. In the E–L formulation, on the other hand, the catalyst particles are considered discrete elements, so that the motion of individual particles is described using Newton’s force balance law. To account for the motion of particles in the form of clusters in the riser, some researchers [36] have carried out the force balance on the cluster rather than on the individual catalyst particle (such that ). Here, the cluster diameter is approximated using a suitable empirical correlation. The addition of liquid gas oil feed in the riser results in three-phase flow pre-vaporisation. This is easily coupled with the gas–solid flow formulation by including mass, momentum, and energy equations for the liquid phase, and coupled with the gas–solid flow equations accordingly.
It is now generally accepted within the FCC unit research [2] that the cracking reactions in the riser reactor occur on the catalyst particle surface, while the feed is in the gas phase. Given that the feed gas oil is introduced to the riser in the form of atomised liquid droplets, it stands to reason that understanding the mechanisms and rates of feed vaporisation in the riser is essential for the accurate modelling of the unit. Many researchers have modelled this feed vaporisation to varying degrees of complexity. The simplest models usually ignore the vaporisation dynamics by assuming instant vaporisation of the feed at the bottom of the riser so that the riser exhibits purely two-phase flow [4,16,33,37]. The justification for this assumption is based on the observed vaporisation time being considerably smaller, about 3% [38], compared with the residence time of the riser, reported to be in the range of [1]. The difficulty in the formulation of correct physical models to describe the complex gas–solid–liquid interactions in the vaporisation region may also contribute to the use of instant vaporisation models [39]. These purely two-phase flow models are unable to predict the concentration and pressure gradients at the bottom of the riser and the gas acceleration in this region. The other, more detailed vaporisation models are usually divided into two types, based on the modelling of the thermal conductivity of the droplets as either infinite thermal conductivity (ITC) or finite thermal conductivity (FTC). Other model divisions also exist, such as equilibrium and non-equilibrium [40], although even in these cases, the models can usually be divided into either ITC and FTC. FTC is the more complete description of the vaporisation problem, where the full governing equations for mass, species, momentum, and energy are solved [41,42,43]. These describe both the temporal and spatial variation in temperature and concentration within and in the vicinity of the vaporising droplet [41], making the models computationally expensive, and they can usually only be solved in full for single droplets vaporising in a non-convective gas; therefore, they are impractical in an FCC riser model where the flow is already computationally demanding to simulate. Consequently, in FCC riser modelling, simplifications are made to the vaporisation problem in order to make it computationally tenable. Bellan and Harstad [44] developed a computationally efficient way of solving the vaporisation problem by deriving two temperature equations: the volume-averaged temperature of the droplet and the temperature difference between the volume-averaged temperature and the temperature at the droplet surface, so that the radial temperature profile can be reconstructed from the pair of temperature equations. This formulation greatly simplifies the problem and is what is widely referred to the as the FTC model in oil evaporation literature [39]. On the other hand, the ITC further simplifies the problem by assuming the droplet has no resistance to heat transfer, so that no internal spatial temperature gradients are present. This is the most widely used formulation in oil evaporation literature because of its simplicity.
Within either the ITC or FTC modelling frameworks, another important consideration is the Nusselt and Sherwood number correlations, which determine the heat and mass transfer phenomena between the droplet and surrounding fluid in the convective environment. Several of these correlations have been reported in the literature, and they can normally be divided into two broad categories [39]: homogeneous and heterogeneous vaporisation. The authors describe the former as models in which the vaporising droplet receives heat only from the surrounding gas, and the latter as models in which heat generated during direct collisions between catalyst particles and droplets is considered, resulting in enhanced heat transfer.
In the purely homogeneous vaporisation mode, such as in many spray combustion problems, the classical vaporisation model assumes infinite thermal conductivity of the droplet so that no temperature gradients are present anywhere on the droplet. This assumption will be used throughout this work. The Ranz–Marshall [45] Nusselt number correlation is then employed for heat transfer at the droplet surface and the analogous Sherwood number correlation for the flux of vapour at the droplet surface.
where is the Nusselt number, the Reynold’s number based on the droplet diameter, is the Prandl number, number, and the Schmidt number. Other literature correlations can be found in review papers on vaporisation, such as those by Faeth [46] and Sazhin [47]. The Abramzon and Sirignano [48] model modified the classical model by introducing correction factors to the Ranz–Marshall correlations to account for effect of Stefan flow on heat and mass transport at the droplet interphase, variable thermos–physical properties, non-unity Lewis number in the gas film around the droplet, and the effects of internal circulation in the droplet. These corrections are shown in Equations (3) and (4):
where and are as defined in (1) and (2), and and are the Spalding heat and mass transfer numbers, respectively. These models were developed for the vaporisation of droplets in the absence of any solid interaction, which is present in the FCC riser reactor. To account for the presence of solids, heterogeneous models are required. One of the earliest attempts at modelling this phenomenon was by Buchanan, who assumed that the dominant heat transfer mechanism during the elastic collision of a feed droplet and catalyst particle is conduction through the gas film around the droplet, making the transfer substantially similar to that of homogeneous vaporisation. Therefore, the Nusselt number correlation would have the same form as that of the homogeneous case, with the exception being that the Reynolds number is now based on catalyst particles rather than the gas. Additionally, Buchanan [1] accounted for the Leidenfrost effect, which results in reduced heat transfer when significant evaporation occurs at the droplet surface (i.e., during boiling), by introducing a modification to the Ranz–Marshall Nusselt number correlation:
Here, is the Reynold’s number based on the solid catalyst diameter and are the specific heat capacity and latent heat of vaporisation of the droplet, respectively. Other corrections in the literature to account for the effect also exist.
Although this formulation does consider the presence of catalysts, it still ignores the direct collision between feed droplets and the catalyst; as a result, it sets out maximum or overestimated results for vaporisation times. In contrast to this, Nayak, Joshi, and Ranade [2] separately considered the convective transfer discussed from the previous models and the heat transfer between catalyst and liquid droplets. They consider that, during the collision between the droplet and catalyst particle, the particle transfers heat to the droplet enough to vaporise times its volume in mass from the droplet, where is a model parameter, which Nayak considered to be in the range of for an FCC riser with a diameter catalyst and feed droplets. With this formulation, they showed that that effective Nusselt number correlation is the sum of the usual Ranz–Marshall classical transfer based on droplet diameter together with the transfer between solids and droplets.
where is the Prandtl number; is the Reynolds number; and subscripts indicate the Reynolds number based on the droplet and catalyst particle, respectively.
The key motivations for this study, as well as its originality, are to present a steady-state 1D model of the FCC riser accounting for reactions, vaporisation, and the complex hydrodynamics of the resulting reactive three-phase flow. Additionally, the impact on the conversion and yield of various vaporisation models will be investigated, which is a somewhat unexplored area in the available literature. Some emphasis is also given to the simulated flow field in the fully developed region of the riser.
2. Model Description
2.1. Hydrodynamics
The present reactive gas–solid flow is modelled using the traditional Eulerian phase description for the gas phase and Lagrangian description for the solid phase, to formulate the mass, momentum, and energy conservation equations for each phase. The model is steady state and one-dimensional (1D) by averaging over the radius of the riser.
The velocity of the gas is computed using the continuity equation for the molar balance of the gas phase [49]. This allows the effect of the molar expansion of the gas to be examined. In the force balance equation for the solid phase, gravitational force is considered, together with the interphase drag for momentum exchange. The hydrodynamic pressure gradient is estimated by the summation of the fluid–wall frictional losses, expressed here in their Fanning friction form, and the hydrostatic losses due to the weight of the catalyst and gas. Losses due to solid acceleration are also included; however, those due to gas acceleration are ignored. The friction coefficients, in their Fanning friction equation form, are computed using the procedure of [50], where the modified Hagen–Poiseuille expression [51] is used for the gas phase and Konno’s correlation is used for the solid phase. The normal solid pressure, which accounts for solid–solid interaction and is normally modelled using the solid modulus, is assumed to be negligible in the present case. This is reasonable because for this study, considering that this pressure is known to be a strong function of the solid volume fraction and varnishes for dilute flow. Similarly, the motion of the liquid droplet phase is analysed using the Langragian framework. The motion of the droplets was simulated from the solution of a force balance over a single dispersed droplet. The equation of motion for small spheres with temporal mass changes due to evaporation, moving through a fluid with non-zero slip, is used [43]. For simplicity, the lift force, virtual mass force, and Basset force were neglected in the present work because they are usually insignificant in the FCC riser unit [2]. There will be some exchange of momentum between catalyst and the droplets as a result of collisions; this is assumed to be less significant compared with the gas–droplet interaction. The force balance equations for the catalyst particles and the droplets introduce a drag coefficient, , which is computed using the particle-based Reynold’s number.
The energy balance of the gas–solid–droplet flow features energy equations for each phase, so that interphase gradients are considered. Heat transfer at the gas–solid interphase is computed using the Ranz–Marshall Nusselt number correlation. For the gas–droplet interphase, three distinct stages of feed vaporisation are considered, as established by Nayak, Joshi, and Ranade [2]: inert heating, vaporisation, and lastly boiling. Three different vaporisation models are considered: Buchanan, classic, and Nayak, which account for heat and mass transfer between the droplet and surrounding mixture. Inert heating occurs when , and the base case (classic model) uses the Ranz–Marshall correlation for sensible heating of the droplet. For , vaporisation occurs, thus the molecules escaping at the surface of the droplet draw latent heat from the droplet; therefore, an extra term accounting for latent heat is added to the droplet energy equation. In terms of mass transfer, the corresponding Ranz–Marshall correlation for the Sherwood number is used for the vaporisation rate, so that the flux per unit surface of the droplet is as follows:
where is the flux of vapor leaving the surface of the droplet in ; is the mass transfer coefficient in ; and and are the concentrations of component at the droplet–gas interphase and in the bulk gas phase, respectively, in . Evidently, this procedure requires the knowledge of instantaneous interphase concentration of the vaporising species. To compute this concentration, vapor–liquid equilibrium is assumed at the interphase, thus the saturation pressure of the vaporising species is given by the Clausius–Clapeyron correlation:
where is the saturation pressure at , is the latent heat of vaporisation, is the molar mass, and is the boiling point of lump . Because of its nature as a complex mixture of hydrocarbons, gas oil boils over a range of boiling points rather than at a single boiling temperature, like pure compounds [2]. However, the authors of [2] compared model results using boiling at a range of temperatures and boiling at a constant temperature, showing that the difference in the vaporisation lengths (and therefore times) is small. Therefore, a constant boiling point temperature of is used in the base case. The concentration of at the interphase can then be determined from the following:
In the last stage, boiling, it is assumed that the rate at which energy is removed by vaporisation is equal to the rate at which the droplet is heated by the surrounding phases, thus the temperature of the droplet stays at the boiling point. In this case, the vaporisation rate, and thus rate of change in the droplet diameter, is calculated from the heat transfer equation.
Therefore, , with as the gas–droplet heat transfer coefficient and as the droplet surface area and, at boiling, . The substitution is used to convert the vaporisation rate and droplet reduction rate to the axial derivatives.
The species balance equations are global balances for a component in both the gas phase and the adsorbate concentration. The change in component concentrations in the riser is a summation of the reactions and the vaporisation. Because the droplets are assumed to be made entirely of the gas oil lump, only the GO lump includes the vaporisation term. The coke is expected to only exist in the catalyst pores; therefore, no coke is expected in the gas phase. The deposition of coke will increase the density of the catalyst phase; however, it is assumed that this change is negligible, resulting in the constant density of the solid phase. This is a common assumption in the literature on the simulation of FCC riser reactions, and is justifiable given that the exit coke on the catalyst concentration from the riser is in the range of [52].
2.2. Cracking Reactions
To simulate the reactive flow, an appropriate cracking kinetics model is coupled with the hydrodynamics model. A common assumption in the FCC riser modelling literature is that the cracking reactions only occur in the gas phase; therefore, gas oil is not expected in the reaction before vaporisation. In the present work, a simple four-lump model is used to simulate these gas phase reactions. The lumps involved are gas oil feed (GO), gasoline (GL), light gases (LG), and coke (CK). A summary of the kinetic lump scheme is shown in Figure 1.
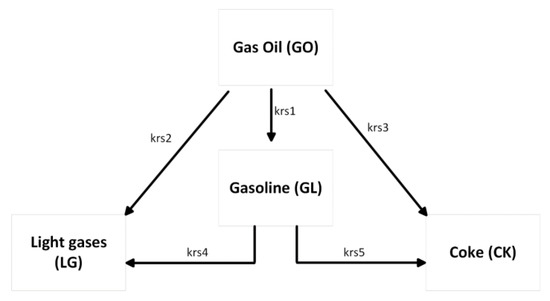
Figure 1.
Four-lump kinetic scheme used in this work.
The model assumes that gas oil cracking is second order with respect to gas oil lump concentration, and that cracking of the gasoline lump is first order. Interphase and intra-particle mass transfer limitations are assumed to be negligible. This assumption has previously been used by various workers [2,16,33,36,37,53,54]. The rate equations for the reaction rate per mass of catalyst in the riser can then be written as follows:
The factor in the rate expressions for gas oil cracking is a ratio of the local concentration of gas oil up the riser to the initial concentration of gas oil. Its inclusion in the rate expression accounts for the increasing difficulty of cracking the gas oil as its concentration decreases, because lighter, easier to crack molecules crack first and heavier molecules remain. This factor is evaluated using the following:
The kinetic parameters, , follow an Arrhenius type relation with temperature, and represents the concentration of in the bulk gas. In the present study, the values for the frequency factors are taken from Pitault, et al. [55], which were evaluated at ; therefore, to evaluate the values at the riser temperature, the following relation is used:
where and are the frequency factor and activation energy of the reaction, respectively. is the non-selective deactivation coefficient that measures the decline in the activity of the catalyst due to deposition of coke on the catalyst surface. The deactivation model by Pitault, Forissier, and Bernard [55] is used:
The values for and are and , respectively. is the concentration of coke on the catalyst in . The cracking reactions taking place on the surface of the catalyst are endothermic and, therefore, will consume energy from the catalyst in order to proceed. This heat of the reaction is accounted for through the term in the energy equation for the catalyst, and is determined as follows:
for in and the enthalpy change of the reaction, , is in . The values for the enthalpy change of the reaction used in the present work are those from Han and Chung [4], shown in Table 1.

Table 1.
Kinetic parameters used in the present simulation studies: frequency factors from Pitault, Forissier, and Bernard [55]; activation energy from Pitault, Forissier, and Bernard [55]; and heat of reactions from Han and Chung [4].
A summary of all of the model equations and constitutive equations is presented in Table 2 and Table 3, respectively. A description of the notation used throughout the equations is provided in Appendix B.
Table 2.
Summary of the model equations.
Table 3.
Summary of the constitutive equations.
2.3. Simulation Procedure
For implementation, the current model is programmed in the MATLAB R2021a environment. Initial runs of the model were performed using the built-in Runge–Katta-based explicit solver ode45; however, the solver required an excess of steps and sometimes failed to find the solution within the required tolerance, indicating that the DAE problem had a high degree of stiffness. Given this stiffness of the problem, especially in the riser inlet, the two built-in implicit ODE solvers, namely ode15s and ode23s, are used to solve the DAE system. The former is a multi-step method based on numerical differentiation formulas (NDFs) of order 1 to 5, with the option to use backward differentiation formulas, although this option is never realised in this work. The latter is based on a modified Rosenbrock formula of order 2 [56].
3. Results and Discussion
This section is divided by subheadings. It provides a concise and precise description of the experimental results, their interpretation, as well as the experimental conclusions that can be drawn.
3.1. Derouin Case Study and Model Validation
The model developed is used to simulate the industrial FCC riser used in the work of Derouin, Nevicato, Forissier, Wild, and Bernard [57], and the results are compared to plant data published by the authors. However, the simulation of the riser is not straight forward, as Derouin, Nevicato, Forissier, Wild, and Bernard [57] have given some of their values in ranges, rather than exact values, such as flowrates and temperatures of the feed and catalyst, as well as CTO ratios. For the purposes of the comparison, the values for these variables are picked within the ranges and are summarised in Table 4. The work of Derouin, Nevicato, Forissier, Wild, and Bernard [57] also did not report the droplet diameter of the atomised gas oil feed into the riser; a value of is used in the current simulation. This value of has previously been used to study heterogeneous vaporisation of FCC feed drops by Nayak, Joshi, and Ranade [2]. This value falls within the range of for initial droplet size in the FCC vaporisation literature.
Table 4.
Operating conditions for the plant data and the operating conditions used in the base case simulation.
The computed solutions for the droplet profiles along the riser height are shown in Figure 2a. The lack of experimental data on droplet–particle collision dynamics to determine the value of in the Nayak model means that it is treated as an adjustable parameter [2]. In this work, integer values of in the range of are investigated, as shown in Figure 2a; the lower limit of corresponds to the classical vaporisation model, where catalyst involvement in the heat transfer to the droplet is negligible and heat transfer is purely convective. This limit is suitable for dilute flow (where ). The upper limit, [2], represents the complete vaporisation of a droplet upon collision with a catalyst particle. This limit corresponds to instantaneous vaporisation of feed droplets at the entrance zone. Instantaneous vaporisation is a common assumption in the FCC riser modelling literature. In this work, predicts complete vaporisation in the first of the riser, which is negligible compared with the other vaporisation models considered in this work. Thus, this value is used to simulate the case of instantaneous vaporisation. Nayak, Joshi, and Ranade [2] found that their model predicted complete vaporisation at the same height as the model of Buchanan [1] when . However, this result is not reproduced here; instead, it is found that lies between 10 and 12 in the present work. Figure 2a shows that the value of predicts complete vaporisation within of the riser, whereas the Buchanan model (and ) predicts complete vaporisation within from the riser inlet. On the other hand, the classic, purely homogeneous model predicts the droplet penetrating to a height of before total vaporisation, indicating that the particle involvement as simulated by the heterogeneous model of Buchanan (and the Nayak model with between 10 and 12) improves the heat transfer by a factor , which is significant.
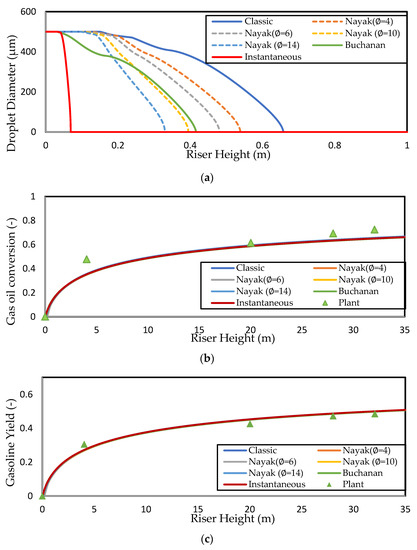
Figure 2.
Simulated axial profiles for different vaporisation models showing (a) droplet diameter, (b) gas oil conversion, and (c) gasoline yield for the Derouin case study. The gas oil conversion and gasoline yield are compared to the data reported by Deroiun in (a) and (b), respectively. The Derouin gas oil feed is assumed to have Tvap = 650 K and Tbp = 700 K.
Derouin, Nevicato, Forissier, Wild, and Bernard [57] have presented gas oil conversion and gasoline yield axial profiles from experiments performed on an industrial FCC riser, which are shown in Figure 2b,c, respectively. These data were compared to the simulation results from various vaporisation models that have already been discussed. The general trend in both axial profiles (Figure 2a,b) is consistent with the plant data, showing a steep increase in conversion and yield in the first of the riser due to high catalyst activity and temperature, followed by levelling off due to deactivation of the catalyst and lower catalyst temperature. It should be noted that the data from Derouin, Nevicato, Forissier, Wild, and Bernard [57] are measured along the riser centreline, while the current model equations are radially averaged. Measurements of the conversion at 2/3 of the riser height by Derouin, Nevicato, Forissier, Wild, and Bernard [57] revealed that the conversion is higher near the wall and lower at the riser centre, with differences of . The workers attributed this to the core-annular structure of the solid flow and the Ostwald–de Waele-like gas flow, resulting in higher cracking activity near the wall. However, this is not expected cause the plant data in Figure 2b,c to deviate significantly during radial averaging as the bulk of the gas in the riser moves through the central core region owing to the core-annular profile. In this way, the centre measurements are taken as representative of the radial-averaged profiles because such data are unavailable. An interesting observation is that the conversion and yield profiles for all of the vaporisation models overlap for the entirety of the riser height. It is clear from Figure 2 that the region within the first of the riser is the most important, as this is where most of the conversion occurs. The operation of the riser is such that conversion is a two-step process, where vaporisation occurs first, followed by cracking reactions as these reactions occur in the gas phase. The observation of the overlap of conversion and yield profiles in Figure 2b,c indicates that the cracking reaction rates are independent of the heat transfer correlation used, which suggests that the cracking reactions of the gaseous gas oil are rate-limiting compared with the vaporisation step, in the absence of any mass transfer and/or adsorption limitations. To the best knowledge of the authors, this result has not been proven before in the literature despite its inference in a large body of FCC riser modelling literature. Later, the validity of this result is examined for different operating conditions. Ali, Rohani, and Corriou [38] have also previously published commercial plant data, reporting gas oil conversion and gasoline yield at riser exit. Some pilot-scale studies of the FCC unit have also provided insights into the riser exit conversion and gasoline yields. Paraskos, et al. [58] have carried out various pilot-scale studies at CTOs varying from , reporting conversion in the range of and gasoline yield in the range of . Additionally, Blasetti and de Lasa [59] have carried out various pilot-scale catalytic cracking experimental studies at CTO ratios varying from , reporting gas oil conversion in the range of and gasoline yield in the range of .
Detailed measurements of the droplet diameter evolution along the riser height at normal operating conditions are required to make an appropriate selection of the vaporisation model. Unfortunately, to the best knowledge of the authors, such measurement data are yet to be available in the open literature. Experimental studies, which investigate droplet vaporisation dynamics available in the literature, have mostly been carried out using pilot-scale fluidised beds, using water, ethanol, and other simple compounds to investigate mono/two-component vaporisation [60,61]. Such experiments have been the basis for the validation of the existing vaporisation models. The studies of Leclère, Briens, Gauthier, Bayle, Guigon, and Bergougnou [61] found that heterogeneous heat transfer correlations tended to overestimate the vaporisation rate, resulting in shorter vaporisation times than those observed in their experiments with ethanol droplets. This tendency may also be at play in the current work for the models of Nayak () and Buchanan, although it is difficult to confirm with any certainty because no plant data are available for droplet diameter axial profiles. Therefore, because Leclère, Briens, Gauthier, Bayle, Guigon, and Bergougnou [61] found that the values of vaporisation times predicted by homogeneous vaporisation models were closest to the experimental data, the classic model is used in this work for the simulation of the base case. Later, the classic model will also be used to study the effect of droplet thermal conductivity.
Further studies of the proposed riser model are carried out here to analyse the variation in variables such as temperature, pressure, phase velocity, and gas composition along the riser for the base case. The operating conditions and physical parameters used for the simulation of the base case are provided in Table 4. The properties of the three phases (liquid, catalyst, and gas) at the inlet are as defined in the Appendix A. For the base case, the classic vaporisation model is used. Figure 3a shows the results for the droplet diameter along the riser height. The base case (classic model) predicts that complete vaporisation occurs at a height of .
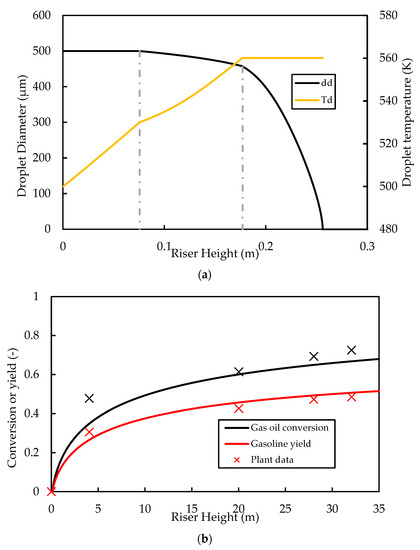
Figure 3.
Simulated base case profiles for (a) droplet diameter and temperature and (b) gas oil conversion and gasoline yield compared with plant data. Dashed lines in (a) indicate the vaporisation temperature ( and boiling point ( for the gas oil feed.
Figure 3b shows the axial profiles of gas oil conversion and the gasoline yield for the base case compared with the data from Derouin, Nevicato, Forissier, Wild, and Bernard [57]. The general trend in the predictions is consistent with that of the plant data of Derouin, Nevicato, Forissier, Wild, and Bernard [57], with a rapid increase in conversion and yield in the first of the riser. The predictions for conversion and yield are also in good quantitative agreement with the plant data. The riser outlet conversion is predicted to be , which is within the normal range of gas oil conversion reported in the literature. The yield of gasoline at the outlet is predicted to be , which is within the range of about reported in the literature.
3.2. Base Case Performance Results
Figure 4 shows the axial profiles of the temperatures of the gas and solid (catalyst) phases along the riser height. The inlet values for the fluidising steam and catalyst temperatures were set at and , respectively. It can be seen that, initially, the gas temperature rises rapidly owing to good heat transfer from the catalyst. Both the catalyst and the gas temperatures then decrease rapidly owing to the provision of latent and sensible heat to the liquid feed and the provision of heat energy to power the endothermic cracking reactions. The initial coke concentration on the regenerated catalyst was set to , which is typical for FCC regenerator outlets [52]. Figure 5 shows that the coke content increases rapidly in the first of the riser during the progress of the cracking reactions, thus the activity of the catalyst decreases to less than of its ‘clean’ activity in this region of the riser. Beyond this point, cracking reactions have slowed significantly owing to lower temperatures and reduced catalyst activity. Therefore, further changes in temperature, coke concentration, and catalyst activity are minimal, as shown in the figures. The exit coke on catalyst concentration is predicted to be , which is within the normal range reported in the literature [5,52]. The exit temperature is , indicating a catalyst temperature drop of . Comparison of the catalyst temperature drop with previous work is not straight forward because of the disparities in the operating conditions, kinetic parameters, and physical properties of the phase mixtures. Han and Chung’s [4] model of the FCC unit assumed instant vaporisation and found a regenerated catalyst temperature of , post vaporisation catalyst temperature of , and riser exit temperature of , corresponding to a total catalyst riser temperature of , when using , a dispersion steam inlet temperature of , and a feed inlet temperature of . Therefore, the present base case temperature drop prediction is within reasonable expectation.
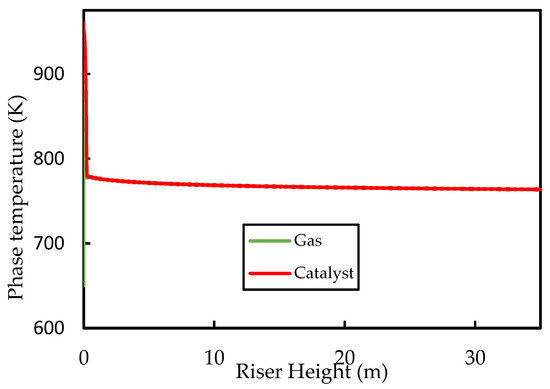
Figure 4.
Simulated axial phase temperature profiles for the base case.
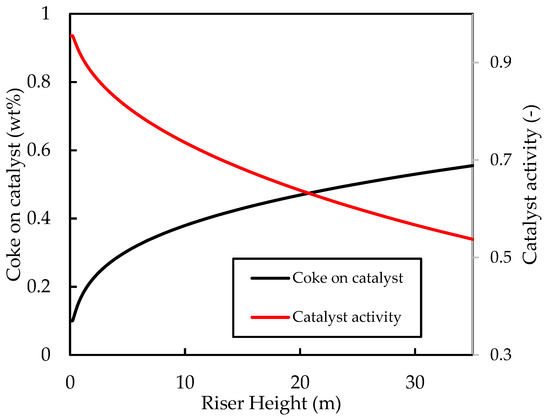
Figure 5.
Simulated axial profiles for the coke on catalyst concentration (wt%) and the catalyst activity coefficient for the base case.
Figure 6 shows the axial gas phase mass fractions along the riser height. Initially, the gas oil mass fraction increases as a result of vaporisation, followed by a decrease as the vaporisation is complete and the cracking reactions occur. The cracking reactions produce gasoline and light gases in the gas phase, which increases their mole fractions along the riser. The initial increase in the mole fractions is steep because of the rapid cracking reactions in this region, followed by a levelling off as the cracking reactions slow down. Similar gas phase profiles were reported by Nayak, Joshi, and Ranade [2] in their simulation results for the four-lump case. At the riser inlet, the gas phase is entirely made of dispersion steam (mass fraction ), but this decreases rapidly owing to the vaporisation of gas oil. At the riser exit, the steam flux is only about of the gas flow, while the rest is composed of hydrocarbons. The gasoline at the riser exit makes up of the gas product mixture, while the unreacted gas oil makes up of the gas mixture.
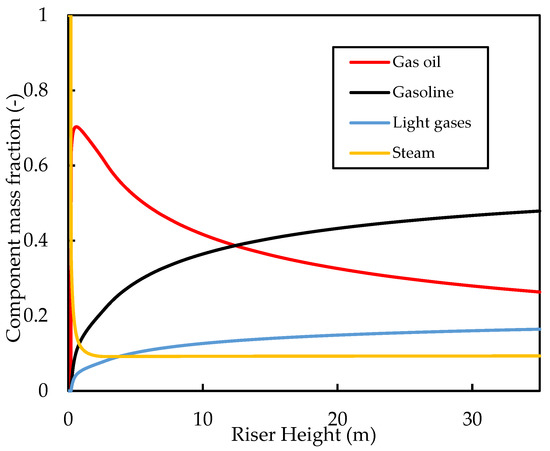
Figure 6.
Simulated axial profiles for the mass fractions of the gas components for the base case.
3.3. Hydrodynamics of the Base Case
Figure 7 shows that the solid hold up decreases rapidly up the riser, together with an almost linear pressure decrease. This pressure profile has been previously reported in the riser simulations of Han and Chung [4]. The overall riser pressure drop is predicted here to be . Unfortunately, a direct comparison of the pressure drop is not possible because of a lack of reported industrial data on pressure drops and the fact that this depends on operating conditions and fluid properties, which vary in practice and between researchers. Additionally, most researchers that have carried out simulation studies on the reactive flow of the FCC riser seldom report a pressure drop. However, simulation studies of a 1D reactive FCC riser by Han and Chung [4] showed a riser pressure drop of when using a catalyst flowrate of and CTO of . Theologos, et al. [62] reported a pressure drop in a commercial riser of . The workers also developed a comprehensive CFD riser model to simulate the reactive FCC riser reactor. Their simulation studies predicted a pressure drop of . Wu, et al. [63] reported industrial data showing a pressure drop of with a catalyst flux of and a CTO of 6.3 in an industrial riser. Therefore, the value of predicted for the base case is reasonable for the dilute flow riser.
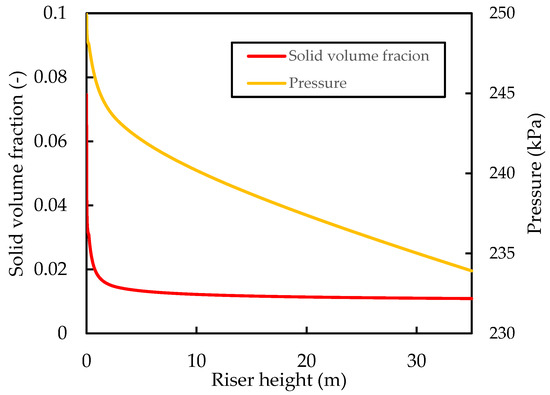
Figure 7.
Simulated axial profiles of the hydrodynamic pressure and solid hold up for the base case.
Figure 8 shows how the phase velocity profiles vary with riser height. Both phases accelerate rapidly at the entrance of the riser; the gas phase due to volume expansion initially, due to vaporisation into the gas phase, and then from the cracking reactions, and the catalyst due to drag from the gas. The plot also shows the apparent terminal velocity of the catalyst particles, the gas–solid slip, and the slip factor over the riser height. Terminal velocity was determined by a simple force balance around a falling catalyst particle.
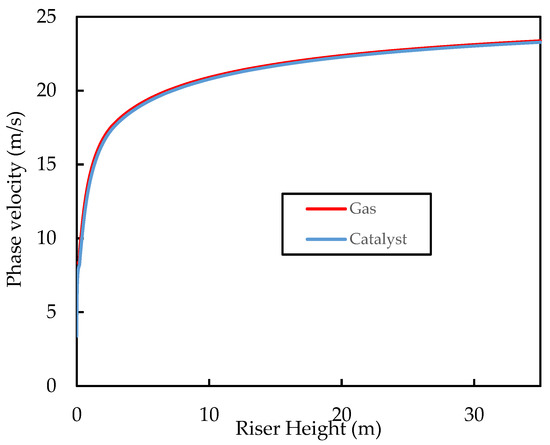
Figure 8.
Simulated axial profiles of the phase velocities for the base case.
As the densities of the gas and catalyst and the drag coefficients change with the height of the riser, the apparent terminal velocity also changes. Figure 9 shows that, for this system, the terminal velocity varies in the range of , which is within the range of experimental values reported in the literature for an FCC catalyst. Figure 9 also shows that the gas–solid slip velocity approaches the particle terminal velocity in the fully developed region of the riser (i.e., ). The slip factor is shown in the figure to drop very rapidly at the riser inlet to a value of , which is much lower than the slip factors predicted by the correlations of Patience, et al. [64] and Monazam and Shadle [65] for CFB risers.
where is the Froude number (), is the Froude number based on particle terminal velocity, and is the Reynold’s number (). The two empirical calculations predict slip factors in the range of for the fully developed region of the riser, which is consistent with observations of Matsen [66] for most industrial FCC risers. According to Berruti, Pugsley, Godfroy, Chaouki, and Patience [32], slip factors of one are observed as the gas velocity approaches pneumatic conveying, and the slip velocity approaches the terminal velocity of a single particle. Both observations are predicted here by the current model, indicating that the model predicts the flow field to be in the pneumatic transport regime rather than the fast fluidisation regime, as is the norm for most industrial FCC risers. Slip factors of one have been associated with low solid hold up and a pseudo-homogeneous flow field with little to no clustering effect, which has been widely reported in gas–solid risers in the fast fluidisation regime. Therefore, the present model fails to predict the presence of such clusters in the riser. This appears to be a deficiency of 1D models [50,67] with drag coefficients based on the catalyst diameter, as such slip factors have also been previously reported in simulations by other researchers (see phase velocity profiles by [2,4,16,37]). In order to rectify this issue, the momentum or force balance equation has to be written and drag analysis has to be based on the cluster properties rather than on the individual particle properties. Fernandes, Pinheiro, Oliveira, and Ribeiro [53] showed that higher slip factors () are achieved when the cluster diameter (≈100) is used rather than the particle diameter for the determination of gas–solid drag. A possible reason for this is the reduced surface area in the clusters compared with the catalyst particles, resulting in less drag. Gupta, Kumar, and Srivastava [54], using a cluster size of , found slip factors in the range of for the fully developed region of the riser, which is evidence that correct slip factors are achieved when drag force is determined using cluster properties. Further studies are required to confirm this postulation as well as, of course, further experimental work on FCC risers during normal operation to determine the actual slip factors. Nevertheless, the current slip factors yield acceptable results for the riser performance predictions.
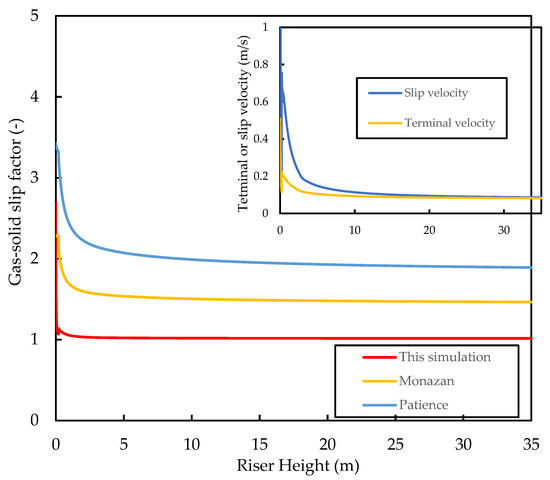
Figure 9.
Simulated axial profiles of the slip factor, the slip velocity, and the apparent terminal velocity for the base case.
3.4. Influence of Operating Conditions
In the previous section, it was shown that the gas oil conversion and gasoline yield profiles were virtually independent of the Nusselt number correlation used, indicating that the cracking reactions of gas oil were the slowest step in the evolution of gas phase component profiles. Here, the sensitivity of this result to the initial liquid droplet size, CTO, and inlet catalyst temperature is explored. In Figure 10a, the droplet diameter is varied for discrete values in the range of for a constant CTO and Tc; in Figure 10b, CTO is varied in the range of for constant values of and ; and in Figure 10c, is varied in the range of for a constant and CTO. Nayak, Joshi, and Ranade [2] showed that larger initial droplet diameters reduced the gas oil conversion, as larger droplets take longer to vaporise and thus delay the cracking reactions. However, the authors show that this effect is small, as an increase in droplet diameter from to resulted in only a small () decrease in conversion. This result is confirmed here in Figure 10a. Figure 10a also shows that there is some influence of the vaporisation model, although this is small. In fact, the effect of the vaporisation model only becomes significant for droplets of , in which case the homogeneous vaporisation model () predicts much lower conversion than the heterogeneous models. This is because the lack of catalyst involvement in the heat transfer to the droplets exacerbates the issue of delayed cracking reactions. Figure 10b,c show that increasing CTO (everything else being constant) and increasing (everything else being constant) results in an increase in the gas oil conversion; both results agree with those presented by Nayak, Joshi, and Ranade [2]. The CTO result is due to the increased amount of catalyst in the riser enhancing the cracking reactions, and the temperature result is due to the increased temperature, leading to higher rates of reactions. In Figure 10b,c, the work from Nayak, Joshi, and Ranade [2] is extended to include the influence of the vaporisation model on the conversion for different values of CTO and . It is shown here that the vaporisation model makes no difference to the gas oil and yield for different CTO and values, provided no mass transfer or adsorption limitations exist. Figure 10 shows that Nusselt and Sherwood number correlations used in the FCC riser model only become significant for feed atomisers resulting in droplets larger than .
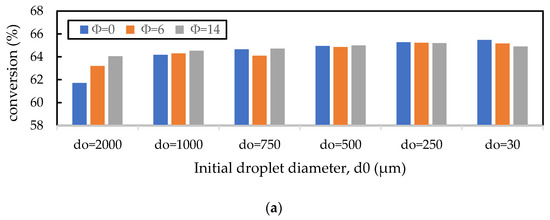
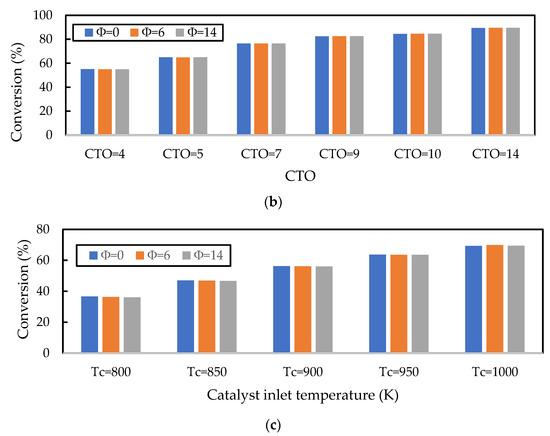
Figure 10.
Influence of the (a) initial droplet diameter (), (b) CTO, and (c) catalyst inlet temperature () on the prediction of gas oil conversion. The base values of , CTO, and are 500 m, 5, and 960 K, respectively. The vaporisation model is varied using the parameter in the Nayak model.
3.5. Influence of Droplet Thermal Conductivity Model
The analysis performed so far has assumed that the droplets have infinite thermal conductivity, which means that there is no resistance to heat transfer inside the droplet and hence the droplet has a uniform temperature, . The effects of limited heat transfer due to the finite thermal conductivity of the liquid droplets are incorporated into the droplet vaporisation problem using the finite thermal conductivity model (FTC) proposed by Bellan and Harstad [44]. In the FTC model, an extra equation for the temperature difference between the volume averaged droplet temperature and the droplet surface temperature (i.e., ) is solved alongside the differential equation for . The equation that governs and as taken from Miller, Harstad, and Bellan [40] is given as follows:
where is the ratio of heat capacities of the gas and the liquid droplet, ; is the ratio of the thermal conductivity ratio of the gas to the liquid droplet, ; is a non-dimensional evaporation parameter given by ; is a parameter for the reduction in the Nusselt number due to evaporation given by in this work; and is the droplet time constant for Stokes flow given by . The Prandl number is such that the gas properties are at the reference conditions and the Nusselt number is given by an appropriate literature correlation. As before, the substitution is used to convert Equations (23) and (24) to steady state to model the axial variation in the riser. The evolution of and allows for the complete reconstruction of the internal temperature profile of the droplet along the riser; however, this is beyond the scope of the current study.
For comparison of the FTC model against the base case, the inlet must be specified. The downside of the FTC model is that this value cannot be set to zero because of how the model was formulated [40]. The result is that the droplet surface begins “pre-heated”, which may affect the heat transfer predictions, especially in the initial stages of droplet heat up. In this work, the inlet droplet is set to and is set at , as in the base case. Figure 11 shows the comparison of the results from the base case (ITC) and that of the FTC model for droplet temperature and droplet size. Figure 11a shows that, for the FTC model, as droplets come into contact with the hot bulk flow and heating commences, the surface temperature, , increases rapidly until the boiling point is reached, while takes longer (about twice as long) to reach the boiling point. takes longer to reach the boiling point because of the combined effect of reduced temperature driving force (because is already at boiling) and the evaporation at the surface taking up some of the heat energy into the droplet. It is also shown in Figure 11a that reaches the boiling faster in the ITC model than in the FTC model, because no internal heat transfer resistance is present in the droplet. Subsequently, higher evaporation rates are predicted by the ITC model compared with the FTC model, as shown in Figure 11b. Miller, Harstad, and Bellan [40] showed in their work using experimental data for the evaporation of hexane, water, and decane that the ITC resulted in the overprediction of the vaporisation rate, while the FTC model matched the experimental data well. More recently, simulation experiments by Nguyen, Mitra, Pareek, Joshi, and Evans [39] confirmed the overprediction of the heat transfer and vaporisation from the ITC model for a typical FCC feed. Although, it is important to note that Nguyen, Mitra, Pareek, Joshi, and Evans [39] used the prohibited for the FTC model, but still managed to predict well the experimental results for vaporisation of decane using that assumption. The significance of the vaporisation prediction is that, as discussed in the earlier section, the vaporisation and cracking in the riser initially occur in series, because cracking takes place in the gas phase and feed is injected in the liquid phase. Therefore, slow vaporisation is likely to limit the rate of gas oil cracking in the inlet region of the riser.
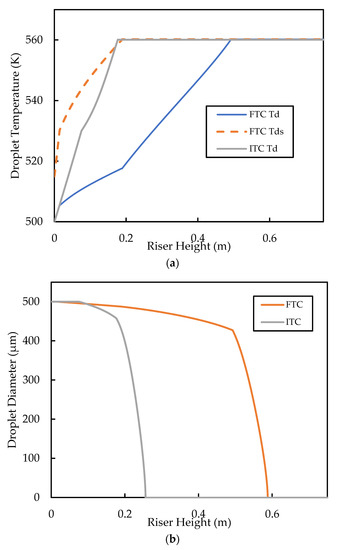
Figure 11.
Comparison of (a) droplet temperature profiles and (b) droplet diameter profiles, predicted by the ITC and FTC thermal conductivity models. The initial droplet diameter is , initial volume averaged droplet diameter is and initial = 15 K for the FTC model. Both the ITC and FTC simulations use the classic vaporisation heat transfer model.
The predicted base case profiles for the gas oil conversion and the gasoline yield are shown in Figure 12. It is shown that the FTC model predicts gas oil conversion and, therefore, a lower gasoline yield compared with the ITC model. The conversion graphs show a similar shape and gradient for most of the riser height; it can be seen that the significant deviations of the conversion profiles are due to differences in the vaporisation region of the riser. This region ( is one of the most important in the riser as most of the cracking occurs here because of the high temperature and high catalyst activity. In this region, the ITC model predicts higher rates of cracking. This is because of the discussed overprediction of the vaporisation rate in this region. Meanwhile, in the FTC model, the slow vaporisation limits the cracking reactions. The gaseous concentration of gas oil feed in the vaporisation region is shown in Figure 13. It can be seen that the FTC model predicts initial vaporisation to occur before that of the ITC model. However, initialisation of vaporisation occurs at higher rates in the ITC model, resulting in higher concentrations of gas oil. Equations (11)–(13) show that cracking is of reaction order with respect to gas oil concentration and, therefore, is highly sensitive to the concentration of gaseous feed, which explains the higher rates of cracking in the ITC model in the vaporisation region. We have also carried out a sensitivity analysis for the Nusselt number correlation using the FTC model, but observed similar trends to that of the analysis performed in Section 3.1. Consequently, we conclude that, regarding the modelling of the riser where gas oil conversion and component yield are the end goal, the Nusselt number correlation is less important compared with the droplet conductivity model. Meanwhile, if the evolution of droplet size and temperature is important, then both aspects of modelling should equally be considered. However, in the absence of detailed measurements of droplet temperature and size experimental data, validation of such vaporisation models remains impossible, as conversion and yield data alone are not enough. To the best knowledge of the authors, no other published work in the FCC literature has studied these phenomena to this level of detail before.
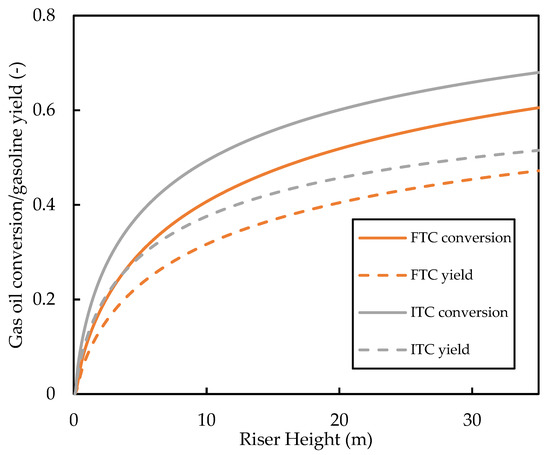
Figure 12.
Comparison of the gas oil conversion and gasoline yield profiles predicted by the ITC and FTC models.
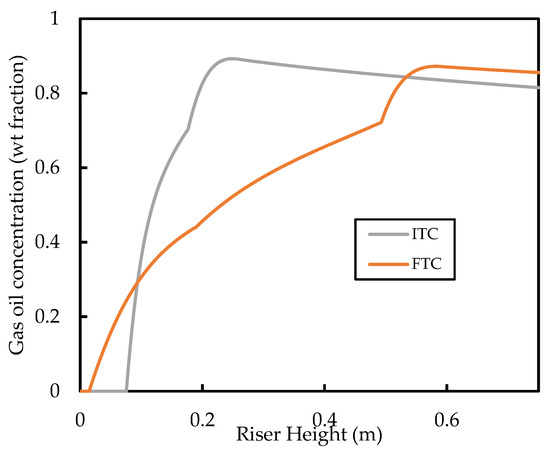
Figure 13.
Comparison of predicted weight fraction of the gas oil lump in the gas phase in the vaporisation region of the riser.
4. Conclusions
This paper presents a steady-state one-dimensional model of the FCC riser that accounts for the vaporisation of the feed, the hydrodynamics of the resulting three-phase flow, and the cracking reactions occurring in the reaction mixture. The model was coded as a system of ordinary differential and algebraic equations in the MATLAB environment and solved using built-in stiff solvers. Two main conclusions were drawn from this work:
- The vaporisation phenomena and its underlying kinetics are largely less important to the predictions of gas oil conversion and the yield of the product species compared with the cracking kinetics. It is found that both homogeneous and heterogeneous vaporisation heat and mass transfer models predict near identical conversion and gasoline yield profiles, despite predicting significantly different liquid penetration depths. This finding gives validity to the assumption of instantaneous vaporisation that is widely used in the FCC riser modelling literature. Additionally, this observation indicated that, for most operating conditions, the rates of vaporisation predicted by various heat and mass transfer models were faster than the rates of cracking, for the case of the ITC modelling framework. However, when larger droplets are used (), the effect of heat transfer correlations becomes significant. In this case, homogeneous models predict slower vaporisation rates, which limit the progress of cracking, thus resulting in lower conversion. This effect is less significant for heterogeneous vaporisation models as the enhanced heat transfer due to solid–droplet collisions compensates for the reduced interfacial area density from larger droplets. Therefore, for larger droplets, careful consideration is required for the choice of correlation. On the other hand, the FTC model predicts slower vaporisation and thus lower conversion compared with the ITC model. Owing to the lack of experimental data for vaporisation dynamics in the FCC riser, the choice of model becomes difficult in these cases, as validation of the results is not possible. The results in this work suggest that, when the ITC model is used for droplets with initial size smaller than , the choice of the heat transfer model (i.e., homogeneous or heterogeneous) is not important as the conversion and yield are determined by the choice of reaction kinetic model. However, when the FTC model is used, the heat transfer model is as important as the kinetic model in the prediction of conversion and yield. Hence, it is recommended that the FTC is paired with heterogeneous heat transfer models for better prediction of conversion.
- One-dimensional models for the two-phase gas–solid flow in the fully developed region of the riser tend to overestimate the drag force when the drag is calculated using catalyst particle properties, resulting in the underestimation of the slip factor and thus slip velocity between the gas and solid. Such models predict slip factors of , corresponding to pseudo-homogeneous flow. Evidence from most cold flow pilot scale risers indicates that cluster formations are inherent in FCC risers and are generally understood to result in larger slip factors in the range of . Therefore, 1D models with such determination of drag are unable to predict evidence of this heterogeneity. In view of this, the calculation of drag using cluster properties is imperative for the prediction of the correct slip factors in 1D FCC riser models.
- Future work will focus on studies on vaporisation to provide an implementation for the validation of vaporisation models for larger droplets. Moreover, numerical studies of gas–solid flow using 1D, 2D, and 3D frameworks will be carried out to study the apparent underestimation of the slip factor in the fully developed region of the riser under lower dimensional models. The experimental determination of such slip factors in industrial risers during normal operation will also be an invaluable contribution to the subject.
Author Contributions
Conceptualization, T.W.S.; methodology, T.W.S.; software, T.W.S.; validation, T.W.S. and Y.M.J.; formal analysis, T.W.S.; investigation, T.W.S.; resources, Y.M.J., R.P., and I.M.M.; data curation, T.W.S.; writing—original draft preparation, T.W.S.; writing—review and editing, T.W.S., Y.M.J., R.P., and I.M.M.; visualization, T.W.S.; supervision, Y.M.J., R.P., and I.M.M.; project administration, Y.M.J.; funding acquisition, T.W.S. All authors have read and agreed to the published version of the manuscript.
Funding
This research was funded by the Government of Botswana.
Data Availability Statement
Not applicable.
Acknowledgments
Thabang Wendel Selalame would like to thank the Government of Botswana for funding his PhD studies.
Conflicts of Interest
The authors declare no conflict of interest.
Appendix A
Table A1.
Properties of the inlet streams to the riser.
Table A1.
Properties of the inlet streams to the riser.
| Phase | Stream | Mass Rate kg s−1 | Diameter | Volume Fraction | Temp (K) |
|---|---|---|---|---|---|
| Solid | Catalyst | 300 | 72 | 0.08 | 960 |
| Gas | Steam | 6 | 0.91 | 650 | |
| Liquid | Feed (GO) | 60 | 500 | 0.01 | 500 |
Table A2.
Constant value physical properties.
Table A2.
Constant value physical properties.
| Phase | Species | Molar Mass kg kmol−1 | Heat Capacity kJ kg−1 K−1 |
|---|---|---|---|
| Solid | Catalyst | 1.0 | |
| Solid | CK | 371 | 1.0 |
| Gas | GO | 371 | |
| GL | 106 | ||
| LG | 40 | ||
| WV | 18 | ||
| Liquid | GO | 371 |
Table A3.
Correlations used for the calculation of physical properties that are temperature or concentration dependent.
Table A3.
Correlations used for the calculation of physical properties that are temperature or concentration dependent.
| Physical Property | Symbol | Reference |
|---|---|---|
| Gas oil heat of vaporisation | Han and Chung [4] | |
| Gas thermal conductivity | Han and Chung [4] | |
| Liquid thermal conductivity | Pachaiyappan, et al. [68] | |
| Gas heat capacity | Lee and Kesler [69] | |
| McKetta Jr [70] | ||
| Liquid heat capacity | Lee and Kesler [69] | |
| Gas viscosity | Han and Chung [4] | |
| Gas diffusivity | Fuller, et al. [71] | |
| Feed critical conditions | Riazi and Al-Sahhaf [72] | |
| Acentric factor | Riazi and Al-Sahhaf [72] |
Appendix B. Notation
| Symbol | Description | Unit |
|---|---|---|
| A | Surface area | m2 |
| CD | Drag coefficient | (-) |
| Cg | Gas molar density | kmol/m3 |
| Cg,i | Species concentration in the gas phase | kmol/m3 |
| cp | Specific heat capacity | kJ/kgK |
| Cs,i | Species concentration at the gas–droplet interphase | kmol/m3 |
| dd | Droplet diameter | m |
| Deff | Effective diffusivity in the gas phase | m2/s |
| dp | Catalyst particle diameter | m |
| Eors | Activation energy | kJ/kmol |
| f | Friction factor | (-) |
| g | Gravitational acceleration | m/s2 |
| h | Heat transfer coefficient | kJ/m2 K |
| k | Thermal diffusivity | kJ/mK |
| kc | Mass transfer coefficient | m/s |
| krs | Rate constant | m6/kgkgcats or m3/kgcats |
| Kors | Frequency factor for rate constant | m6/kgkgcats or m3/kgcats |
| Lv | Heat of vaporisation | kJ/kg |
| md | Droplet mass | kg |
| Mw,i | Species molar mass | kg/kmol |
| Vaporisation rate | kg/s | |
| N | Number density | /m2 |
| Nu | Nusselt number | (-) |
| Nvap | Vaporisation flux at droplet surface | kmol/m2s |
| P | Pressure | kPa |
| Pr | Prandtl number | (-) |
| Psat | Saturation pressure | kPa |
| Qreact | Heat of cracking reactions | kJ/kgcat |
| r | Reaction rate | kg/kgcats |
| R | Ideal gas constant | kJ/K kmol |
| Re | Reynolds number | (-) |
| Rg,i | Species reaction rate | kg/m3s |
| Sc | Schmidt number | (-) |
| Sh | Sherwood number | (-) |
| T | Phase temperature | K |
| v | Velocity | m/s |
References
- Buchanan, J.S. Analysis of Heating and Vaporization of Feed Droplets in Fluidized Catalytic Cracking Risers. Ind. Eng. Chem. Res. 1994, 33, 3104–3111. [Google Scholar] [CrossRef]
- Nayak, S.V.; Joshi, S.L.; Ranade, V.V. Modeling of vaporization and cracking of liquid oil injected in a gas–solid riser. Chem. Eng. Sci. 2005, 60, 6049–6066. [Google Scholar] [CrossRef]
- Güleç, F.; Meredith, W.; Snape, C.E. Progress in the CO2 Capture Technologies for Fluid Catalytic Cracking (FCC) Units—A Review. Front. Energy Res. 2020, 8, 62. [Google Scholar] [CrossRef]
- Han, I.-S.; Chung, C.-B. Dynamic modeling and simulation of a fluidized catalytic cracking process. Part II: Property estimation and simulation. Chem. Eng. Sci. 2001, 56, 1973–1990. [Google Scholar] [CrossRef]
- Selalame, T.W.; Patel, R.; Mujtaba, I.M.; John, Y.M. A Review of Modelling of the FCC Unit—Part I: The Riser. Energies 2022, 15, 308. [Google Scholar] [CrossRef]
- Corma, A.; Orchillés, A. Current views on the mechanism of catalytic cracking. Microporous Mesoporous Mater. 2000, 35, 21–30. [Google Scholar] [CrossRef]
- Joly, J.F.; de Oliveira, L.P.; Hudebine, D.; Guillaume, D.; Verstraete, J.J. A Review of Kinetic Modeling Methodologies for Complex Processes. Oil Gas Sci. Technol. 2016, 71, 45. [Google Scholar]
- Weekman, V.W., Jr.; Nace, D.M. Kinetics of catalytic cracking selectivity in fixed, moving, and fluid bed reactors. AIChE J. 1970, 16, 397–404. [Google Scholar] [CrossRef]
- Ancheytajuarez, J.; Lopezisunza, F.; Aguilarrodriguez, E. A Strategy for Kinetic Parameter Estimation in the Fluid Catalytic Cracking Process. Ind. Eng. Chem. Res. 1997, 36, 5170–5174. [Google Scholar] [CrossRef]
- Ancheyta-Juárez, J.; López-Isunza, F.; Aguilar-Rodrıguez, E. 5-Lump kinetic model for gas oil catalytic cracking. Appl. Catal. A Gen. 1999, 177, 227–235. [Google Scholar] [CrossRef]
- Ancheyta-Juárez, J.; Sotelo-Boyás, R. Estimation of Kinetic Constants of a Five-Lump Model for Fluid Catalytic Cracking Process Using Simpler Sub-models. Energy Fuels 2000, 14, 1226–1231. [Google Scholar] [CrossRef]
- Bollas, G.M.; Lappas, A.A.; Iatridis, D.K.; Vasalos, I.A. Five-lump kinetic model with selective catalyst deactivation for the prediction of the product selectivity in the fluid catalytic cracking process. Catal. Today 2007, 127, 31–43. [Google Scholar] [CrossRef]
- Chen, C.; Yang, B.; Yuan, J.; Wang, Z.; Wang, L. Establishment and solution of eight-lump kinetic model for FCC gasoline secondary reaction using particle swarm optimization. Fuel 2007, 86, 2325–2332. [Google Scholar] [CrossRef]
- Chen, Y.; Wang, W.; Wang, Z.; Hou, K.; Ouyang, F.; Li, D. A 12-lump kinetic model for heavy oil fluid catalytic cracking for cleaning gasoline and enhancing light olefins yield. Pet. Sci. Technol. 2020, 38, 912–921. [Google Scholar] [CrossRef]
- Gao, H.; Wang, G.; Xu, C.; Gao, J. Eight-Lump Kinetic Modeling of Vacuum Residue Catalytic Cracking in an Independent Fluid Bed Reactor. Energy Fuels 2014, 28, 6554–6562. [Google Scholar] [CrossRef]
- John, Y.M.; Mustafa, M.A.; Patel, R.; Mujtaba, I.M. Parameter estimation of a six-lump kinetic model of an industrial fluid catalytic cracking unit. Fuel 2019, 235, 1436–1454. [Google Scholar] [CrossRef]
- Jacob, S.M.; Gross, B.; Voltz, S.E.; Weekman, V.W., Jr. A lumping and reaction scheme for catalytic cracking. AIChE J. 1976, 22, 701–713. [Google Scholar] [CrossRef]
- Shah, M.T.; Utikar, R.P.; Pareek, V.K.; Evans, G.M.; Joshi, J.B. Computational fluid dynamic modelling of FCC riser: A review. Chem. Eng. Res. Des. 2016, 111, 403–448. [Google Scholar] [CrossRef]
- Feng, W.; Vynckier, E.; Froment, G.F. Single event kinetics of catalytic cracking. Ind. Eng. Chem. Res. 1993, 32, 2997–3005. [Google Scholar] [CrossRef]
- Dewachtere, N.V.; Santaella, F.; Froment, G.F. Application of a single-event kinetic model in the simulation of an industrial riser reactor for the catalytic cracking of vacuum gas oil. Chem. Eng. Sci. 1999, 54, 3653–3660. [Google Scholar] [CrossRef]
- Froment, G.F. Single Event Kinetic Modeling of Complex Catalytic Processes. Catal. Rev. Sci. Eng. 2005, 47, 83–124. [Google Scholar] [CrossRef]
- Quintana-Solórzano, R.; Thybaut, J.W.; Marin, G.B.; Lødeng, R.; Holmen, A. Single-Event MicroKinetics for coke formation in catalytic cracking. Catal. Today 2005, 107, 619–629. [Google Scholar] [CrossRef]
- Sundberg, J.; Standl, S.; von Aretin, T.; Tonigold, M.; Rehfeldt, S.; Hinrichsen, O.; Klein, H. Optimal process for catalytic cracking of higher olefins on ZSM-5. Chem. Eng. J. 2018, 348, 84–94. [Google Scholar] [CrossRef]
- Standl, S.; Tonigold, M.; Hinrichsen, O. Single-Event Kinetic Modeling of Olefin Cracking on ZSM-5: Proof of Feed Independence. Ind. Eng. Chem. Res. 2017, 56, 13096–13108. [Google Scholar] [CrossRef]
- Louge, M.; Chang, H. Pressure and voidage gradients in vertical gas-solid risers. Powder Technol. 1990, 60, 197–201. [Google Scholar] [CrossRef]
- Rhodes, M.J.; Geldart, D. A model for the circulating fluidized bed. Powder Technol. 1987, 53, 155–162. [Google Scholar] [CrossRef]
- Miller, A.; Gidaspow, D. Dense, vertical gas-solid flow in a pipe. AIChE J. 1992, 38, 1801–1815. [Google Scholar] [CrossRef]
- Bhusarapu, S.; Al-Dahhan, M.H.; Duduković, M.P.; Trujillo, S.; O’Hern, T.J. Experimental Study of the Solids Velocity Field in Gas−Solid Risers. Ind. Eng. Chem. Res. 2005, 44, 9739–9749. [Google Scholar] [CrossRef]
- Bhusarapu, S.; Al-Dahhan, M.H.; Duduković, M.P. Solids flow mapping in a gas–solid riser: Mean holdup and velocity fields. Powder Technol. 2006, 163, 98–123. [Google Scholar] [CrossRef]
- Horio, M.; Kuroki, H. Three-dimensional flow visualization of dilutely dispersed solids in bubbling and circulating fluidized beds. Chem. Eng. Sci. 1994, 49, 2413–2421. [Google Scholar] [CrossRef]
- Harris, B.J.; Davidson, J.F. Modeling options for circulating fluidized beds: A core/annulus deposition model. In Circulating Fluidized Bed Technology IV; Avidan, A.A., Ed.; American Institute of Chemical Engineers (AIChE): New York, NY, USA, 1994; pp. 32–39. [Google Scholar]
- Berruti, F.; Pugsley, T.S.; Godfroy, L.; Chaouki, J.; Patience, G.S. Hydrodynamics of circulating fluidized bed risers: A review. Can. J. Chem. Eng. 1995, 73, 579–602. [Google Scholar] [CrossRef]
- Han, I.-S.; Chung, C.-B. Dynamic modeling and simulation of a fluidized catalytic cracking process. Part I: Process modeling. Chem. Eng. Sci. 2001, 56, 1951–1971. [Google Scholar] [CrossRef]
- Ahari, J.S.; Farshi, A.; Forsat, K. A mathematical modeling of the riser reactor in industrial FCC unit. Pet. Coal 2008, 50, 15–24. [Google Scholar]
- Heydari, M.; Ebrahim, H.A.; Dabir, B. Modeling of an Industrial Riser in the Fluid Catalytic Cracking Unit. Am. J. Appl. Sci. 2010, 7, 221–226. [Google Scholar] [CrossRef]
- Arya, D.; Gupta, R.K. Simulation Studies on Variable Cluster Size in FCC Riser Reactor. Part. Sci. Technol. 2014, 32, 144–150. [Google Scholar] [CrossRef]
- John, Y.M.; Patel, R.; Mujtaba, I.M. Maximization of propylene in an industrial FCC unit. Appl. Petrochem. Res. 2018, 8, 79–95. [Google Scholar] [CrossRef]
- Ali, H.; Rohani, S.; Corriou, J.P. Modelling and Control of a Riser Type Fluid Catalytic Cracking (FCC) Unit. Chem. Eng. Res. Des. 1997, 75, 401–412. [Google Scholar] [CrossRef]
- Nguyen, T.T.B.; Mitra, S.; Pareek, V.; Joshi, J.B.; Evans, G. Comparison of vaporization models for feed droplet in fluid catalytic cracking risers. Chem. Eng. Res. Des. 2015, 101, 82–97. [Google Scholar] [CrossRef]
- Miller, R.S.; Harstad, K.; Bellan, J. Evaluation of equilibrium and non-equilibrium evaporation models for many-droplet gas-liquid flow simulations. Int. J. Multiph. Flow 1998, 24, 1025–1055. [Google Scholar] [CrossRef]
- Finneran, J. On the evaluation of transport properties for droplet evaporation problems. Int. J. Heat Mass Transf. 2021, 181, 121858. [Google Scholar] [CrossRef]
- Finneran, J.; Garner, C.P.; Nadal, F. Deviations from classical droplet evaporation theory. Proc. R. Soc. A 2021, 477, 20210078. [Google Scholar] [CrossRef] [PubMed]
- Lupo, G. Detailed Simulations of Droplet Evaporation; KTH Royal Institute of Technology: Stockholm, Sweden, 2017. [Google Scholar]
- Bellan, J.; Harstad, K. Analysis of the convective evaporation of nondilute clusters of drops. Int. J. Heat Mass Transf. 1987, 30, 125–136. [Google Scholar] [CrossRef]
- Ranz, W.E. Evaporation from drops, Parts I & II. Chem. Eng. Prog. 1952, 48, 141–146. [Google Scholar]
- Faeth, G. Current status of droplet and liquid combustion. In Energy and Combustion Science; Elsevier: Amsterdam, The Netherlands, 1979; pp. 149–182. [Google Scholar]
- Sazhin, S.S. Advanced models of fuel droplet heating and evaporation. Prog. Energy Combust. Sci. 2006, 32, 162–214. [Google Scholar] [CrossRef]
- Abramzon, B.; Sirignano, W.A. Droplet vaporization model for spray combustion calculations. Int. J. Heat Mass Transf. 1989, 32, 1605–1618. [Google Scholar] [CrossRef]
- Fernandes, J.L.; Verstraete, J.J.; Pinheiro, C.I.C.; Oliveira, N.M.C.; Ribeiro, F.R. Dynamic modelling of an industrial R2R FCC unit. Chem. Eng. Sci. 2007, 62, 1184–1198. [Google Scholar] [CrossRef]
- Tsuo, Y.P.; Gidaspow, D. Computation of flow patterns in circulating fluidized beds. AIChE J. 1990, 36, 885–896. [Google Scholar] [CrossRef]
- Arastoopour, H.; Gidaspow, D. Vertical Pneumatic Conveying Using Four Hydrodynamic Models. Ind. Eng. Chem. Fundam. 1979, 18, 123–130. [Google Scholar] [CrossRef]
- Selalame, T.W.; Patel, R.; Mujtaba, I.M.; John, Y.M. A Review of Modelling of the FCC Unit—Part II: The Regenerator. Energies 2022, 15, 388. [Google Scholar] [CrossRef]
- Fernandes, J.L.; Pinheiro, C.I.C.; Oliveira, N.; Ribeiro, F.R. Modeling and simulation of an operating industrial fluidized catalytic cracking (FCC) riser. In Proceedings of the 2nd Mercosur Congress on chemical Engineering, 4th Mercosur Congress on Process Systems Engineering, Costa Verde, Brazil, 14–18 August 2005; pp. 1–4. [Google Scholar]
- Gupta, R.K.; Kumar, V.; Srivastava, V.K. A new generic approach for the modeling of fluid catalytic cracking (FCC) riser reactor. Chem. Eng. Sci. 2007, 62, 4510–4528. [Google Scholar] [CrossRef]
- Pitault, I.; Forissier, M.; Bernard, J.-R. Détermination de constantes cinétiques du craquage catalytique par la modélisation du test de microactivité (MAT). Can. J. Chem. Eng. 1995, 73, 498–504. [Google Scholar] [CrossRef]
- Shampine, L.F.; Reichelt, M.W. The matlab ode suite. SIAM J. Sci. Comput. 1997, 18, 1–22. [Google Scholar] [CrossRef]
- Derouin, C.; Nevicato, D.; Forissier, M.; Wild, G.; Bernard, J.-R. Hydrodynamics of Riser Units and Their Impact on FCC Operation. Ind. Eng. Chem. Res. 1997, 36, 4504–4515. [Google Scholar] [CrossRef]
- Paraskos, J.A.; Shah, Y.T.; McKinney, J.D.; Carr, N.L. A Kinematic Model for Catalytic Cracking in a Transfer Line Reactor. Ind. Eng. Chem. Process Des. Dev. 1976, 15, 165–169. [Google Scholar] [CrossRef]
- Blasetti, A.; de Lasa, H. FCC Riser Unit Operated in the Heat-Transfer Mode: Kinetic Modeling. Ind. Eng. Chem. Res. 1997, 36, 3223–3229. [Google Scholar] [CrossRef]
- Ahmadi Motlagh, A.H.; Grace, J.R.; Briens, C.; Berruti, F.; Farkhondehkavaki, M.; Hamidi, M. Experimental analysis of volatile liquid injection into a fluidized bed. Particuology 2017, 34, 39–47. [Google Scholar] [CrossRef]
- Leclère, K.; Briens, C.; Gauthier, T.; Bayle, J.; Guigon, P.; Bergougnou, M. Experimental measurement of droplet vaporization kinetics in a fluidized bed. Chem. Eng. Process. 2004, 43, 693–699. [Google Scholar] [CrossRef]
- Theologos, K.N.; Nikou, I.D.; Lygeros, A.I.; Markatos, N.C. Simulation and design of fluid catalytic-cracking riser-type reactors. AIChE J. 1997, 43, 486–494. [Google Scholar] [CrossRef]
- Wu, C.; Cheng, Y.; Jin, Y. Understanding Riser and Downer Based Fluid Catalytic Cracking Processes by a Comprehensive Two-Dimensional Reactor Model. Ind. Eng. Chem. Res. 2009, 48, 12–26. [Google Scholar] [CrossRef]
- Patience, G.S.; Chaouki, J.; Berruti, F.; Wong, R. Scaling considerations for circulating fluidized bed risers. Powder Technol. 1992, 72, 31–37. [Google Scholar] [CrossRef]
- Monazam, E.R.; Shadle, L.J. Analysis of the Acceleration Region in a Circulating Fluidized Bed Riser Operating above Fast Fluidization Velocities. Ind. Eng. Chem. Res. 2008, 47, 8423–8429. [Google Scholar] [CrossRef]
- Matsen, J.M. Some characteristics of large solids circulation systems. Fluid. Technol. 1976, 2, 135–149. [Google Scholar]
- Das, A.K.; Baudrez, E.; Marin, G.B.; Heynderickx, G.J. Three-Dimensional Simulation of a Fluid Catalytic Cracking Riser Reactor. Ind. Eng. Chem. Res. 2003, 42, 2602–2617. [Google Scholar] [CrossRef]
- Pachaiyappan, V.; Ibrahim, S.; Kuloor, N. Simple correlation for determining viscosity of organic liquids. Chem. Eng. 1967, 74, 193–196. [Google Scholar]
- Lee, B.; Kesler, M. Isobaric teat capacity of petroleum fraction liquids/vapors. In Technical Data Book-Petroleum Refining; American Petroleum Institute: Tulsa, OK, USA, 1988. [Google Scholar]
- McKetta, J.J., Jr. Encyclopedia of Chemical Processing and Design; CRC Press: Boca Raton, FL, USA, 1997. [Google Scholar]
- Fuller, E.N.; Schettler, P.D.; Giddings, J.C. New method for prediction of binary gas-phase diffusion coefficients. Ind. Eng. Chem. 1966, 58, 18–27. [Google Scholar] [CrossRef]
- Riazi, M.R.; Al-Sahhaf, T.A. Physical properties of heavy petroleum fractions and crude oils. Fluid Phase Equilibria 1996, 117, 217–224. [Google Scholar] [CrossRef]


Disclaimer/Publisher’s Note: The statements, opinions and data contained in all publications are solely those of the individual author(s) and contributor(s) and not of MDPI and/or the editor(s). MDPI and/or the editor(s) disclaim responsibility for any injury to people or property resulting from any ideas, methods, instructions or products referred to in the content. |
© 2023 by the authors. Licensee MDPI, Basel, Switzerland. This article is an open access article distributed under the terms and conditions of the Creative Commons Attribution (CC BY) license (https://creativecommons.org/licenses/by/4.0/).