Communication

Molecular Dynamics Simulation of High Temperature Mechanical Properties of Nano-Polycrystalline Beryllium Oxide and Relevant Experimental Verification

Institute of Nuclear and New Energy Technology, Tsinghua University, Beijing 100084, China
*
Authors to whom correspondence should be addressed.
Energies 2023, 16(13), 4927; https://doi.org/10.3390/en16134927
Submission received: 22 April 2023 / Revised: 12 June 2023 / Accepted: 16 June 2023 / Published: 25 June 2023
(This article belongs to the Special Issue Materials Researches for Advanced Nuclear Energy)

Abstract

:
This article investigated the deformation behavior of nano-polycrystalline beryllium oxide under tensile and compressive stress using the molecular dynamics simulation method. Both the tensile and compressive test results indicate that beryllium oxide breaks mainly along grain boundaries. At low temperature, there is little internal deformation of beryllium oxide grains. When the temperature is above 1473 K, the internal deformation of beryllium oxide grains also occurs, and the phenomenon becomes more obvious with the increase in temperature. This deformation within the grain should be plastic. The flexural strength fracture morphology of beryllium oxide also shows that the fracture mode of beryllium oxide is a brittle fracture at low temperature, while the slip bands appear at 1773 K. This indicates that beryllium oxide, as a ceramic material, can also undergo plastic deformation under high temperature and stress.

1. Introduction

Deep space exploration or the construction of exoplanet bases has become a major trend of space technology development for the future. And relying solely on solar power or isotope thermoelectric conversion cannot provide enough energy. As a result, micro reactors are the preferred alternative energy source. Beryllium oxide (BeO) is mainly used as neutron moderator, neutron reflector and matrix material with dispersed nuclear fuels in nuclear reactors [1,2]. The importance of BeO as a nuclear material is mainly reflected in micro nuclear reactors and has also been tried historically in nuclear propulsion units and space nuclear reactors [1,2]. For example, the KRUSTY reactor developed by NASA is a micro nuclear reactor and it is designed for deep space exploration [1,2], and BeO is utilized in KRUSTY as the neutron reflector and neutron moderator. This is determined by the physical properties of Be. Be atoms will react with neutrons and eventually produce neutron multiplication effect, which has good neutron economy [1,2]. However, BeO is more suitable for use in nuclear reactors because of its lower chemical activity and higher melting point than Be metal.
As a structural ceramic material, its thermal and mechanical properties are very important for engineering applications. The mechanical properties of BeO at different temperatures have been summarized before [2,3]. Both the tensile and compressive strength of BeO decrease with increasing temperature [2]. However, the decreasing rate of tensile strength with temperature is smaller than that of compressive strength with temperature [2]. When the temperature rises above 1000 °C and 1500 °C, the tensile strength and compressive strength will be reduced to less than 20% of the original [2].
Although BeO is a ceramic material with hcp crystal structure, it had been found that the main mechanism of its creep deformation above 1850 °C is the movement of dislocation, and the slip phenomenon at high temperature deformation had also been pointed out [2,4]. However, most of these studies were carried out in the 1960s. Due to the experimental conditions at that time, the plastic deformation behavior of BeO at high temperature is not very clear. Therefore, the tensile and compressive deformation behaviors of nano-polycrystalline BeO at different temperatures were simulated using the molecular dynamics (MD) method. The plastic deformation temperature range of BeO was determined through MD research. Meanwhile, the plastic deformation and slip phenomenon of BeO at high temperature were verified by experimental means.

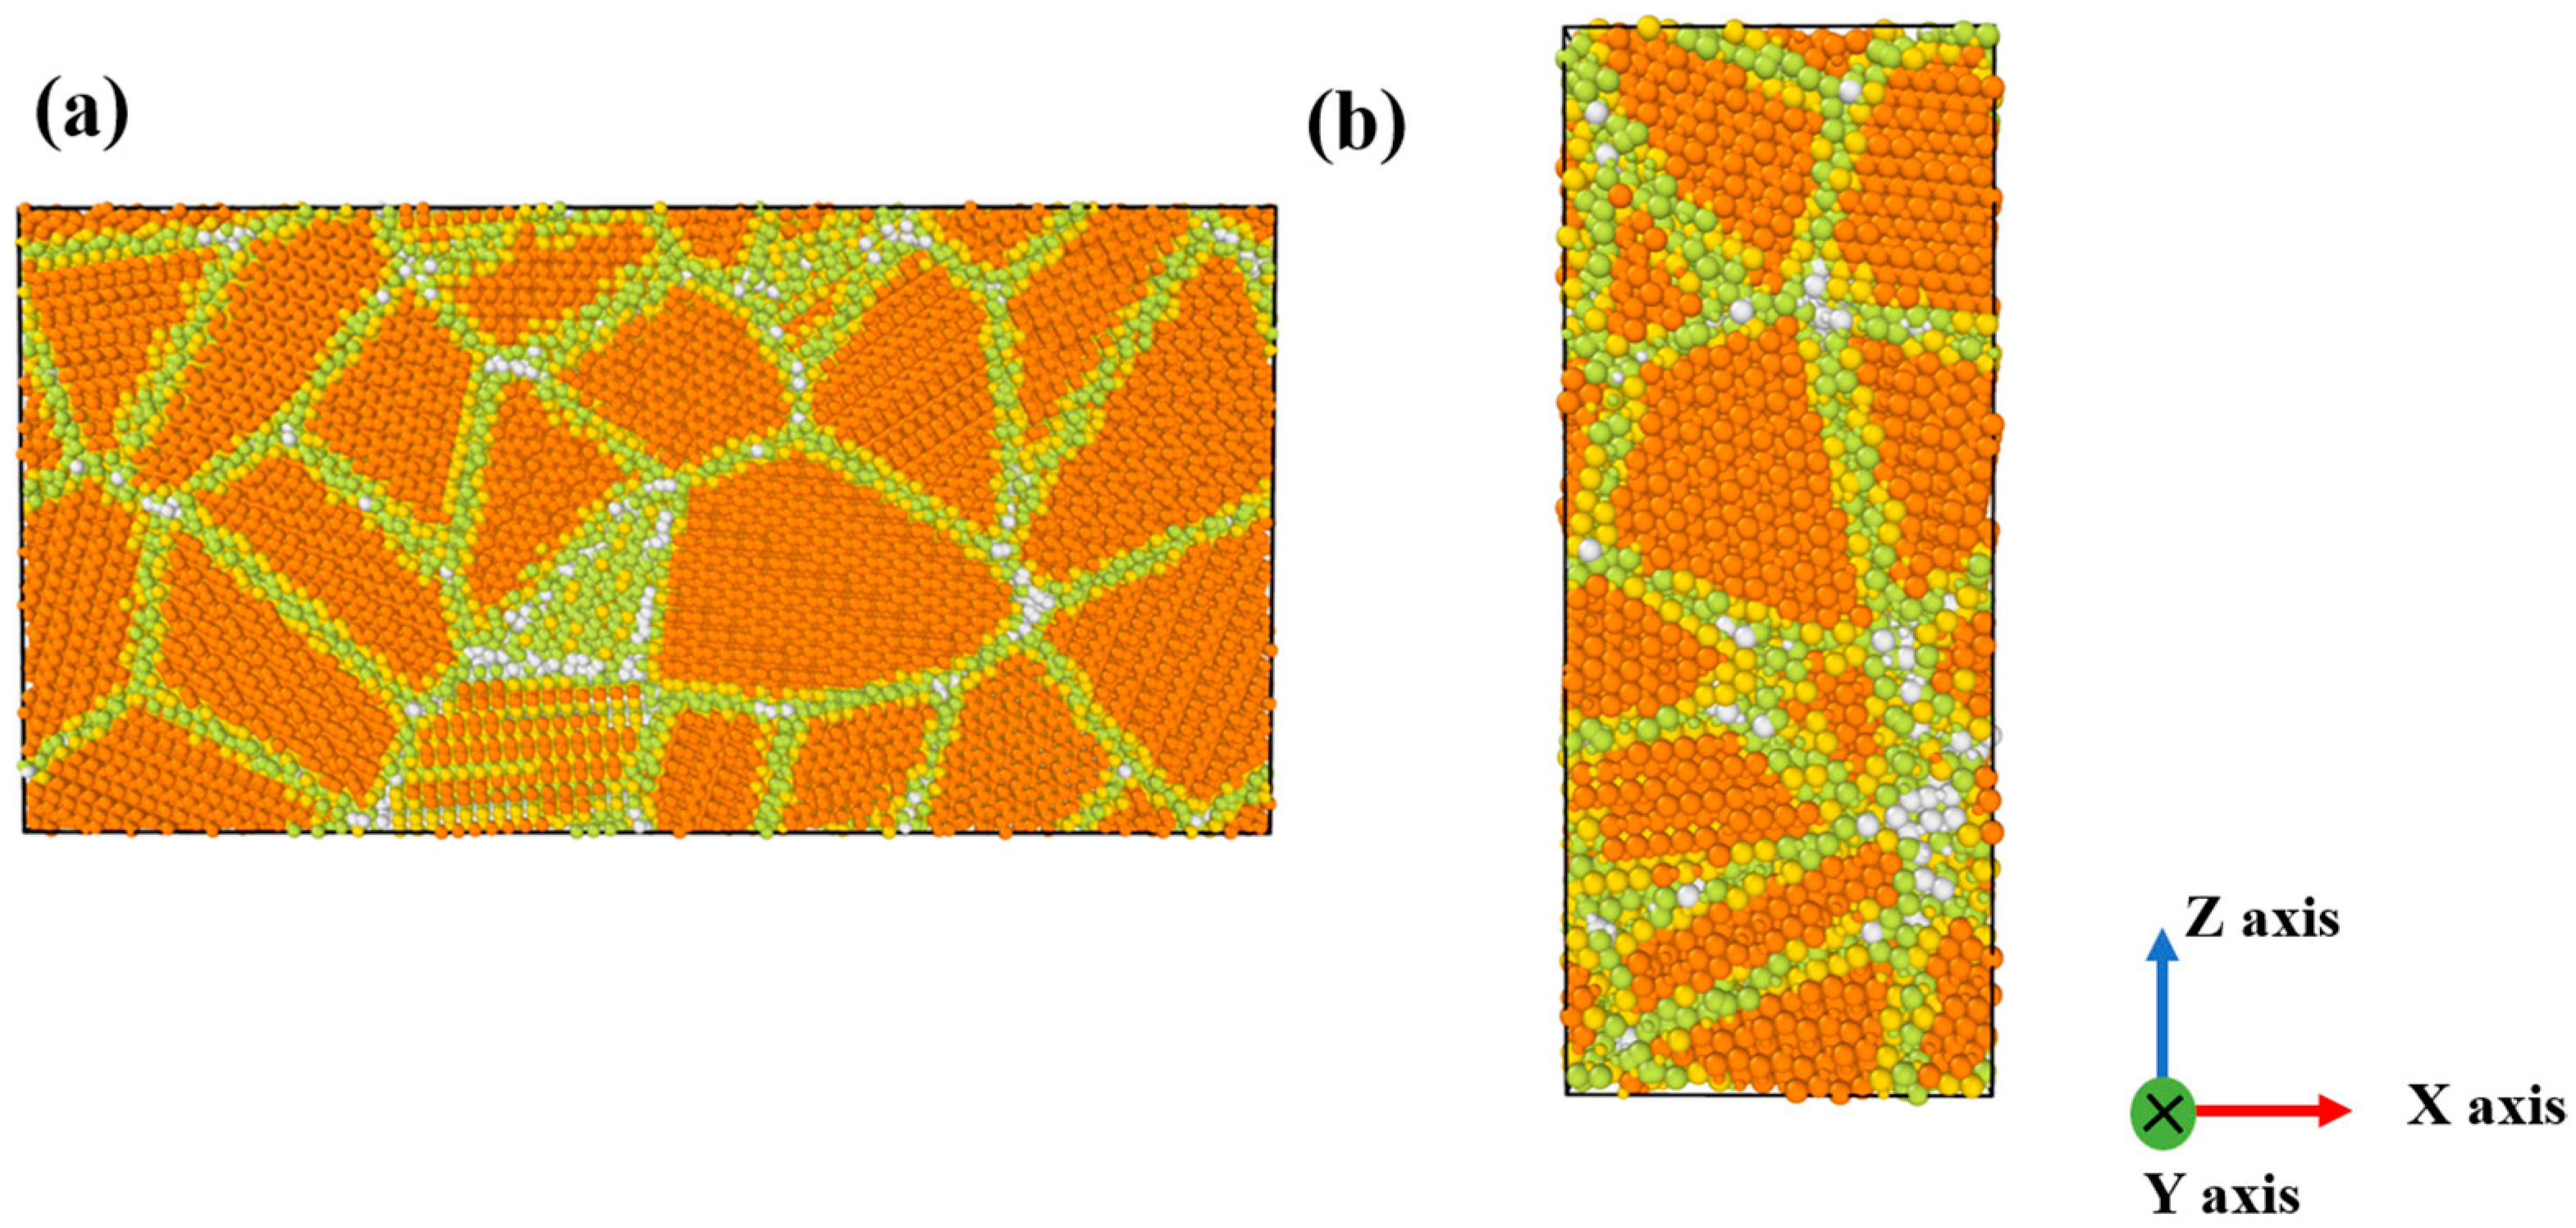
2. Materials and Methods

Figure 1 presents the tensile and compressive test models, which are displayed by OVITO [5]. The MD simulation model parameters are shown in Table 1. The size of the tensile test model is 20 nm × 3 nm × 10 nm with 20 grains. The size of the compressive test model is 5 nm × 5 nm × 12.5 nm with 20 grains. The MD simulations are implemented using the open-source software LAMMPS [6,7]. J. Byggmästar and E. A. Hodille et al. developed the interatomic potential for BeO [8,9,10,11], which is based on the Tersoff potential function [12,13]. The tensile test is performed along the X axis with a deformation rate of 1 nm/ps. In contrast, the compressive test is performed along the Z axis with a deformation rate of 1 nm/ps. All the tensile and compressive tests are simulated at temperatures from 300 K to 2273 K. The volumetric strain results are displayed using OVITO.
In the flexural strength test, both tensile stress and compressive stress exist. Therefore, the high temperature four-point bending experiment of BeO ceramics was selected to verify the high temperature deformation behavior. In the flexural strength test, both tensile stress and compressive stress exist. The sample size of four-point flexural strength, purchased from China Minmetals Corporation, is 45 mm × 4 mm × 3 mm, with a density of 2.98 g/cm3 and an average grain size of 20~40 μm. And the flexural strength test was conducted on the extremely high temperature universal mechanical testing machine (UZDL-50, Sinotest Equipment, China, Production Time was May 2020). The four-point bending device in the high temperature furnace is made of graphite material. The tested environment was a vacuum environment and it provided a vacuum environment of approximately 10−1 Pa when the temperature tested was higher than 1273 K. The holding time in the high temperature section was 15 min, and the total heating and cooling time was about 2~3 h. The procedure of the flexural strength test was performed according to ASTM C1161-18 standard. The typical fracture morphology of BeO at 300 K and 1773 K was observed using a scanning electron microscope (SEM, GeminiSEM 300, ZEISS, Germany, Production Time is 2019).

3. Results and Discussions
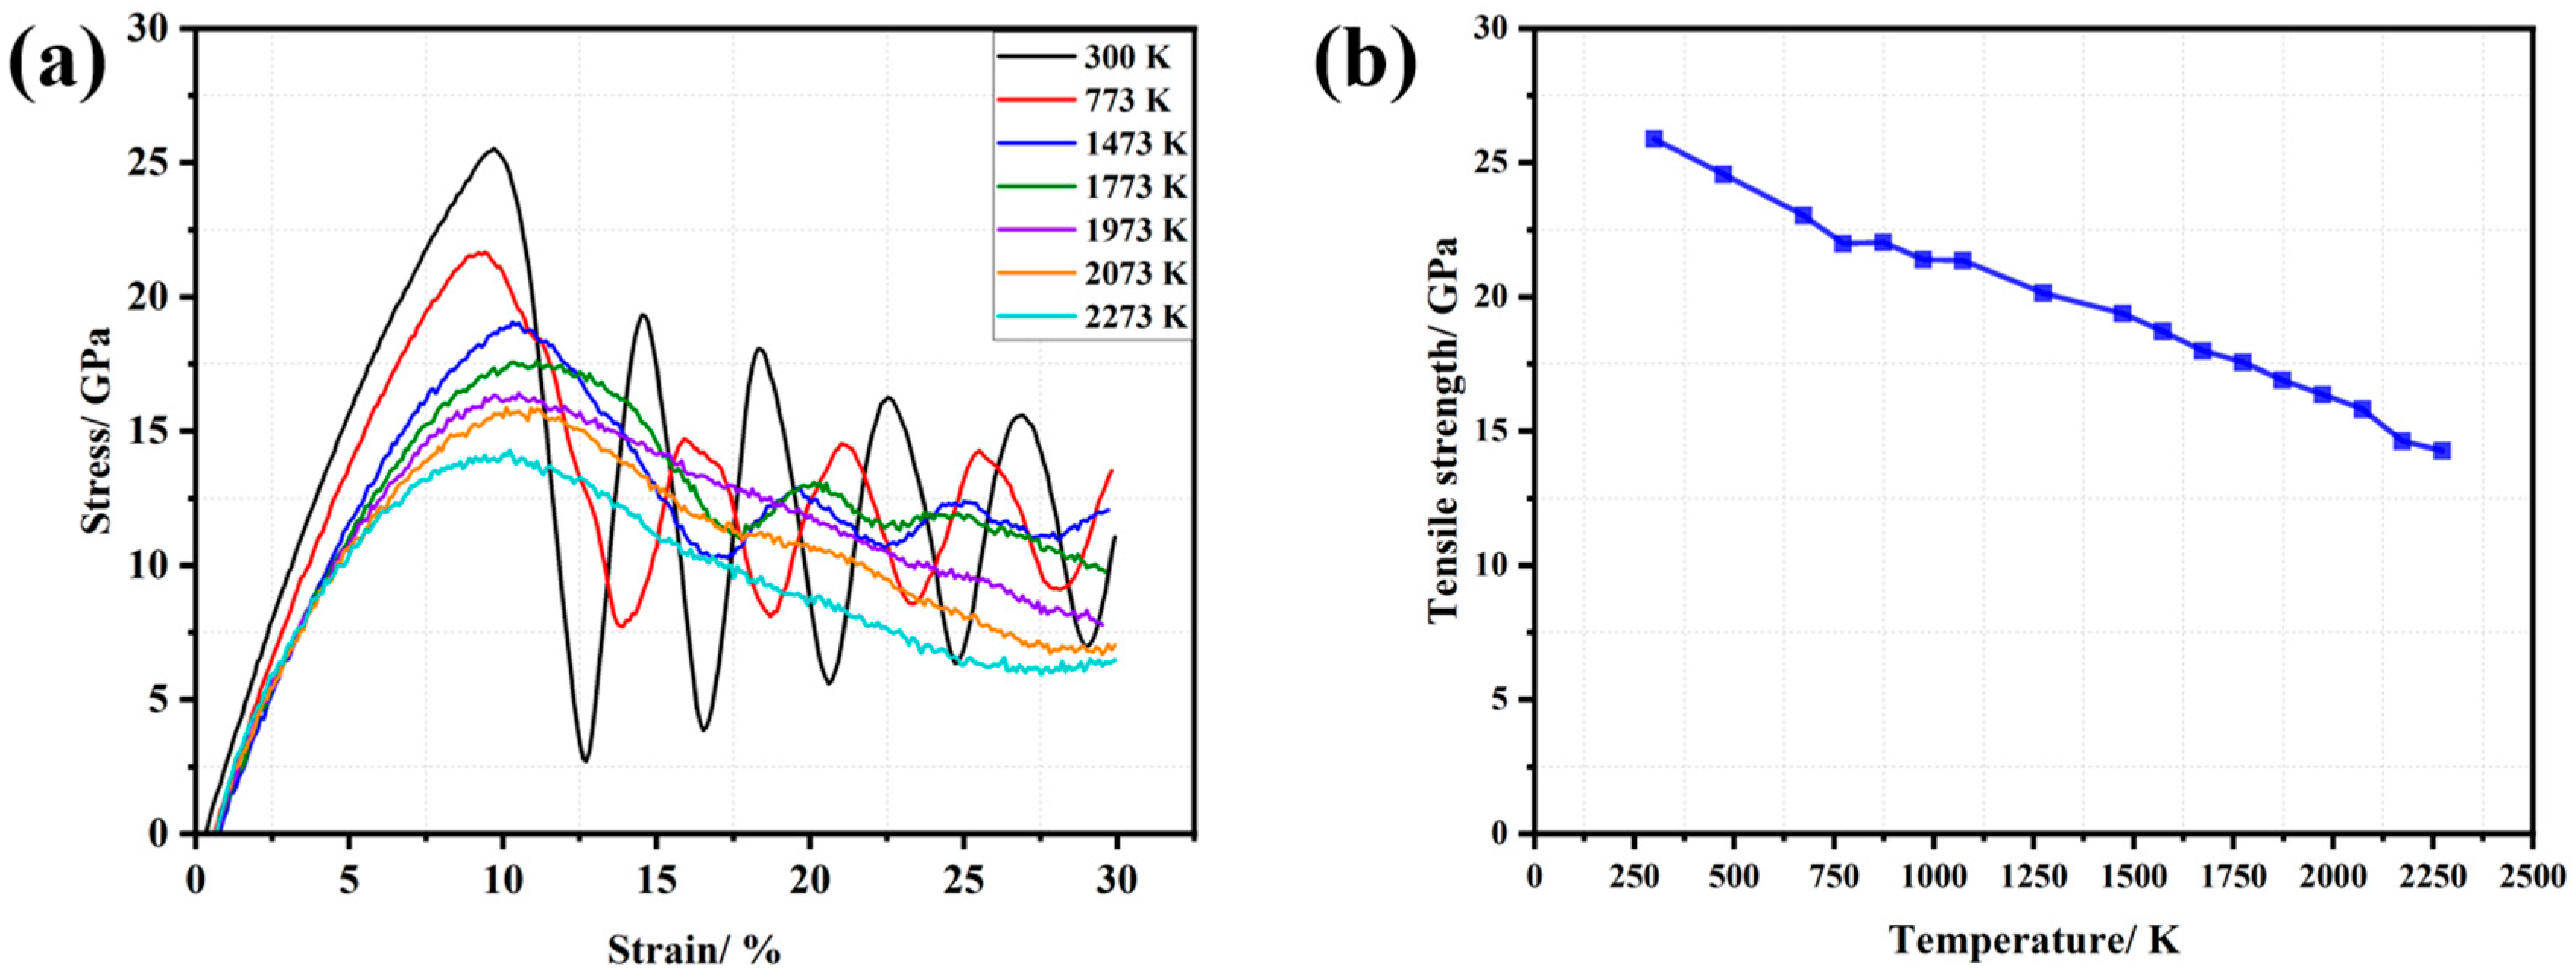
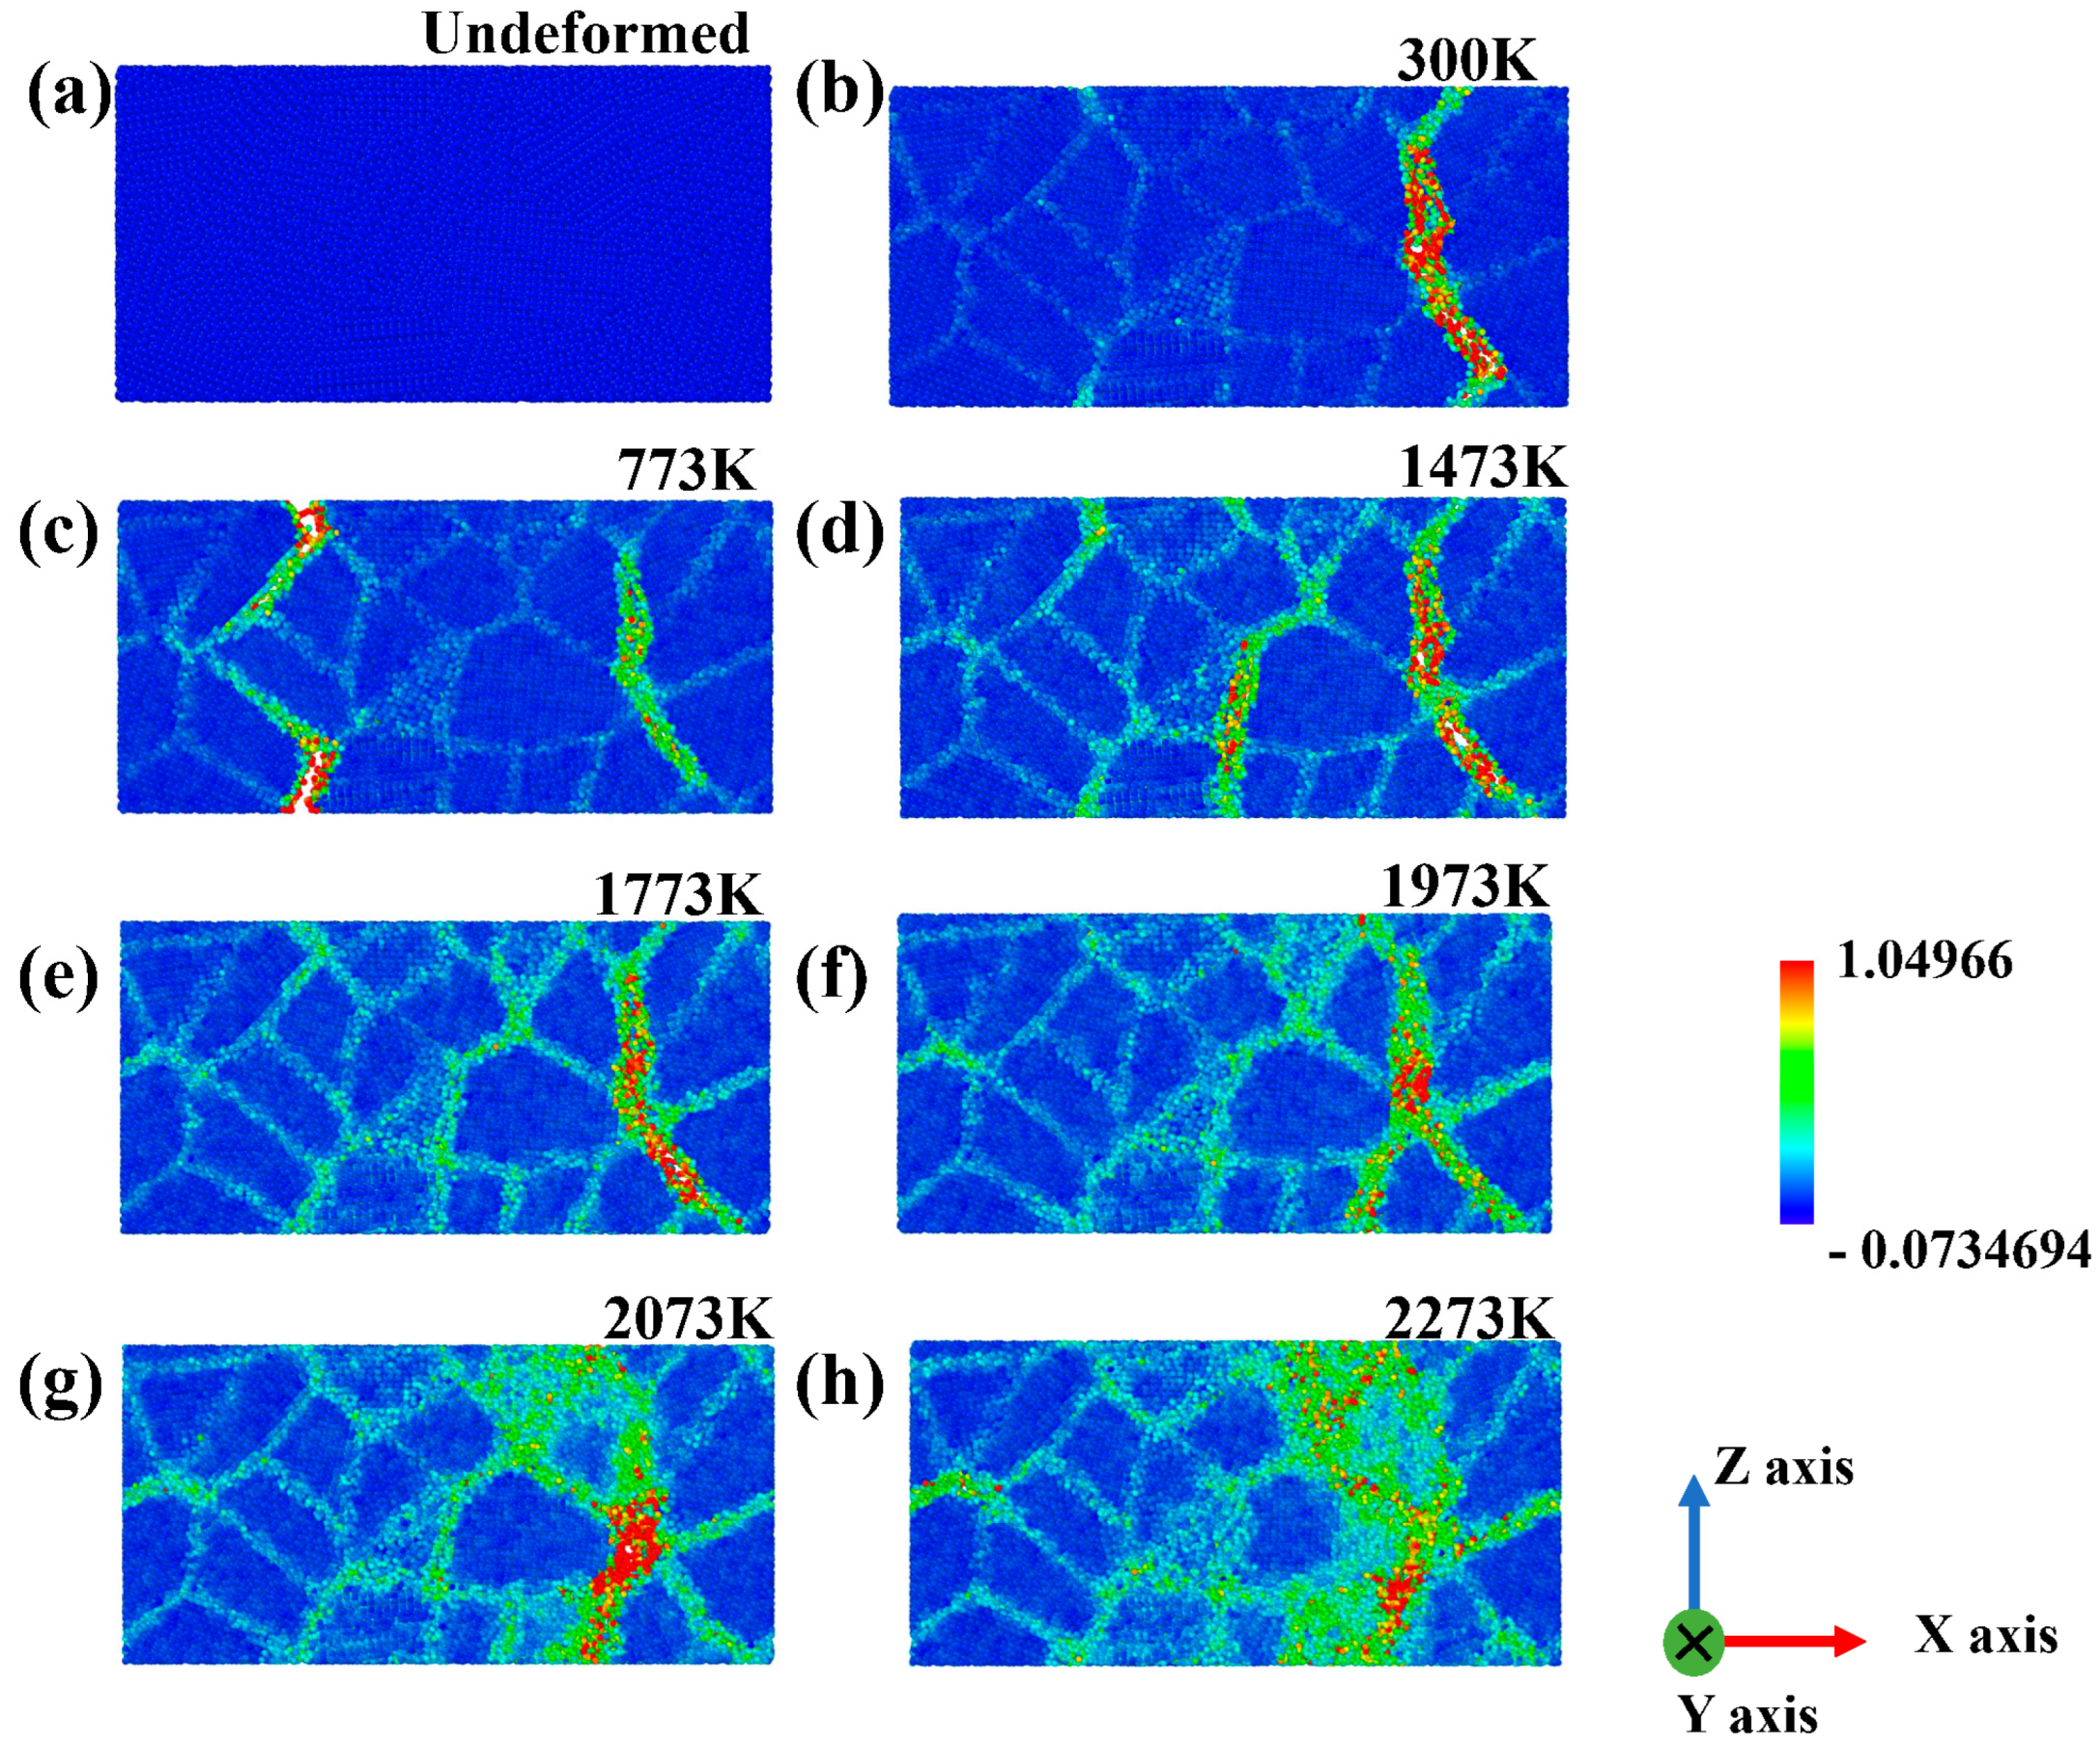
3.1. Tensile Tests

Figure 2a presents the simulated stress–strain curves of the tensile tests at different temperatures. The stress–strain curve below 1773 K presented a form of fluctuation, and the corresponding BeO model broke at the first trough position. In order to preserve the integrity of the data, subsequent data are also shown, which can be ignored in the analysis. The strain value corresponding to brittle fracture was 12.65% at 300 K, while it increased to 13.86%, 17.05% and 17.64% corresponding to 773 K, 1473 K and 1773 K, respectively. With the further increase in temperature, the stress–strain curve reflected the plastic deformation behavior in BeO. Figure 2b displays the tensile strength of BeO at different temperatures. Here, we took the maximum value of the stress–strain curve as the tensile strength value. The tensile strength of BeO decreased linearly as did the function of temperature. The tensile strength decreased from 25.92 GPa at 300 K to 14.33 GPa at 2273 K, which is a decrease of 44.71%.
Figure 3 presents the distribution of the volumetric strain of the deformed BeO under tensile stress at different temperatures. Different colors are used to indicate different degrees of strain. As the color changes from blue to green to red, the strain increases from −0.07346 to 1.04996. When comparing Figure 3a with others, it is visible that the deformation occurs mainly near grain boundaries. At 300 K and 773 K, BeO breaks mainly along grain boundaries, and there is little deformation inside the grain which reflects that the fracture mode is mainly a brittle fracture along grain boundaries, as shown in Figure 3b,c. When the temperature is 1473 K and above, the deformation inside the BeO grain occurs, and as the temperature increases, the deformation inside the grain becomes more obvious. This is reflected in the gradual change of color within the grain to light blue or green, as shown in Figure 3d–h. Although BeO still breaks along the grain boundary at high temperatures, there is significant deformation near the grain boundary compared to low temperatures. All these indicate that the plastic deformation behavior of BeO occurs during the tensile test simulation at temperatures above 1473 K. With the increase in temperature, the plastic deformation behavior becomes more and more obvious.

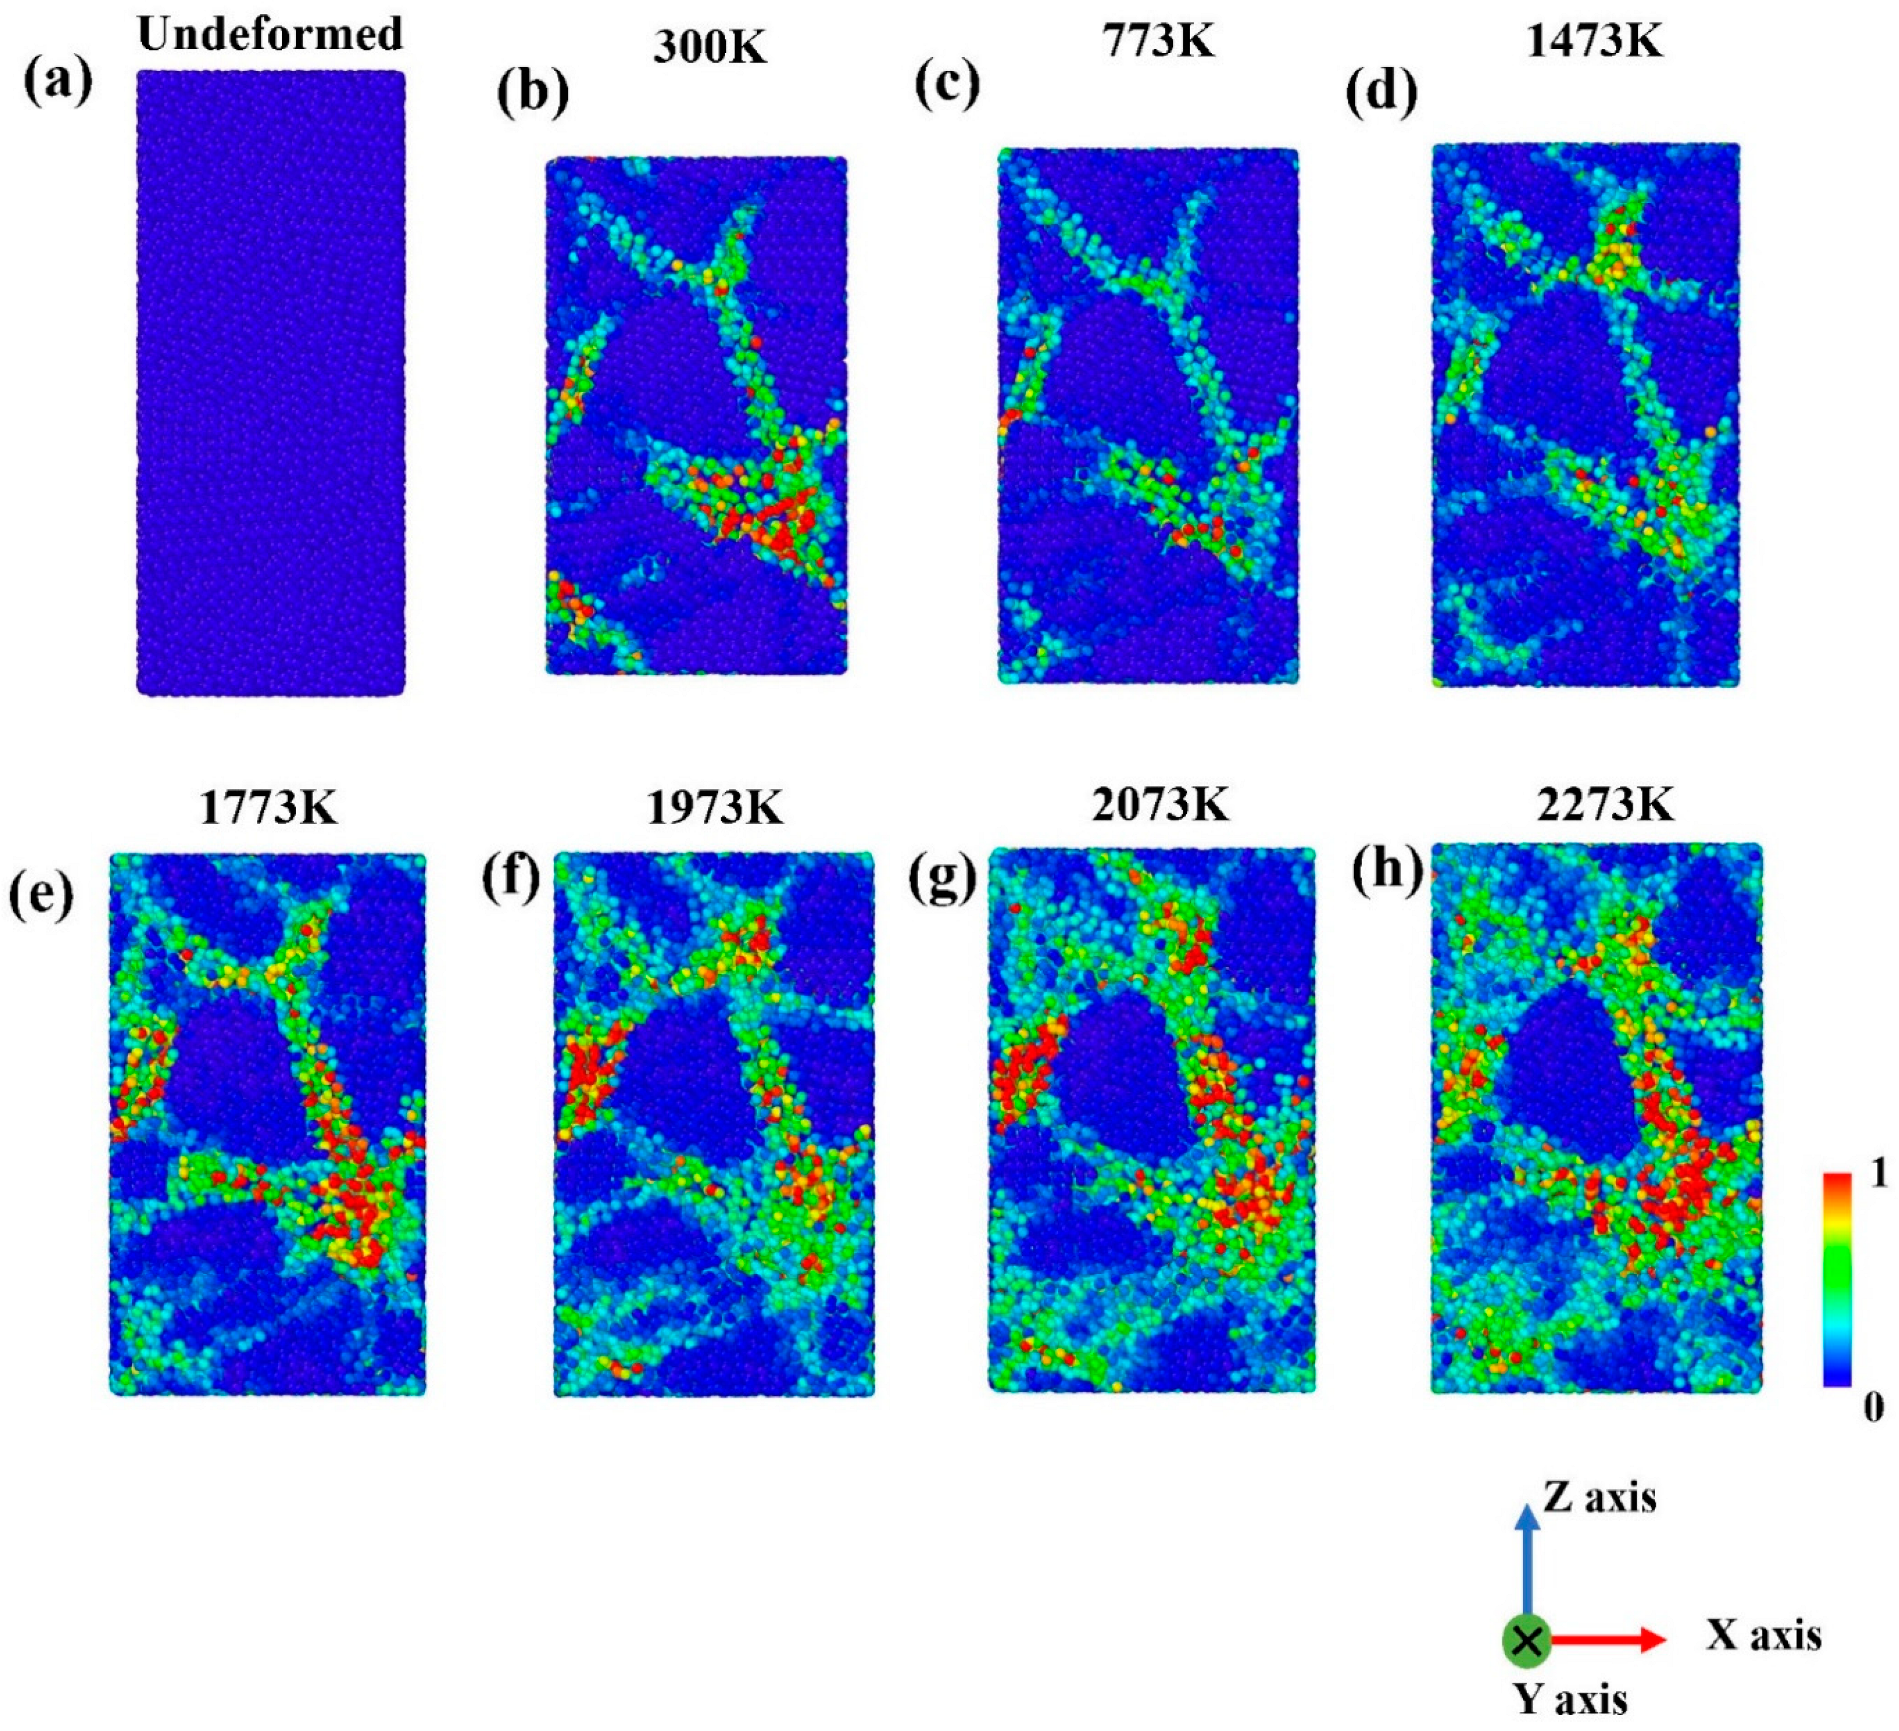
3.2. Compressive Tests
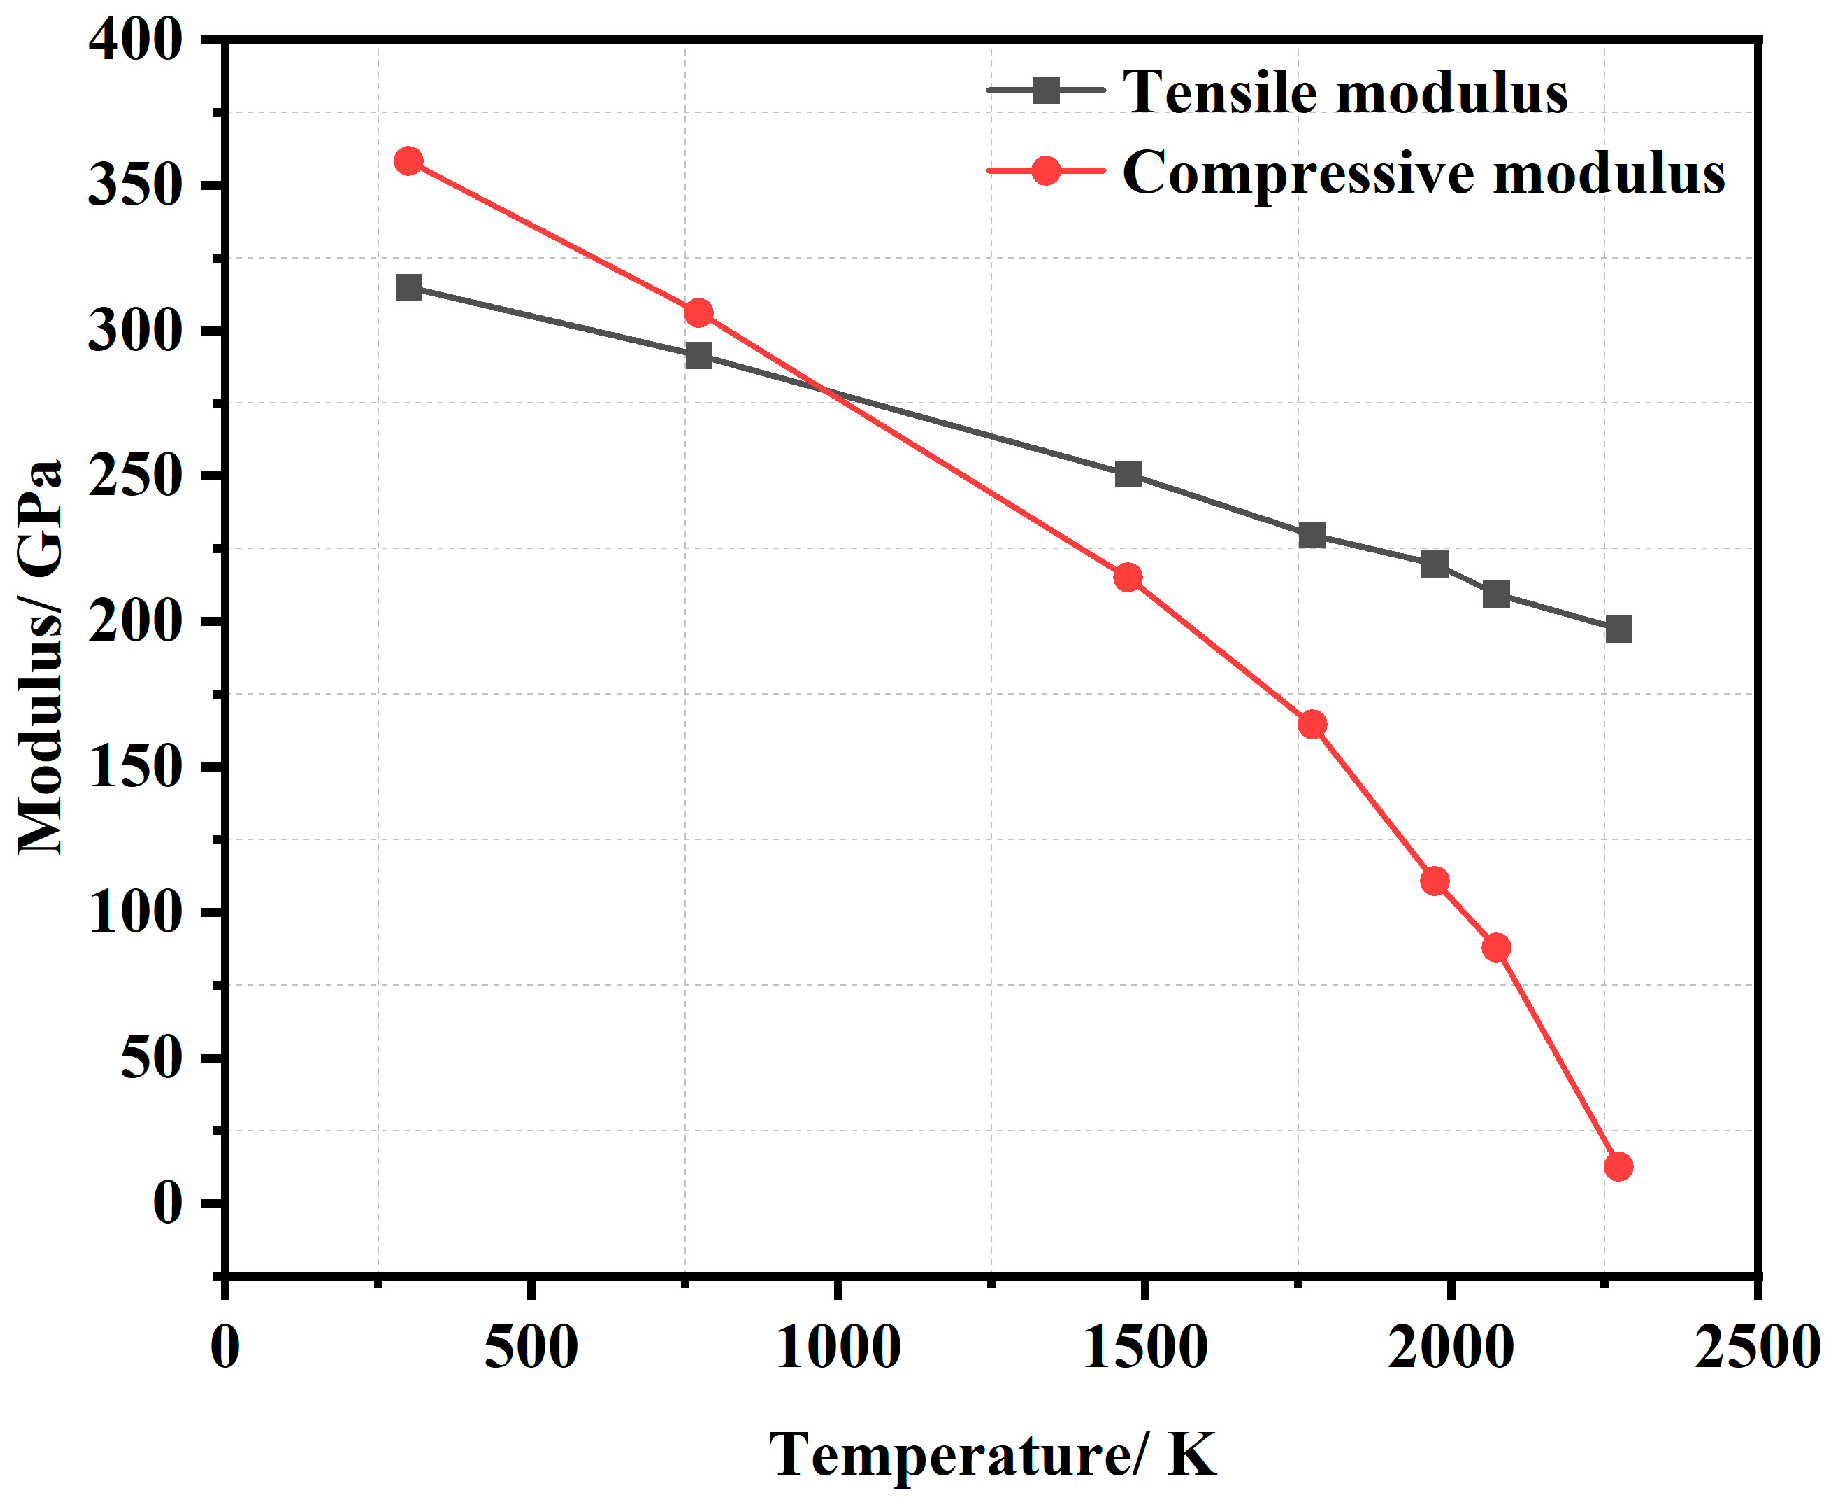
The stress–strain curves of the compressive tests are shown in Figure 4a. When the stress value is 0 GPa, the BeO model breaks. In Figure 4a, the data of the whole simulation process are shown to maintain the integrity of the data. Therefore, when the stress value is 0 GPa or less, the data can be ignored. Figure 4b presents the compressive strength of BeO as a function of temperature. Figure 4a,b reveal that the compressive strength decreases linearly as a function of temperature. It decreases from 41.76 GPa at 300 K to 1.92 GPa at 2273 K, a decrease of 95.40%. Figure 5 presents the distribution of the volumetric strain of the deformed BeO under compressive stress. The colors from blue to green to red represent strain values from 0 to 1. BeO still breaks along grain boundaries under compressive stress. At the same time, with the increase in temperature, deformation within the grain also occurs, and the phenomenon is most obvious above 1473 K. These phenomena are like those discussed previously in Section 3.1 under tensile stress.

3.3. Modulus

The tensile modulus and compressive modulus are shown in Figure 6. The tensile modulus decreases from 314.73 GPa at 300 K to 199.28 GPa at 2273 K, a decrease of 36.68%. Whereas the compressive modulus decreases from 358.15 GPa at 300 K to 12.40 GPa at 2273 K, a decrease of 96.54%. Obviously, the compression modulus decreases at a faster rate than the tensile modulus, especially when the temperature is above 1773 K as shown in Figure 6. According to Ref. [2], the quantity of the simulated tensile modulus is equivalent to the experimental value, approximately 250 GPa to 400 GPa at 300 K. The modulus reflects the ability of a material to resist deformation. The higher the modulus, the stronger the resistance to deformation. The results show that the deformation resistance of BeO decreases rapidly with the increase in temperature under compressive stress.

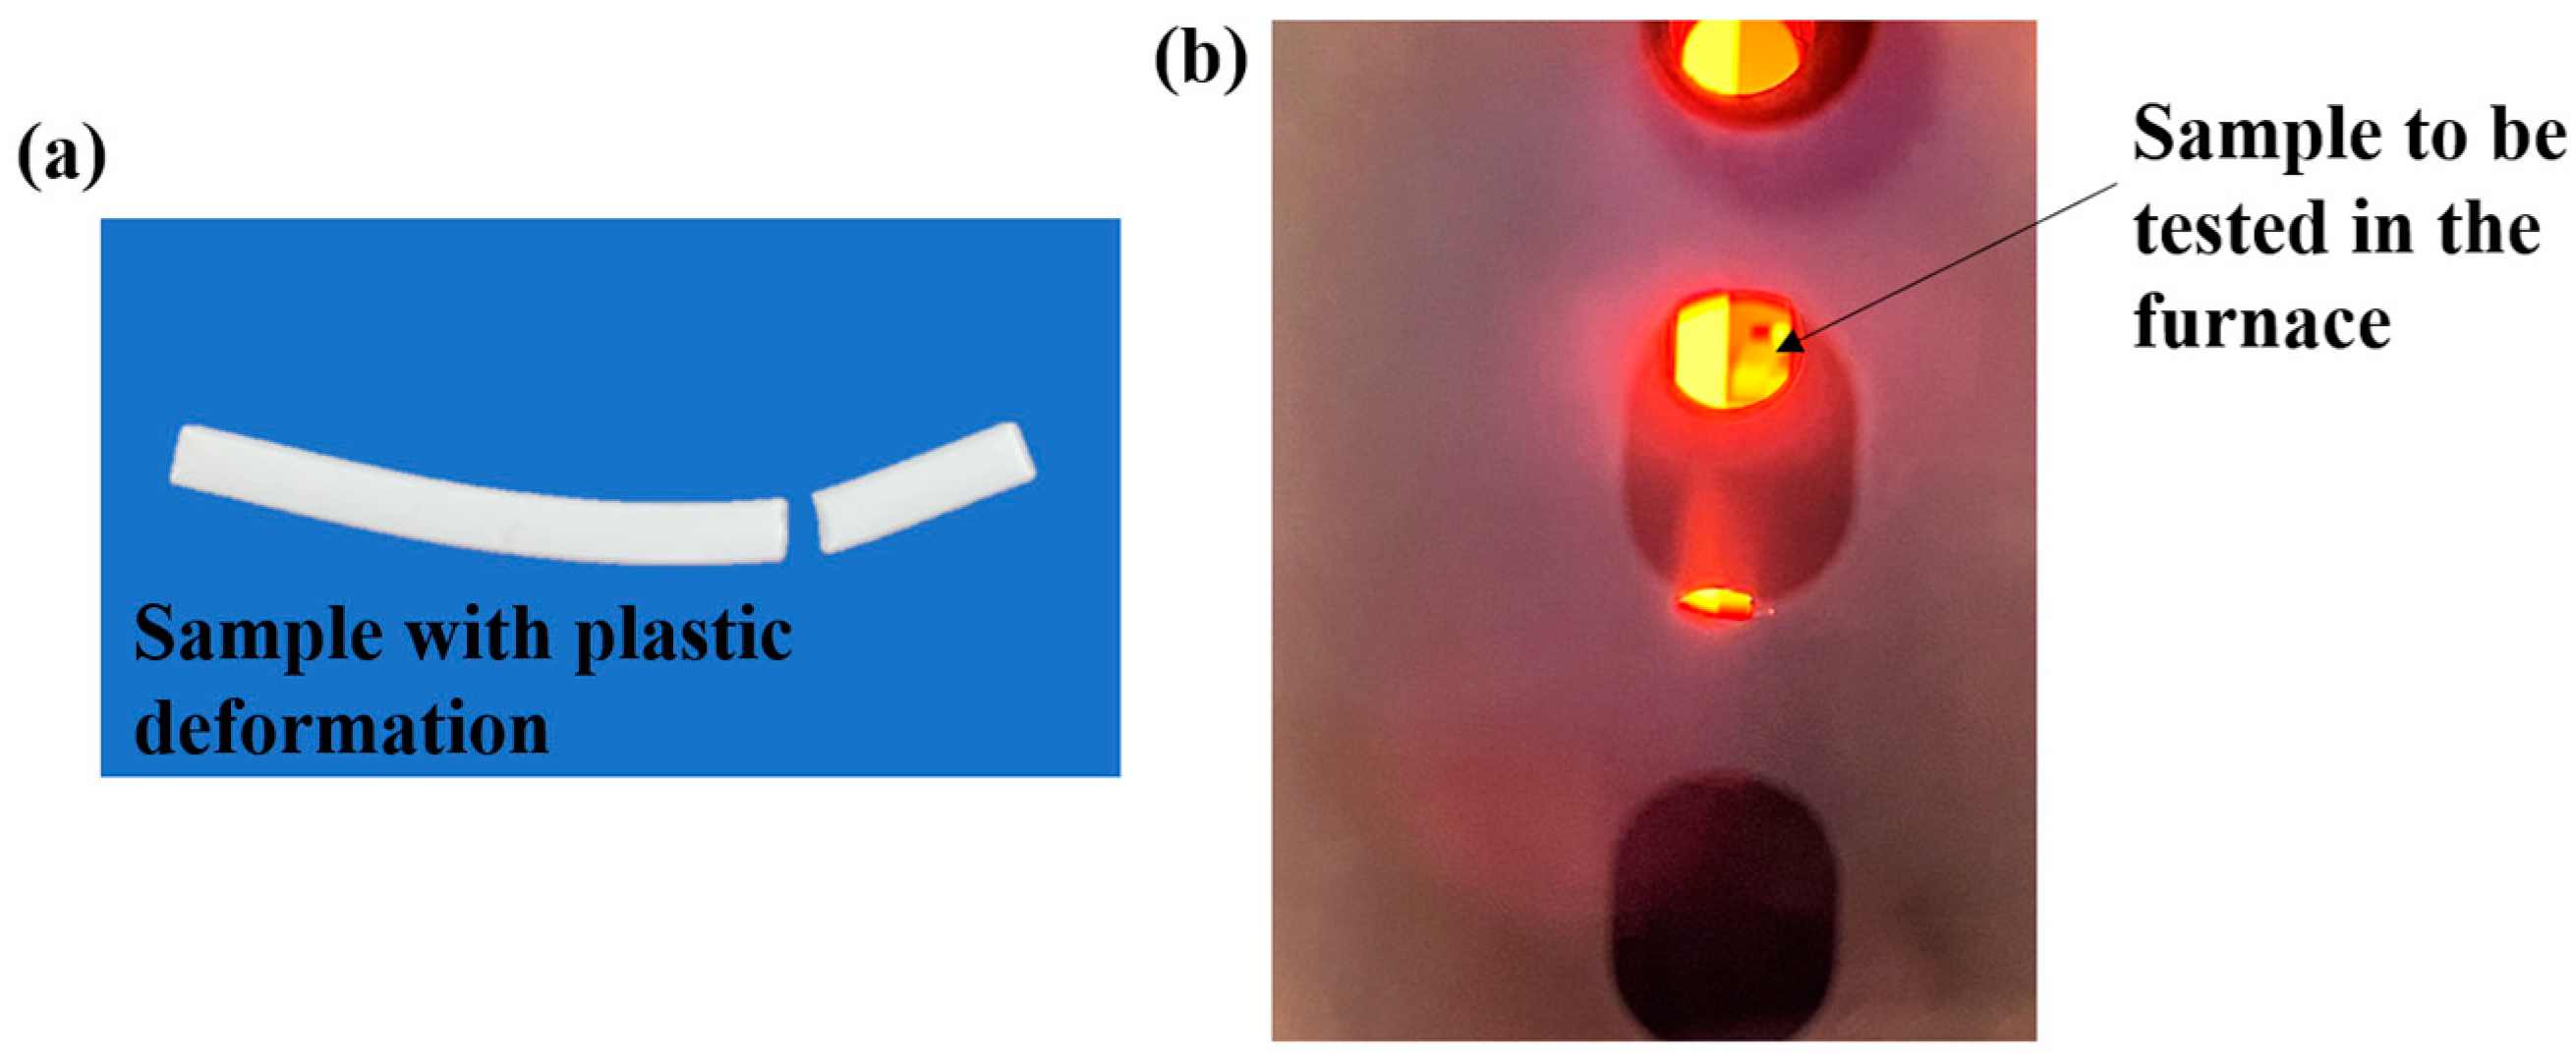
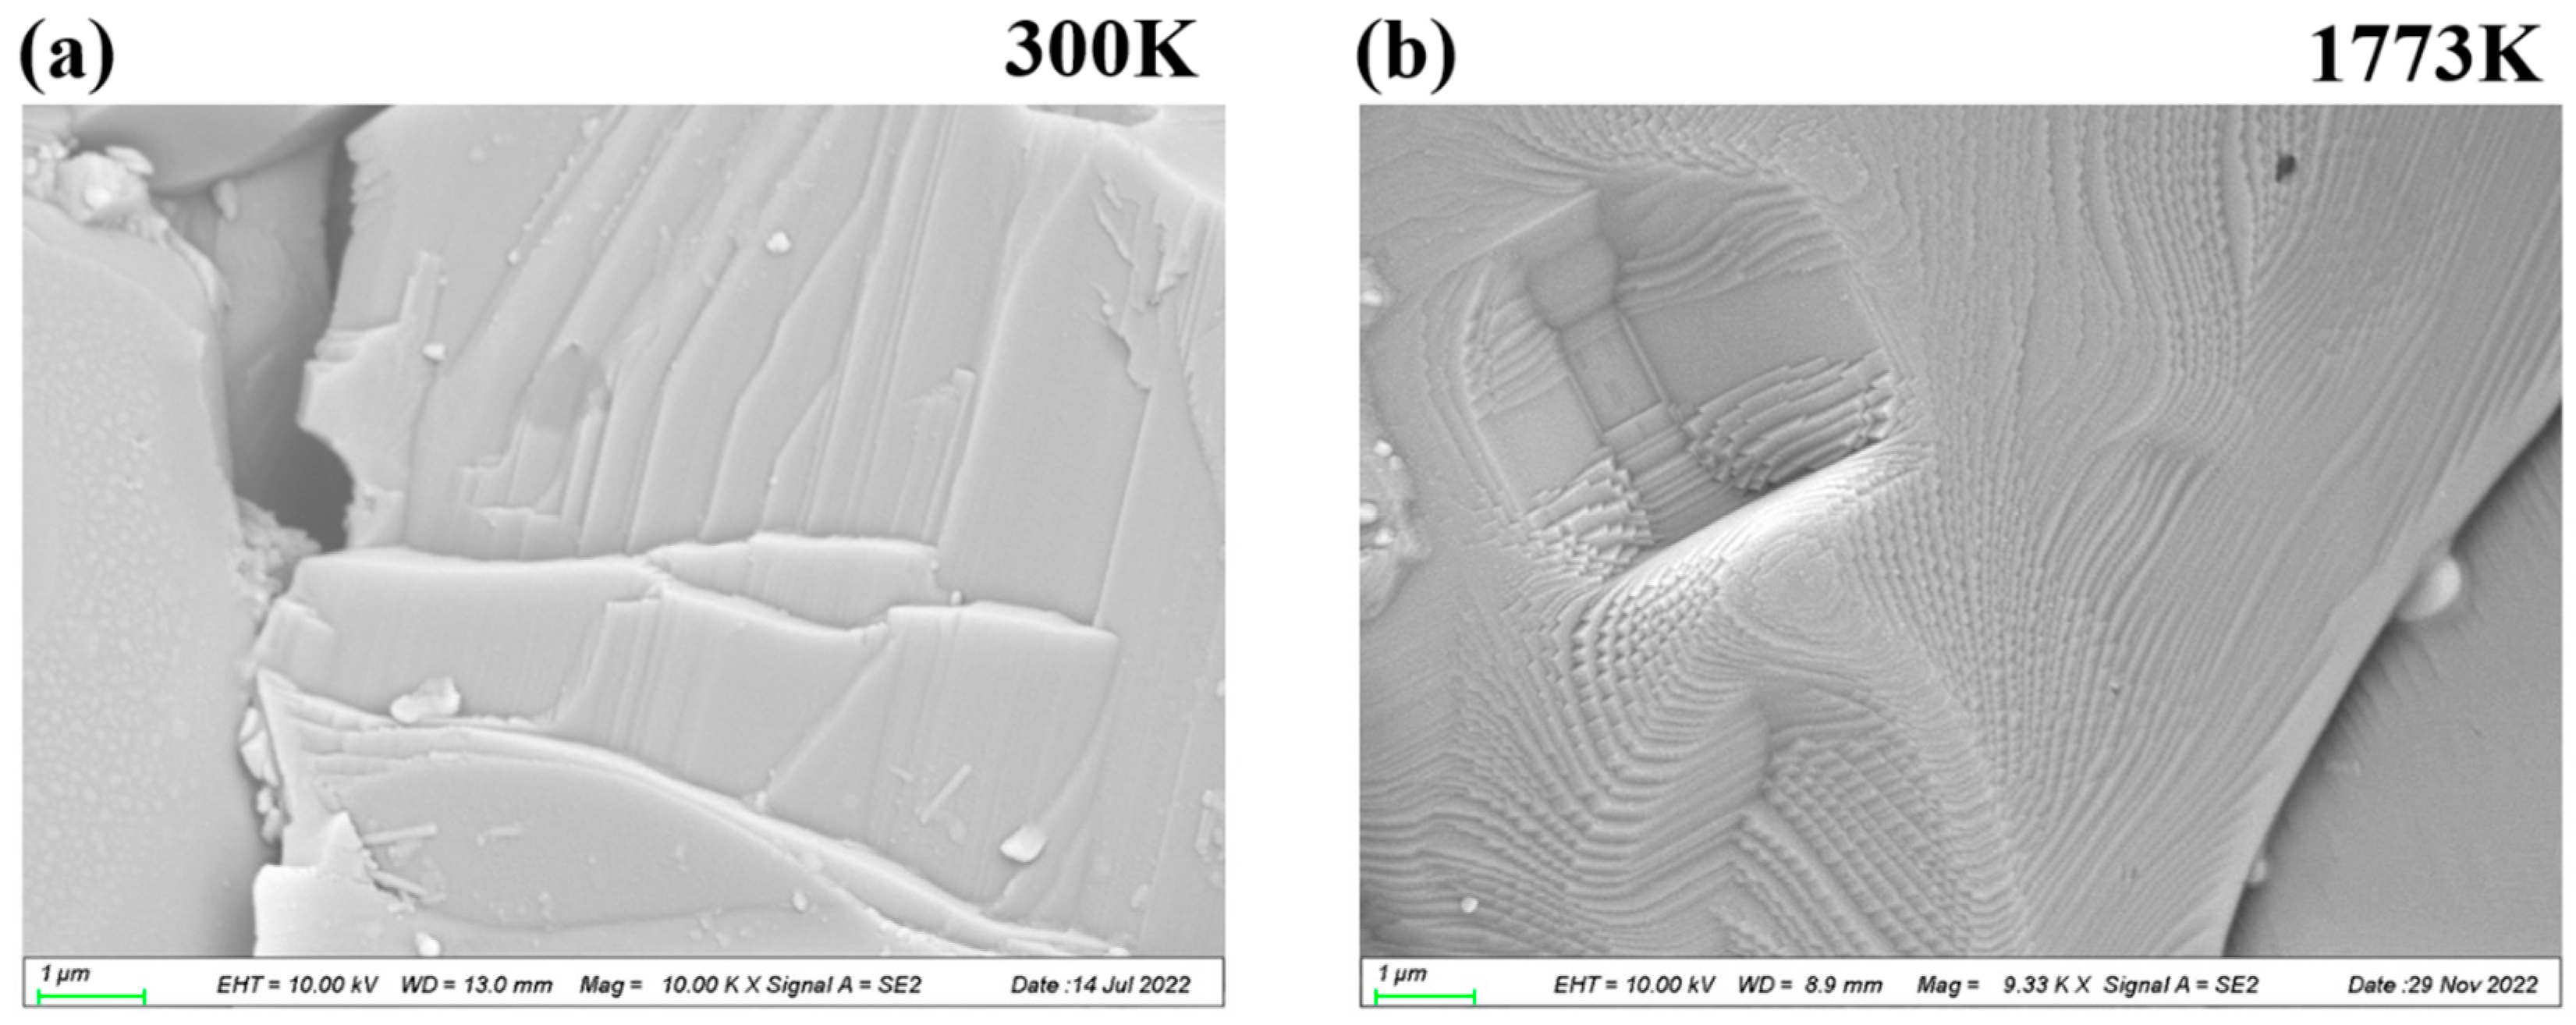
3.4. Experimental Verification

Comparing the simulation results of the tensile and compressive tests, some common rules can be summarized. The tensile strength and compressive strength of pure-phase polycrystalline BeO decrease monotonically with temperature. This is consistent with the law that as the temperature increases, the strength of the interatomic bond decreases, which leads to the overall strength decrease. However, sintering additives, such as MgO, Al2O3 and SiO2, are added to BeO to make sintering easier. This results in a glass phase consisting of Mg, Al, Si, Be and O elements between BeO grains. The presence of such a glass phase will change the monotonically decreasing strength of BeO with temperature, and relevant studies are still ongoing. In addition, when comparing Figure 2b with Figure 4b, it is visible that the compressive strength of BeO decreases with increasing temperature at a faster rate than that of tensile strength. In fact, this phenomenon is also reflected in previous experimental data. We have previously reviewed the trend of tensile strength and compressive strength of BeO with temperature in Ref. [2]. For example, at 1000 °C, the tensile strength of BeO is a little different from that of room temperature. For compressive strength, it is often reduced to a very low value compared to room temperature strength in Ref. [2]. This phenomenon still needs to be further studied.
Figure 7a is the fractured BeO sample with an obvious plastic deformation when tested at high temperatures. Figure 7b is the real experiment image of the BeO sample tested in the furnace in a vacuum environment. The plastic deformation of BeO at high temperatures was confirmed according to Figure 7a.
Figure 8 presents the typical displacement-force curves of flexural strength tests of BeO at 300 K and 1773 K. When comparing Figure 8a with Figure 8b, with the increase in displacement, the changing trend of the measured force value has an obvious difference. At 300 K, the slope increases gradually and then remains stable, whereas at 1773 K, the slope increases gradually first, then decreases gradually and remains stable. We believe that this phenomenon also reflects the plastic deformation behavior of BeO. Both curves drop suddenly, and this phenomenon reflects the fracture that occurs. The maximum force is 219.26 N at 300 K, and it is 13.82 N at 1773 K. The tested strength is 189.67 MPa at 300 K, while it decreases to 16.95 MPa at 1773 K, a decrease of 91.06%. Figure 9 presents the flexural strength test fracture morphology of BeO tested at 300 K and 1773 K in a vacuum environment. Figure 9a indicates that the fracture mode of BeO at room temperature is a brittle fracture. However, according to Figure 9b, the step-like pattern occurs at 1773 K. We selected some feature areas to enlarge, measured the pattern size of these steps and found that their widths were about 92 nm and 128 nm, as shown in Figure 10. This is consistent with a slip band. The slip bands range in width from 50 nm to 150 nm, which is about 1000 atomic distances. However, usually, slip bands are present in deformed specimens as an indication. Our reviewers also pointed out this problem, so we rethought the phenomenon and proposed a possible mechanism.
BeO ceramics are bonded to BeO grains by a glass phase, which in fact becomes the second phase, as shown in Figure 11a. When the temperature rises, especially at the high temperature of 1500 °C, the glass phase will fuse. At this point, the grain and the glass phase may be separated. As a result, the BeO grains have a locally free surface. When the grains undergo plastic deformation, the slip zone may appear in this indication, as shown in Figure 11b. However, this mechanism needs further verification, which will be completed in the future.
This experimental phenomenon shows that plastic deformation occurs in BeO under stress at 1773 K. Since BeO has a hcp crystal structure, the slip plane of BeO should be {0001}, referring to the slip system of Be metal. The slip direction should be <11 2 ¯ 0>.

4. Conclusions

The tensile and compressive behaviors of nano-polycrystalline BeO at different temperatures were investigated using a MD simulation method. Both simulations show that BeO fractures mainly along grain boundaries at lower temperatures, and the grain has little deformation. When the temperature increases to 1473 K and above, the BeO grain also deforms internally. With the increase in temperature, the deformation behavior of BeO grains becomes more obvious. In addition, both the tensile and compressive strength of BeO decrease linearly as a function of temperature, which is due to the decrease in the strength of bonds between atoms as the temperature increases, resulting in a decrease in macroscopic strength. However, the actual BeO strength does not decrease monotonously with temperature because there is a second phase between BeO grains, a glass phase, and related research is still in progress. In the high-temperature flexural strength test of BeO, it was verified that significant plastic deformation occurs at high temperatures, despite being a ceramic material. The micromorphology of the fracture also proves that there is an obvious slip phenomenon at 1773 K, while the fracture morphology at 300 K is an obvious brittle fracture.

Author Contributions

Conceptualization, M.-D.H. and X.-W.Z.; methodology, M.-D.H.; software, M.-D.H.; validation, X.-W.Z., M.L. and B.L.; formal analysis, M.-D.H.; investigation, M.-D.H. and X.-W.Z.; writing—original draft preparation, M.-D.H.; writing—review and editing, X.-W.Z., M.L. and B.L.; supervision, X.-W.Z., M.L. and B.L.; funding acquisition, X.-W.Z., M.L. and B.L. All authors have read and agreed to the published version of the manuscript.

Funding

This work was funded by the National S&T Major Project (Grant No. ZX06901), Key R&D Plan of Shandong Province (major scientific and technological innovation project, 2020CXGC010306) and National Youth Talent Support Program (Grant No. 20224723061).

Data Availability Statement

Not applicable.

Acknowledgments

We appreciate the open-source software LAMMPS and OVITO. And the authors acknowledge Shao-Shi Rui from the Institute of Mechanics, Chinese Academy of Sciences, for his help in the mechanism discussion.

Conflicts of Interest

The authors declare no conflict of interest.

References

  1. Manly, W.D. Utilization of BeO in reactors. J. Nucl. Mater. 1964, 14, 3–18. [Google Scholar] [CrossRef]
  2. Hou, M.; Zhou, X.; Liu, B. Beryllium oxide utilized in nuclear reactors: Part I: Application history, thermal properties, mechanical properties, corrosion behavior and fabrication methods. Nucl. Eng. Technol. 2022, 54, 4393–4411. [Google Scholar] [CrossRef]
  3. Petrovic, J.J.; Haertling, C.L. Beryllium Oxide (BeO) Handbook; Report LA-UR-20-24561; Los Alamos National Laboratory: Los Alamos, NM, USA, 2020. [Google Scholar]
  4. Barmore, W.L.; Vandervoort, R.R. High-temperature creep and dislocation etch pits in polycrystalline beryllium oxide. J. Am. Ceram. Soc. 1967, 50, 316–320. [Google Scholar] [CrossRef]
  5. Stukowski, A. Visualization and analysis of atomistic simulation data with OVITO—The Open Visualization Tool. Model. Simul. Mat. Sci. Eng. 2010, 18, 015012. [Google Scholar] [CrossRef]
  6. Plimpton, S. Fast parallel algorithms for short-range molecular dynamics. J. Comput. Phys. 1995, 117, 1–19. [Google Scholar] [CrossRef] [Green Version]
  7. Thompson, A.P.; Aktulga, H.M.; Berger, R.; Bolintineanu, D.S.; Brown, W.M.; Crozier, P.S.; in’t Veld, P.J.; Kohlmeyer, A.; Moore, S.G.; Nguyen, T.D.; et al. LAMMPS—A flexible simulation tool for particle-based materials modeling at the atomic, meso, and continuum scales. Comput. Phys. Commun. 2022, 271, 108171. [Google Scholar] [CrossRef]
  8. Byggmästar, J.; Hodille, E.A.; Ferro, Y.; Nordlund, K. Analytical bond order potential for simulations of BeO 1D and 2D nanostructures and plasma-surface interactions. J. Phys. Condens. Matter. 2018, 30, 135001. [Google Scholar] [CrossRef] [PubMed] [Green Version]
  9. Hodille, E.A.; Byggmästar, J.; Safi, E.; Nordlund, K. Molecular dynamics simulation of beryllium oxide irradiated by deuterium ions: Sputtering and reflection. J. Phys. Condens. Matter. 2019, 31, 185001. [Google Scholar] [CrossRef] [PubMed] [Green Version]
  10. Hodille, E.A.; Byggmästar, J.; Safi, E.; Nordlund, K. Sputtering of beryllium oxide by deuterium at various temperatures simulated with molecular dynamics. Phys. Scr. 2020, T171, 014024. [Google Scholar] [CrossRef]
  11. Hodille, E.A.; Byggmästar, J.; Ferro, Y.; Nordlund, K. Molecular dynamics study of hydrogen isotopes at the Be/BeO interface. J. Phys. Condens. Matter. 2022, 34, 405001. [Google Scholar] [CrossRef] [PubMed]
  12. Tersoff, J. New empirical approach for the structure and energy of covalent systems. Phys. Rev. B 1988, 37, 6991–7000. [Google Scholar] [CrossRef] [PubMed]
  13. Tersoff, J. Modeling solid-state chemistry: Interatomic potentials for multicomponent systems. Phys. Rev. B 1989, 39, 5566–5568. [Google Scholar] [CrossRef] [PubMed]
Figure 1. The schematic diagram of the MD simulation models: (a) the tensile test model and (b) the compressive test model.
Energies 16 04927 g001
Figure 2. (a) The simulated stress–strain curves of the tensile tests and (b) the simulated tensile strength as a function of temperature.
Energies 16 04927 g002
Figure 3. The spatial distribution of the volumetric strain of the deformed BeO under tensile stress: (a) undeformed, (b) at 300 K, (c) at 773 K, (d) at 1473 K, (e) at 1773 K, (f) at 1973 K, (g) at 2073 K and (h) at 2273 K.
Energies 16 04927 g003
Figure 4. (a) The simulated stress–strain curves of the compressive tests and (b) the simulated compressive strength as a function of temperature.
Energies 16 04927 g004
Figure 5. The spatial distribution of the volumetric strain of the deformed BeO under compressive stress: (a) undeformed, (b) at 300 K, (c) at 773 K, (d) at 1473 K, (e) at 1773 K, (f) at 1973 K, (g) at 2073 K and (h) at 2273 K.
Energies 16 04927 g005
Figure 6. The simulated modulus results of BeO as a function of temperature.
Energies 16 04927 g006
Figure 7. (a) The fractured BeO sample with plastic deformation and (b) the BeO sample to be tested in the furnace in vacuum environment.
Energies 16 04927 g007
Figure 8. The typical displacement-force curves of BeO tested at different temperatures: (a) at 300 K and (b) at 1773 K.
Energies 16 04927 g008
Figure 9. The typical fracture morphology of BeO tested at different temperatures: (a) at 300 K and (b) at 1773 K.
Energies 16 04927 g009
Figure 10. The enlarged image with the marked length of the step like pattern: (a) 92 nm (b)128 nm.
Energies 16 04927 g010
Figure 11. The schematic diagram of mechanism interpretation: (a) the microstructure of BeO and (b) the mechanism of slip band appearing on the surface of BeO grains.
Energies 16 04927 g011
Table 1. MD simulation model parameters utilized in this paper.
Tensile Test ModelCompressive Test Model
Length in X axis/nm205
Length in Y axis/nm35
Length in Z axis/nm1012.5
The number of grains2020
The number of atoms85,88844,651
Disclaimer/Publisher’s Note: The statements, opinions and data contained in all publications are solely those of the individual author(s) and contributor(s) and not of MDPI and/or the editor(s). MDPI and/or the editor(s) disclaim responsibility for any injury to people or property resulting from any ideas, methods, instructions or products referred to in the content.

