Abstract
This study developed a grid-connected biogas power generation system for a rural community using a 3-phase 2.2 kW squirrel-cage induction machine as the self-excited induction generator. The generator was driven by a 196 cc single-cylinder spark-ignition engine fueled by biogas. We developed a back-to-back converter that consists of a 3-phase PWM rectifier as the generator-side converter and a single-phase LCL-filtered grid-connected inverter. The generator-side converter transferred the active power to the grid-side converter and supplied the reactive power control back to the generator. The notch filter-based bus voltage control on the generator side mitigated the inter-harmonics in the generator current. The injected grid current complied with the IEEE 1547 standard because of the multi-frequency unbalanced synchronous reference frame control. The proposed system was validated with biogas produced from pig manure at a pig farm in central Thailand, which found a maximum output of 1.2 kW with a thermal system efficiency of 10.7%. The proposed system was scheduled to operate at 1.2 kW for 8 h per day with a levelized cost of 0.07 US$/kWh, 42% cheaper than the retail electricity price, and a payback period of 2.76 years. The proposed system is suitable for a farm with a minimum of 34 pigs.
1. Introduction
Biogas production is a form of sustainable waste management for agricultural, industrial, and residential sectors, which has direct impacts and contributions to 12 out of the 17 sustainable development goals (SDGs) [1]. Agricultural, industrial, and municipal organic waste and sewage sludge are converted to biogas through fermentation of microorganisms under anaerobic conditions [2,3]. Biogas production from livestock farms in developing countries has potential benefits in the reduction of greenhouse gas (GHG) emissions and environment-friendly waste management [4]. Biogas fuel is normally utilized for heat production, transportation, and electricity production [1].
Biogas can be converted directly to electricity through an electrochemical process using solid oxide fuel cells (SOFCs) with near-zero GHG emissions. However, complicated biogas cleaning and compression systems are required to make the SOFCs suitable for industrial scales [5]. Moreover, the high investment cost is a barrier to adaptation in developing countries [6]. Nevertheless, biogas-fed micro gas turbines are promising for power generation from sewage treatment systems [7,8]. Micro gas turbines fueled from biogas have efficiencies between 20–30% [8], with a rotational speed between 1433π to 8000π rad/s. A micro gas turbine is well equipped with a mechanical transmission system coupled with a generator providing the 50/60 Hz electrical output. The GHG emission is far less than the conventional internal combustion engines. Commercial micro gas turbines range from 30 kW to over 200 kW [8]. Internal combustion engine technologies are fully mature. Commercial biogas engines for power generation range from 25 kW [9] to 2 MW [10] with an electrical efficiency of up to 40%. Modification of standard internal combustion engines fueled by biogas has been widely explored. Compression–ignition engines can be modified to be fueled simultaneously by diesel and biogas [11]. A compression–ignition engine can be alternatively converted into a spark–ignition engine which can be solely fed by producer gas or biogas [12,13]. Standard spark–ignition engines require a slight modification for using biogas as the sole fuel [14,15,16].
Electrically excited synchronous generators are normally used to convert the mechanical work of the biogas-fed engines to AC electricity [11,12,13,15]. The output frequency is regulated through the engine speed governor for a stand-alone application, while the output voltage is regulated via the generator excitation current. For a grid connection, it must be ensured that the generator voltage and frequency exactly match those of the grid before synchronization. Permanent magnet synchronous generators (PMSGs) offer more compactness than electrically excited synchronous generators [17], which were adopted for biogas-fed power generation systems [9,14]. A power electronic converter is mandatory for regulating the output voltage and frequency and for grid integration [9,10,14].
Self-excited induction generators (SEIGs) can be another candidate for biogas power generation [18,19,20]. SEIGs have a rugged construction which requires almost no maintenance, which can use commercial 3-phase induction machines as generators [21]. Moreover, an SEIG has a cost much lower than a PSMG [22]. SEIGs are widely adopted for wind [23,24] and small hydro [25,26,27,28] energy systems. However, SEIGs require reactive power for excitation and regulation of the terminal voltage [29]. For the variable frequency stand-alone system, SEIGs are driven by variable speed prime movers, e.g., wind and hydro turbines, which are supplied from capacitor banks [20,25,30,31], hybrid excitation systems consisting of static var generators (SVGs) and capacitor banks [19,23,24,26,27,28]. A 3-phase SEIG can be operated as a stand-alone single-phase AC using a current-balancing circuit and a dummy load [32]. For grid-connected operation, the SEIG can be operated with a fixed speed and variable speed prime movers. For the fixed speed operation, the SEIG connects directly to the grid [18], which is suitable for a governed speed prime mover with a limited mechanical speed range of 1–5% above the synchronous speed. For the variable-speed grid-connected operation, the SEIG connects to the grid through an AC–DC–AC link power converter [27].
In one application of biogas-powered SEIG-based generator systems, a 45 kW SEIG fed a three-phase stand-alone system through a diode bridge rectifier and voltage source converter (VSC) [20]. A 100 kW commercial gas engine–SEIG set was directly connected to a three-phase grid [18]. A 7 kW gas engine–SEIG system directly supplied a 3-phase stand-alone system with a VSC-based SVG for regulation of the generator voltage [19]. The gas engines of these three SEIG-based biogas power generation systems were equipped with a speed regulation system.
As mentioned above, there is no report on single-phase grid-connected biogas power generation systems for a small community with a maximum power less than 5 kW. Therefore, this work reports the development of a grid-connected biogas power generation system for a small pig farm in central Thailand. A 196 cc single-cylinder spark-ignition engine fueled by biogas from anaerobic digestion of pig manure and wastewater was used as the prime mover. A 2.2 kW 3-phase squirrel-cage induction motor was operated as an SEIG. In addition, we developed a power electronic converter for the generator excitation control and integration of a 220 V 50 Hz single-phase grid. Laboratory and field tests validated technical and economic viability were validated.
2. Materials and Methodology
2.1. Selection and Modification of a Spark-Ignition Engine
A Honda GX200T2 QHT air-cooled [33], 4-stroke spark–ignition engine (Tokyo, Japan) with a horizontal shaft was chosen as the prime mover. Table 1 summarizes the engine specifications. The power–speed and torque–speed characteristics of the engine were reproduced from the specification sheet, as shown in Figure 1. The maximum output power was 4.1 kW at 120π rad/s, with a maximum torque of 12.4 N-m at 83π rad/s according to the SAE J1349 standard. In addition, gasohol, mixed fuel between gasoline and ethanol, with a maximum ethanol content of 10%, can be used with the GX200T2 QHT engine. Thus, this engine is suitable for direct coupling to a two-pole machine with a nominal speed of approximately 100π rad/s. The original carburetor was replaced by a gasoline/liquefied petroleum gas (LPG) carburetor conversion kit, as depicted in Figure 2. This dual fuel carburetor also facilitates the engine to be fed by biogas [16].

Table 1.
Parameters of the inverter.
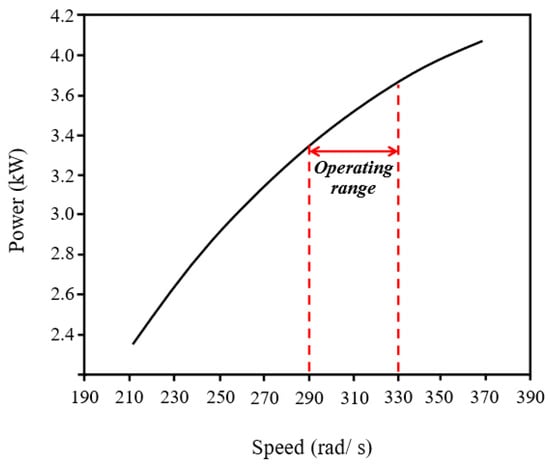
Figure 1.
Mechanical characteristics of the Honda GX200T2 QHT engine.
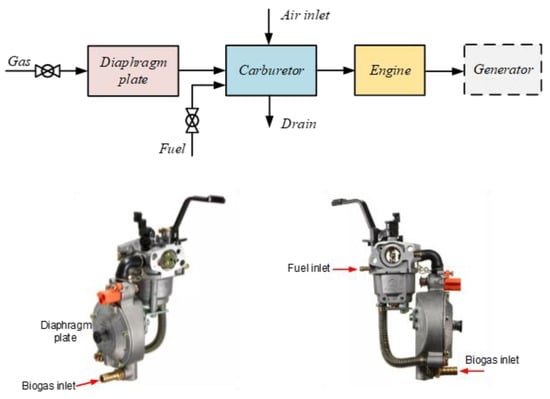
Figure 2.
Biogas supply system for the spark–ignition engine.
2.2. Assesment of Possible Power Conversion Topologies
This study selected a Hitachi TFO-K series 220/380 V 2.2 kW 2-pole squirrel-cage induction motor (Tokyo, Japan) for the SEIG. The output of this system was connected to a 220 V 50 Hz single-phase AC grid, which required a minimum DC input voltage of V. The engine speed was unregulated, so the generator output voltage and frequency were variable. The SEIG required a capacitor bank to build up the generator terminal voltages from a residual flux density in the rotor core. An additional reactive power source was also mandatory, to keep the SEIG excited when supplying the load [21].
Figure 3 depicts possible circuit topologies for this study. In the SEIG with the star connection in Figure 3a with passive excitation, the capacitor bank CB1 supplies a reactive power for an initial excitation, which builds a nominal line-to-line voltage of approximately 380 V at no-load [20,34]. A passive rectifier converts the 3-phase AC voltage to the DC bus voltage of approximately 550 V, which feeds an LCL-filtered single-phase insulated-gate bipolar transistor (IGBT) inverter. The capacitor bank CB2 supplies additional reactive power for voltage regulation when feeding active power to the grid. Although this circuit has a simple operation, the DC bus voltage is far higher than the grid voltage peak value. This high bus voltage results in a bulky inverter-side inductor of the LCL filter to limit the current ripple, high switching loss in the inverter, and high semiconductor component ratings.
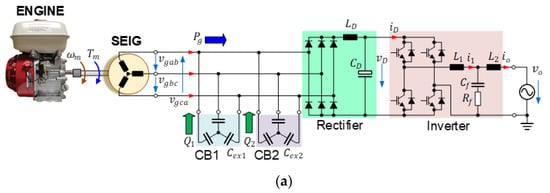
Figure 3.
Possible power conversion topologies for the biogas power generation system: (a) Passive rectifier with multi capacitor banks, (b) Passive rectifier with a capacitor bank and an SVG, (c) Proposed back-to-back converter with a capacitor bank.
Moreover, the generator has low efficiency due to the distorted currents drawn by the rectifier. Hybrid excitation schemes in Figure 3b with the reactive power supplied by a static var generator (SVG) provide smooth voltage regulation [26,28,35]. A voltage source converter (VSC) is adopted as the SVG, with as the boosting inductors [28]. The VSC bus voltage is controlled to be greater than the peak value of the SEIG line-to-line voltage so that the VSC can inject the reactive power into the generator for voltage regulation. In addition, the SVG can compensate for the current harmonics of the rectifier so that the SEIG currents become sinusoidal. This circuit topology and its control scheme are complicated and unsuitable for low-power applications. A thyristor-based SVG can be adopted instead of the VSC-based SVG [23,36]. However, the SEIG current harmonics and large DC bus voltage still cause a low system efficiency.
Figure 3c shows the proposed back-to-back converter topology. The SEIG winding is connected as the delta configuration so that the no-load line-to-line voltage is approximately 220 V, with a proper capacitor bank CB1. A VSC-based PWM rectifier is a boost-type power converter that converts the SEIG 3-phase AC voltage to a DC voltage higher than the peak value of the line-to-line input voltage. The DC bus voltage reference value is 400 V, which is high enough for the single-phase inverter with lower IGBT rating and switching loss. The VSC-based PWM rectifier also supplies the reactive power to the SEIG while drawing the active power . The proposed topology was expected to be more efficient than the passive rectifier topologies in Figure 3a,b, due to the SEIG sinusoidal currents and lower switching losses.
2.3. Proposed SEIG-Based Power Conversion System
Figure 4 depicts the power converter control system. The SEIG-side and grid-side control schemes were implemented on a TMS320F28069 32-bit microcontroller from Texas Instruments. The voltage and current signals of the SEIG and grid were sampled via the embedded analog-to-digital converters (ADCs), from which the control schemes generated the switching signals from the PWM units for the IGBTs via the gate driver circuits. The SEIG and capacitor bank were considered as a 3-phase AC voltage source with the star connection. Therefore, the virtual phase voltages of the SEIG are defined as follows:
where is the voltage amplitude and is the generator electrical frequency. The shaft rotational speed is not required. Instead, the shaft speed can be estimated from the generator frequency , which was used for supervisory control, along with other mechanical parameters such as temperatures, biogas pressure, and gas flow rate.
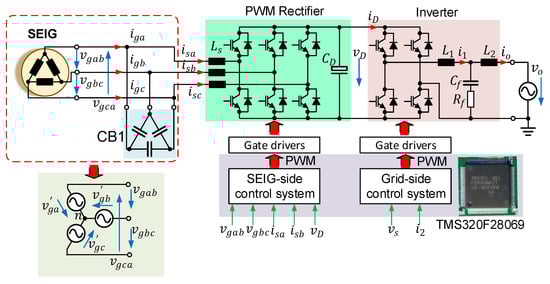
Figure 4.
Control structure of the biogas power generation system.
Figure 5 shows the control system of the PWM rectifier in the synchronous reference frame. The superscripts denote the reference signals. The measured physical line to line voltages and are transformed into a space vector, which is then shifted by to calculate the space vector of the virtual phase voltages , and . The synchronous reference frame phase-locked loop (PLL) estimates the angle , frequency , and amplitude of the space vector The PWM rectifier currents and are only measured due to the symmetry of the 3-phase 3-wire system for transforming the synchronous reference frame currents and . Thus, the instantaneous active and reactive powers and of the PWM rectifier are given as shown:
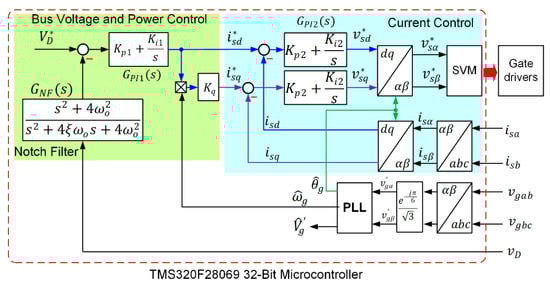
Figure 5.
SEIG-side power converter control system.
Assuming there is no loss in the capacitor bank, the SEIG active power and reactive power become the following:
The DC bus voltage contains a ripple caused by the oscillating power of the grid-side inverter at the frequency of , where is the grid frequency. Thus, a second-order notch filter at blocks the bus ripple component before feeding to the bus voltage control loop with a proportional-integral (PI) controller . The bus voltage controller generates the d-axis reference current to draw the active power from the SEIG in response to the bus power drawn by the single-phase inverter.
Voltage regulation of a variable-speed SEIG is challenging due to its nonlinear characteristics [23,28,34]. The nominal synchronous speed of this SEIG was 100 rad/s, which can tolerate a speed range of ±10%. Thus, the mechanical speed range of the engine suited the SEIG well. We proposed a simple open-loop excitation scheme. The q-axis reference current was proportional to with a constant gain , to produce the reactive power for regulating the SEIG voltage. The sign of the estimated SGIG frequency defined the reactive power ’s direction, in the case of the phase sequence opposite to (1). The PI controllers regulated the dq-axes currents. A space vector modulation (SVM) technique generated the switching signals for the IGBTs.
The ripple component of the bus voltage affects the PWM rectifier and SEIG current waveforms. Figure 6 displays the natural reference frame equivalence of the SEIG-side control system. The PI controllers of the current control loops in Figure 6 are equivalent to the proportional–resonant controllers at the resonant frequency of . The bus voltage filter attenuates the component . Let the reference current given as below:
where is the active power-producing component and is the resultant of the component. The reference currents , , and in the natural reference frame are obtained from the following:
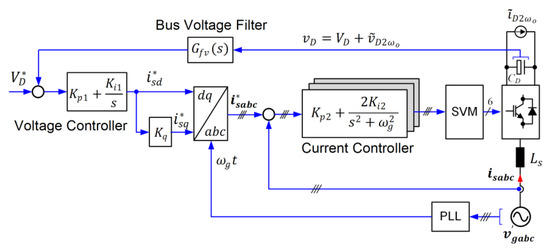
Figure 6.
Equivalent SEIG-side power converter control system in the natural reference frame.
Let , and consider only the component of , which causes inter-harmonic components , , and in the natural frame reference currents , , and as follows:
Thus, the bus voltage filter plays a vital role in mitigating the components in the PWM rectifier currents. A low-pass filter with a cut-off frequency far below results in a sluggish performance. In this work, we applied a standard second order notch filter to block the component while maintaining fast dynamic performance.
The output stage of the proposed topology in Figure 4 is the single-phase -filtered grid-connected inverter. The damping resistor of the filter ensures control stability with a large grid impedance. Grid current feedback control is used in this study. The grid voltage is given here:
where is the voltage amplitude, is the grid frequency. The desired grid current is as shown:
The single-phase inverter is controlled in the virtual synchronous reference frame control by setting and the orthogonal current . The grid current is decoupled into the axes using the Park transformation:
The synchronous reference frame control results in the decomposition of the instantaneous power and reactive power as follows [37]:
The grid-side control system is implemented in the unbalanced synchronous reference frame, a sub-class of the synchronous reference frame control. Figure 7 depicts the stationary reference frame representation of the synchronous reference frame control. The error signals and in the axes are transformed into the error signals and in the axes with the angle . The controllers in the axes produce the manipulating signals and , which are transformed back to the axes manipulating signals and . Applying the convolution and modulation properties of the Laplace transformation [38] yields the stationary reference frame outputs:
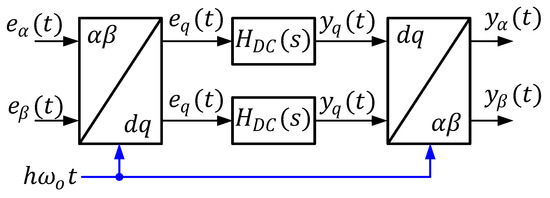
Figure 7.
Stationary reference frame representation of the synchronous reference frame control.
If the -axis input and only the output in the -axis are considered for the single-phase system, the stationary reference frame equivalence of becomes the following:
If is the standard PI controller, is as below:
The equivalent controller transfer function in the stationary reference frame in (16) is identical to the ideal proportional-resonant controller, which provides an infinite gain at the target frequency , ensuring zero steady-state error. This control technique is called the unbalanced synchronous reference frame control, which has been successfully applied for single-phase converters [39,40]. The unbalanced synchronous reference frame control can be implemented in different structures with identical performance [40].
Figure 8a depicts the grid-side control system of the single-phase inverter, which is implemented in the multiple unbalanced synchronous reference frame on the same microcontroller with the SEIG-side control. The proposed control scheme consisted of a fundamental component controller at the grid frequency , and multiple harmonic controllers at frequencies . The harmonic controllers attenuate low-frequency harmonics in the grid and inverter output voltages due to switching deadtimes [37]. An inverse Park transformation PLL estimates the angle and the grid voltage amplitude [41]. A low-pass filter with a time constant of reduces the fast-changing rate of the power reference to draw power from the SEIG and engine smoothly. The axis reference current is calculated from the filtered reference output power using (12), whereas the axis reference current is used for a unity power factor. The fundamental current controller uses the grid current as the axis component current and the reference current as the axis component current for the reference frame transformation [40]. The fundamental grid current components and in the axes are regulated by the PI controllers , whose outputs and are transformed back to the stationary reference frame. Only the axis output is used. This control structure has inherent power decoupling and frequency adaption capabilities [37]. Figure 8b shows the details of the harmonic current controllers implemented in the modulation/demodulation structure at the frequencies . The harmonic controllers have a simpler structure than the fundamental component controller with identical performance. The axis reference current is compared with the grid current . The decomposed error signals in the axes are regulated by the integral controllers , from which outputs are transformed back to the axis signals . The output signals of the fundamental current controller and the harmonic controller form the input signal for the pulse width modulation (PWM) unit embedded in the microcontroller. The transfer function of the grid current controller is equivalent to a proportional–multi-resonant (PMR) controller, as in [37]:
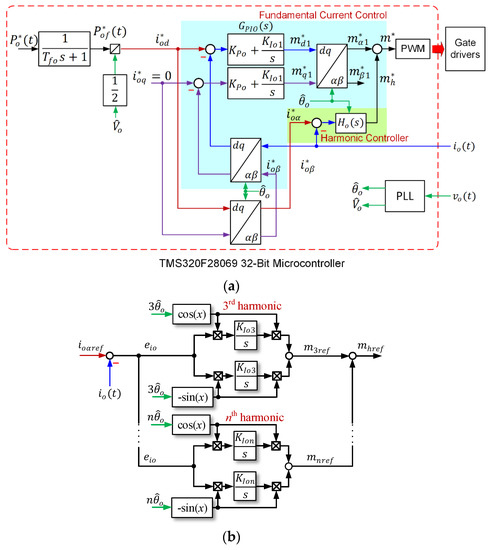
Figure 8.
Grid-side control system: (a) Overall control system, (b) Structure of the harmonic control.
2.4. Back-to-Back Converter Design
The proposed power converter in Figure 5 was constructed with parameters listed in Table 1. The excitation capacitors built up the SEIG voltage to the nominal value of 220 V (line to line) at the no-load rotational speed of approximately 100π rad/s. Assuming the efficiency of the converter and SEIG as 70%, the nominal output power was set at 1.5 kW, at which the mechanical input power kW, close to the rated power. The SEIG-side and grid-side converters employed the asymmetrical regular sampled PWM technique, with the triangular carrier frequency of 10 kHz and the sampling frequency of 20 kHz. The resonant frequency is given by the following:
The grid current control loop with the harmonic controller orders 3rd, 5th, 7th, and 9th was designed at a bandwidth of 1100 Hz [37]. The current control loop of the PWM rectifier was tuned at an approximated bandwidth of 1000 Hz, using the method in [43]. Figure 9 shows the simplified control block diagram of the bus voltage control loop, where the notch filter is approximated as the low-pass filter. The controller parameters and and the notch filter’s damping factor were obtained from the extended symmetrical optimum method [44] at a loop bandwidth of 15 Hz.
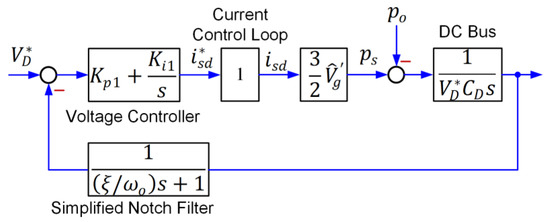
Figure 9.
Simplified bus voltage control block diagram.
2.5. Experimental Setup
Figure 10 shows the biogas power generation system prototype, which was installed at Tha Manoa Subdistrict, Chaibadal District, Lopburi, Thailand (15.1998° N, 101.1652° E). Figure 11 depicts the performance evaluation diagram of the prototype system. Gasohol containing 90% 95-octane gasoline and 10% ethanol by volume was used for the laboratory tests. The average thermal input power was determined from the consumption rate using a digital weighing scale monitored in 10 min periods.
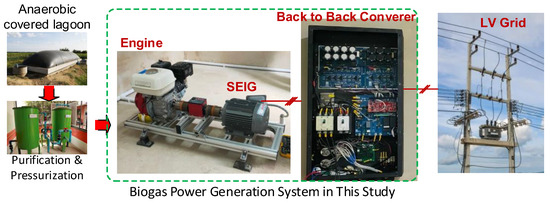
Figure 10.
Prototype of the biogas power generation system.
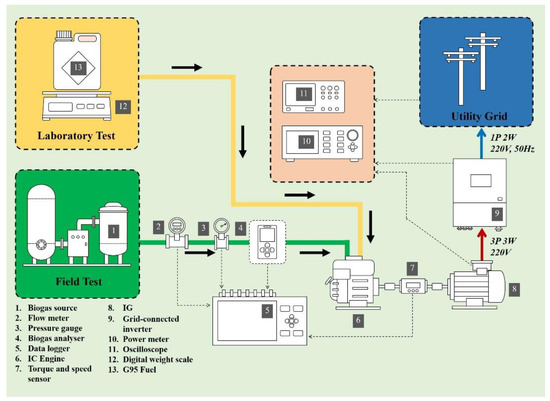
Figure 11.
Performance evaluation diagram of the biogas power generation system.
The engine was fueled by biogas for the field tests at Tha Manoa Subdistrict. In this community, there are 8 pig farms, each containing 100–700 pigs. The air intake was adjusted experimentally until the engine delivered a stable shaft power for the desired output power. Each farm installed an anaerobic covered lagoon to produce biogas from pig slurry, a primary measure for waste management. The byproduct biogas has been primarily utilized for cooking. Sediment from anaerobic digestion was used for soil fertilization within the community. This biogas production project joined the Thailand Voluntary Emission Reduction (T-Ver) Program, which was verified to reduce the emissions by 1634 tCO2e/year between 2015–2022 [45]. The produced biogas from each lagoon was purified by passing through Fe(OH)3 absorbent granules, which were made from grey cement mixed with fine sand soaking in FeCl3 and NaOH [46]. Fan blowers pressurized the upgraded biogas for distribution to 230 households for cooking between 5.00 am–9.00 am and 4.00 pm–9.00 pm daily. The excess biogas had been planned to be used for power generation.
The thermal input power was determined from the volumetric flow rate using an Omega FMA-A2100 thermal mass flowmeter (Stamford, CT, USA) and CH4 content was monitored by an IRCD4 gas analyzer from Beijing Shi’An Technology (Beijing, China). The shaft torque and speed and mechanical power were obtained from a CALT DYN-200 torque–speed sensor (Shanghai, China) mounted between the engine and the SEIG. Electrical parameters at the SEIG and converter outputs were measured by a Yokogawa WT300 4-channel power analyzer (Tokyo, Japan). Current and voltage waveforms were recorded by an ISO-TECH IDS-1074B 4-channel digital oscilloscope (Corby, UK).
3. Results
3.1. Control Performance of the SEIG and Back-to-Back Converter
This section validates the laboratory performance of the SEIG and back-to-back converter system. The SEIG was driven by the GX200T2 QHT engine and fueled by gasohol. The reactive power gain was determined experimentally to keep the ratio between the SEIG voltage and frequency constant throughout the operating range.
Figure 12a shows the SEIG voltage build-up period. In the beginning, a small SEIG voltage was induced by the residual flux density in the rotor core. After connecting the SEIG with the back-to-back converter, gradually increased due to the reactive power from the capacitors . While building the terminal voltage, the SEIG also supplied active power to the DC bus capacitor , with the VSC operated as a passive rectifier. Thus, the DC bus voltage was approximately equal to the peak value of the SEIG line-to-line voltage. The VSC current rose during the build-up period and decreased to zero at the steady state. At the steady-state no-load condition, the SEIG current flowed between the SEIG and , as observed from . The voltage settled at the RMS value of 220 V at the steady state. Note that this voltage depends on the value and the engine speed . Figure 12b shows the startup of the PWM rectifier when increased to the reference 400 V. The voltage dropped during the transient condition because the SEIG supplied the active power to the bus capacitance. However, the SEIG was kept excited by the reactive power feeding back from the PWM rectifier to the SEIG.
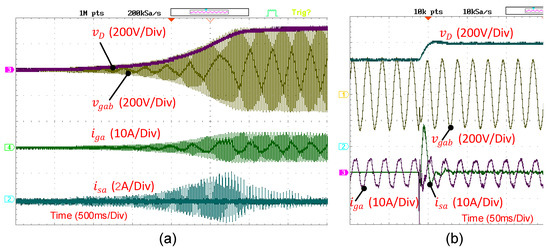
Figure 12.
Transient voltage and current waveforms of the SEIG-side converter: (a) Voltage build-up period, (b) DC bus voltage start-up period.
Once the PWM rectifier had been operated, the grid-side inverter was enabled. Figure 13 shows the transient response of the grid current when injecting a power output of 1200 W. The -axes current signals and of the PWM rectifier in the microcontroller-based control system were sent to 14-bit digital t0 analog converters (DACs) for monitoring on an oscilloscope. The SEIG-side control system produced the axis current to draw an active power from the SEIG. The axis current also increased in proportion to . Figure 14 displays the steady-state waveforms of the grid voltage and current , and the SEIG voltage and current at the rated output power of 1.5 kW, where the engine speed was approximately 97π rad/s. The SEIG frequency measured 46 Hz. The SEIG current waveform was close to sinusoidal without inter-harmonic components, as analyzed in (8), due to the notch filter blocking the component of the bus voltage. Meanwhile, the grid current waveform was near-sinusoidal because of the added harmonic controller. The effect of the bus voltage ripple on the SEIG current is illustrated in Figure 15, where the notch filter was replaced by a low-pass filter. The bus voltage loop bandwidth was tuned at 15 Hz, similar to the notch filter-based control. The changes in each SEIG current cycle indicate the presence of the inter-harmonic components, as explained in (8).
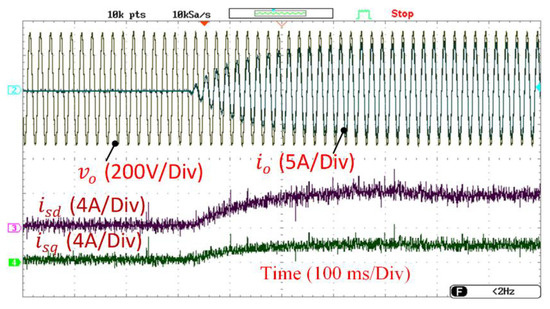
Figure 13.
Transient response when injecting a power of 1200 W to the grid.
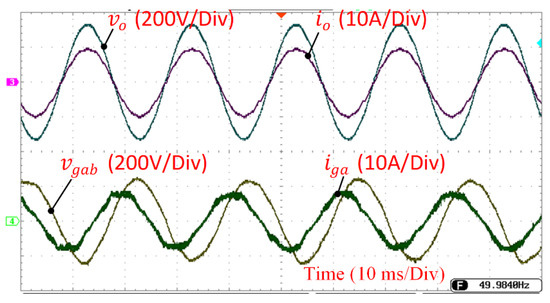
Figure 14.
Steady-state waveforms of the grid voltage and current and SEIG voltage and current at the rated output power of 1.5 kW, with the notch filter-based bus voltage control.
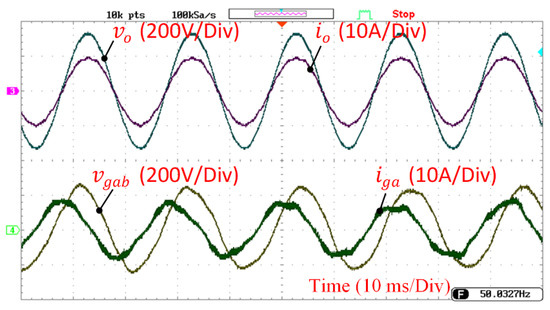
Figure 15.
Steady-state waveforms of the grid voltage and current and SEIG voltage and current at the rated output power of 1.5 kW, with the low-pass filter-based bus voltage control.
The SEIG current waveform was also near-sinusoidal, with a total harmonic distortion (THD) of 2.67% at the rated power. Figure 16 depicts the grid current harmonics at the output powers of 500 W (33%), 1000 W (66%), and 1500 W (100%), normalized by the rated current of 6.75 A, which comply with the IEEE 1547 standard [47].
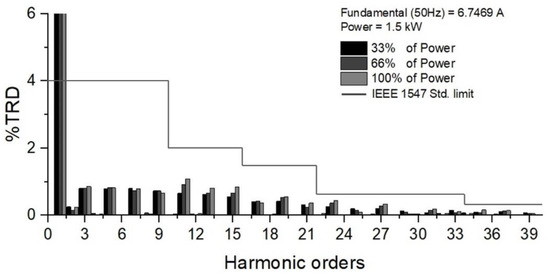
Figure 16.
Output current harmonics of the grid-side inverter, normalized by the rated current, according to the IEEE 1574 standard.
Figure 17 shows the reactive power the PWM rectifier injected to the SEIG with the output power range from 10% to 100%. The reactive power from the capacitor bank is determined from the following:
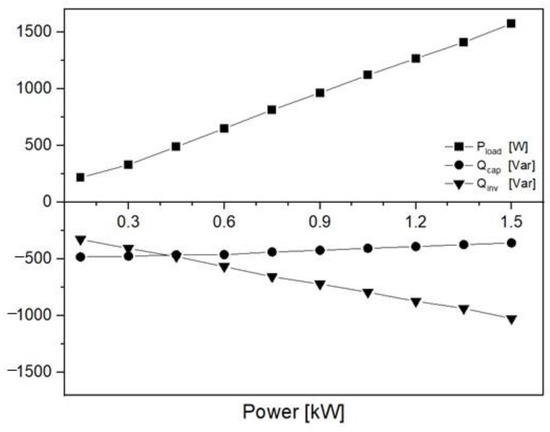
Figure 17.
Reactive power and active power of the SEIG with the output power.
The reactive power decreased with the output power due to the generator frequency reduction. The reactive power from the PWM rectifier plays an essential role in the regulation of the SEIG voltage. Figure 18 depicts the SEIG voltage/frequency ratio, normalized by the nominal value of , which is close to unity over the output power range.
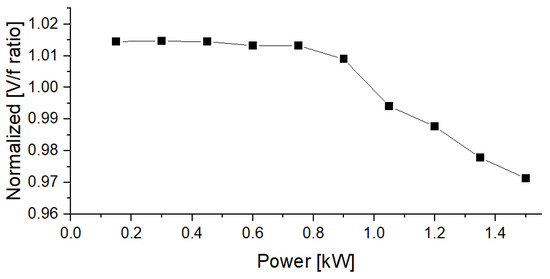
Figure 18.
Normalized SEIG voltage/frequency ratio.
This mechanical frequency of the induction machine is less than the electrical frequency for operating in the motor mode and higher than for the generator mode. The slip due to the speed difference is given as below:
Figure 19 compares and normalized by the nominal frequency , and slip versus the shaft torque . The mechanical frequency decreased with the increasing torque , according to the engine characteristics. The SEIG-side converter drew the active power from the SEIG, which caused the SEIG frequency to be less than the mechanical frequency . Thus, the slip decreased with the torque in the negative region while the machine operated in the generator mode.
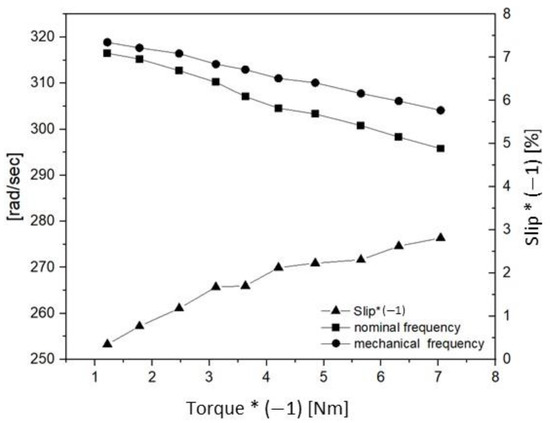
Figure 19.
Mechanical, SEIG frequency and slip versus the shaft torque.
3.2. System Performance
The prototype’s performance was validated with biogas at the selected area, Ta Manoa Subdistrict, in December 2021. The IRCD4 gas analyzer monitored biogas composition during the experiment, with values listed in Table 2. Note that this IRCG4 gas analyzer could not measure the moisture content of the biogas. However, it has been reported that biogas typically contains less than 1% water by volume. The engine exhaust gas was monitored using an SA500 gas analyzer from Beijing Shi’An Technology (Beijing, China). The probe of the exhaust gas analyzer was cleaned before each measurement. The exhaust gas analyzer was ensured to indicate near-zero before starting the engine. The no-load speed during the field experiments was approximately 108π rad/s because the shaft speed with biogas drops, with the output power greater than with gasohol in the laboratory test. Thus, the excitation capacitors of 35 μF were used in the field experiment in response to the higher no-load speed. For the field tests with biogas, the prototype system delivered the maximum output power of 1200 W, 80% of the rated value, due to low biogas production. Unfortunately, the pigs were young during the test period, so their manure was insufficient to produce enough biogas for the rated output power.
Table 2.
Biogas composition in the field experiments.
Figure 20 compares the engine shaft speed fueled by gasohol and biogas. The engine speed with biogas dropped rapidly, with the output power greater than 70% of the rated power. It was found during the field experiments that the SEIG lost excitation when the output power was greater than 80% of the rated value. Meanwhile, the engine with gasohol delivered the output power smoothly. However, the unstable biogas supply during the experiment and the smaller energy density of biogas itself derated the prototype output power. Figure 21 shows the biogas consumption with the output power at 21 °C and 101.325 kPa, which was obtained from the thermal mass flowmeter. This biogas flowrate and the methene content in Table 2 was used to calculate the engine input power.
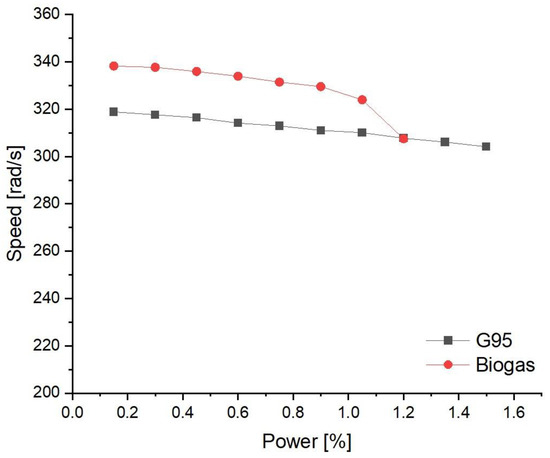
Figure 20.
Engine shaft speed with the output power.
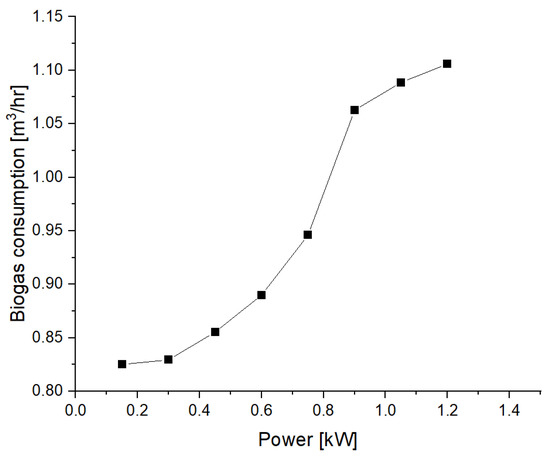
Figure 21.
Biogas consumption with the output power.
Figure 22 compares the engine’s efficiency, SEIG, back-to-back converter, and system with biogas and gasohol. The engine plays a vital role in system efficiency. The engine efficiency with biogas was smaller than with gasohol. At the output power of 80%, the engine efficiency was approximately 14%, while that with gasohol was 18%. The engine efficiency can be improved if the biogas supply were to be sufficient for higher power operation. The SEIG and back-to-back converter had an efficiency greater than 70% and 90% for the output power above 50%. The system efficiency with biogas was approximately 10.7% at the output power of 80%. The system efficiency with biogas is expected to be about 13% at the rated power, estimated from the system efficiency with gasohol.
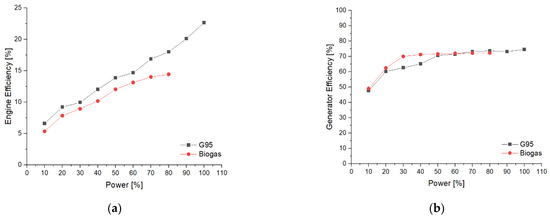
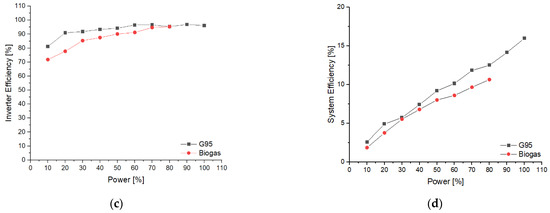
Figure 22.
Efficiency of the prototype generation system: (a) engine, (b) SEIG, (c) back-to-back converter, and (d) system.
Figure 23 compares NOx and CO emissions of the exhaust gas. The NOx emission with biogas is far less than that with gasohol. The NOx emission of the biogas-fed system was less than 50 ppm at 80% of the rated output power, thanks to the purification process using the Fe(OH)3 absorbent granules. Meanwhile, the CO emission of the biogas-fed engine decreased with the output power, with the CO emission being lower than 400 ppm at 80% of the rated output power. This is believed to be due to a complete combustion process. On the other hand, the CO emission with gasohol was 2000 ppm for every output power level, which was the maximum measurable value of the exhaust gas analyzer. Thus, the actual CO emission was greater than 2000 ppm.
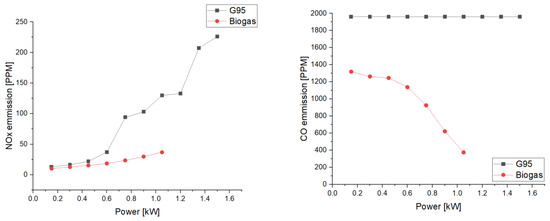
Figure 23.
NOx and CO emissions with the output power.
The higher amount of NOx and CO emissions for the gasohol fuel resulted from incomplete combustion, which agrees with the report in [16] performed on the same GX200 engine. Meanwhile, the brake thermal efficiency of the engine with biogas (CH4 of 80%) in [16] was slightly greater than unleaded gasoline, which contrasts with the results in this study. This is believed to be because the biogas in this study contained CH4 concentration of approximately 70%.
4. Suitability and Economic Analysis
The proposed biogas generation system was technically proven. This section analyzes the possible applications and economic feasibility of the system.
4.1. Suitability of the Proposed Biogas Power Generation System
Let us assume that the prototype system is operated at 1.2 kW for 8 h from 5.30–8.30 am and 5.00–8.00 pm to support the peak load of the local grid. According to the biogas consumption rate of 1.106 m3/h at 1.2 kW in Figure 22, this power production requires biogas input of 8.85 m3 daily. It was reported in [48] that a mature pig excretes manure at a rate of 2 kg/day, which produces 0.26 m3 of biogas. Therefore, a farm should have at least 34 pigs to create a stable biogas supply. In practice, there are 100–700 pigs on the pig farms in Ta Manoa subdistrict. Thus, installing the proposed prototype system on each farm is feasible. It is estimated that the output power can be scaled up to 5 kW with the largest 390 cc engine in this GX series and a 7.5 kW induction machine. The spark–ignition engine selected in this study is widely used in agricultural equipment such as water pumps and sprayers. People in the community are familiar with the engine. Therefore, maintenance of the engine can be carried out locally.
However, this biogas power generation system requires more operation and maintenance compared with photovoltaic power generation. This issue can be a barrier to the wide adaptation of this biogas power generation. Therefore, energy and environmental policies are the key drivers of this biogas power generation scheme for small communities.
4.2. Economic Viability
This analysis covers the biogas power generation system, excluding the anaerobic digester and purification. Biogas is considered a by-product of the waste management system. Table 3 summarizes the capital and annual operating costs and the salvage values of the system components. The operating cost and salvage value were estimated during the installation. Maintenance of the engine is the primary operating cost. In this assumption, the system lifetime is five years. The engine is set to operate for 8 h daily, so the total operating time is 14,600 h. Meanwhile, a biogas-fueled spark–ignition engine can be operated for up to 60,000 h [49]. The life-cycle cost (LCC) for the five years is USD 1046 with an interest rate of 7%. Note that the power converter and SEIG can be overhauled after the project life and reused in the new project.
Table 3.
Break-down of costs of the proposed SEIG-based biogas power generation system.
Let us assume there is a 10% system unavailability due to maintenance and low biogas production. An energy yield per year at 1.2 kW is then given as shown:
1.2 kW × 8 hours × 365 days × 0.9 = 3153 kWh
Each year’s revenue is estimated to be USD 378.36 with a retail electricity price of USD 0.12. Thus, the payback period will be 2.8 years. Therefore, the levelized cost of electricity (LCOE) for the whole project lifetime is 0.07 US$/kWh. Note that the LCOE of 0.07 US$/kWh does not include the biogas cost, a byproduct of the waste management system. The system efficiency must be improved to keep the LCOE viable if purchasing biogas.
A 3 kW photovoltaic power (PV) generation system was selected to compare with the biogas power generation system in this study. In Thailand, a specific annual energy yield of 1400 kWh/kWp/year was estimated using the PVsyst software. The installation cost for a 3 kW PV system is approximately USD 3600, with an annual maintenance cost of 0.5%. The salvage value is estimated to be zero. The project’s life is 25 years. Table 4 compares the economic viability analysis of the biogas power generation with a 3 kW PV system. Although the LCOE of the biogas system is slightly higher than that of the PV system, the main benefit of the biogas in this study is a stable and dispatchable source.
Table 4.
Economic viability of biogas power generation and a 3 kW photovoltaic system.
5. Conclusions
A 196 cc 4-stroke single-cylinder ignition engine was fueled by biogas from pig manure using a gas conversion kit. The engine drove a 2-pole 2.2 kW squirrel-cage inductor motor, operated as a self-excited induction generator. We developed a back-to-back converter for generator control and integration with a 220 V 50 Hz single-phase network. The generator-side converter employed a three-phase PWM rectifier to transfer active power to the grid-side converter and supply reactive power back to the generator for voltage regulation. The grid-side converter adopted an LCL-filtered voltage source inverter with multi-frequency unbalanced synchronous reference frame control, resulting in an injected output current which complied with the IEEE 1547 standard. Meanwhile, the notch filter-based bus voltage control on the generator side effectively mitigated the inter-harmonic components in the generator current caused by the oscillating power from the grid-side converter.
The prototype power generation system was validated with biogas from a swine farm in Ta Manoa subdistrict, Lopburi, Thailand. The system delivered a maximum power of 1.2 kW with a thermal efficiency of 10.7%. If the system is operated at the output power of 1.2 kW for 8 h per day, the prototype is suitable for a farm with at least 34 pigs. The proposed system has a life-cycle cost of USD 1046 for 5 years. The levelized cost of electricity was estimated to be USD 0.07/kWh, with a payback period of 2.76 years. The advantages of the proposed biogas power generation system can be summarized as follows:
- (1)
- Low investment cost;
- (2)
- Spark–ignition engines and induction machines are manufactured in Thailand and are widely available;
- (3)
- The system is easy to operate, and maintenance of the engines can be carried out in the community;
- (4)
- The system is a dispatchable renewable source that can be used for grid support;
- (5)
- Near-sinusoidal generator and output currents impose a low loss on the generator.
Author Contributions
Conceptualization, S.S.; methodology, P.T.; software, P.T.; validation, P.T., T.K. (Tanakorn Kaewchum), T.P. and W.W.; formal analysis, P.T., S.S. and T.S.; investigation, P.T., S.S. and T.S.; resources, S.S. and P.M.; data curation, T.S.; writing—original draft preparation, P.T.; writing—review and editing, S.S.; visualization, S.B.; supervision, S.S.; project administration, P.M. and B.P.; funding acquisition, T.K. (Tanongkiat Kiatsiriroat). All authors have read and agreed to the published version of the manuscript.
Funding
The National Research Council of Thailand supported this study under the Project on Formation of Sustainable Green Communities by Alternative Energy. Panupon Trairat has been sponsored by the Research and Researchers for Industries (RRI) program and Big Solar Co., Ltd. for his doctoral study, grant no. PHD61I0048.
Institutional Review Board Statement
Not applicable.
Informed Consent Statement
Not applicable.
Data Availability Statement
Not applicable.
Acknowledgments
The authors are grateful to Ta Manoa Sub District Administration Organization for facilitating the field tests.
Conflicts of Interest
The authors declare no conflict of interest.
References
- Obaideen, K.; Abdelkareem, M.A.; Wilberforce, T.; Elsaid, K.; Sayed, E.T.; Maghrabie, H.M.; Olabi, A. Biogas role in achievement of the sustainable development goals: Evaluation, Challenges, and Guidelines. J. Taiwan Inst. Chem. Eng. 2022, 131, 104207. [Google Scholar] [CrossRef]
- Czubaszek, R.; Wysocka-Czubaszek, A.; Wichtmann, W.; Banaszuk, P. Specific Methane Yield of Wetland Biomass in Dry and Wet Fermentation Technologies. Energies 2021, 14, 8373. [Google Scholar] [CrossRef]
- Tauber, J.; Ramsbacher, A.; Svardal, K.; Krampe, J. Energetic Potential for Biological Methanation in Anaerobic Sewage Sludge Digesters in Austria. Energies 2021, 14, 6618. [Google Scholar] [CrossRef]
- Seruga, P.; Krzywonos, M.; Boer, E.D.; Niedźwiecki, A.; Urbanowska, A.; Pawlak-Kruczek, H. Anaerobic Digestion as a Component of Circular Bioeconomy—Case Study Approach. Energies 2023, 16, 140. [Google Scholar]
- Ingale, G.U.; Kwon, H.-M.; Jeong, S.; Park, D.; Kim, W.; Bang, B.; Lim, Y.-I.; Kim, S.W.; Kang, Y.-B.; Mun, J.; et al. Assessment of Greenhouse Gas Emissions from Hydrogen Production Processes: Turquoise Hydrogen vs. Steam Methane Reforming. Energies 2022, 15, 8679. [Google Scholar] [CrossRef]
- Athanasiou, C.; Drosakis, C.; Booto, G.K.; Elmasides, C. Economic Feasibility of Power/Heat Cogeneration by Biogas–Solid Oxide Fuel Cell (SOFC) Integrated Systems. Energies 2023, 16, 404. [Google Scholar]
- Chang, C.C.; Do, M.V.; Hsu, W.L.; Liu, B.L.; Chang, C.Y.; Chen, Y.H.; Yuan, M.-H.; Lin, C.-F.; Yu, C.-P.; Chen, Y.H.; et al. A case study on the electricity generation using a micro gas turbine fuelled by biogas from a sewage treatment plant. Energies 2019, 12, 2424. [Google Scholar] [CrossRef]
- Xiao, G.; Yang, T.; Liu, H.; Ni, D.; Ferrari, M.L.; Li, M.; Luo, Z.; Cen, K.; Ni, M. Recuperators for micro gas turbines: A review. Appl. Energy 2017, 197, 83–99. [Google Scholar] [CrossRef]
- Yanmar Holdings. Cogeneration Systems—CP Series (Bio Gas). 2023. Available online: https://www.yanmar.com/en_th/energy/cogeneration_systems/biogas/ (accessed on 16 June 2023).
- Caterpillar. Gas Generator Sets G3520C. 2023. Available online: https://www.cat.com/en_US/products/new/power-systems/electric-power/gas-generator-sets/18483554.html# (accessed on 16 June 2023).
- Verma, S.; Das, L.M.; Kaushik, S.C. Effects of varying composition of biogas on performance and emission characteristics of compression ignition engine using exergy analysis. Energy Convers. Manag. 2017, 138, 346–359. [Google Scholar] [CrossRef]
- Homdoung, N.; Tippayawong, N.; Dussadee, N. Performance and emissions of a modified small engine operated on producer gas. Energy Convers. Manag. 2015, 94, 286–292. [Google Scholar] [CrossRef]
- Yingjian, L.; Qi, Q.; Xiangzhu, H.; Jiezhi, L. Energy balance and efficiency analysis for power generation in internal combustion engine sets using biogas. Sustain. Energy Technol. Assess. 2014, 6, 25–33. [Google Scholar] [CrossRef]
- Capaldi, P.; Daliento, A.; Rizzo, R. An innovative 10 kW microcogenerator suitable for off grid application and fed with syngas or biogas. In Proceedings of the Universities Power Engineering Conference, Cluj-Napoca, Romania, 2–5 September 2014. [Google Scholar]
- Da Costa, R.B.R.; Valle, R.M.; Hernández, J.J.; Malaquias, A.C.T.; Coronado, C.J.; Pujatti, F.J.P. Experimental investigation on the potential of biogas/ethanol dual-fuel spark-ignition engine for power generation: Combustion, performance and pollutant emission analysis. Appl. Energy 2020, 261, 114438. [Google Scholar] [CrossRef]
- Karakitie, E.D.; Aralu, C.E.; Fadare, A.D. Performance charateristics of a conventional spark ignition petrol engine powered by biogas. Fuel Commun. 2022, 10, 100032. [Google Scholar] [CrossRef]
- Bash, M.; Pekaret, S.; Sudhoff, S.; Whitmore, J.; Fratzen, M. A comparison of permanent magnet and wound rotor synchronous machines for portable power generation. In Proceedings of the 2010 Power and Energy Conference at Illinois (PECI), Urbana, IL, USA, 12–13 February 2010. [Google Scholar]
- Wang, L.; Lin, P. Analysis of a Commercial Biogas Generation System Using a Gas Engine–Induction Generator Set. IEEE Trans. Energy Convers. 2009, 24, 230–239. [Google Scholar] [CrossRef]
- Bellini, A.; Franceschini, G.; Lorenzani, E.; Tassoni, C.; Tomaiuolo, M. Field Oriented Control of Self-Excited Induction Generator for Distributed Cogeneration Plants. In Proceedings of the 41st IEEE Industry Applications Conference, Tampa, FL, USA, 8–12 October 2006. [Google Scholar]
- Klíma, J. Stand Alone Bio-Gas Power Plants with Induction Generator and PWM Voltage Source Inverter. IFAC Proc. Vol. 1997, 30, 137–142. [Google Scholar] [CrossRef]
- Singh, G.K. Self-excited induction generator research—A survey. Electr. Power Syst. Res. 2004, 69, 107–114. [Google Scholar] [CrossRef]
- Krishna, V.M.; Sandeep, V.; Murthy, S.; Yadlapati, K. Experimental investigation on performance comparison of self excited induction generator and permanent magnet synchronous generator for small scale renewable energy applications. Renew. Energy 2022, 195, 431–441. [Google Scholar] [CrossRef]
- Calgan, H.; Demirtas, M. A robust LQR-FOPIλDμ controller design for output voltage regulation of stand-alone self-excited induction generator. Electr. Power Syst. Res. 2021, 196, 107175. [Google Scholar] [CrossRef]
- Sowmmiya, U.; Uma, G. Control and maximum power tracking operation of hybrid excited variable speed induction generator. Electr. Power Syst. Res. 2017, 143, 771–781. [Google Scholar]
- Capelo, B.; Pérez-Sánchez, M.; Fernandes, J.F.; Ramos, H.M.; López-Jiménez, P.A.; Branco, P.C. Electrical behaviour of the pump working as turbine in off grid operation. Appl. Energy 2017, 208, 302–311. [Google Scholar] [CrossRef]
- Chilipi, R.R.; Singh, B.; Murthy, S.S. Performance of a Self-Excited Induction Generator With DSTATCOM-DTC Drive-Based Voltage and Frequency Controller. Energy Conversion. IEEE Trans. 2014, 29, 545–557. [Google Scholar]
- Marra, E.G.; Pomilio, J.A. Induction-generator-based system providing regulated voltage with constant frequency. IEEE Trans. Ind. Electron. 2000, 47, 908–914. [Google Scholar] [CrossRef]
- Scherer, L.G.; Tischer, C.B.; de Camargo, R.F. Power rating reduction of distribution static synchronous compensator for voltage and frequency regulation of stand-alone self-excited induction generator. Electr. Power Syst. Res. 2017, 149, 198–209. [Google Scholar] [CrossRef]
- Chauhan, P.J.; Chatterjee, J.K.; Bhere, H.; Perumal, B.V.; Sarkar, D. Synchronized Operation of DSP-Based Generalized Impedance Controller With Variable-Speed Isolated SEIG for Novel Voltage and Frequency Control. IEEE Trans. Ind. Appl. 2015, 51, 1845–1854. [Google Scholar] [CrossRef]
- Ayodele, T.R.; Ogunjuyigbe, A.S.O.; Adetokun, B.B. Optimal capacitance selection for a wind-driven self-excited reluctance generator under varying wind speed and load conditions. Appl. Energy 2017, 190, 339–353. [Google Scholar] [CrossRef]
- Thomsen, B.; Guerrero, J.M.; Thøgersen, P.B. Faroe islands wind-powered space heating microgrid using self-excited 220-kW induction generator. IEEE Trans. Sustain. Energy 2014, 5, 1361–1366. [Google Scholar] [CrossRef]
- Ion, C.P.; Marinescu, C. Three-phase induction generators for single-phase power generation: An overview. Renew. Sustain. Energy Rev. 2013, 22, 73–80. [Google Scholar] [CrossRef]
- Honda. GX120/160/200. 2023. Available online: https://engines.honda.com/models/model-detail/mid-gx#Features (accessed on 16 June 2023).
- Senthil Kumar, S.; Kumaresan, N.; Subbiah, M. Analysis and control of capacitor-excited induction generators connected to a micro-grid through power electronic converters. Generation, Transmission & Distribution. IET 2015, 9, 911–920. [Google Scholar]
- Singh, B.; Niwas, R. Performance of synchronous reluctance generator for DG set based standalone supply system. Electr. Power Syst. Res. 2016, 133, 93–103. [Google Scholar] [CrossRef]
- Braga, A.; Rezek, A.; Silva, V.; Viana, A.; Bortoni, E.; Sanchez, W.; Ribeiro, P. Isolated induction generator in a rural Brazilian area: Field performance tests. Renew. Energy 2015, 83, 1352–1361. [Google Scholar] [CrossRef]
- Somkun, S. High performance current control of single-phase grid-connected converter with harmonic mitigation, power extraction and frequency adaptation capabilities. IET Power Electron. 2021, 14, 352–372. [Google Scholar] [CrossRef]
- Monfared, M.; Golestan, S.; Guerrero, J.M. Analysis, design, and experimental verification of a synchronous reference frame voltage control for single-phase inverters. IEEE Trans. Ind. Electron. 2014, 61, 258–269. [Google Scholar] [CrossRef]
- Somkun, S. Unbalanced synchronous reference frame control of singe-phase stand-alone inverter. Int. J. Electr. Power Energy Syst. 2019, 107, 332–343. [Google Scholar] [CrossRef]
- Somkun, S.; Chunkag, V. Unified unbalanced synchronous reference frame current control for single-phase grid-connected voltage-source converters. IEEE Trans. Ind. Electron. 2016, 63, 5425–5436. [Google Scholar] [CrossRef]
- Golestan, S.; Monfared, M.; Freijedo, F.D.; Guerrero, J.M. Dynamics assessment of advanced single-phase PLL structures. IEEE Trans. Ind. Electron. 2013, 60, 2167–2177. [Google Scholar] [CrossRef]
- Wang, J.; Yan, J.D.; Jiang, L.; Zou, J. Delay-dependent stability of single-loop controlled grid-connected inverters with LCL filters. IEEE Trans. Power Electron. 2016, 31, 743–757. [Google Scholar] [CrossRef]
- Holmes, D.G.; Lipo, T.A.; McGrath, B.P.; Kong, W.Y. Optimized design of stationary frame three phase AC current regulators. IEEE Trans. Power Electron. 2009, 24, 2417–2426. [Google Scholar] [CrossRef]
- Sangwongwanich, A.; Abdelhakim, A.; Yang, Y.; Zhou, K. Chapter 6—Control of Single-Phase and Three-Phase DC/AC Converters. In Control of Power Electronic Converters and Systems; Blaabjerg, F., Ed.; Academic Press: Cambridge, MA, USA, 2018; pp. 153–173. [Google Scholar]
- Sedpho, S. Community Biogas from Swine Farms Phase 3 at Thamanao Sub-District, Chaibadan District, Lopburi Province, Thailand; Thailand Voluntary Emission Reduction Program; Tha Manao Subdistrict Administrative Organization: Lopburi, Thailand, 2020. [Google Scholar]
- Pinate, W.; Dangphonthong, D.; Sirirach, S.; Sukkhon, S. Removal of hydrogen sulfide (H2S) from biogas for the community in the province of Maha Sarakham. J. Phys. Conf. Ser. 2017, 901, 012049. [Google Scholar] [CrossRef]
- 1547-2018; IEEE Standard for Interconnection and Interoperability of Distributed Energy Resources with Associated Electric Power Systems Interfaces. Revision of IEEE Std 1547–2003; IEEE Standards Coordinating Committee: New York, NY, USA, 2018; pp. 1–138.
- Khotmanee, S.; Pinsopon, U. A Study on Biogas Production Potential in Thailand 2019. In Proceedings of the 7th International Conference on Engineering, Applied Sciences and Technology (ICEAST), Bangkok, Thailand, 1–3 April 2021. [Google Scholar]
- Kaparaju, P.; Rintala, J. 17–Generation of heat and power from biogas for stationary applications: Boilers, gas engines and turbines, combined heat and power (CHP) plants and fuel cells. In The Biogas Handbook; Wellinger, A., Murphy, J., Baxter, D., Eds.; Woodhead Publishing: Sawston, UK, 2013; pp. 404–427. [Google Scholar]


Disclaimer/Publisher’s Note: The statements, opinions and data contained in all publications are solely those of the individual author(s) and contributor(s) and not of MDPI and/or the editor(s). MDPI and/or the editor(s) disclaim responsibility for any injury to people or property resulting from any ideas, methods, instructions or products referred to in the content. |
© 2023 by the authors. Licensee MDPI, Basel, Switzerland. This article is an open access article distributed under the terms and conditions of the Creative Commons Attribution (CC BY) license (https://creativecommons.org/licenses/by/4.0/).